

BUFFALO CITY METROPOLITAN BUFFALO CITY METROPOLITAN MUNICIPALITY – URBAN SETTLEMENT MUNICIPALITY – URBAN SETTLEMENT
(USDG) PERFORMANCE REPORT(USDG) PERFORMANCE REPORT
19 SEPTEMBER 2012 - CAPE TOWN -

PRESENTATION OUTLINE PRESENTATION OUTLINE
Part 5 : Conclusions

STRATEGIC OVERVIEWSTRATEGIC OVERVIEWPART 1
3

STRATEGIC OVERVIEWSTRATEGIC OVERVIEW
4
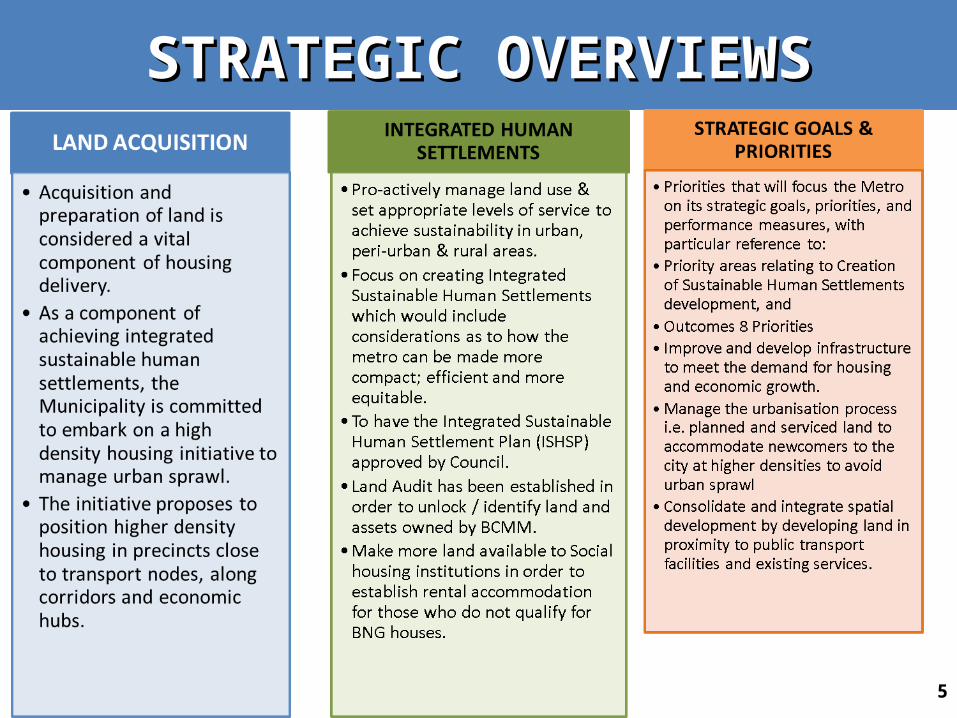
STRATEGIC OVERVIEWSSTRATEGIC OVERVIEWS
5

BCMM Future Spatial Development BCMM Future Spatial Development
6

OVERVIEW OF THE HOUSING NEEDOVERVIEW OF THE HOUSING NEED
7

BACKLOGSBACKLOGS
SERVICEBACKLOG
(HOUSEHOLDS)BACKLOGS
(BULK)
DEFERRED MAINTENANCE
WATER 4000 @ 7000 = R28,000,000R1,3 billion over
20 yearsR447 million
SANITATION60 000 @ 11 000 = R66,000,000
R2,1 billion over 20 years
R550 million
ELECTRICITY
None (informal dwellers linked to housing delivery) estimated at R1 billion) ESKOM = 2500 hh
R450 million R690 million
ROADS AND STORMWATER
Rural internal streets to be defined by current study. Upgrades of gravel roads: R1,2 Billion
Provincial, National and District roads
R136 million(re-paved)R88 million (re-gravel)
HOUSING 121 000R2,6 billion over
20 yearsR 2,9 billion over
20 years
8

National Outcome 8 . . .National Outcome 8 . . .
9
• Buffalo City 5 year Housing Delivery Plan will fit into the targets as identified by the PDoHS.
• The bulk of informal settlements in Buffalo City are identified in the Mdantsane area and in the central East London / Beacon Bay / Gonubie area
• The programmed development of infrastructure capacity and the roll-out of housing development in the DVRI priority areas (including Reeston), Mdantsane, and in the identified Restructuring Zones will enable BCMM to address the demand manifest in informal settlements.
• Providing a range of accommodation types in different localities that are all favourably located either in relation to areas of opportunity in Central East London or in relation to main public transportation routes in terms of the BRT system
• Support from National Upgrading Support Programme (NUSP) for informal settlement upgrading in BCMM with target of ± 20 settlements (i.e. ± 10 000 households) over 3 year period

OUTCOME 8: SLUM UPGRADINGOUTCOME 8: SLUM UPGRADINGUSDG Planned USDG Delivery
Sites Funds Allocated R SitesExpenditure
RExpenditure
%
2011/12 Serviced Sites = 218 P3 = R42,156,161 Serviced
Sites = 0P3 = R9,923,295
24%
2012/13 Serviced Sites = 1850 P3 = R43,818,600 Serviced
Sites = P3 = R0 0%
2013/14 Serviced Sites = 2220 P3 = R59,704,764 Serviced
Sites = P3 = R0
2014/15 Serviced Sites = 1500 P3 = R66 7,608 Serviced
Sites = P3 = R0
TOTAL Serviced sites = 5788
P3 = R168,822,352
Serviced sites =
P3 = R9,923,295
10

OUTCOME 8: BASIC SERVICES OUTCOME 8: BASIC SERVICES USDG Planned USDG Delivery
Sites Funds Allocated R SitesExpenditure
RExpenditure
%
2011/12 Serviced Sites = 218
P3 = R42,156,161 Serviced Sites = 0 P3 = R9,923,295 24%
2012/13 Serviced Sites = 1850 P3 = R43,818,600 Serviced
Sites = P3 = R0 0%
2013/14 Serviced Sites = 2220 P3 = R59,704,764 Serviced
Sites = P3 = R0
2014/15 Serviced Sites = 1500 P3 = R66 7,608 Serviced
Sites = P3 = R0
TOTAL Serviced sites = 5788 P3 = R168,822,352 Serviced
sites = P3 = R9,923,295
11

OUTCOME 8: BASIC SERVICESOUTCOME 8: BASIC SERVICESSANITATIONSANITATION
USDG Planned USDG Delivery
Number of new sanitation service
points (toilets) installed for informal
settlements
Funds Allocated
R
Number of new sanitation service
points (toilets) installed for
informal settlements
ExpenditureR
Expenditure%
2011/12 5500 R36m 3722 R16,710,000m 46%
2012/13 1850 R37,5m -
2013/14 2300 R37,854m -
2014/15 2000 R27,854m -
TOTAL11650 R139,208m
12

OUTCOME 8: BASIC SERVICESOUTCOME 8: BASIC SERVICESWATERWATER
USDG Planned USDG Delivery
Number of new households connected to basic water service
Funds Allocated
R
Number of new households
connected to basic water service
Expenditure
R
Expenditure
%
2011/12 1 174 R16million 1 628 R10,870,042 68%
2012/13 1 089 R18million -
2013/14 1 400 R21,276,293 -
2014/15 1 500 R18million -
TOTAL 5 163 R73,276,293
13

(Cities Network, 2011)14

LAND OWNERSHIP IN BCMM
15

Summary of Demographic InformationSummary of Demographic Information
16
USDG 2011 / 2012 USDG 2011 / 2012 FINANCIAL PERFORMANCE FINANCIAL PERFORMANCE
PART 3
17

OVERALL FINANCIAL PERFORMANCE OVERALL FINANCIAL PERFORMANCE
18

2011 / 2012 FINANCIAL PERFORMANCE2011 / 2012 FINANCIAL PERFORMANCE
• BCMM has spent 36.9% of the total 2011/12 USDG allocation of R423 million.
• The budget was adjusted downwards by R48.5 million due to projected under spending
The internal review done, attributed the poor expenditure performance to the following factors:
• Poor Planning as informal settlement upgrade projects were budgeted for prior approval of Environmental Impact Assessment (EIA),
• Multi-year projects that were budgeted for in one financial year.
19
2011 / 2012 FINANCIAL PERFORMANCE2011 / 2012 FINANCIAL PERFORMANCE
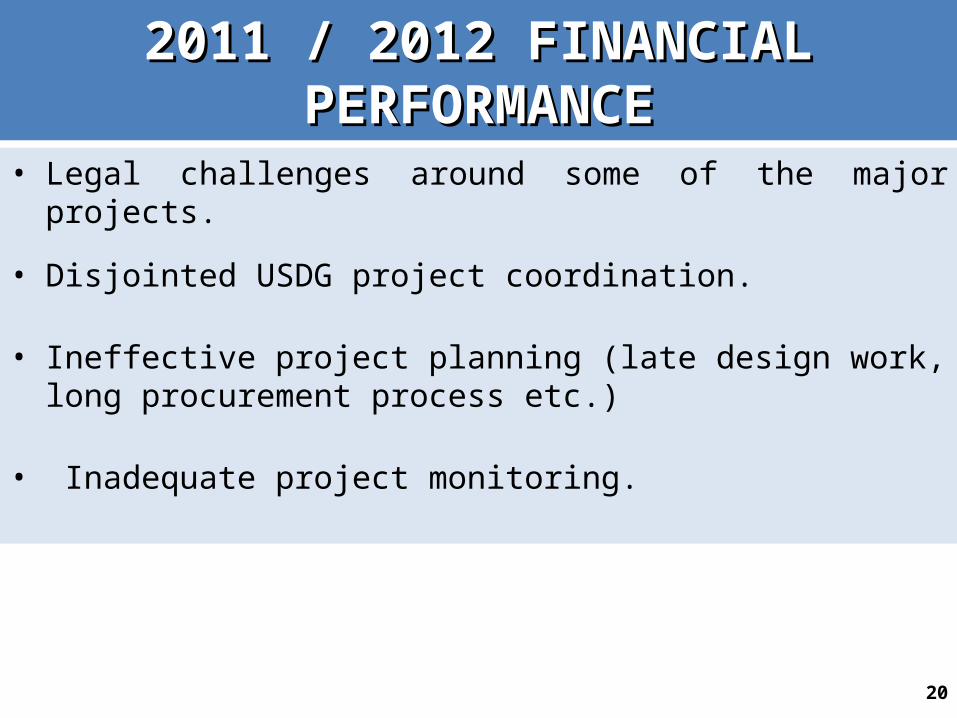
• Legal challenges around some of the major projects.
• Disjointed USDG project coordination.
• Ineffective project planning (late design work, long procurement process etc.)
• Inadequate project monitoring.
20

ALLOCATED ALLOCATED FUNDINGFUNDING
REVISED REVISED BUDGETBUDGET
ACTUAL ACTUAL EXPEND-ITUREEXPEND-ITURE
COMMIT-COMMIT-MENTSMENTS
FUNDING TO BE FUNDING TO BE REDIRECTED REDIRECTED FOR LAND FOR LAND
ACQUISITIONACQUISITIONInformal Settlements Upgrade 82 026 641 52 205 317 14 502 589 18 413 798 49 110 255
Bulk Infrastructure and Internal Services 292 375 700 280 882 489 122 055 813 148 027 276 22 292 612
Transport Facilities Upgrading 15 000 000 13 200 000 4 750 970 8 431 567 1 817 463
Economic Infrastructure 8 000 000 9 000 000 6 664 033 0 1 335 967
Health and Public Safety 9 227 453 8 327 453 3 018 106 3 209 347 3 000 000
Public Amenities 16 816 303 11 316 303 5 140 141 3 584 142 8 092 020
TOTAL USDG 423 446 097 374 931 562 156 131 652 181 666 129 85 648 317
2011 / 2012 FINANCIAL PERFORMANCE2011 / 2012 FINANCIAL PERFORMANCE
21

USDG 2011 / 2012 USDG 2011 / 2012 NON- FINANCIAL PERFORMANCE NON- FINANCIAL PERFORMANCE
PART 4
22

• 2,400 rural toilets provided • 25 km of roads surfaced and 15km in progress at end of financial year • 50 km of roads re-gravelled and 20 km in progress at end of financial year• Bulk water and sanitation infrastructure projects committed, awards made in
May/June 2012 • Rural households in Ncera provided with new and upgraded infrastructure to
ensure sustainable water supply • Upgrade of Mzonyana Bulk Water Treatment Works • Upgraded Bulk Sewer capacity for informal settlements in progress (Bufferstrip
Corridor)• BCMM achieved 4 Blue Drop Awards for its plants• Awards have been made for all infrastructure projects except for Reeston Bulk
Sewer Project of R23 million which is being re-advertised.
BULKBULK INFRASTRUCTUREINFRASTRUCTURE
23

INFORMAL SETTLEMENT UPGRADEINFORMAL SETTLEMENT UPGRADE
• 833 Housing units constructed in the following areas: Potsdam Unit
P, Dimbaza Phase 2, Ilitha South Phase 1, Tyutyu Phase 1, Mekeni Rd
(DVRI Pilot Project)
• Professional Teams have been appointed for designs on the
following 18 projects in April 2012:
Cluster 1 = Chris Hani phase 2, Ilinge, Winnie Mandela, Francis Mei,
Mahlangu Village, Deluxollo Village, Sisulu Village
Cluster 2 = Masibumbane, Masibulele, Velwano, Gwentshe Village,
Mathemba Vuso24

INFORMAL SETTLEMENT UPGRADEINFORMAL SETTLEMENT UPGRADE
• Cluster 3 = Fynbos 1 – 2, Ndancama, Sunny South, Reeston 3 Stage 3,
Ilitha Wooden Houses,
• Contractors on site for the following 7 projects: Reeston 3 Stage 2,
Manyano and Thembelihle, Second Creek (Legal Dispute), DVRI Block
Yard (Legal Dispute), DVRI Haven Hills, Potsdam Unit P (Non
performance of main contractor), Ilitha South phase 1.
• Currently 1670 sites are at excavation level; 1377 at roof level and
1327 sites are practically completed but not handed over as yet. This
should be done in the 2012 / 2013 Financial Year.
• Committed funding of R18,7 million. 25

TRANSPORT PLANNING AND OPERATIONSTRANSPORT PLANNING AND OPERATIONS
26

HUMAN SETTLEMENTSHUMAN SETTLEMENTS
27

TRANSPORT PLANNING AND OPERATIONSTRANSPORT PLANNING AND OPERATIONS
28

UTILIZATION OF ROLL-OVER FUNDINGUTILIZATION OF ROLL-OVER FUNDING
29

Due Diligence on Programme Due Diligence on Programme Planning for FuturePlanning for Future
30
2011/2012 USDG CAPITAL EXPENDITURE PER
PROJECT :30 JUNE 2012
31

PROJECT DESCRIPTION APPROVED BUDGETBUDGET
ADJUSTMENT YTD EXP
VARIANCE AGAINST
APPROVED BUDGET
Mdantsane Zone 18 CC Phase 2-P3 11 209 000 0 0 11 209 000
Manyano & Thembelihle Phase 2-P3 19 055 300 19 055 300 7 786 725 11 268 575
Second Creek (Turn Key)-P3 5 940 770 13 940 770 177 428 5 763 342
Masibambane-P3 1 748 604 250 000 24 561 1 724 043
Masibulele-P3 1 793 440 250 000 101 072 1 692 368
Velwano 2 241 800 450 000 24 561 2 217 239
Chris Hani Park Phase 3-P3 2 353 890 200 000 0 2 353 890
2011/2012 USDG CAPITAL EXPENDITURE: 30 JUNE 2012
32

PROJECT DESCRIPTION APPROVED BUDGETBUDGET
ADJUSTMENT YTD EXP
VARIANCE AGAINST
APPROVED BUDGET
Ilinge -P 3 2 241 800 600 000 240 000 2 001 800
Gwentshe Village- P3 560 450 50 000 24 561 535 889
Fynbos Informal 1-P3 2 398 726 500 000 77 000 2 321 726
Fynbos Informal 2-P3 2 241 800 500 000 0 2 241 800
Ndancama-P3 2 241 800 0 0 2 241 800
Mathemba Vuso-P3 1 681 350 300 000 24 561 1 656 789
Deluxolo Village-P3 1 972 784 200 000 0 1 972 784
2011/2012 USDG CAPITAL EXPENDITURE: 30 JUNE 2012
33

PROJECT DESCRIPTION APPROVED BUDGETBUDGET
ADJUSTMENT YTD EXP
VARIANCE AGAINST
APPROVED BUDGET
Francis Mei-P3 762 212 100 091 0 762 212
Mahlangu Village-P3 2 040 038 200 000 0 2 040 038
Sisulu Village-P3 1 726 186 300 000 0 1 726 186
Winnie Mandela-P3 1 681 350 400 000 0 1 681 350
Dacawa-P3 1 681 350 400 000 0 1 681 350
Sunny South-P3 2 241 800 600 000 82 825 2 158 975
Block Yard 0 2500000 0 0
Potsdam Unit p : Stage 2 P3 0 1 360 000 1 360 000 -1 360 000
2011/2012 USDG CAPITAL EXPENDITURE: 30 JUNE 2012
34

PROJECT DESCRIPTION APPROVED BUDGETBUDGET
ADJUSTMENT YTD EXP
VARIANCE AGAINST
APPROVED BUDGET
West Bank Restitution 15 000 000 15 000 000 10 147 036 4 852 964
Rural Roads Upgrade 5 000 000 5 000 000 1 849 678 3 150 322
Upgrading and Rehabilitation of BCMM Roads - Duncan Village 0 1 000 000 978 711 -978 711
Upgrading and Rehabilitation of BCMM Roads - Zwelitsha 0 1 250 000 1 285 526 -1 285 526Upgrading and Rehabilitation of BCMM Roads - Phakamisa 0 1250000 0 0
Upgrading and Rehabilitation of BCMM Roads - Dimbaza 0 1 000 000 579 363 -579 363
2011/2012 USDG CAPITAL EXPENDITURE: 30 JUNE 2012
35

PROJECT DESCRIPTION APPROVED BUDGETBUDGET
ADJUSTMENT YTD EXP
VARIANCE AGAINST
APPROVED BUDGET
Upgrading and Rehabilitation of BCMM Roads - Scenery park / Reeston 0 1 000 000 117 733 -117 733
Upgrading and Rehabilitation of BCMM Roads - Nonkcampa 0 600 000 588 377 -588 377
Upgrading and Rehabilitation of BCMM Roads - Upper Mngqesha 0 600 000 279 167 -279 167
Upgrading and Rehabilitation of BCMM Roads - Tsholomnqa 0 600 000 98 808 -98 808
2011/2012 USDG CAPITAL EXPENDITURE: 30 JUNE 2012
36

PROJECT DESCRIPTION APPROVED BUDGETBUDGET
ADJUSTMENT YTD EXP
VARIANCE AGAINST
APPROVED BUDGET
Mdantsane Roads 42 375 700 42 375 700 19 780 117 22 595 583
Rehabilitation of Rural Roads Upgrade 5 000 000 5 000 000 2 212 215 2 787 785
Nord Avenue Pump station 8 000 000 4 000 000 630 288 7 369 712
Quinera Treatment Works 50 000 000 39 000 000 280 572 49 719 428
Waste Water Treatment Capacity (Zwelitsha) 15 000 000 15 000 000 12 405 399 2 594 601
Reeston Phase 3 Bulk Services Sewer 25 000 000 23 500 000 1 454 434 23 545 566
Bufferstrip Sanitation - Mdantsane 15 000 000 15 000 000 14 437 534 562 466
2011/2012 USDG CAPITAL EXPENDITURE: 30 JUNE 2012
37

PROJECT DESCRIPTION APPROVED
BUDGETBUDGET
ADJUSTMENT YTD EXP
VARIANCE AGAINST
APPROVED BUDGET
Mdantsane Sewers - Refurbishment 5 000 000 5 000 000 4 834 581 165 419
Diversion of Amalinda and Wilsonia effluent to Reeston 50 000 000 22 000 000 6 797 723 43 202 277
Augmentation of Water Treatment Capacity - Umzonyana/Raising Upper weir 5 000 000 5 000 000 4 984 423 15 577
Inland Rural Sanitation (Dimbaza Villages,Ngxwalane and Kwalini) 36 000 000 36 000 000 16 711 573 19 288 427
Eastern Beach Sewers 0 2 000 000 1 911 234 -1 911 234
Chemical toilets 0 2 000 000 2 000 000 -2 000 000
Sludge handling facility 0 2 800 000 1 107 165 -1 107 165
2011/2012 USDG CAPITAL EXPENDITURE: 30 JUNE 2012
38

PROJECT DESCRIPTION APPROVED
BUDGETBUDGET
ADJUSTMENT YTD EXPVARIANCE AGAINST APPROVED BUDGET
Winterstrand Water Supply 0 2 000 000 1 884 695 -1 884 695Bulk Water Supply Newlands and other areas 1 000 000 1 000 000 805 262 194 738
Augmentation of Water Treatment Capacity - Umzonyana/Raising Upper weir 0 2 000 000 1 192 124 -1 192 124
Ward 33 Bulk Water Supply Scheme 7 000 000 7 000 000 2 289 047 4 710 953
Bulk Water Supply Coastal Areas 8 000 000 8 000 000 7 775 733 224 267
Amahleke 0 1 000 000 0 0
Relocation of Miblocks - Mdantsane 0 3 000 000 0 0
2011/2012 USDG CAPITAL EXPENDITURE: 30 JUNE 2012
39

PROJECT DESCRIPTION APPROVED
BUDGETBUDGET
ADJUSTMENT YTD EXP
VARIANCE AGAINST
APPROVED BUDGET
Coastal & Midlands Infrastructure 0 1 500 000 408 734 -408 734
Rehabilitation of underground stormwater - Storm water Management System 0 1 100 000 729 474 -729 474
Rehabilitation of underground stormwater - Amalinda forest 0 1 000 000 318 749 -318 749
Rehabilitation of underground stormwater - Duncan village 0 1 000 000 243 808 -243 808
Rehabilitation of underground stormwater - West Bank 0 1 000 000 936 530 -936 530
2011/2012 USDG CAPITAL EXPENDITURE: 30 JUNE 2012
40

PROJECT DESCRIPTION APPROVED
BUDGETBUDGET
ADJUSTMENT YTD EXPVARIANCE AGAINST APPROVED BUDGET
BCM Urban Agriculture Infrastructure Development 3 000 000 3 000 000 3 000 000 0
Taxi Ranks 5 000 000 3 200 000 843 750 4 156 250
Gonubie Main Road 10 000 000 10 000 000 3 907 220 6 092 780
Economic Infrastructure 5 000 000 6 000 000 3 664 033 1 335 967
Fire Station - KWT 6 227 453 6 227 453 3 018 106 3 209 347
Clinics 3 000 000 2 100 000 0 3 000 000
Development of Community Parks(Mdantsane, Potsdam, Reeston) 1 016 303 1 016 303 543 405 472 898
2011/2012 USDG CAPITAL EXPENDITURE: 30 JUNE 2012
41

PROJECT DESCRIPTION APPROVED BUDGETBUDGET
ADJUSTMENT YTD EXP
VARIANCE AGAINST
APPROVED BUDGET
Development of 3 New Cemetries(Inland, Midland and Coastal) 3 000 000 3 000 000 557 180 2 442 820
Scenery Park Community Hall 2 000 000 2 000 000 1 934 503 65 497
Solid waste management 8 800 000 2 800 000 1 735 195 7 064 805
Planning of designs of Third Cell 0 500 000 88 335 -88 335
Sport Facilities 2 000 000 2 000 000 281 524 1 718 476
TOTAL 409 233 906 364 882 406 151 552 358 257 681 548
2011/2012 USDG CAPITAL EXPENDITURE: 30 JUNE 2012
42

ALIGNMENT WITH HSDG
•Alignment of 2012/13 to 2014/15 targets BNG Units is funded from HSDG (R126,5 million) and the internal services (R46,6 million)and other bulk infrastructure upgrade is funded from USDG (R164,6 million).
43

2012 / 2013 USDG ALLOCATIONSERVICES 2012/2013 CAPITAL
BUDGET
Water Infrastructure 28 000 000
Waste Water Infrastructure 182 608 250
Roads and Storm water 123 000 000
Informal Settlement Upgrade (Internal Services) 46 561 572
Transport Planning & Operations 62 549 200
Waste Management 3 000 000
Public Amenities 20 000 000
Public Safety 9 500 000
Support Services 4 000 000
Economic Infrastructure 20 254 978
TOTAL 499 474 00044

OUTPUT IMMEDIATE RESULTS INDICATORS TARGET2012/13
TARGET2013/14
TARGET2014/15
1. Roads Upgraded
Kilometres of roads built/constructed (Surfaced /Gravel)
50 50 50
Kilometres of gravel roads tarred 20 20 25
Kilometres of roads resurfaced (maintained)
600 600 600
2. Housing programmes
Number of households upgraded (formalised) living in informal settlements with basic services such as water, sanitation
1,198 = Households
1,636 = Service sites (USDG)
214 = Service sites (HSDG)
1,783 = Households
1,910 = Service sites
(USDG)
310 = Service sites (HSDG)
1,771 = Households
1,200 = Service sites (USDG)
300 = Service sites (HSDG)
BCMM OUTPUTS 2012/2013 AND OUTER YEARS
45

OUTPUT IMMEDIATE RESULTS INDICATORS TARGET2012/13
TARGET2013/14
TARGET2014/15
2. Housing programmes
Number of stands serviced 1,636 (USDG) 214 = Service sites (HSDG)
1,910 (USDG)310 = Service sites (HSDG)
1,200 (USDG)300 = Service sites (HSDG)
Number of households allocated affordable social housing units
497
961
830
BCMM OUTPUTS 2012/2013 AND OUTER YEARS
46

BCMM OUTPUTS 2012/2013 AND OUTER YEARS
OUTPUT IMMEDIATE RESULTS INDICATORS TARGET2012/13
TARGET2013/14
TARGET2014/15
3. Basic services Water
Number of new households connected to basic water service
1089 1400 1500
Number of new water service points (taps) installed for informal settlement dwellers
1,198 1,783 1,771
Number of new households (RDP)provided with water connections
1483 1011 1900
4. Sewerage
Number of new sanitation service points (toilets) installed for informal settlement dwellers
405 555 705
Number of new households (RDP) provided with sewer connections
1483 1011 1900
5. Electricity
Number of high mast lights installed in informal settlements
0 10 10
Number of new households (RDP) provided with electricity connections
1483 1011 1900
47

OUTPUT IMMEDIATE RESULTS INDICATORS TARGET2012/13
TARGET2013/14
TARGET2014/15
6. Refuse removal
Number of new households with access to refuse removal.
1483 1011 1900
Number of informal settlement dwellings with access to refuse removal
1483 1011 1900
7. Land development programme: Land availability, purchasing, acquisition, planning, servicing &titling
No of hectares of land portions identified 30 0 0
Number of title deeds transferred to eligible households
1000 1500 2000
BCMM OUTPUTS 2012/2013 AND OUTER YEARS
48

OUTPUT IMMEDIATE RESULTS INDICATORS TARGET2012/13
TARGET2013/14
TARGET2014/15
8. Job creation
Number of jobs created using Expanded Public Works guidelines
1524 1621 1700
9. Social Facilities
Number of community halls planned/ under construction/developed Collective total
20 19 20
Number of parks and gardens planned/ under construction/developed. Collective total
20 19 20
Number of sports fields and stadia planned/ under construction/developed. Collective total
20 19 20
Number of community swimming pools planned/ under construction/developed
2 0 0
BCMM OUTPUTS 2012/2013 AND OUTER YEARS
49

INDICATORS FOR THE PERFORMANCE MATRIX
OUTPUT IMMEDIATE RESULTS INDICATORS TARGET2012/13
TARGET2013/14
TARGET2014/15
9. Social Facilities Number of bus terminals or taxi ranks planned/ under construction/developed
3 9 9
Number of Fire safety and emergency facilities planned/ under construction/developed
1 1 1
Number of cemeteries planned/ under construction/developed
3 0 0
50

CONCLUSIONIn addressing the challenges raised in this presentation, the city is undertaking to implement the following recovery actions to
improve its ability and capacity to spend the Grant funding:
•Focus on creating Integrated Sustainable Human Settlements which would include considerations as to how the metro can be made more compact; efficient and more equitable by becoming systems based institution. •In the execution of the BCMM’s capital investment programme in the next five years, focus will be placed on the maintenance, land acquisition, upgrade and improvement of the infrastructural network of the Metro.
51

CONCLUSION . . .
• BCMM requires support from various key national and provincial departments to enable the successful development of sustainable human settlements for its future development trajectory.
• A multi year budgeting approach has been mainstreamed in our project planning for the current financial year.
52

•As part of a turn around, the Metro has resolved to
establish Enterprise Project Management Office
(EPMO) to drive, unlock high impact projects,
coordinate, support, monitor, evaluate and report on
the Grant Funded Projects.
CONCLUSION . . .
53

END
THANK YOU…


