
A2 Micro: Business Objec2ves
A short revision webinar covering profit maximisa5on, changes in costs and revenues and pricing with different business objec5ves

Revising A2 Economics (Micro)
Build lots of real world examples into your notes Common industries used include food retailers, u2li2es, banks, airlines, technology sectors
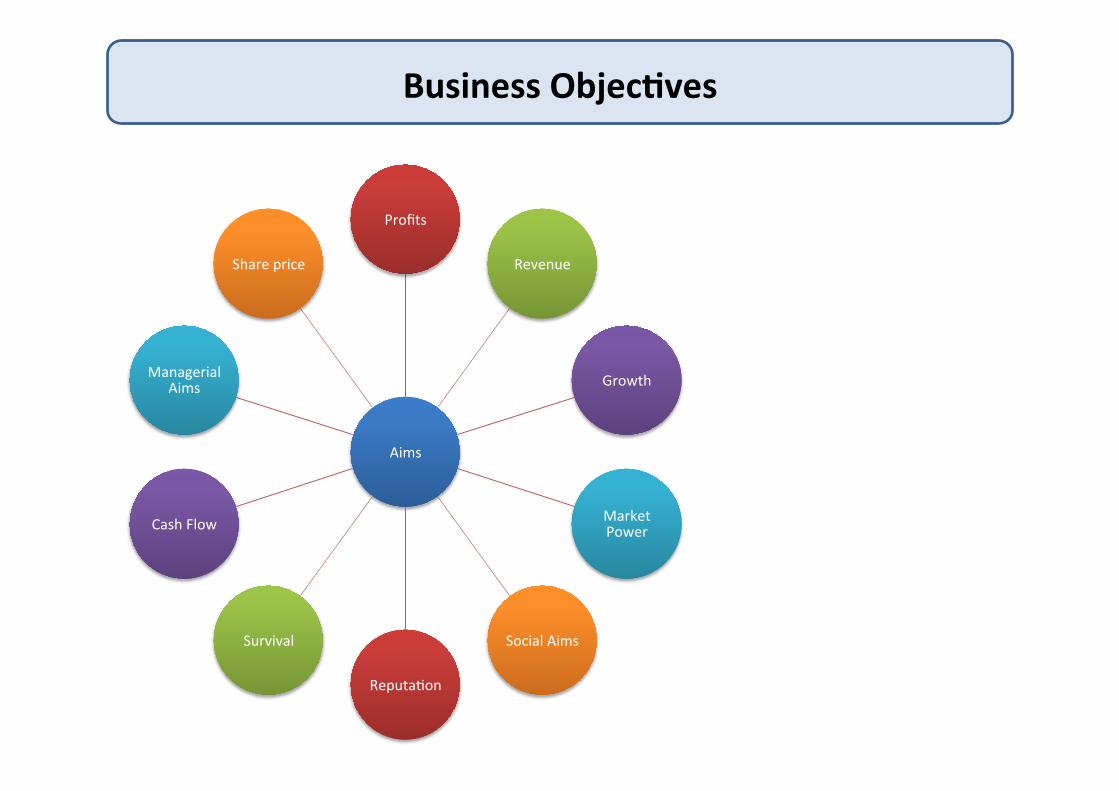
Business Objec2ves
Aims
Profits
Revenue
Growth
Market Power
Social Aims
Reputa5on
Survival
Cash Flow
Managerial Aims
Share price

Profits and Profit Maximisa2on

The Importance of Profit
1. Finance for investment: Retained profits are source of finance for companies undertaking investment
2. Market entry: Rising profits send signals to other producers within a market
3. Demand for factor resources: Resources flow where the expected rate of return or profit is highest
4. Signals about the health of the economy: Rising profits might reflect improvements in supply-‐side performance. Strong profits are also the result of high levels of demand.
Profit is an important objec5ve of most firms
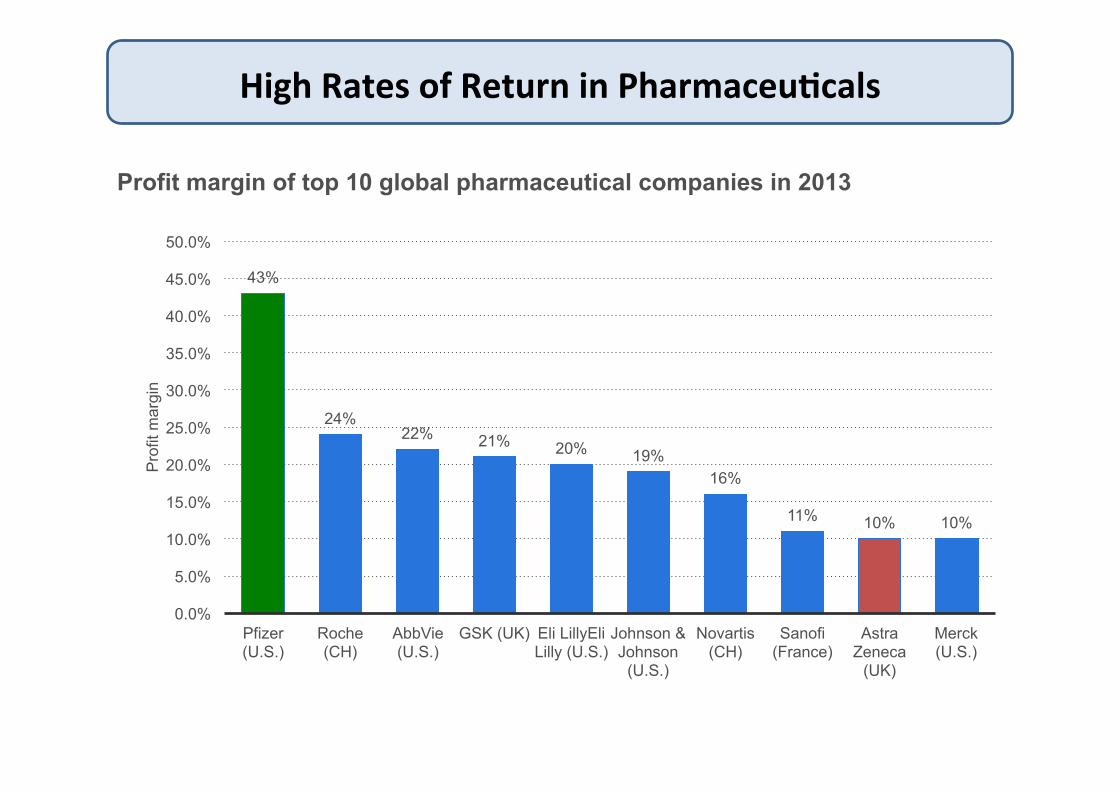
High Rates of Return in Pharmaceu2cals
Profit margin of top 10 global pharmaceutical companies in 2013
43%
24% 22% 21% 20% 19%
16%
11% 10% 10%
0.0%
5.0%
10.0%
15.0%
20.0%
25.0%
30.0%
35.0%
40.0%
45.0%
50.0%
Pfizer (U.S.)
Roche (CH)
AbbVie (U.S.)
GSK (UK) Eli LillyEli Lilly (U.S.)
Johnson & Johnson
(U.S.)
Novartis (CH)
Sanofi (France)
Astra Zeneca
(UK)
Merck (U.S.)
Pro
fit m
argi
n

Research Spending in Pharmaceu2cals
Top global pharmaceutical companies by prescription sales and R&D spending in 2013 (in billion U.S. dollars)
9.36
6.25
8.29
6.12
7.12
5.04
5.81
4.27
5.32
2.83
3.94
1.42
2.71
2.09
46.02
45.01
39.14
37.7
37.52
33.06
26.48
24.52
20.12
18.79
18.19
17.56
15.59
14.89
0 5 10 15 20 25 30 35 40 45 50
Novar5s (Switzerland) Pfizer (U.S.)
Roche (Switzerland) Sanofi-‐Aven5s (France)
Merck (U.S.) GlaxoSmithKline (UK)
Johnson & Johnson (USA) AstraZeneca (UK)
Eli Lilly (U.S.) Abbvie (U.S.) Amgen (U.S.) Teva (Israel)
Bayer (Germany) Novo Nordisk (Denmark)
Sales/spending in billion U.S. dollars
Research and development spending Prescrip5on sales

The Concept of Marginal Profit
Marginal profit is the increase in profit when one more unit is sold
MC Cost
Output
MR
Marginal profit is posi5ve
Marginal profit is nega5ve
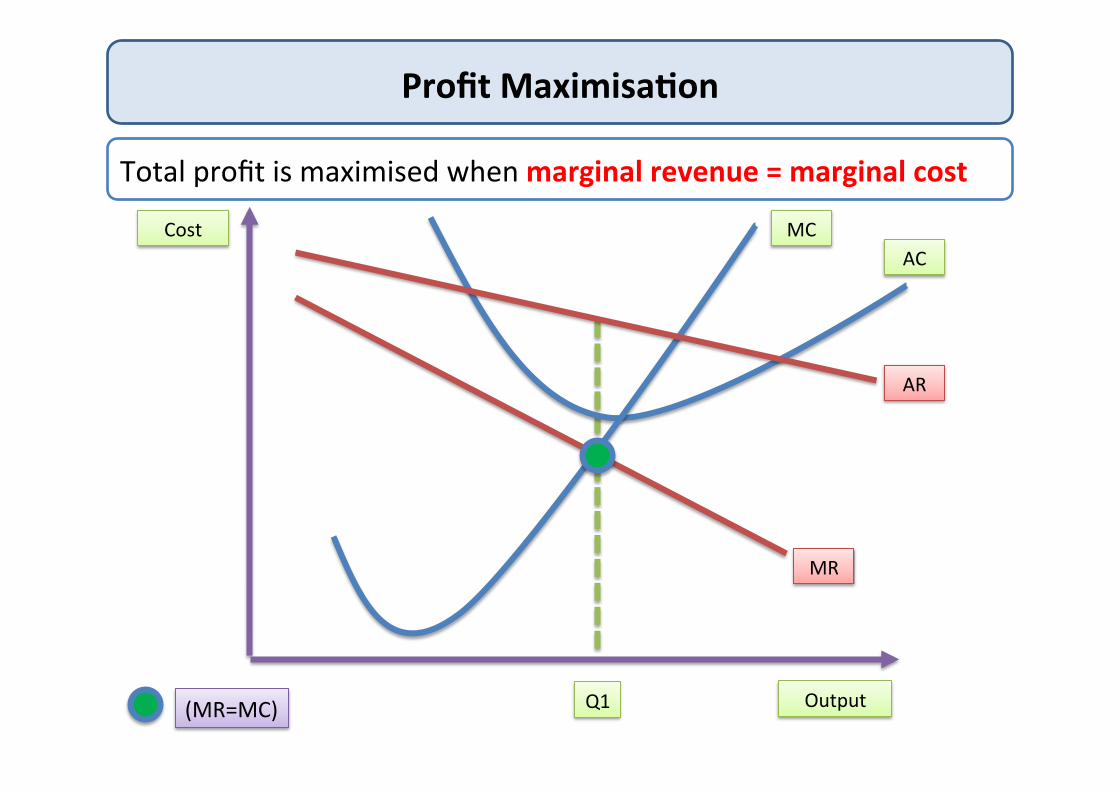
Profit Maximisa2on
MC Cost
Output
AC
MR
AR
(MR=MC) Q1
Total profit is maximised when marginal revenue = marginal cost
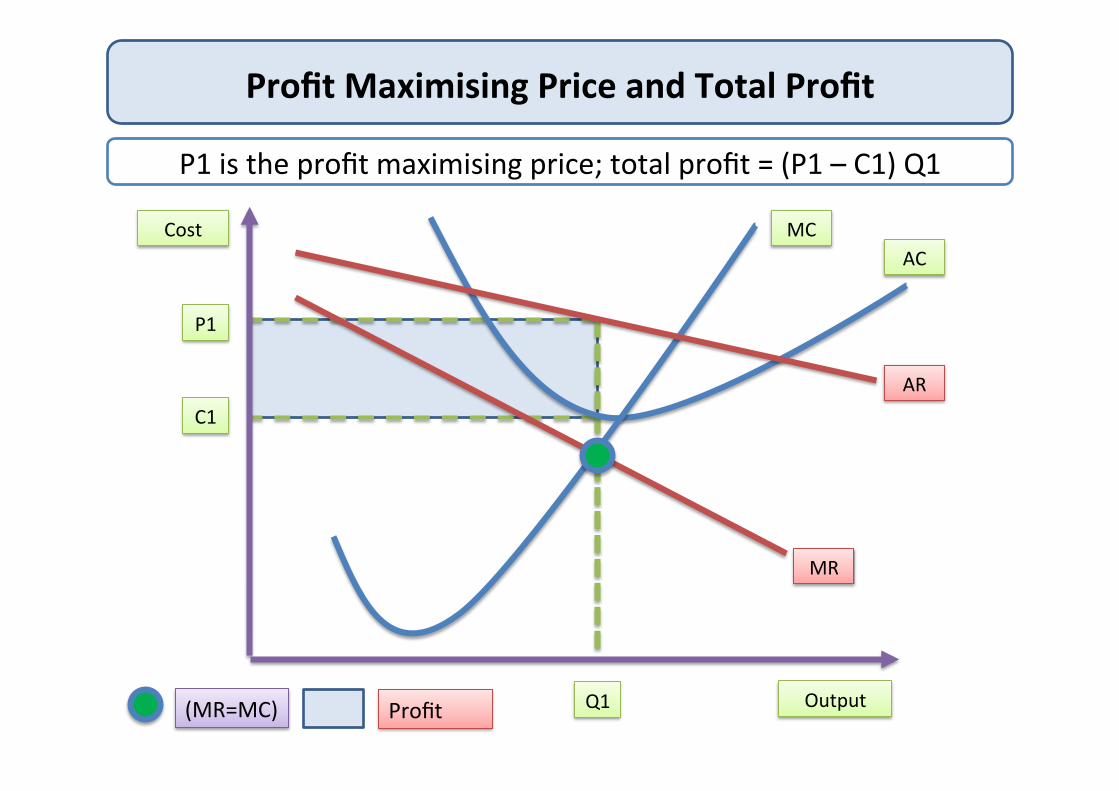
Profit Maximising Price and Total Profit
MC Cost
Output
AC
MR
AR
(MR=MC) Q1
P1 is the profit maximising price; total profit = (P1 – C1) Q1
P1
C1
Profit

Economic Losses (Sub Normal Profit)
MC
Output
AC
MR AR
C1
Q1
P1
Cost and Price

Shut Down Price in the Short Run
MC
Output
AC
MR AR
Q1
AVC
C1
Cost and Price
P1

Shut Down Price in the Short Run
Cost , Price
Quantity of output
MC
AC
AVC
P2
P1
P1: Price = average cost, normal profits made
P2: Price = average variable cost P=Min AVC is the shut down
price for a compe55ve firm in short run
The Shut-‐Down price is mainly a short run concept

Prices and Profits with Economies of Scale
Cost & Price
Output (Q)
Internal Economies of Scale shown by the drop in average and marginal cost from MC1
and AC1 to MC2 and AC2
AC1
AC2
MC1
MC2
AR
MR
The profit maximising price when costs are high is P1 and Q1 When internal economies of scale are achieved, the profit-‐maximising price falls to P2 and output expands to Q2 Economies of scale mean lower prices for consumers And higher profits for producers
P1
Q1
P2
Q2
C2
Supernormal profit at price P2
Economies of scale lead to higher supernormal profits

Different Business Objec2ves
Profit Maximisa5on
Sales Revenue Maximisa5on
Business Growth / Market Power
Business Survival Not For Profit Social Enterprises
State-‐Owned Businesses
Protec5ng an exis5ng Market
Posi5on
Business survival in hard 5mes
Managerial Objec5ves
Breaking into a new Market
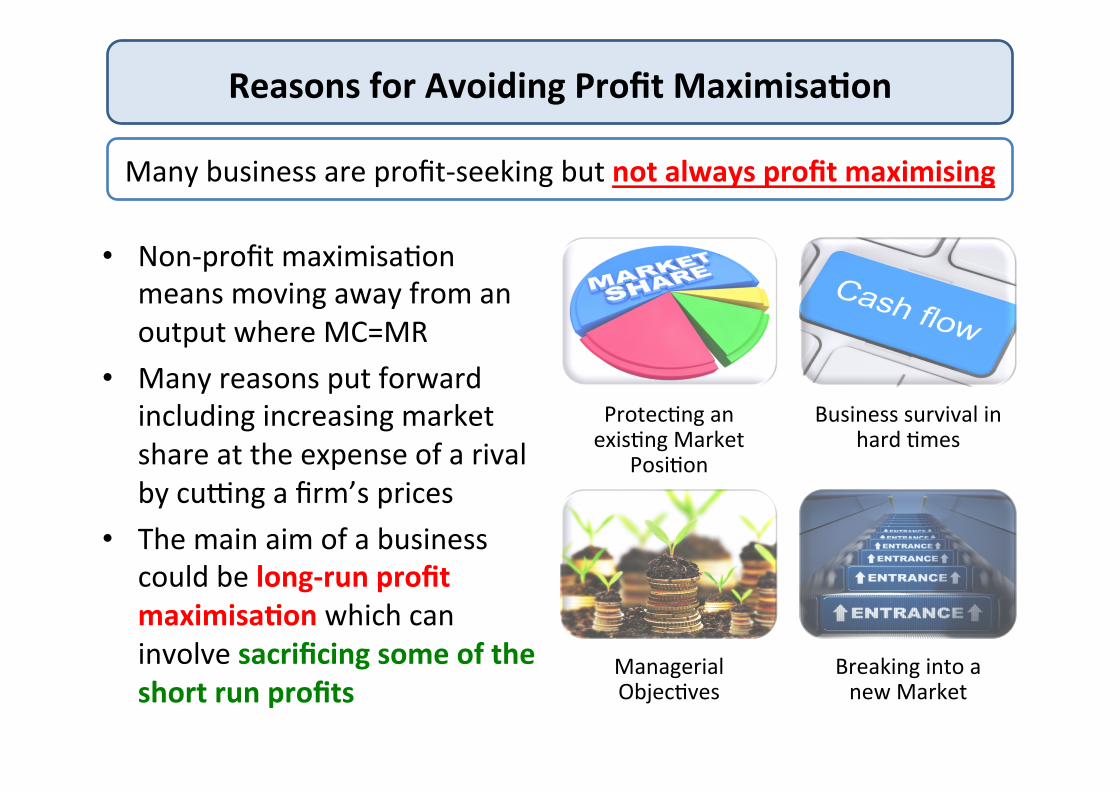
Reasons for Avoiding Profit Maximisa2on
Many business are profit-‐seeking but not always profit maximising
• Non-‐profit maximisa5on means moving away from an output where MC=MR
• Many reasons put forward including increasing market share at the expense of a rival by cukng a firm’s prices
• The main aim of a business could be long-‐run profit maximisa2on which can involve sacrificing some of the short run profits
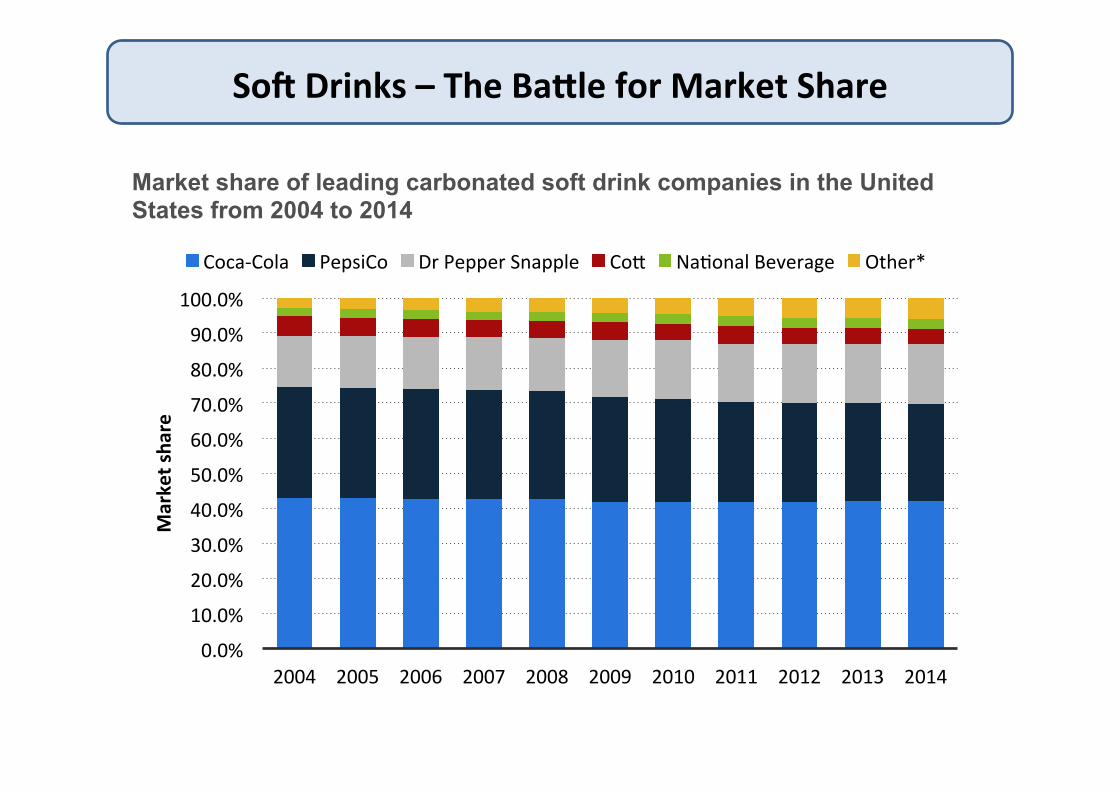
SoZ Drinks – The Ba\le for Market Share
Market share of leading carbonated soft drink companies in the United States from 2004 to 2014
0.0%
10.0%
20.0%
30.0%
40.0%
50.0%
60.0%
70.0%
80.0%
90.0%
100.0%
2004 2005 2006 2007 2008 2009 2010 2011 2012 2013 2014
Market sha
re
Coca-‐Cola PepsiCo Dr Pepper Snapple Con Na5onal Beverage Other*

Coffee Retail Stores in the UK in 2013
Leading 10 coffee shop chains ranked by number of outlets in UK in 2013
1,552
760
530 429
315 304
104 70 45 35 0
200
400
600
800
1000
1200
1400
1600
1800
Costa Starbucks Caffè Nero SSP* Wild Bean Café
M&S Café Coffee Republic
AMT Coffee
Muffin Break
Thorntons Cafés
Num
ber o
f outlets
SSP includes the opera5on of the following outlets: Millie's, Caffè Ritazza, Pumpkin Café, Camden Food Co, Pastry Shop, Delice de France, Soho Coffee, Starbucks, Bread boy, Upper Crust

Discounters such as Aldi and Lidl are on the march!
Market share of grocery stores in UK from Feb 2013 to Feb 2014
0.0% 10.0% 20.0% 30.0% 40.0% 50.0% 60.0% 70.0% 80.0% 90.0% 100.0%
Feb 2014
Mar 2014*
Apr 2014
May 2014
Jun 2014
Jul 2014
Aug 2014
Oct 2014
Nov 2014
Dec 2014
Jan 2015
Feb 2015
Percen
tage sh
are of to
tal grocers
Grocers
Other Mul5ples Farm Foods Iceland Lidl
Aldi Waitrose The Coopera5ve Morrisons
Sainsbury's Asda Tesco

The fierce ba\le for market share in mobile handsets
Market share of handset manufacturers in UK in June 2014
31.8%
22.9%
16.9%
6.7% 6.1% 3.7%
2.4% 2.1%
7.4%
0.0%
5.0%
10.0%
15.0%
20.0%
25.0%
30.0%
35.0%
Samsung Apple Nokia Sony HTC RIM Motorola LG Other
Market sha
re
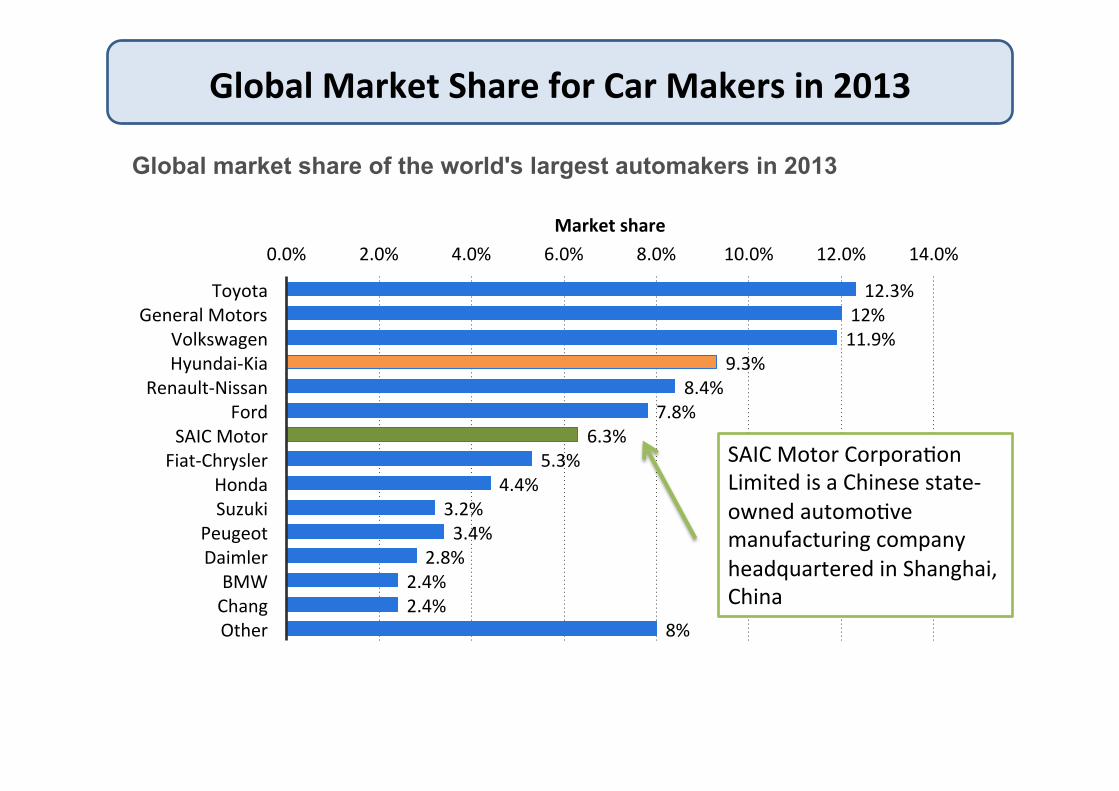
Global Market Share for Car Makers in 2013
Global market share of the world's largest automakers in 2013
12.3% 12% 11.9%
9.3% 8.4%
7.8% 6.3%
5.3% 4.4%
3.2% 3.4%
2.8% 2.4% 2.4%
8%
0.0% 2.0% 4.0% 6.0% 8.0% 10.0% 12.0% 14.0%
Toyota General Motors
Volkswagen Hyundai-‐Kia
Renault-‐Nissan Ford
SAIC Motor Fiat-‐Chrysler
Honda Suzuki
Peugeot Daimler BMW Chang Other
Market share
SAIC Motor Corpora5on Limited is a Chinese state-‐owned automo5ve manufacturing company headquartered in Shanghai, China
Revenue Maximisa2on

Maximising Total Revenue
MC
Price and Cost
Output
AC
MR
AR
Profit Max: MC=MR
Revenue Max: MR=0
P1
C1
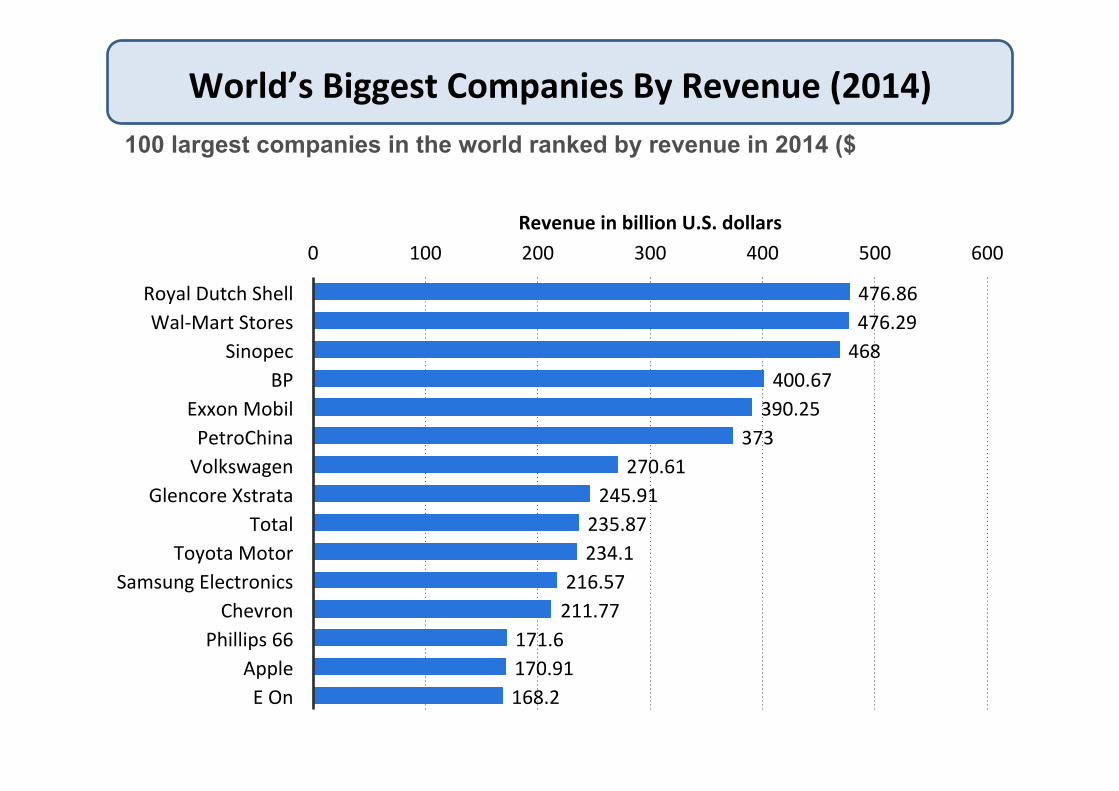
World’s Biggest Companies By Revenue (2014) 100 largest companies in the world ranked by revenue in 2014 ($
476.86 476.29 468
400.67 390.25
373 270.61
245.91 235.87 234.1
216.57 211.77
171.6 170.91 168.2
0 100 200 300 400 500 600
Royal Dutch Shell Wal-‐Mart Stores
Sinopec BP
Exxon Mobil PetroChina Volkswagen
Glencore Xstrata Total
Toyota Motor Samsung Electronics
Chevron Phillips 66
Apple E On
Revenue in billion U.S. dollars
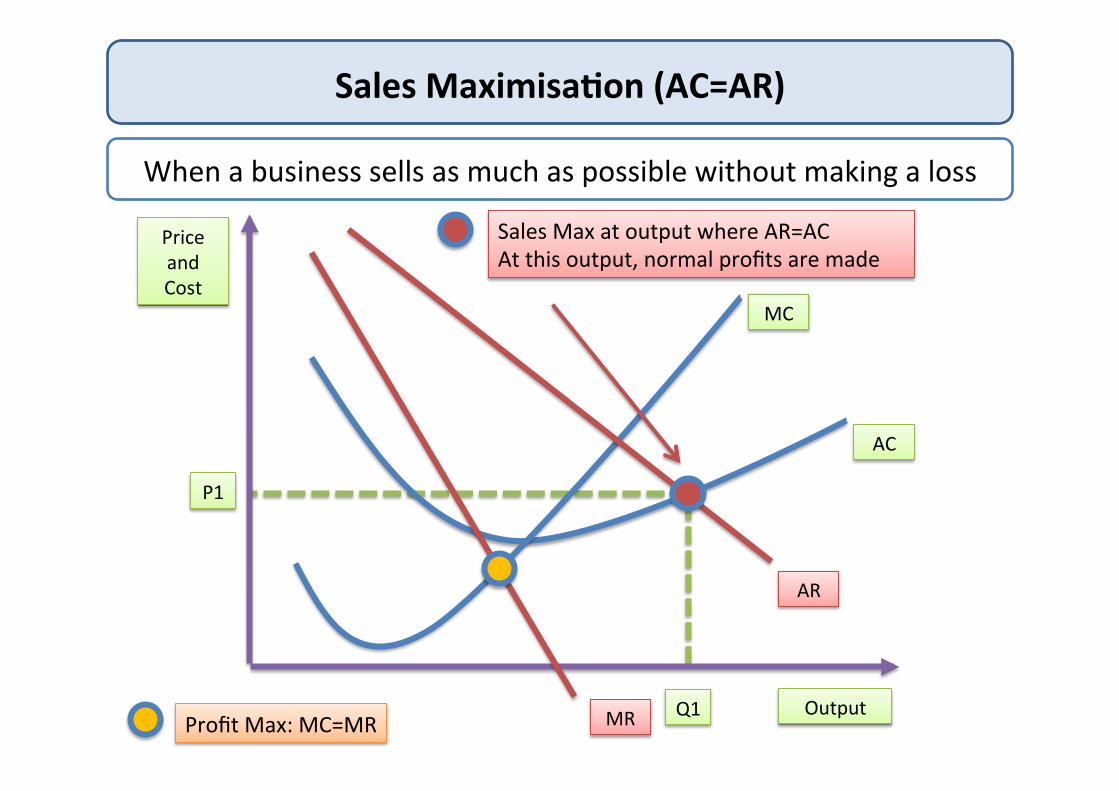
Sales Maximisa2on (AC=AR)
When a business sells as much as possible without making a loss
MC
Price and Cost
Output
AC
MR
AR
Profit Max: MC=MR
Sales Max at output where AR=AC At this output, normal profits are made
P1
Q1

Building a base of installed users / customers
Number of worldwide active Amazon customer accounts:1997 to 2014
1.5 6.2 14 20 25 40
76 88
105 130
164
200
237
270
0
50
100
150
200
250
300
1997 1998 1999* 2000 2001 2003 2007 2008 2009 2010 2011 2012 2013 2014
Num
ber o
f accou
nts (in m
illions)

Sa2sficing Pricing Behaviour
MC
Price and Cost
Output
AC
MR
AR
Possible sa5sficing price
P1
Q1 Q2
P2
C2

Get help from fellow students, teachers and tutor2u on Twi\er:
@tutor2u_econ @tutor2u @economicsuk


