
1
Business Results for the Fiscal Year Ended December 31, 2020 (January 1, 2020 through December 31, 2020)
(Japanese GAAP)
February 12, 2021 This document has been translated from the Japanese original, Kessan Tanshin (Flash Report), for reference purposes only. In the event of any discrepancy between this translated document and the Japanese original, the original shall prevail.
Company name:
Yamaha Motor Co., Ltd.
Stock listing:
Tokyo Stock Exchange the First Section
Code number:
7272
URL:
https://global.yamaha-motor.com/ir/
Representative:
Yoshihiro Hidaka, President, Chief Executive Officer, and Representative Director
Contact:
Toshinari Maegawa, General Manager, Finance & Accounting Division Phone: +81-538-32-1144
Date of the Ordinary General Meeting of Shareholders (scheduled):
March 24, 2021
Beginning of payment of dividends (scheduled):
March 25, 2021
Filing of securities report (scheduled):
March 25, 2021
Supplementary explanatory documents related to the consolidated financial results:
Yes
Briefing on the consolidated financial results:
Yes (for institutional investors, securities analysts and media outlets)

2
Amounts less than one million yen are rounded down.
1. Consolidated Financial Results for the Fiscal Year Ended December 31, 2020 (January 1, 2020 through December 31, 2020)
(1) Consolidated operating results
*% represents growth results. ( ) represents negative figures.
Net sales Operating income Ordinary income
Net income attributable to
owners of parent
Millions of yen % Millions of yen % Millions of yen % Millions of yen %
Fiscal year ended December 31, 2020
1,471,298 (11.6) 81,672 (29.2) 87,668 (26.6) 53,072 (29.9)
Fiscal year ended December 31, 2019
1,664,764 (0.5) 115,364 (18.1) 119,479 (13.4) 75,736 (18.9)
Note: Comprehensive income
Fiscal year ended December 31, 2020: ¥32,951 million [(66.3)%]
Fiscal year ended December 31, 2019: ¥97,672 million [27.0%]
Earnings per share –
basic
Earnings per share –
diluted
Net income to
shareholders’ equity
Ordinary income
to total assets
Operating income
to net sales
Yen Yen % % %
Fiscal year ended December 31, 2020
151.89 ― 7.5 5.5 5.6
Fiscal year ended December 31, 2019
216.83 ― 11.1 8.1 6.9
Reference: Share of profit of entities accounted for using equity method
Fiscal year ended December 31, 2020: ¥864 million
Fiscal year ended December 31, 2019: ¥2,472 million
(2) Consolidated financial position
Total assets Net assets Shareholders’ equity ratio Net assets per share
Millions of yen Millions of yen % Yen
As of December 31, 2020 1,640,913 749,158 43.6 2,045.15
As of December 31, 2019 1,532,810 751,828 46.0 2,018.84
Reference: Shareholders’ equity
As of December 31, 2020: ¥714,644 million
As of December 31, 2019: ¥705,233 million
(3) Consolidated cash flows
From operating
activities
From investing
activities
From financing
activities
Cash and cash equivalents
at end of period
Millions of yen Millions of yen Millions of yen Millions of yen
Fiscal year ended December 31, 2020
110,487 (43,950) 83,668 267,180
Fiscal year ended December 31, 2019
99,127 (79,662) (36,760) 122,719
3
2. Dividends
Annual dividends per share
Total amount
of dividends
(Annual)
Payout ratio
(Consolidated)
Ratio of total
amount of
dividends to
net assets
(Consolidated)
Record date End of first
quarter
End of second
quarter
End of third
quarter
End of fiscal
year Total
Yen Yen Yen Yen Yen Millions of yen % %
Fiscal year ended December 31, 2019
― 45.00 ― 45.00 90.00 31,443 41.5 4.6
Fiscal year ended December 31, 2020
― 0.00 ― 60.00 60.00 20,968 39.5 3.0
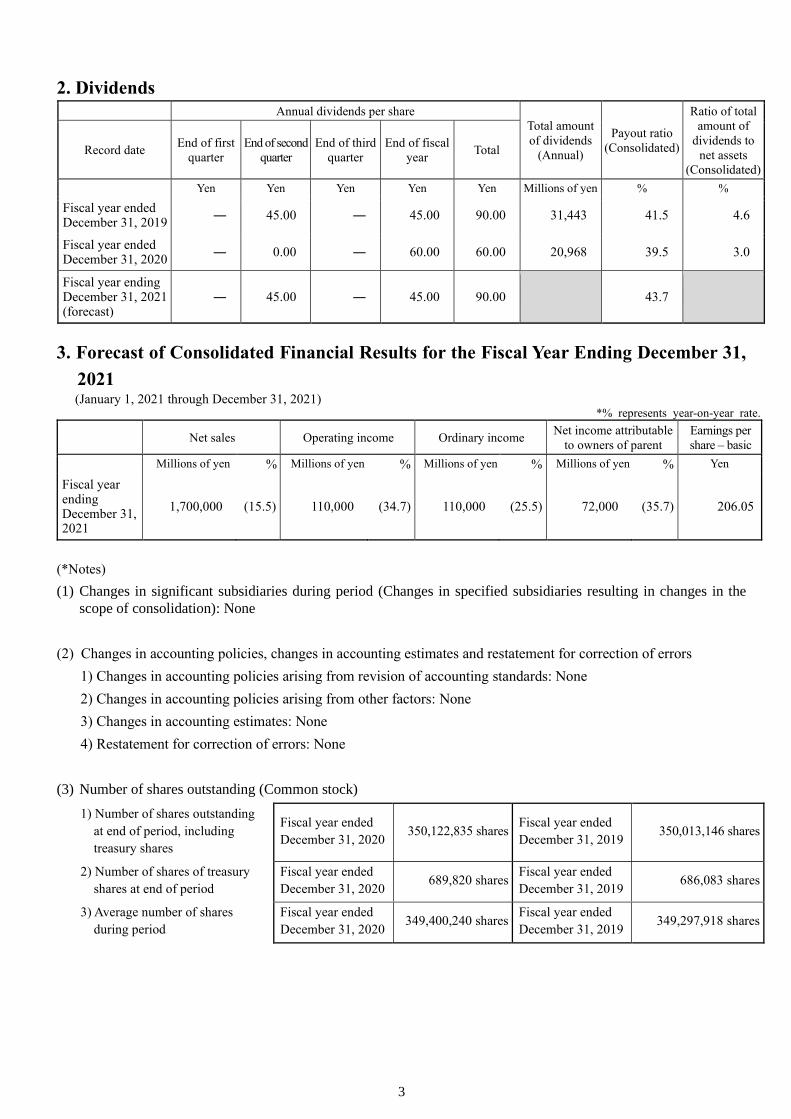
Fiscal year ending December 31, 2021 (forecast)
― 45.00 ― 45.00 90.00 43.7
3. Forecast of Consolidated Financial Results for the Fiscal Year Ending December 31,
2021
(January 1, 2021 through December 31, 2021) *% represents year-on-year rate.
Net sales Operating income Ordinary income
Net income attributable
to owners of parent
Earnings per
share – basic
Millions of yen % Millions of yen % Millions of yen % Millions of yen % Yen
Fiscal year ending December 31, 2021
1,700,000 (15.5) 110,000 (34.7) 110,000 (25.5) 72,000 (35.7) 206.05
(*Notes)
(1) Changes in significant subsidiaries during period (Changes in specified subsidiaries resulting in changes in the
scope of consolidation): None
(2) Changes in accounting policies, changes in accounting estimates and restatement for correction of errors
1) Changes in accounting policies arising from revision of accounting standards: None
2) Changes in accounting policies arising from other factors: None
3) Changes in accounting estimates: None
4) Restatement for correction of errors: None
(3) Number of shares outstanding (Common stock)
1) Number of shares outstanding
at end of period, including
treasury shares
Fiscal year ended
December 31, 2020 350,122,835 shares
Fiscal year ended
December 31, 2019 350,013,146 shares
2) Number of shares of treasury
shares at end of period
Fiscal year ended
December 31, 2020 689,820 shares
Fiscal year ended
December 31, 2019 686,083 shares
3) Average number of shares
during period
Fiscal year ended
December 31, 2020 349,400,240 shares
Fiscal year ended
December 31, 2019 349,297,918 shares

4
(*These consolidated financial results presented herein are not subject to the audit of a certified public
accountant or audit corporation.)
(*Notice regarding results forecast)
(1) The results forecast presented in this document is based on the assumptions and beliefs of Yamaha Motor Co., Ltd.
(the “Company”) in light of the information currently available and is not a guarantee of future performance. Actual
results may differ significantly from the Company’s forecast, due to various risks, uncertainties and other factors,
including changes in business conditions surrounding the Yamaha Motor Group (the “Group”), changing consumer
preferences, and currency exchange rate fluctuations.
For details on potential risks, uncertainties and other factors affecting the Group’s operations, please see the latest
Securities Report and Quarterly Securities Report which have been announced by the Company.
For the results forecast, please refer to page 8 of the Attachment, “Forecast for the fiscal year ending December
31, 2021 (January 1, 2021 through December 31, 2021)” in “(1) Overview of Operating Results for the Fiscal Year
Under Review,” under “1. Overview of Operating Results.”
(2) Briefing on the consolidated financial results will be held as follows. Supplementary explanatory documents related
to the consolidated financial results and so on to be handed at the briefing will be posted on the Company website
immediately. The main contents and Q&A Minutes of the briefing will be posted on the Company website on or
after the day following the briefing.
Friday, February 12, 2021: Briefing on the consolidated financial results for institutional investors,
securities analysts and media outlets
(3) With regard to amounts stated in ¥100 million units in this document, amounts less than ¥100 million are rounded
off.
5
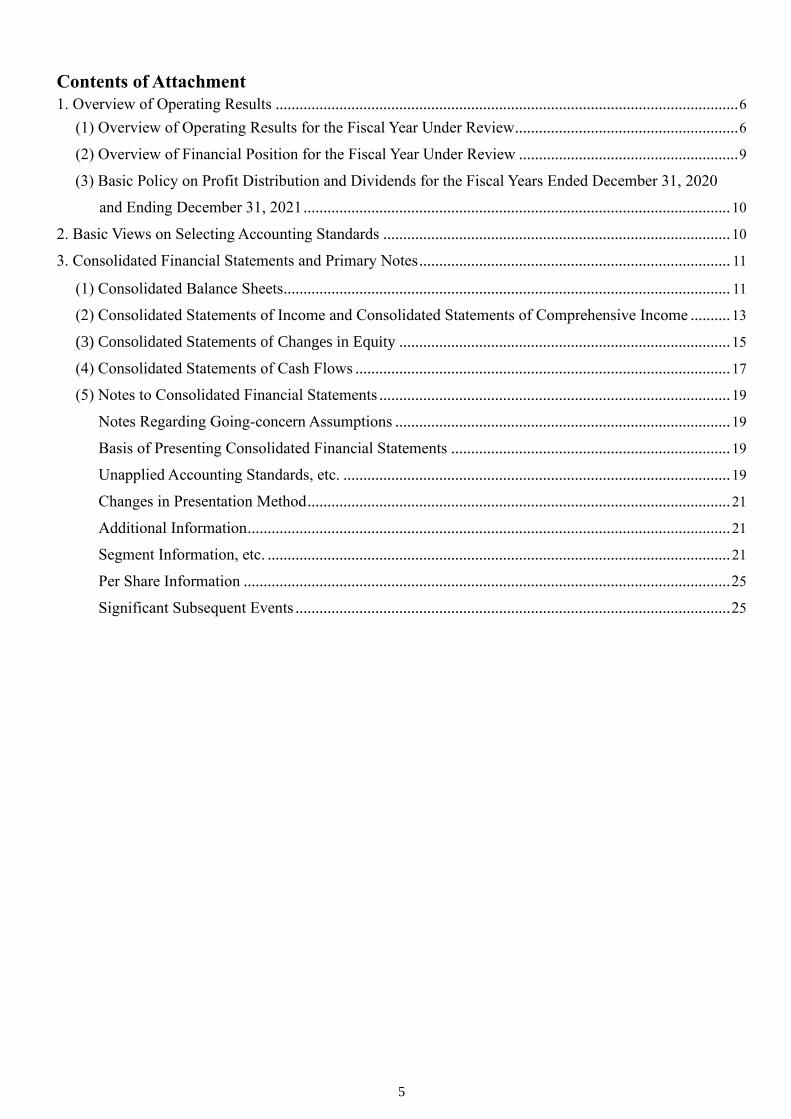
Contents of Attachment
1. Overview of Operating Results .................................................................................................................... 6
(1) Overview of Operating Results for the Fiscal Year Under Review........................................................ 6
(2) Overview of Financial Position for the Fiscal Year Under Review ....................................................... 9
(3) Basic Policy on Profit Distribution and Dividends for the Fiscal Years Ended December 31, 2020
and Ending December 31, 2021 ........................................................................................................... 10
2. Basic Views on Selecting Accounting Standards ....................................................................................... 10
3. Consolidated Financial Statements and Primary Notes .............................................................................. 11
(1) Consolidated Balance Sheets................................................................................................................ 11
(2) Consolidated Statements of Income and Consolidated Statements of Comprehensive Income .......... 13
(3) Consolidated Statements of Changes in Equity ................................................................................... 15
(4) Consolidated Statements of Cash Flows .............................................................................................. 17
(5) Notes to Consolidated Financial Statements ........................................................................................ 19
Notes Regarding Going-concern Assumptions .................................................................................... 19
Basis of Presenting Consolidated Financial Statements ...................................................................... 19
Unapplied Accounting Standards, etc. ................................................................................................. 19
Changes in Presentation Method .......................................................................................................... 21
Additional Information ......................................................................................................................... 21
Segment Information, etc. .................................................................................................................... 21
Per Share Information .......................................................................................................................... 25
Significant Subsequent Events ............................................................................................................. 25

6
1. Overview of Operating Results Matters relating to the future in this document are based on the assumptions and beliefs of the Group in light of the
information as of the end of the fiscal year ended December 31, 2020.
As stated in “3. Consolidated Financial Statements and Primary Notes, (5) Notes to Consolidated Financial
Statements, Segment Information, etc., 1. Overview of reporting segments,” the following analysis utilizes figures in
the consolidated financial statements for the fiscal year ended December 31, 2019 that have been retrospectively
restated and reclassified.
(1) Overview of Operating Results for the Fiscal Year Under Review During the fiscal year ended December 31, 2020, the global economy was profoundly affected by the worldwide
proliferation of the COVID-19 pandemic which emerged at the outset of the year amid an uncertain economic outlook
in addition to U.S.-China trade friction that had been persisting since the previous year. Meanwhile, the pandemic
continues to weigh on the Group’s financial results amid a scenario where it has been on a path to recovery since having
bottomed out in the second quarter (from April to June) and some markets rebounded in the fourth quarter (from
October to December). After the second quarter, demand in developed markets has been sharply rebounding with
respect to personal commuter vehicles and outdoor family leisure. Meanwhile, emerging markets have been mounting
a gradual recovery, particularly in the ASEAN region, India, and South America.
Given this situation, the Company engaged in business while first and foremost acting to prevent further spread of
COVID-19, to ensure the safety and health of stakeholders, and to address regulations of respective countries
appropriately. The Company has secured ample liquidity by thoroughly cutting costs and raising necessary funds, in a
manner that draws on its experience during the worldwide financial crisis that was triggered by the bankruptcy of
Lehman Brothers. In terms of R&D and investment, the Company has continued to undertake development and
investment needed to strengthen its capacity in new fields and core businesses looking toward future growth, while
also taking a selective and focused approach to narrowing its overall portfolio. In terms of production, the Company
suspended factory operations at the early stages in response to the probability of waning demand due to proliferation
of the COVID-19 pandemic. In terms of sales, the Company was quick to deploy marketing activities enlisting digital
technologies upon restrictions having been placed on such initiatives due to COVID-19. Meanwhile, the Company has
expanded its product line by rolling out new models in Europe, where new regulations on gas emissions have been
adopted, as well as in India and Taiwan.
As a result, the Company’s consolidated net sales for the fiscal year under review declined ¥193.5 billion, or 11.6%,
year on year, to ¥1,471.3 billion, operating income declined ¥33.7 billion, or 29.2%, to ¥81.7 billion, ordinary income
declined ¥31.8 billion, or 26.6%, to ¥87.7 billion, and net income attributable to owners of parent declined ¥22.7 billion,
or 29.9%, to ¥53.1 billion.
As for financial results for the fourth quarter (from October to December), consolidated net sales increased ¥6.7
billion, or 1.7%, to ¥404.2 billion and operating income increased ¥9.9 billion, or 64.5%, to ¥25.3 billion. The Company
has managed to partially recover from the adverse effects that COVID-19 had on the Company’s financial results in
the first half of the fiscal year.
Exchange rates for the fiscal year were ¥107 to the U.S. dollar (an appreciation of ¥2, year on year) and ¥122 to the
euro (unchanged from the previous fiscal year).
Net sales decreased overall despite having increased in the Robotics business and the Financial services business,
amid lower unit sales of motorcycles in the Land mobility business and lower unit sales in the Marine products business
due to the effects of COVID-19. Operating income decreased as a whole due to factors that included the impact of
foreign exchange and a lower operation ratio as a result of factories in respective countries having temporarily
suspended operations during the first half of the fiscal year, compounded by lower sales.
In terms of financial indicators, the ratio of net income attributable to owners of the parent was 3.6% (a year on year
decline of 0.9 percentage points), total asset turnover was 0.93 (a year on year decline of 0.20) due to securing cash on
hand and purchases of sales finance receivables, shareholders’ equity was ¥714.6 billion (an increase of ¥9.4 billion
compared with the end of the previous fiscal year), and shareholders’ equity ratio was 43.6% (a year on year decline
of 2.5 percentage points). As a result, ROE was 7.5% (a year on year decline of 3.6 percentage points). In addition,
free cash flow (including sales finance) was positive ¥66.5 billion (a year on year increase of ¥47.1 billion).
Operating results by segment
[Land mobility]
Net sales declined ¥173.4 billion, or 15.5%, year on year, to ¥946.5 billion, and operating income declined ¥23.2 billion,
or 55.7%, year on year, to ¥18.5 billion.
With regard to motorcycles in developed markets, unit sales decreased despite the prevailing recovery in overall
7
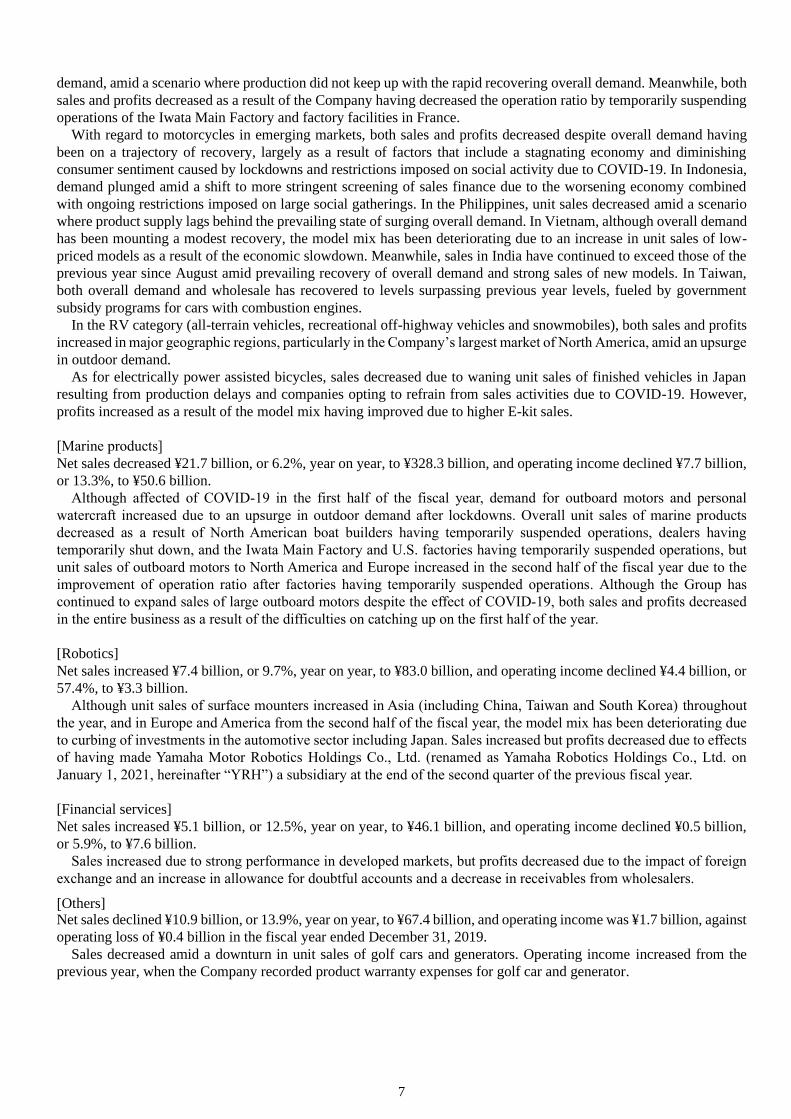
demand, amid a scenario where production did not keep up with the rapid recovering overall demand. Meanwhile, both
sales and profits decreased as a result of the Company having decreased the operation ratio by temporarily suspending
operations of the Iwata Main Factory and factory facilities in France.
With regard to motorcycles in emerging markets, both sales and profits decreased despite overall demand having
been on a trajectory of recovery, largely as a result of factors that include a stagnating economy and diminishing
consumer sentiment caused by lockdowns and restrictions imposed on social activity due to COVID-19. In Indonesia,
demand plunged amid a shift to more stringent screening of sales finance due to the worsening economy combined
with ongoing restrictions imposed on large social gatherings. In the Philippines, unit sales decreased amid a scenario
where product supply lags behind the prevailing state of surging overall demand. In Vietnam, although overall demand
has been mounting a modest recovery, the model mix has been deteriorating due to an increase in unit sales of low-
priced models as a result of the economic slowdown. Meanwhile, sales in India have continued to exceed those of the
previous year since August amid prevailing recovery of overall demand and strong sales of new models. In Taiwan,
both overall demand and wholesale has recovered to levels surpassing previous year levels, fueled by government
subsidy programs for cars with combustion engines.
In the RV category (all-terrain vehicles, recreational off-highway vehicles and snowmobiles), both sales and profits
increased in major geographic regions, particularly in the Company’s largest market of North America, amid an upsurge
in outdoor demand.
As for electrically power assisted bicycles, sales decreased due to waning unit sales of finished vehicles in Japan
resulting from production delays and companies opting to refrain from sales activities due to COVID-19. However,
profits increased as a result of the model mix having improved due to higher E-kit sales.
[Marine products]
Net sales decreased ¥21.7 billion, or 6.2%, year on year, to ¥328.3 billion, and operating income declined ¥7.7 billion,
or 13.3%, to ¥50.6 billion.
Although affected of COVID-19 in the first half of the fiscal year, demand for outboard motors and personal
watercraft increased due to an upsurge in outdoor demand after lockdowns. Overall unit sales of marine products
decreased as a result of North American boat builders having temporarily suspended operations, dealers having
temporarily shut down, and the Iwata Main Factory and U.S. factories having temporarily suspended operations, but
unit sales of outboard motors to North America and Europe increased in the second half of the fiscal year due to the
improvement of operation ratio after factories having temporarily suspended operations. Although the Group has
continued to expand sales of large outboard motors despite the effect of COVID-19, both sales and profits decreased
in the entire business as a result of the difficulties on catching up on the first half of the year.
[Robotics]
Net sales increased ¥7.4 billion, or 9.7%, year on year, to ¥83.0 billion, and operating income declined ¥4.4 billion, or
57.4%, to ¥3.3 billion.
Although unit sales of surface mounters increased in Asia (including China, Taiwan and South Korea) throughout
the year, and in Europe and America from the second half of the fiscal year, the model mix has been deteriorating due
to curbing of investments in the automotive sector including Japan. Sales increased but profits decreased due to effects
of having made Yamaha Motor Robotics Holdings Co., Ltd. (renamed as Yamaha Robotics Holdings Co., Ltd. on
January 1, 2021, hereinafter “YRH”) a subsidiary at the end of the second quarter of the previous fiscal year.
[Financial services]
Net sales increased ¥5.1 billion, or 12.5%, year on year, to ¥46.1 billion, and operating income declined ¥0.5 billion,
or 5.9%, to ¥7.6 billion.
Sales increased due to strong performance in developed markets, but profits decreased due to the impact of foreign
exchange and an increase in allowance for doubtful accounts and a decrease in receivables from wholesalers. [Others] Net sales declined ¥10.9 billion, or 13.9%, year on year, to ¥67.4 billion, and operating income was ¥1.7 billion, against
operating loss of ¥0.4 billion in the fiscal year ended December 31, 2019.
Sales decreased amid a downturn in unit sales of golf cars and generators. Operating income increased from the
previous year, when the Company recorded product warranty expenses for golf car and generator.

8
Major products and services in each business segment are as follows.
Segment Main products and services
Land mobility
Motorcycles, intermediate parts for products, knockdown parts for overseas
production, all-terrain vehicles, recreational off-highway vehicles, snowmobiles,
electrically power assisted bicycles, automobile engines and automobile components
Marine products Outboard motors, personal watercraft, boats, FRP pools, fishing boats and utility boats
Robotics Surface mounters, semiconductor manufacturing equipment, industrial robots and
industrial-use unmanned helicopters
Financial services Sales finance and lease related to the Company's products
Others Golf cars, generators, multi-purpose engines, small-sized snow throwers and
electrically powered wheelchairs
Forecast for the fiscal year ending December 31, 2021
(January 1, 2021 through December 31, 2021)
The year 2020 was one of stagnant consumption and corporate economic activity amid stay-at-home orders and
restrictions on movement imposed in many countries due to the COVID-19 pandemic. Meanwhile, there is no telling
how 2021 will turn out, but it is likely to be a year marked by the world gradually returning to where it was prior to the
COVID-19 pandemic thanks to the development of vaccines and their increasingly widespread administration. Amid
those circumstances, in the Land mobility and Marine products businesses serving developed markets, the Company
anticipates high rates of factory utilization as manufacturers seek to replenish inventory on the market. In the Robotics
business, the Company envisions increasing demand when it comes to China along with a rebound in demand with
respect to developed markets. The motorcycle market in emerging economies also seems poised for moderate recovery.
Meanwhile, potential risks include the possibility of soaring transportation costs amid a global shortage of shipping
containers and a scenario where a dearth of semiconductors affects procurement of component parts. Amid this business
environment, the Company will keep striving to reduce costs by putting new work arrangements into practice and by
enlisting digital technologies particularly with respect to advertising and events. The consolidated financial results
forecast derived from the aforementioned factors is as follows.
Billions of yen
Net sales 1,700.0
(+228.7, 15.5%)
Operating income 110.0
(+28.3, 34.7%)
Ordinary income 110.0
(+22.3, 25.5%)
Net income attributable to owners of
parent
72.0
(+18.9, 35.7%)
The forecast is based on the assumption that the exchange rates are ¥103 against the U.S. dollar (an appreciation of ¥4
from the previous fiscal year) and ¥126 against the euro (a depreciation of ¥4).
9
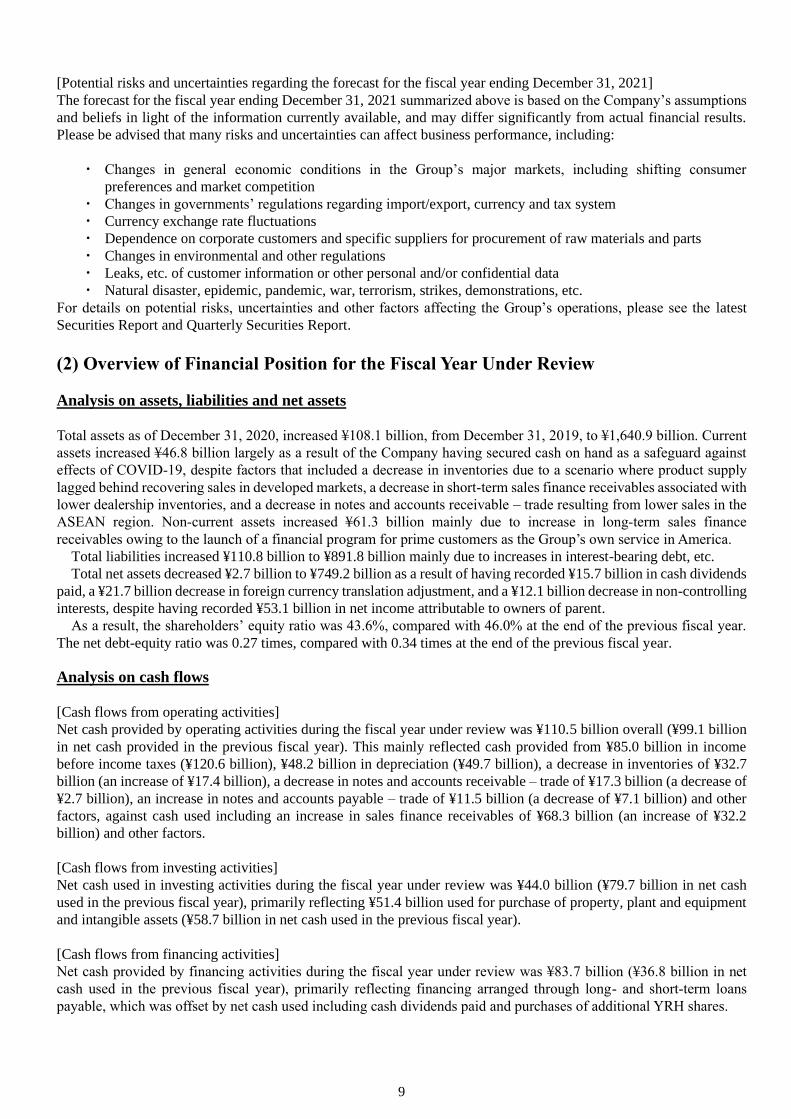
[Potential risks and uncertainties regarding the forecast for the fiscal year ending December 31, 2021]
The forecast for the fiscal year ending December 31, 2021 summarized above is based on the Company’s assumptions
and beliefs in light of the information currently available, and may differ significantly from actual financial results.
Please be advised that many risks and uncertainties can affect business performance, including:
・ Changes in general economic conditions in the Group’s major markets, including shifting consumer
preferences and market competition
・ Changes in governments’ regulations regarding import/export, currency and tax system
・ Currency exchange rate fluctuations
・ Dependence on corporate customers and specific suppliers for procurement of raw materials and parts
・ Changes in environmental and other regulations
・ Leaks, etc. of customer information or other personal and/or confidential data
・ Natural disaster, epidemic, pandemic, war, terrorism, strikes, demonstrations, etc.
For details on potential risks, uncertainties and other factors affecting the Group’s operations, please see the latest
Securities Report and Quarterly Securities Report.
(2) Overview of Financial Position for the Fiscal Year Under Review
Analysis on assets, liabilities and net assets
Total assets as of December 31, 2020, increased ¥108.1 billion, from December 31, 2019, to ¥1,640.9 billion. Current
assets increased ¥46.8 billion largely as a result of the Company having secured cash on hand as a safeguard against
effects of COVID-19, despite factors that included a decrease in inventories due to a scenario where product supply
lagged behind recovering sales in developed markets, a decrease in short-term sales finance receivables associated with
lower dealership inventories, and a decrease in notes and accounts receivable – trade resulting from lower sales in the
ASEAN region. Non-current assets increased ¥61.3 billion mainly due to increase in long-term sales finance
receivables owing to the launch of a financial program for prime customers as the Group’s own service in America.
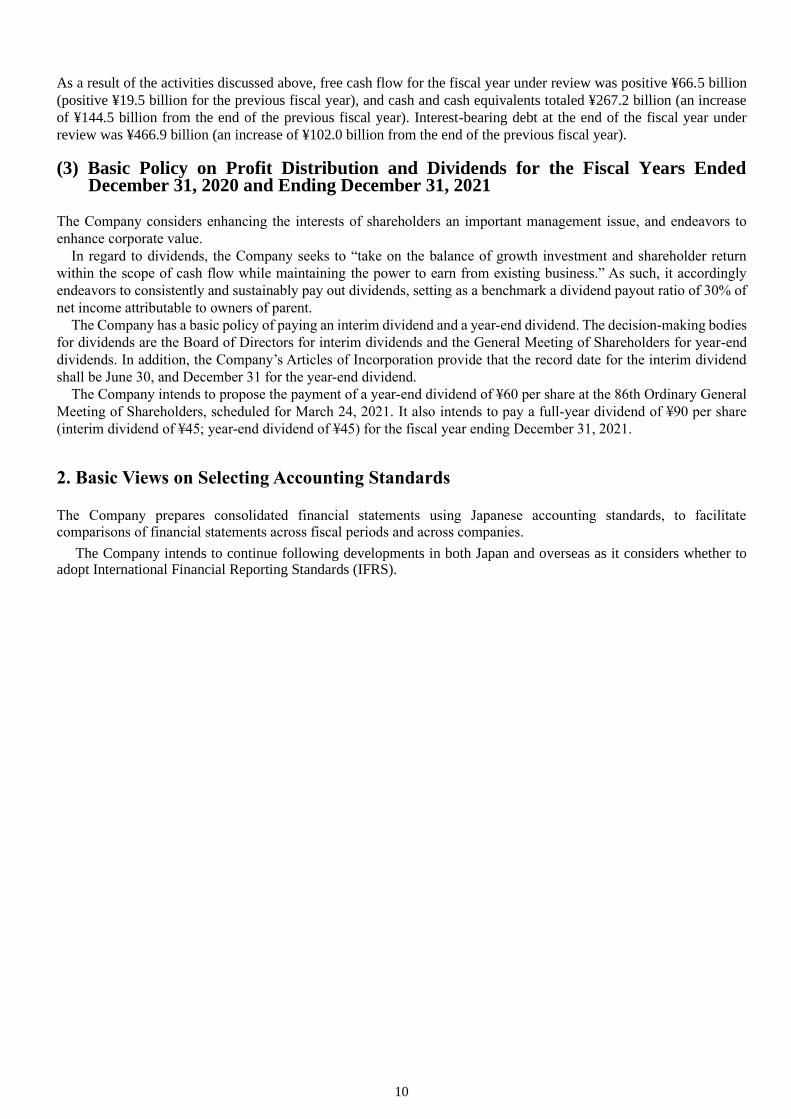
Total liabilities increased ¥110.8 billion to ¥891.8 billion mainly due to increases in interest-bearing debt, etc.
Total net assets decreased ¥2.7 billion to ¥749.2 billion as a result of having recorded ¥15.7 billion in cash dividends
paid, a ¥21.7 billion decrease in foreign currency translation adjustment, and a ¥12.1 billion decrease in non-controlling
interests, despite having recorded ¥53.1 billion in net income attributable to owners of parent.
As a result, the shareholders’ equity ratio was 43.6%, compared with 46.0% at the end of the previous fiscal year.
The net debt-equity ratio was 0.27 times, compared with 0.34 times at the end of the previous fiscal year.
Analysis on cash flows
[Cash flows from operating activities]
Net cash provided by operating activities during the fiscal year under review was ¥110.5 billion overall (¥99.1 billion
in net cash provided in the previous fiscal year). This mainly reflected cash provided from ¥85.0 billion in income
before income taxes (¥120.6 billion), ¥48.2 billion in depreciation (¥49.7 billion), a decrease in inventories of ¥32.7
billion (an increase of ¥17.4 billion), a decrease in notes and accounts receivable – trade of ¥17.3 billion (a decrease of
¥2.7 billion), an increase in notes and accounts payable – trade of ¥11.5 billion (a decrease of ¥7.1 billion) and other
factors, against cash used including an increase in sales finance receivables of ¥68.3 billion (an increase of ¥32.2
billion) and other factors.
[Cash flows from investing activities]
Net cash used in investing activities during the fiscal year under review was ¥44.0 billion (¥79.7 billion in net cash
used in the previous fiscal year), primarily reflecting ¥51.4 billion used for purchase of property, plant and equipment
and intangible assets (¥58.7 billion in net cash used in the previous fiscal year).
[Cash flows from financing activities]
Net cash provided by financing activities during the fiscal year under review was ¥83.7 billion (¥36.8 billion in net
cash used in the previous fiscal year), primarily reflecting financing arranged through long- and short-term loans
payable, which was offset by net cash used including cash dividends paid and purchases of additional YRH shares.
10
As a result of the activities discussed above, free cash flow for the fiscal year under review was positive ¥66.5 billion
(positive ¥19.5 billion for the previous fiscal year), and cash and cash equivalents totaled ¥267.2 billion (an increase
of ¥144.5 billion from the end of the previous fiscal year). Interest-bearing debt at the end of the fiscal year under
review was ¥466.9 billion (an increase of ¥102.0 billion from the end of the previous fiscal year).
(3) Basic Policy on Profit Distribution and Dividends for the Fiscal Years Ended
December 31, 2020 and Ending December 31, 2021
The Company considers enhancing the interests of shareholders an important management issue, and endeavors to
enhance corporate value.
In regard to dividends, the Company seeks to “take on the balance of growth investment and shareholder return
within the scope of cash flow while maintaining the power to earn from existing business.” As such, it accordingly
endeavors to consistently and sustainably pay out dividends, setting as a benchmark a dividend payout ratio of 30% of
net income attributable to owners of parent.
The Company has a basic policy of paying an interim dividend and a year-end dividend. The decision-making bodies
for dividends are the Board of Directors for interim dividends and the General Meeting of Shareholders for year-end
dividends. In addition, the Company’s Articles of Incorporation provide that the record date for the interim dividend
shall be June 30, and December 31 for the year-end dividend.
The Company intends to propose the payment of a year-end dividend of ¥60 per share at the 86th Ordinary General
Meeting of Shareholders, scheduled for March 24, 2021. It also intends to pay a full-year dividend of ¥90 per share
(interim dividend of ¥45; year-end dividend of ¥45) for the fiscal year ending December 31, 2021.
2. Basic Views on Selecting Accounting Standards The Company prepares consolidated financial statements using Japanese accounting standards, to facilitate comparisons of financial statements across fiscal periods and across companies.
The Company intends to continue following developments in both Japan and overseas as it considers whether to adopt International Financial Reporting Standards (IFRS).

11
3. Consolidated Financial Statements and Primary Notes
(1) Consolidated Balance Sheets As of December 31, 2019 and 2020
Millions of yen
As of December 31, 2019 As of December 31, 2020
ASSETS
Current assets:
Cash and deposits 124,580 272,373
Notes and accounts receivable – trade 164,937 145,997
Short-term sales finance receivables 179,397 149,746
Merchandise and finished goods 224,014 169,829
Work in process 64,315 74,936
Raw materials and supplies 68,420 67,558
Other 59,873 55,781
Allowance for doubtful accounts (10,774) (14,659)
Total current assets 874,764 921,563
Non-current assets:
Property, plant and equipment
Buildings and structures, net 111,204 106,980
Machinery, equipment and vehicles, net 103,537 97,474
Land 88,690 84,516
Construction in progress 26,812 24,630
Other, net 26,044 25,187
Total property, plant and equipment 356,289 338,788
Intangible assets 8,640 11,235
Investments and other assets
Investment securities 134,141 130,613
Long-term sales finance receivables 110,777 185,852
Net defined benefit asset 9,480 13,557
Deferred tax assets 27,527 25,031
Other 13,033 16,523
Allowance for doubtful accounts (1,844) (2,251)
Total investments and other assets 293,115 369,325
Total non-current assets 658,045 719,349
Total assets 1,532,810 1,640,913
12
Millions of yen
As of December 31, 2019 As of December 31, 2020
LIABILITIES
Current liabilities:
Notes and accounts payable – trade 112,982 121,218
Electronically recorded obligations – operating 22,012 22,727
Short-term loans payable 151,917 85,998
Current portion of bonds payable - 2,062
Current portion of long-term loans payable 34,056 24,459
Income taxes payable 7,353 8,245
Provision for bonuses 14,518 14,693
Provision for product warranties 17,553 18,147
Other provision 1,428 1,470
Other 134,505 131,789
Total current liabilities 496,328 430,812
Non-current liabilities:
Bonds payable 5,437 2,062
Long-term loans payable 173,541 352,354
Deferred tax liabilities 8,283 9,147
Deferred tax liabilities for land revaluation 4,644 4,644
Net defined benefit liability 61,366 60,421
Other provision 301 149
Other 31,077 32,162
Total non-current liabilities 284,653 460,942
Total liabilities 780,981 891,754
NET ASSETS
Shareholders’ equity:
Capital stock 85,905 85,973
Capital surplus 74,770 67,973
Retained earnings 607,000 644,350
Treasury shares (733) (734)
Total shareholders’ equity 766,943 797,563
Accumulated other comprehensive income:
Valuation difference on available-for-sale securities 45,184 43,861
Revaluation reserve for land 10,428 10,428
Foreign currency translation adjustment (119,447) (141,133)
Remeasurements of defined benefit plans 2,125 3,924
Total accumulated other comprehensive income (61,709) (82,919)
Non-controlling interests 46,594 34,514
Total net assets 751,828 749,158
Total liabilities and net assets 1,532,810 1,640,913
13
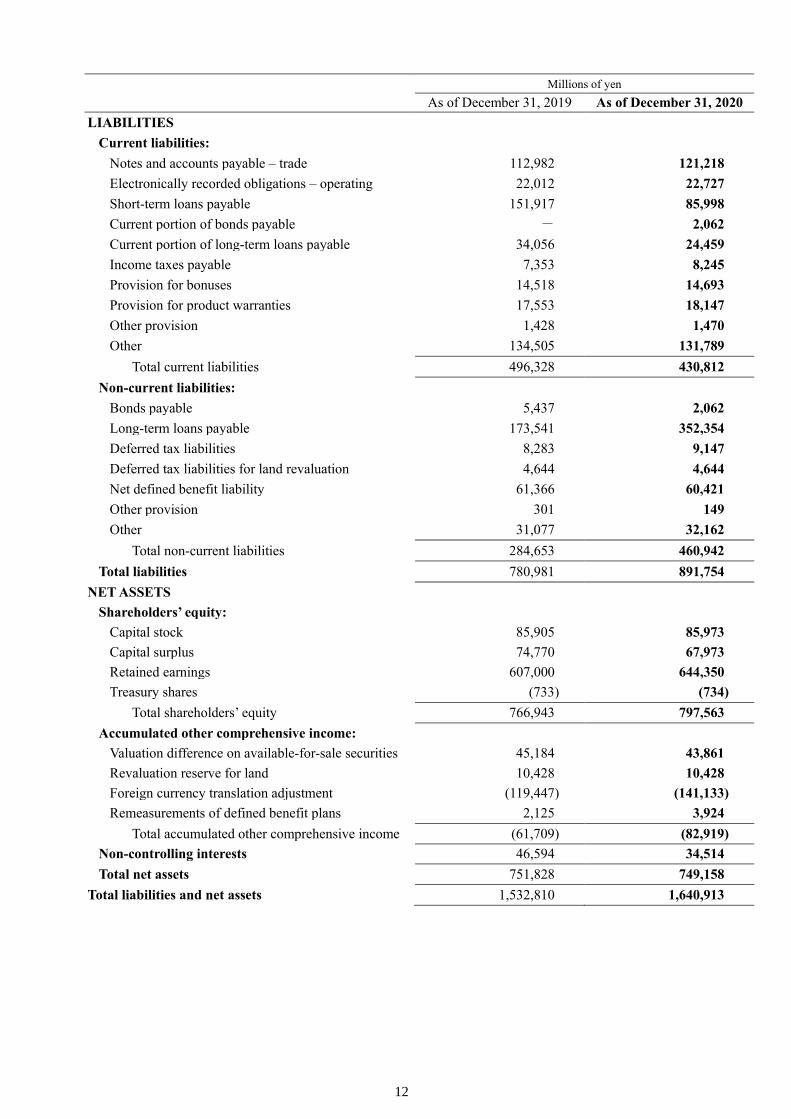
(2) Consolidated Statements of Income and Consolidated Statements of Comprehensive Income Fiscal years ended December 31, 2019 and 2020
Consolidated Statements of Income
Millions of yen
Fiscal year ended
December 31, 2019
(January 1―
December 31, 2019)
Fiscal year ended
December 31, 2020
(January 1―
December 31, 2020)
Net sales 1,664,764 1,471,298
Cost of sales 1,222,433 1,099,486
Gross profit 442,331 371,812
Selling, general and administrative expenses 326,967 290,139
Operating income 115,364 81,672
Non-operating income:
Interest income 3,658 3,921
Dividend income 1,286 1,177
Share of profit of entities accounted for using equity method 2,472 864
Foreign exchange gains - 626
Subsidies for employment adjustment - 2,379
Other 6,757 7,299
Total non-operating income 14,175 16,269
Non-operating expenses:
Interest expenses 3,381 3,625
Foreign exchange losses 592 -
Other 6,086 6,648
Total non-operating expenses 10,060 10,273
Ordinary income 119,479 87,668
Extraordinary income:
Gain on sales of non-current assets 576 2,289
Gain on bargain purchase 2,235 -
Gain on sales of investment securities 211 2,287
Total extraordinary income 3,023 4,577
Extraordinary losses:
Loss on sales of non-current assets 288 202
Loss on disposal of non-current assets 1,246 848
Impairment loss 238 1,155
Loss on sales of investment securities 13 817
Business restructuring expenses 89 4,231
Total extraordinary losses 1,876 7,255
Income before income taxes 120,626 84,990
Income taxes – current 34,487 27,756
Income taxes – deferred 2,086 1,460
Total income taxes 36,574 29,216
Net income 84,052 55,773
Net income attributable to non-controlling interests 8,315 2,701
Net income attributable to owners of parent 75,736 53,072
14
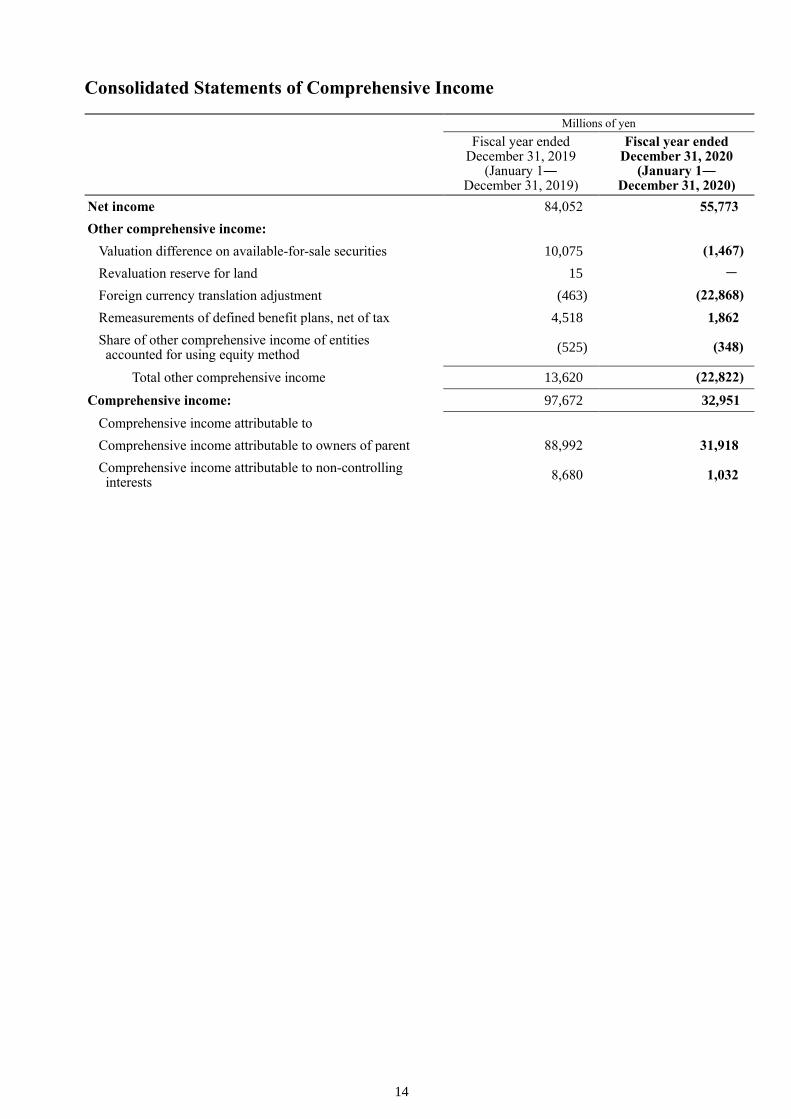
Consolidated Statements of Comprehensive Income
Millions of yen
Fiscal year ended December 31, 2019
(January 1― December 31, 2019)
Fiscal year ended December 31, 2020
(January 1― December 31, 2020)
Net income 84,052 55,773
Other comprehensive income:
Valuation difference on available-for-sale securities 10,075 (1,467)
Revaluation reserve for land 15 -
Foreign currency translation adjustment (463) (22,868)
Remeasurements of defined benefit plans, net of tax 4,518 1,862
Share of other comprehensive income of entities accounted for using equity method
(525) (348)
Total other comprehensive income 13,620 (22,822)
Comprehensive income: 97,672 32,951
Comprehensive income attributable to
Comprehensive income attributable to owners of parent 88,992 31,918
Comprehensive income attributable to non-controlling interests
8,680 1,032

15
(3) Consolidated Statements of Changes in Equity Fiscal year ended December 31, 2019 (January 1―December 31, 2019)
Millions of yen
Shareholders’ equity
Capital stock Capital surplus Retained earnings Treasury shares Total shareholders’
equity
Balance at beginning of current period 85,797 74,663 572,707 (727) 732,440
Cumulative effects of changes in
accounting policies (10,004) (10,004)
Restated balance 85,797 74,663 562,703 (727) 722,435
Changes of items during period
Issuance of new shares 107 107 215
Dividends of surplus (31,439) (31,439)
Net income attributable to owners of
parent 75,736 75,736
Change in treasury shares of parent
arising from transactions with
non-controlling shareholders
(0) (0)
Purchase of treasury shares (5) (5)
Disposal of treasury shares -
Net changes of items other than
shareholders’ equity
Total changes of items during period 107 107 44,297 (5) 44,507
Balance at end of current period 85,905 74,770 607,000 (733) 766,943
Millions of yen
Other accumulated comprehensive income
Non-
controlling interests Total net assets
Valuation
difference
on available-
for-sale
securities
Revaluation
reserve for
land
Foreign
currency
translation
adjustment
Remeasure-
ments of
defined
benefit plans
Total
accumulated
other
comprehen-
sive income
Balance at beginning of current period 35,210 10,412 (118,281) (2,307) (74,965) 38,268 695,743
Cumulative effects of changes in
accounting policies (10,004)
Restated balance 35,210 10,412 (118,281) (2,307) (74,965) 38,268 685,738
Changes of items during period
Issuance of new shares 215
Dividends of surplus (31,439)
Net income attributable to owners of
parent 75,736
Change in treasury shares of parent
arising from transactions with
non-controlling shareholders
(0)
Purchase of treasury shares (5)
Disposal of treasury shares -
Net changes of items other than
shareholders’ equity 9,974 15 (1,166) 4,432 13,255 8,326 21,582
Total changes of items during period 9,974 15 (1,166) 4,432 13,255 8,326 66,089
Balance at end of current period 45,184 10,428 (119,447) 2,125 (61,709) 46,594 751,828
16
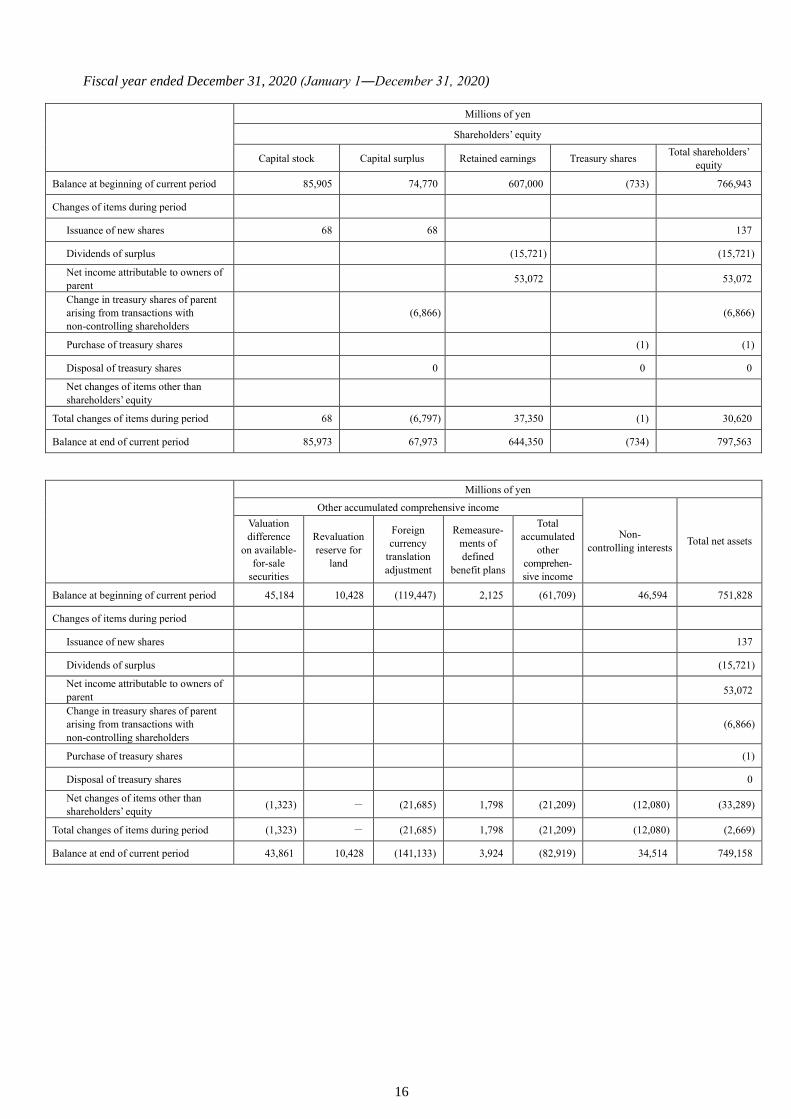
Fiscal year ended December 31, 2020 (January 1―December 31, 2020)
Millions of yen
Shareholders’ equity
Capital stock Capital surplus Retained earnings Treasury shares Total shareholders’
equity
Balance at beginning of current period 85,905 74,770 607,000 (733) 766,943
Changes of items during period
Issuance of new shares 68 68 137
Dividends of surplus (15,721) (15,721)
Net income attributable to owners of
parent 53,072 53,072
Change in treasury shares of parent
arising from transactions with
non-controlling shareholders
(6,866) (6,866)
Purchase of treasury shares (1) (1)
Disposal of treasury shares 0 0 0
Net changes of items other than
shareholders’ equity
Total changes of items during period 68 (6,797) 37,350 (1) 30,620
Balance at end of current period 85,973 67,973 644,350 (734) 797,563
Millions of yen
Other accumulated comprehensive income
Non-
controlling interests Total net assets
Valuation
difference
on available-
for-sale
securities
Revaluation
reserve for
land
Foreign
currency
translation
adjustment
Remeasure-
ments of
defined
benefit plans
Total
accumulated
other
comprehen-
sive income
Balance at beginning of current period 45,184 10,428 (119,447) 2,125 (61,709) 46,594 751,828
Changes of items during period
Issuance of new shares 137
Dividends of surplus (15,721)
Net income attributable to owners of
parent 53,072
Change in treasury shares of parent
arising from transactions with
non-controlling shareholders
(6,866)
Purchase of treasury shares (1)
Disposal of treasury shares 0
Net changes of items other than
shareholders’ equity (1,323) - (21,685) 1,798 (21,209) (12,080) (33,289)
Total changes of items during period (1,323) - (21,685) 1,798 (21,209) (12,080) (2,669)
Balance at end of current period 43,861 10,428 (141,133) 3,924 (82,919) 34,514 749,158
17
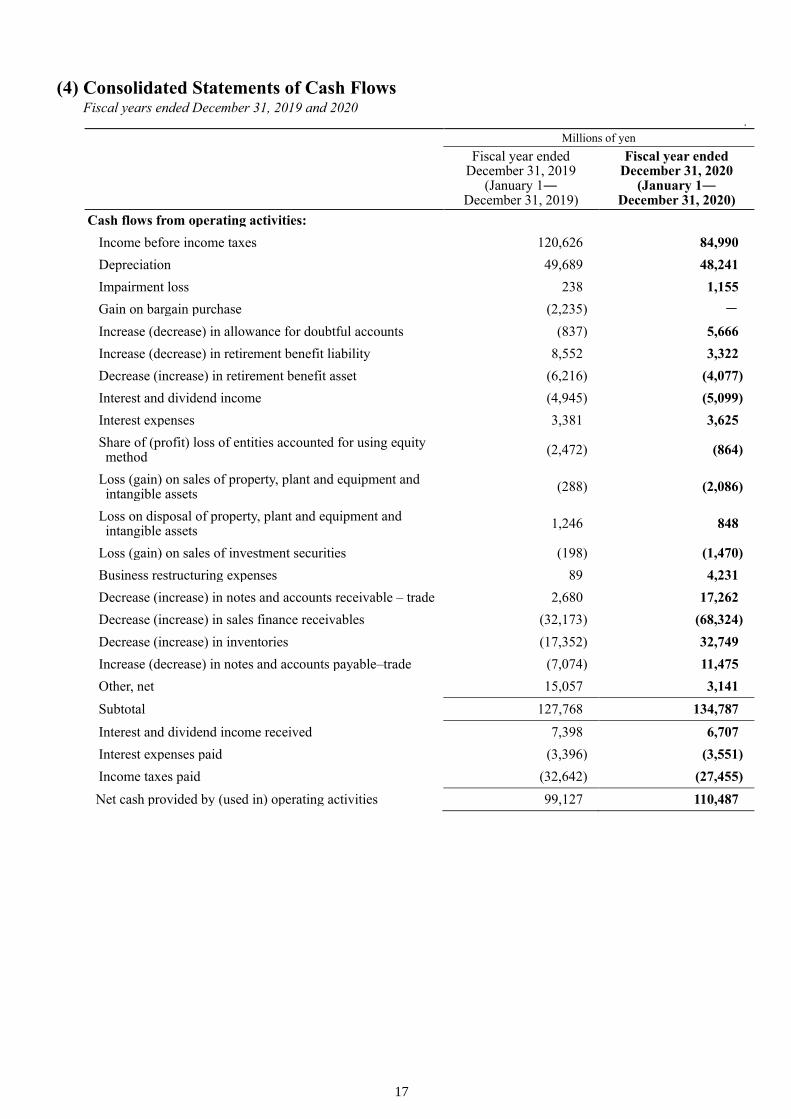
(4) Consolidated Statements of Cash Flows Fiscal years ended December 31, 2019 and 2020
.
Millions of yen
Fiscal year ended December 31, 2019
(January 1― December 31, 2019)
Fiscal year ended December 31, 2020
(January 1― December 31, 2020)
Cash flows from operating activities:
Income before income taxes 120,626 84,990
Depreciation 49,689 48,241
Impairment loss 238 1,155
Gain on bargain purchase (2,235) -
Increase (decrease) in allowance for doubtful accounts (837) 5,666
Increase (decrease) in retirement benefit liability 8,552 3,322
Decrease (increase) in retirement benefit asset (6,216) (4,077)
Interest and dividend income (4,945) (5,099)
Interest expenses 3,381 3,625
Share of (profit) loss of entities accounted for using equity method
(2,472) (864)
Loss (gain) on sales of property, plant and equipment and intangible assets
(288) (2,086)
Loss on disposal of property, plant and equipment and intangible assets
1,246 848
Loss (gain) on sales of investment securities (198) (1,470)
Business restructuring expenses 89 4,231
Decrease (increase) in notes and accounts receivable – trade 2,680 17,262
Decrease (increase) in sales finance receivables (32,173) (68,324)
Decrease (increase) in inventories (17,352) 32,749
Increase (decrease) in notes and accounts payable–trade (7,074) 11,475
Other, net 15,057 3,141
Subtotal 127,768 134,787
Interest and dividend income received 7,398 6,707
Interest expenses paid (3,396) (3,551)
Income taxes paid (32,642) (27,455)
Net cash provided by (used in) operating activities 99,127 110,487
18
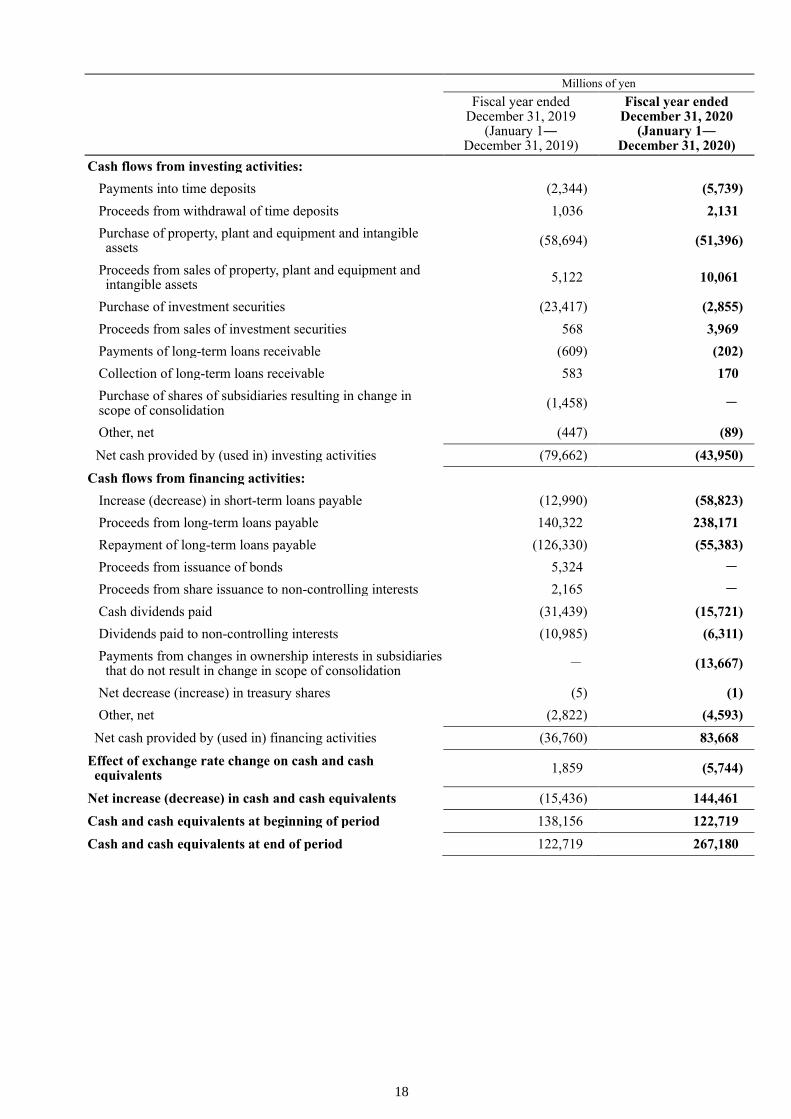
Millions of yen
Fiscal year ended December 31, 2019
(January 1― December 31, 2019)
Fiscal year ended December 31, 2020
(January 1― December 31, 2020)
Cash flows from investing activities:
Payments into time deposits (2,344) (5,739)
Proceeds from withdrawal of time deposits 1,036 2,131
Purchase of property, plant and equipment and intangible assets
(58,694) (51,396)
Proceeds from sales of property, plant and equipment and intangible assets
5,122 10,061
Purchase of investment securities (23,417) (2,855)
Proceeds from sales of investment securities 568 3,969
Payments of long-term loans receivable (609) (202)
Collection of long-term loans receivable 583 170
Purchase of shares of subsidiaries resulting in change in scope of consolidation
(1,458) -
Other, net (447) (89)
Net cash provided by (used in) investing activities (79,662) (43,950)
Cash flows from financing activities:
Increase (decrease) in short-term loans payable (12,990) (58,823)
Proceeds from long-term loans payable 140,322 238,171
Repayment of long-term loans payable (126,330) (55,383)
Proceeds from issuance of bonds 5,324 -
Proceeds from share issuance to non-controlling interests 2,165 -
Cash dividends paid (31,439) (15,721)
Dividends paid to non-controlling interests (10,985) (6,311)
Payments from changes in ownership interests in subsidiaries that do not result in change in scope of consolidation
- (13,667)
Net decrease (increase) in treasury shares (5) (1)
Other, net (2,822) (4,593)
Net cash provided by (used in) financing activities (36,760) 83,668
Effect of exchange rate change on cash and cash equivalents
1,859 (5,744)
Net increase (decrease) in cash and cash equivalents (15,436) 144,461
Cash and cash equivalents at beginning of period 138,156 122,719
Cash and cash equivalents at end of period 122,719 267,180
19
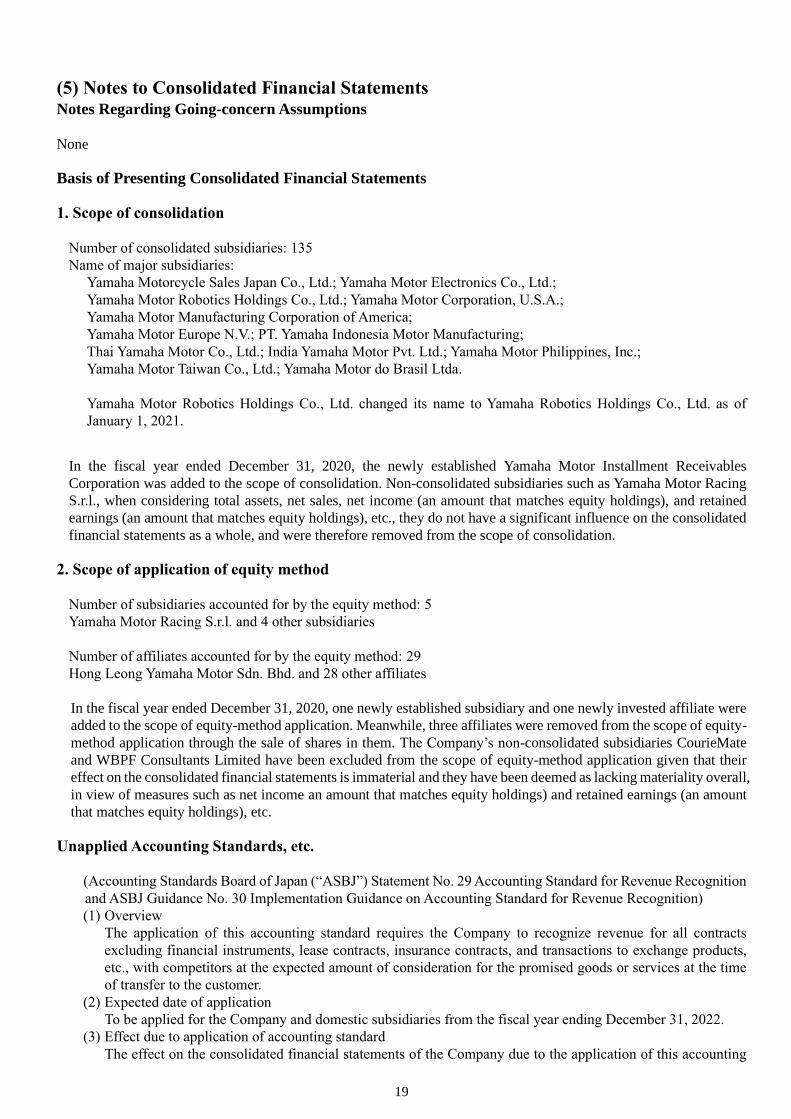
(5) Notes to Consolidated Financial Statements Notes Regarding Going-concern Assumptions
None
Basis of Presenting Consolidated Financial Statements
1. Scope of consolidation
Number of consolidated subsidiaries: 135
Name of major subsidiaries:
Yamaha Motorcycle Sales Japan Co., Ltd.; Yamaha Motor Electronics Co., Ltd.;
Yamaha Motor Robotics Holdings Co., Ltd.; Yamaha Motor Corporation, U.S.A.;
Yamaha Motor Manufacturing Corporation of America;
Yamaha Motor Europe N.V.; PT. Yamaha Indonesia Motor Manufacturing;
Thai Yamaha Motor Co., Ltd.; India Yamaha Motor Pvt. Ltd.; Yamaha Motor Philippines, Inc.;
Yamaha Motor Taiwan Co., Ltd.; Yamaha Motor do Brasil Ltda.
Yamaha Motor Robotics Holdings Co., Ltd. changed its name to Yamaha Robotics Holdings Co., Ltd. as of
January 1, 2021.
In the fiscal year ended December 31, 2020, the newly established Yamaha Motor Installment Receivables
Corporation was added to the scope of consolidation. Non-consolidated subsidiaries such as Yamaha Motor Racing
S.r.l., when considering total assets, net sales, net income (an amount that matches equity holdings), and retained
earnings (an amount that matches equity holdings), etc., they do not have a significant influence on the consolidated
financial statements as a whole, and were therefore removed from the scope of consolidation.
2. Scope of application of equity method
Number of subsidiaries accounted for by the equity method: 5
Yamaha Motor Racing S.r.l. and 4 other subsidiaries
Number of affiliates accounted for by the equity method: 29
Hong Leong Yamaha Motor Sdn. Bhd. and 28 other affiliates
In the fiscal year ended December 31, 2020, one newly established subsidiary and one newly invested affiliate were
added to the scope of equity-method application. Meanwhile, three affiliates were removed from the scope of equity-
method application through the sale of shares in them. The Company’s non-consolidated subsidiaries CourieMate
and WBPF Consultants Limited have been excluded from the scope of equity-method application given that their
effect on the consolidated financial statements is immaterial and they have been deemed as lacking materiality overall,
in view of measures such as net income an amount that matches equity holdings) and retained earnings (an amount
that matches equity holdings), etc.
Unapplied Accounting Standards, etc.
(Accounting Standards Board of Japan (“ASBJ”) Statement No. 29 Accounting Standard for Revenue Recognition
and ASBJ Guidance No. 30 Implementation Guidance on Accounting Standard for Revenue Recognition)
(1) Overview
The application of this accounting standard requires the Company to recognize revenue for all contracts
excluding financial instruments, lease contracts, insurance contracts, and transactions to exchange products,
etc., with competitors at the expected amount of consideration for the promised goods or services at the time
of transfer to the customer.
(2) Expected date of application
To be applied for the Company and domestic subsidiaries from the fiscal year ending December 31, 2022.
(3) Effect due to application of accounting standard
The effect on the consolidated financial statements of the Company due to the application of this accounting
20
standard is under evaluation.
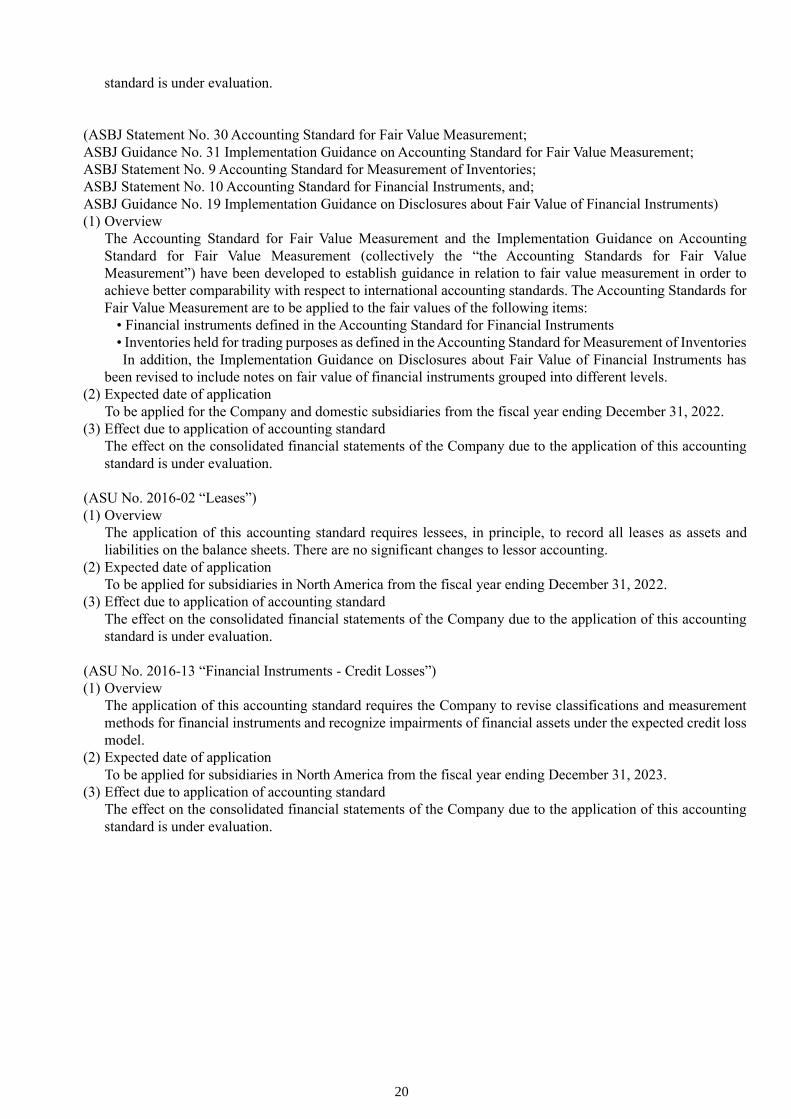
(ASBJ Statement No. 30 Accounting Standard for Fair Value Measurement;
ASBJ Guidance No. 31 Implementation Guidance on Accounting Standard for Fair Value Measurement;
ASBJ Statement No. 9 Accounting Standard for Measurement of Inventories;
ASBJ Statement No. 10 Accounting Standard for Financial Instruments, and;
ASBJ Guidance No. 19 Implementation Guidance on Disclosures about Fair Value of Financial Instruments)
(1) Overview
The Accounting Standard for Fair Value Measurement and the Implementation Guidance on Accounting
Standard for Fair Value Measurement (collectively the “the Accounting Standards for Fair Value
Measurement”) have been developed to establish guidance in relation to fair value measurement in order to
achieve better comparability with respect to international accounting standards. The Accounting Standards for
Fair Value Measurement are to be applied to the fair values of the following items:
• Financial instruments defined in the Accounting Standard for Financial Instruments
• Inventories held for trading purposes as defined in the Accounting Standard for Measurement of Inventories
In addition, the Implementation Guidance on Disclosures about Fair Value of Financial Instruments has
been revised to include notes on fair value of financial instruments grouped into different levels.
(2) Expected date of application
To be applied for the Company and domestic subsidiaries from the fiscal year ending December 31, 2022.
(3) Effect due to application of accounting standard
The effect on the consolidated financial statements of the Company due to the application of this accounting
standard is under evaluation.
(ASU No. 2016-02 “Leases”)
(1) Overview
The application of this accounting standard requires lessees, in principle, to record all leases as assets and
liabilities on the balance sheets. There are no significant changes to lessor accounting.
(2) Expected date of application
To be applied for subsidiaries in North America from the fiscal year ending December 31, 2022.
(3) Effect due to application of accounting standard
The effect on the consolidated financial statements of the Company due to the application of this accounting
standard is under evaluation.
(ASU No. 2016-13 “Financial Instruments - Credit Losses”)
(1) Overview
The application of this accounting standard requires the Company to revise classifications and measurement
methods for financial instruments and recognize impairments of financial assets under the expected credit loss
model.
(2) Expected date of application
To be applied for subsidiaries in North America from the fiscal year ending December 31, 2023.
(3) Effect due to application of accounting standard
The effect on the consolidated financial statements of the Company due to the application of this accounting
standard is under evaluation.

21
Changes in Presentation Method
(Consolidated Statements of Cash Flows)
“Loss (gain) on sales of investment securities” and “business restructuring expenses,” which were included in
“other, net” under “cash flows from operating activities” in the previous fiscal year are stated separately from the
fiscal year ended December 31, 2020, due to their increased monetary significance. In order to reflect this change
in presentation method, a reclassification was made to the consolidated financial statements for the fiscal year
ended December 31, 2019.
As a result, ¥14,948 million stated as “other, net” under “cash flows from operating activities” in the consolidated
statements of cash flows in the fiscal year ended December 31, 2019, is reclassified as ¥(198) million in “loss
(gain) on sales of investment securities,” ¥89 million in “business restructuring expenses” and ¥15,057 million in
“other, net.”
Additional Information
(Review of the recoverability of deferred tax assets)
Although prospects for containment of COVID-19 are still uncertain, in light of the most recent production and
sales activities, the recoverability of deferred tax assets has been assessed on the assumption that the effects of
COVID-19 in the future would be limited. As a result, deferred tax assets of ¥25,031 million and income taxes -
deferred of ¥1,460 million have been recorded in the fiscal year ended December 31, 2020.
Segment Information, etc.
1. Overview of reporting segments
The Group’s reporting segments are regularly reviewed by the Board of Directors of the Company, etc., using the
segregated financial information available within each segment of the Group to determine the allocation of
management resources and evaluate business results.
Four businesses, namely “Land mobility,” “Marine products,” “Robotics,” and “Financial services” constitute the
Group’s reporting segments based on similarities of product type and target market.
Effective January 1, 2020, the Company revised business administration categories with the aim of accelerating
the development of the latest automobile-related technologies including electrification and optimization of
development resource allocation. Accordingly, from the fiscal year ended December 31, 2020, the Company revised
business administration categories, and businesses related to automobile engines and automobile components, which
were previously included in “Others,” have been separated and integrated into “Land mobility” and “Marine
products.”
Classifications after the change have been applied to segment information for the fiscal year ended December 31,
2019 (January 1, 2019 through December 31, 2019).
22
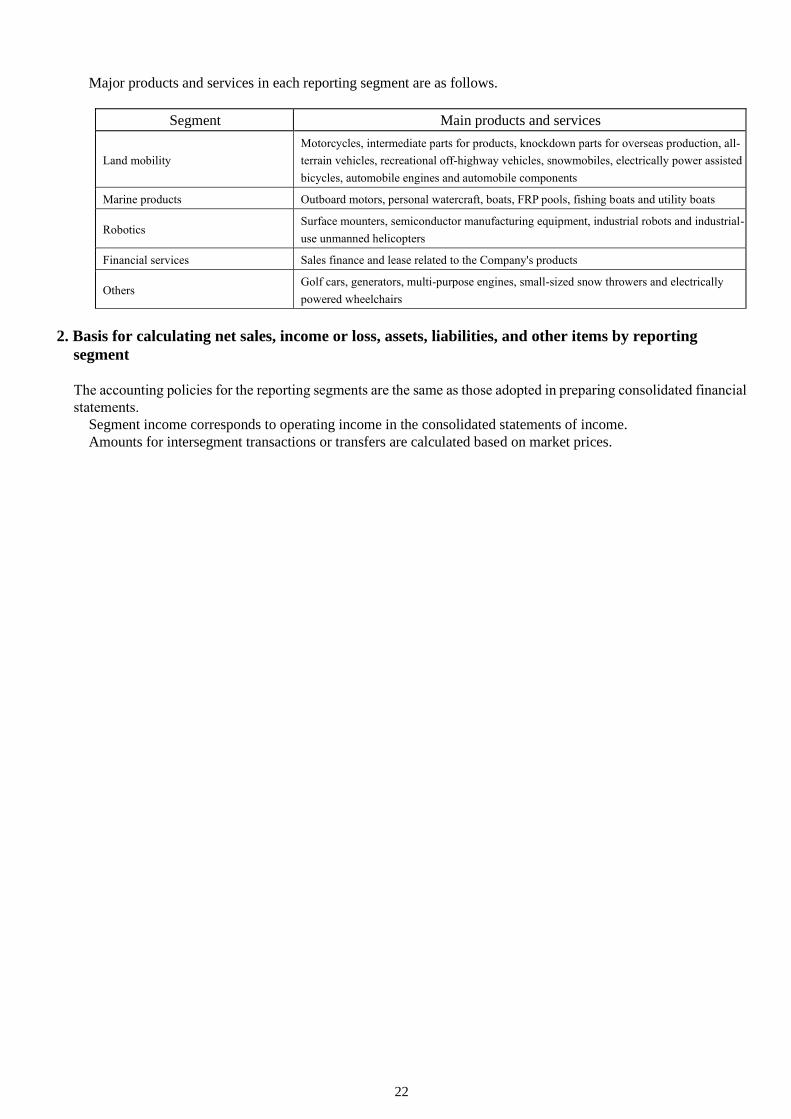
Major products and services in each reporting segment are as follows.
Segment Main products and services
Land mobility
Motorcycles, intermediate parts for products, knockdown parts for overseas production, all-
terrain vehicles, recreational off-highway vehicles, snowmobiles, electrically power assisted
bicycles, automobile engines and automobile components
Marine products Outboard motors, personal watercraft, boats, FRP pools, fishing boats and utility boats
Robotics Surface mounters, semiconductor manufacturing equipment, industrial robots and industrial-
use unmanned helicopters
Financial services Sales finance and lease related to the Company's products
Others Golf cars, generators, multi-purpose engines, small-sized snow throwers and electrically
powered wheelchairs
2. Basis for calculating net sales, income or loss, assets, liabilities, and other items by reporting
segment
The accounting policies for the reporting segments are the same as those adopted in preparing consolidated financial
statements.
Segment income corresponds to operating income in the consolidated statements of income.
Amounts for intersegment transactions or transfers are calculated based on market prices.
23
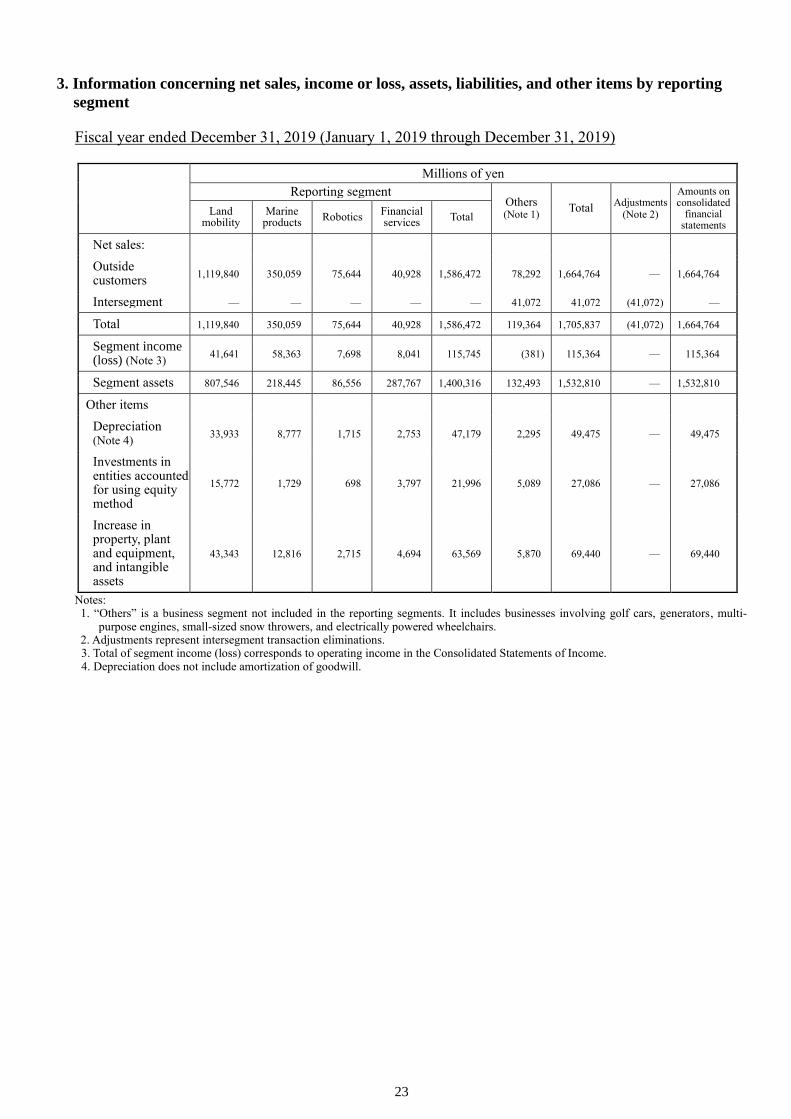
3. Information concerning net sales, income or loss, assets, liabilities, and other items by reporting
segment Fiscal year ended December 31, 2019 (January 1, 2019 through December 31, 2019)
Millions of yen
Reporting segment Others (Note 1)
Total Adjustments
(Note 2)
Amounts on consolidated
financial statements
Land mobility
Marine products
Robotics Financial services
Total
Net sales:
Outside customers
1,119,840 350,059 75,644 40,928 1,586,472 78,292 1,664,764 — 1,664,764
Intersegment — — — — — 41,072 41,072 (41,072) —
Total 1,119,840 350,059 75,644 40,928 1,586,472 119,364 1,705,837 (41,072) 1,664,764
Segment income (loss) (Note 3)
41,641 58,363 7,698 8,041 115,745 (381) 115,364 — 115,364
Segment assets 807,546 218,445 86,556 287,767 1,400,316 132,493 1,532,810 — 1,532,810
Other items
Depreciation (Note 4)
33,933 8,777 1,715 2,753 47,179 2,295 49,475 — 49,475
Investments in entities accounted for using equity method
15,772 1,729 698 3,797 21,996 5,089 27,086 — 27,086
Increase in property, plant and equipment, and intangible assets
43,343 12,816 2,715 4,694 63,569 5,870 69,440 — 69,440
Notes: 1. “Others” is a business segment not included in the reporting segments. It includes businesses involving golf cars, generators, multi-
purpose engines, small-sized snow throwers, and electrically powered wheelchairs. 2. Adjustments represent intersegment transaction eliminations. 3. Total of segment income (loss) corresponds to operating income in the Consolidated Statements of Income. 4. Depreciation does not include amortization of goodwill.
24
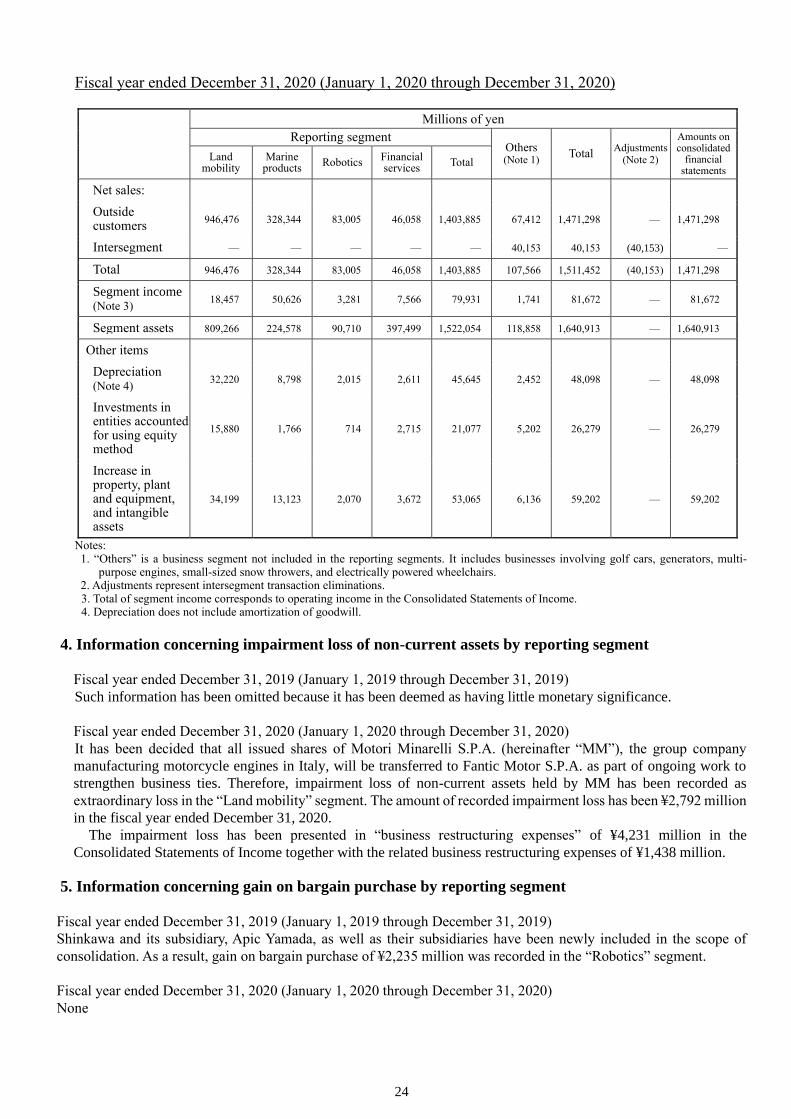
Fiscal year ended December 31, 2020 (January 1, 2020 through December 31, 2020)
Millions of yen
Reporting segment Others (Note 1)
Total Adjustments
(Note 2)
Amounts on consolidated
financial statements
Land mobility
Marine products
Robotics Financial services
Total
Net sales:
Outside customers
946,476 328,344 83,005 46,058 1,403,885 67,412 1,471,298 — 1,471,298
Intersegment — — — — — 40,153 40,153 (40,153) —
Total 946,476 328,344 83,005 46,058 1,403,885 107,566 1,511,452 (40,153) 1,471,298
Segment income (Note 3)
18,457 50,626 3,281 7,566 79,931 1,741 81,672 — 81,672
Segment assets 809,266 224,578 90,710 397,499 1,522,054 118,858 1,640,913 — 1,640,913
Other items
Depreciation (Note 4)
32,220 8,798 2,015 2,611 45,645 2,452 48,098 — 48,098
Investments in entities accounted for using equity method
15,880 1,766 714 2,715 21,077 5,202 26,279 — 26,279
Increase in property, plant and equipment, and intangible assets
34,199 13,123 2,070 3,672 53,065 6,136 59,202 — 59,202
Notes: 1. “Others” is a business segment not included in the reporting segments. It includes businesses involving golf cars, generators, multi-
purpose engines, small-sized snow throwers, and electrically powered wheelchairs. 2. Adjustments represent intersegment transaction eliminations. 3. Total of segment income corresponds to operating income in the Consolidated Statements of Income. 4. Depreciation does not include amortization of goodwill.
4. Information concerning impairment loss of non-current assets by reporting segment
Fiscal year ended December 31, 2019 (January 1, 2019 through December 31, 2019)
Such information has been omitted because it has been deemed as having little monetary significance.
Fiscal year ended December 31, 2020 (January 1, 2020 through December 31, 2020)
It has been decided that all issued shares of Motori Minarelli S.P.A. (hereinafter “MM”), the group company
manufacturing motorcycle engines in Italy, will be transferred to Fantic Motor S.P.A. as part of ongoing work to
strengthen business ties. Therefore, impairment loss of non-current assets held by MM has been recorded as
extraordinary loss in the “Land mobility” segment. The amount of recorded impairment loss has been ¥2,792 million
in the fiscal year ended December 31, 2020.
The impairment loss has been presented in “business restructuring expenses” of ¥4,231 million in the
Consolidated Statements of Income together with the related business restructuring expenses of ¥1,438 million.
5. Information concerning gain on bargain purchase by reporting segment
Fiscal year ended December 31, 2019 (January 1, 2019 through December 31, 2019)
Shinkawa and its subsidiary, Apic Yamada, as well as their subsidiaries have been newly included in the scope of
consolidation. As a result, gain on bargain purchase of ¥2,235 million was recorded in the “Robotics” segment.
Fiscal year ended December 31, 2020 (January 1, 2020 through December 31, 2020)
None

25
Per Share Information
Fiscal year ended
December 31, 2019 (January 1—December 31,
2019)
Fiscal year ended
December 31, 2020 (January 1—December 31,
2020)
Yen Yen
Net assets per share 2,018.84 2,045.15
Earnings per share ― basic 216.83 151.89
Note 1. Earnings per share ― diluted is not shown as there are no dilutive securities.
Note 2. Net assets per share are calculated based on the following: (Millions of yen otherwise noted)
As of December 31, 2019 As of December 31, 2020
Total net assets 751,828 749,158
Amount excluded from total net assets 46,594 34,514
Non-controlling interests 46,594 34,514
Net assets attributable to common stock at end of period 705,233 714,644
Number of shares of common stock outstanding at end of period calculated under “Net assets per share” (Shares)
349,327,063 349,433,015
Note 3. Earnings per share ― basic is calculated based on the following:
(Millions of yen otherwise noted)
Fiscal year ended
December 31, 2019 (January 1—December 31,
2019)
Fiscal year ended
December 31, 2020 (January 1—December 31,
2020)
Net income attributable to owners of parent 75,736 53,072
Amount not attributable to common shareholders ― ―
Net income attributable to owners of parent attributable to common stock
75,736 53,072
Average number of shares outstanding during period (Shares) 349,297,918 349,400,240
Significant Subsequent Events None


![Consolidated Financial Results Fiscal Year ended … · May 14, 2018 Consolidated Financial Results Fiscal Year ended March 31, 2018 [IFRS] April 1, 2017 – March 31, 2018 Konica](https://static.documents.pub/doc/80x56/5b96242c09d3f2de4a8ce6bd/consolidated-financial-results-fiscal-year-ended-may-14-2018-consolidated-financial.jpg)
