
CAE INC.
CONSOLIDATED FINANCIAL STATEMENTS
Management’s Report on Internal Control Over Financial Reporting 1
Report of Independent Registered Public Accounting Firm 2
Consolidated Financial Statements
Consolidated Statement of Financial Position 3
Consolidated Income Statement 4
Consolidated Statement of Comprehensive Income 5
Consolidated Statement of Changes in Equity 6
Consolidated Statement of Cash Flows 7
Notes to the Consolidated Financial Statements
Note 1 – Nature of Operations and Summary of Significant Accounting Policies 8
Note 2 – Changes in Accounting Policies 19
Note 3 – Net Assets Held for Sale and Discontinued Operations 20
Note 4 – Accounts Receivable 21
Note 5 – Inventories 21
Note 6 – Property, Plant and Equipment 22
Note 7 – Intangible Assets 23
Note 8 – Other Assets 24
Note 9 – Accounts Payable and Accrued Liabilities 24
Note 10 – Contracts in Progress 25
Note 11 – Provisions 25
Note 12 – Debt Facilities 26
Note 13 – Government Assistance 28
Note 14 – Employee Benefits Obligations 29
Note 15 – Deferred Gains and Other Non-Current Liabilities 32
Note 16 – Income Taxes 33
Note 17 – Share Capital, Earnings per Share and Dividends 35
Note 18 – Accumulated Other Comprehensive Income 36
Note 19 – Employee Compensation 36
Note 20 – Impairment of Non-Financial Assets 36
Note 21 – Other Gains – Net 37
Note 22 – Finance Expense – Net 37
Note 23 – Share-Based Payments 37
Note 24 – Supplementary Cash Flows Information 42
Note 25 – Contingencies 42
Note 26 – Commitments 42
Note 27 – Capital Risk Management 43
Note 28 – Fair Value of Financial Instruments 43
Note 29 – Financial Risk Management 46
Note 30 – Operating Segments and Geographic Information 51
Note 31 – Related Party Relationships 53
Note 32 – Related Party Transactions 56
1 | CAE Year-End Financial Results 2015
Management’s Report on Internal Control Over Financial Reporting Management of CAE is responsible for establishing and maintaining adequate internal control over financial reporting (as defined in Rule 13a-15(f), 15d-15(f) under the Securities Exchange Act of 1934). CAE’s internal control over financial reporting is a process designed under the supervision of CAE’s President and Chief Executive Officer and Chief Financial Officer to provide reasonable assurance regarding the reliability of financial reporting and the preparation of the Company’s consolidated financial statements for external reporting purposes in accordance with IFRS, as issued by the International Accounting Standards Board (IASB). As of March 31, 2015, management conducted an assessment of the effectiveness of the Company’s internal control over the financial reporting based on the framework and criteria established by the Committee of Sponsoring Organizations of the Treadway Commission (COSO) on Internal Control – Integrated Framework (2013 Framework). Based on this assessment, management concluded that the Company’s internal control over financial reporting as of March 31, 2015 was effective. M. Parent S. Lefebvre President and Chief Executive Officer Vice-president, Finance and Chief Financial Officer Montreal (Canada) May 26, 2015
CAE Year-End Financial Results 2015 | 2
Report of Independent Registered Public Accounting Firm To the Shareholders of CAE Inc. We have audited the accompanying consolidated statement of financial position of CAE Inc. and its subsidiaries as of March 31, 2015 and March 31, 2014 and the related consolidated income statement, statement of comprehensive income, statement of changes in equity, and statement of cash flows for the years then ended. We also have audited CAE Inc. and its subsidiaries’ internal control over financial reporting as of March 31, 2015 , based on criteria established in Internal Control - Integrated Framework (2013) issued by the Committee of Sponsoring Organizations of the Treadway Commission (COSO). Management is responsible for these consolidated financial statements, for maintaining effective internal control over financial reporting, and for its assessment of the effectiveness of internal control over financial reporting, included in the accompanying Management’s Report on Internal Control over Financial Reporting. Our responsibility is to express an opinion on these consolidated financial statements and an opinion on the company’s internal control over financial reporting based on our integrated audits. We conducted our audits in accordance with the standards of the Public Company Accounting Oversight Board (United States). Those standards require that we plan and perform the audit to obtain reasonable assurance about whether the consolidated financial statements are free of material misstatement and whether effective internal control over financial reporting was maintained in all material respects. Our audits of the consolidated financial statements included examining, on a test basis, evidence supporting the amounts and disclosures in the consolidated financial statements, assessing the accounting principles used and significant estimates made by management, and evaluating the overall consolidated financial statement presentation. Our audit of internal control over financial reporting included obtaining an understanding of internal control over financial reporting, assessing the risk that a material weakness exists, and testing and evaluating the design and operating effectiveness of internal control based on the assessed risk. Our audits also included performing such other procedures as we considered necessary in the circumstances. We believe that our audits provide a reasonable basis for our opinions. A company’s internal control over financial reporting is a process designed to provide reasonable assurance regarding the reliability of financial reporting and the preparation of financial statements for external purposes in accordance with generally accepted accounting principles. A company’s internal control over financial reporting includes those policies and procedures that: (i) pertain to the maintenance of records that, in reasonable detail, accurately and fairly reflect the transactions and dispositions of the assets of the company; (ii) provide reasonable assurance that transactions are recorded as necessary to permit preparation of financial statements in accordance with generally accepted accounting principles, and that receipts and expenditures of the company are being made only in accordance with authorizations of management and directors of the company; and (iii) provide reasonable assurance regarding prevention or timely detection of unauthorized acquisition, use, or disposition of the company’s assets that could have a material effect on the financial statements. Because of its inherent limitations, internal control over financial reporting may not prevent or detect misstatements. Also, projections of any evaluation of effectiveness to future periods are subject to the risk that controls may become inadequate because of changes in conditions, or that the degree of compliance with the policies or procedures may deteriorate. In our opinion, the consolidated financial statements referred to above present fairly, in all material respects, the financial position of CAE Inc. and its subsidiaries as of March 31, 2015 and March 31, 2014 and the results of their operations and their cash flows for the years then ended in conformity with International Financial Reporting Standards as issued by the International Accounting Standards Board. Also, in our opinion, CAE Inc. and its subsidiaries maintained, in all material respects, effective internal control over financial reporting as of March 31, 2015 , based on criteria established in Internal Control - Integrated Framework (2013) issued by COSO.
1 Montreal, Quebec May 26, 2015
1 CPA auditor, CA, public accountancy permit No. A123498
Consolidated Financial Statements
3 | CAE Year-End Financial Results 2015
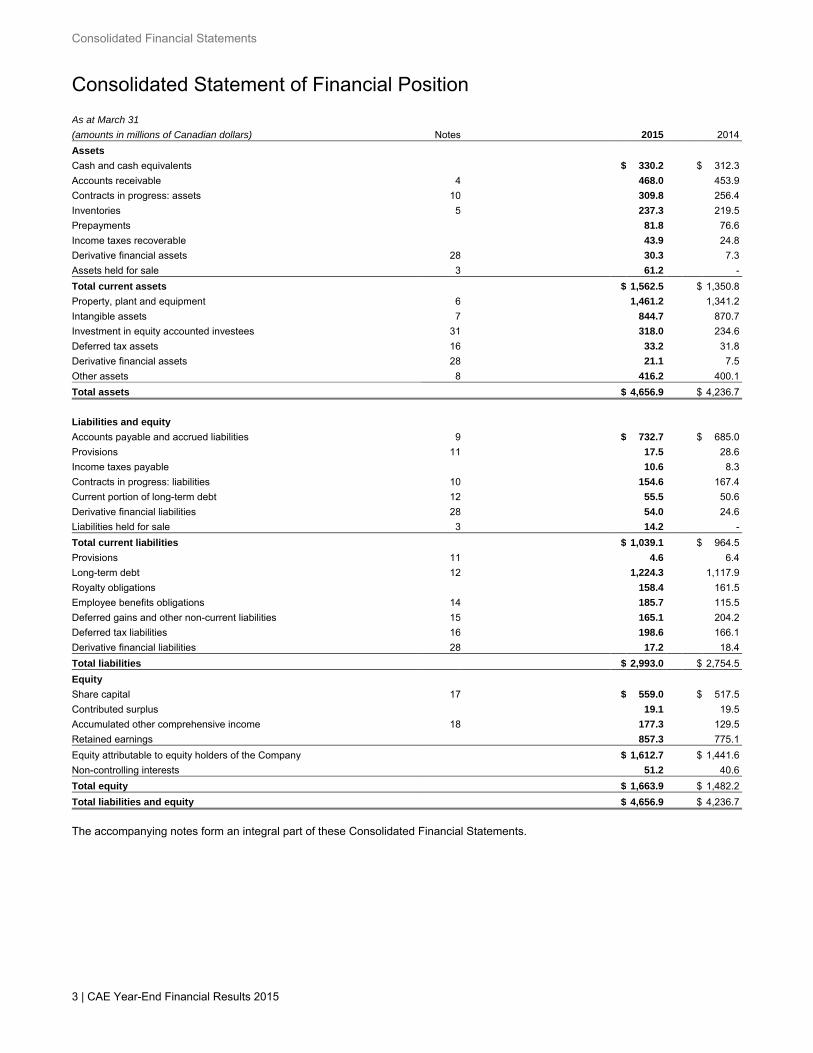
Consolidated Statement of Financial Position
As at March 31 March 31 March 31
(amounts in millions of Canadian dollars) Notes 2015 2014
Assets
Cash and cash equivalents $ 330.2 $ 312.3
Accounts receivable 4 468.0 453.9
Contracts in progress: assets 10 309.8 256.4
Inventories 5 237.3 219.5
Prepayments 81.8 76.6
Income taxes recoverable 43.9 24.8
Derivative financial assets 28 30.3 7.3
Assets held for sale 3 61.2 -
Total current assets $ 1,562.5 $ 1,350.8
Property, plant and equipment 6 1,461.2 1,341.2
Intangible assets 7 844.7 870.7
Investment in equity accounted investees 31 318.0 234.6
Deferred tax assets 16 33.2 31.8
Derivative financial assets 28 21.1 7.5
Other assets 8 416.2 400.1
Total assets $ 4,656.9 $ 4,236.7
Liabilities and equity
Accounts payable and accrued liabilities 9 $ 732.7 $ 685.0
Provisions 11 17.5 28.6
Income taxes payable 10.6 8.3
Contracts in progress: liabilities 10 154.6 167.4
Current portion of long-term debt 12 55.5 50.6
Derivative financial liabilities 28 54.0 24.6
Liabilities held for sale 3 14.2 -
Total current liabilities $ 1,039.1 $ 964.5
Provisions 11 4.6 6.4
Long-term debt 12 1,224.3 1,117.9
Royalty obligations 158.4 161.5
Employee benefits obligations 14 185.7 115.5
Deferred gains and other non-current liabilities 15 165.1 204.2
Deferred tax liabilities 16 198.6 166.1
Derivative financial liabilities 28 17.2 18.4
Total liabilities $ 2,993.0 $ 2,754.5
Equity
Share capital 17 $ 559.0 $ 517.5
Contributed surplus 19.1 19.5
Accumulated other comprehensive income 18 177.3 129.5
Retained earnings 857.3 775.1
Equity attributable to equity holders of the Company $ 1,612.7 $ 1,441.6
Non-controlling interests 51.2 40.6
Total equity $ 1,663.9 $ 1,482.2
Total liabilities and equity $ 4,656.9 $ 4,236.7
The accompanying notes form an integral part of these Consolidated Financial Statements.
Consolidated Financial Statements
CAE Year-End Financial Results 2015 | 4
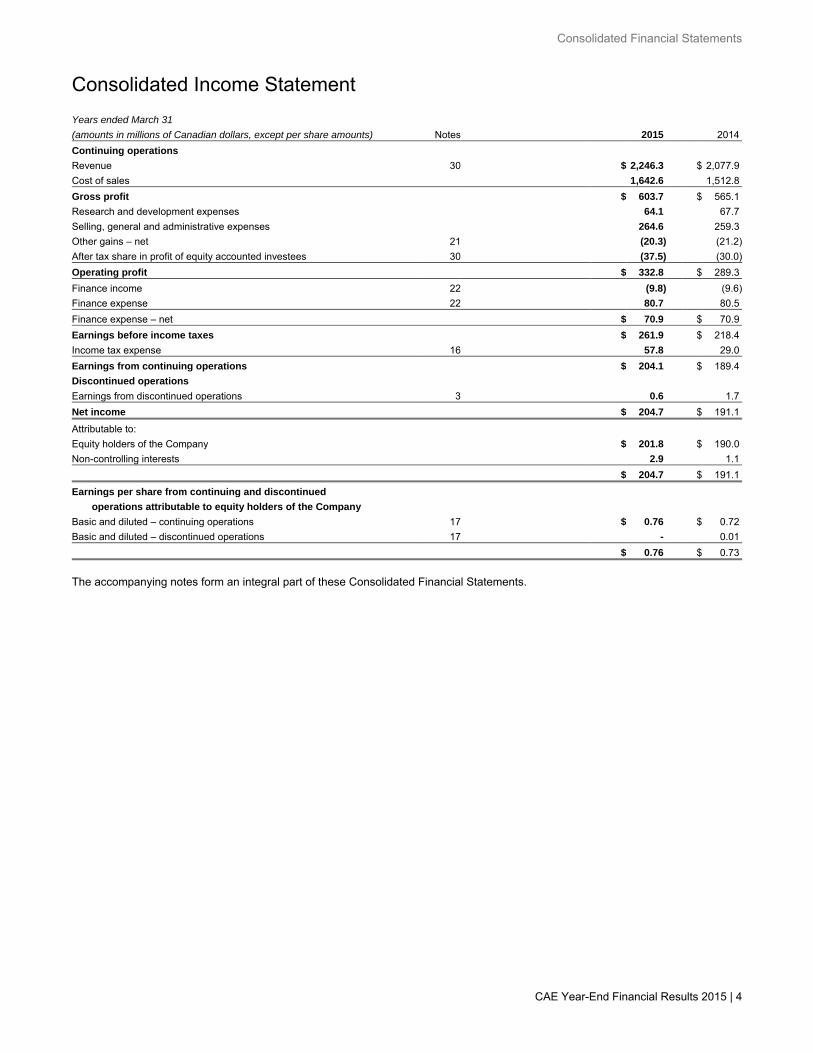
Consolidated Income Statement
Years ended March 31
(amounts in millions of Canadian dollars, except per share amounts) Notes 2015 2014
Continuing operations
Revenue 30 $ 2,246.3 $ 2,077.9
Cost of sales 1,642.6 1,512.8
Gross profit $ 603.7 $ 565.1
Research and development expenses 64.1 67.7
Selling, general and administrative expenses 264.6 259.3
Other gains – net 21 (20.3) (21.2)
After tax share in profit of equity accounted investees 30 (37.5) (30.0)
Operating profit $ 332.8 $ 289.3
Finance income 22 (9.8) (9.6)
Finance expense 22 80.7 80.5
Finance expense – net $ 70.9 $ 70.9
Earnings before income taxes $ 261.9 $ 218.4
Income tax expense 16 57.8 29.0
Earnings from continuing operations $ 204.1 $ 189.4
Discontinued operations
Earnings from discontinued operations 3 0.6 1.7
Net income $ 204.7 $ 191.1
Attributable to:
Equity holders of the Company $ 201.8 $ 190.0
Non-controlling interests 2.9 1.1
$ 204.7 $ 191.1
Earnings per share from continuing and discontinued
operations attributable to equity holders of the Company
Basic and diluted – continuing operations 17 $ 0.76 $ 0.72
Basic and diluted – discontinued operations 17 - 0.01
$ 0.76 $ 0.73
The accompanying notes form an integral part of these Consolidated Financial Statements.
Consolidated Financial Statements
5 | CAE Year-End Financial Results 2015
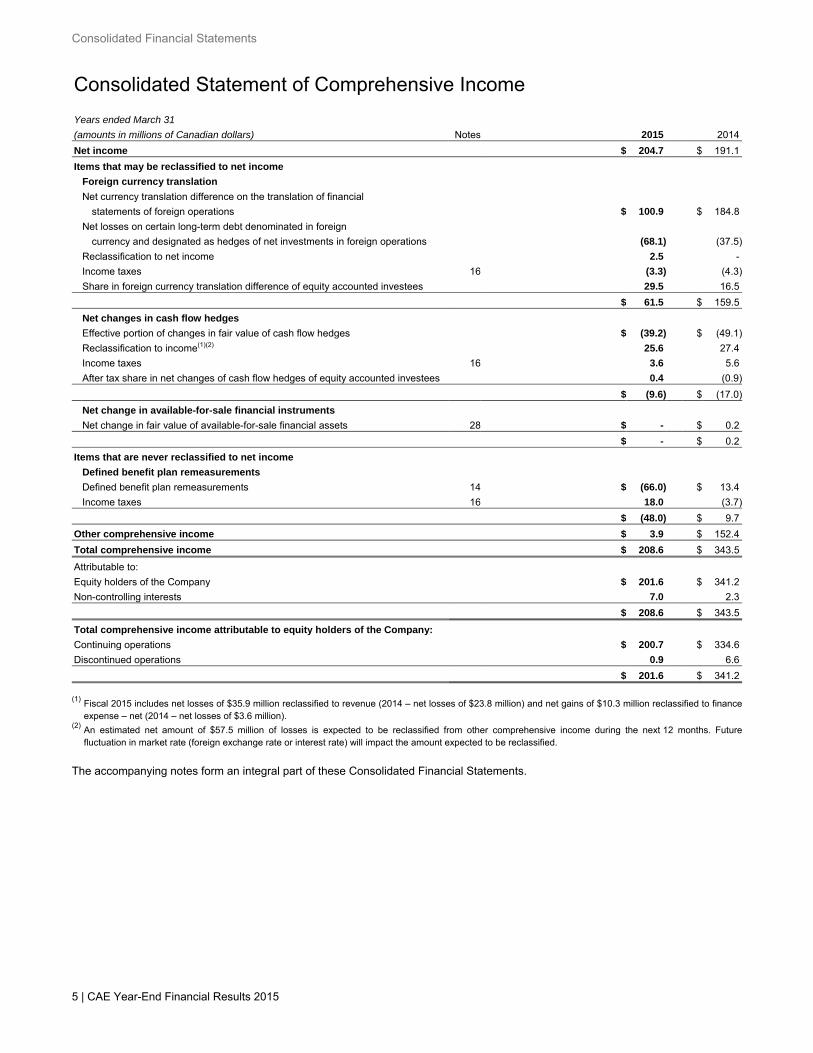
Consolidated Statement of Comprehensive Income Years ended March 31 (amounts in millions of Canadian dollars) Notes 2015 2014 Net income $ 204.7 $ 191.1 Items that may be reclassified to net income
Foreign currency translation
Net currency translation difference on the translation of financial
statements of foreign operations $ 100.9 $ 184.8 Net losses on certain long-term debt denominated in foreign
currency and designated as hedges of net investments in foreign operations (68.1) (37.5) Reclassification to net income 2.5 - Income taxes 16 (3.3) (4.3) Share in foreign currency translation difference of equity accounted investees 29.5 16.5 $ 61.5 $ 159.5 Net changes in cash flow hedges Effective portion of changes in fair value of cash flow hedges $ (39.2) $ (49.1) Reclassification to income(1)(2) 25.6 27.4 Income taxes 16 3.6 5.6 After tax share in net changes of cash flow hedges of equity accounted investees 0.4 (0.9) $ (9.6) $ (17.0) Net change in available-for-sale financial instruments Net change in fair value of available-for-sale financial assets 28 $ - $ 0.2 $ - $ 0.2 Items that are never reclassified to net income Defined benefit plan remeasurements Defined benefit plan remeasurements 14 $ (66.0) $ 13.4 Income taxes 16 18.0 (3.7) $ (48.0) $ 9.7 Other comprehensive income $ 3.9 $ 152.4 Total comprehensive income $ 208.6 $ 343.5 Attributable to: Equity holders of the Company $ 201.6 $ 341.2 Non-controlling interests 7.0 2.3 $ 208.6 $ 343.5 Total comprehensive income attributable to equity holders of the Company: Continuing operations $ 200.7 $ 334.6 Discontinued operations 0.9 6.6 $ 201.6 $ 341.2 (1) Fiscal 2015 includes net losses of $35.9 million reclassified to revenue (2014 – net losses of $23.8 million) and net gains of $10.3 million reclassified to finance
expense – net (2014 – net losses of $3.6 million). (2) An estimated net amount of $57.5 million of losses is expected to be reclassified from other comprehensive income during the next 12 months. Future
fluctuation in market rate (foreign exchange rate or interest rate) will impact the amount expected to be reclassified.
The accompanying notes form an integral part of these Consolidated Financial Statements.
Consolidated Financial Statements
CAE Year-End Financial Results 2015 | 6
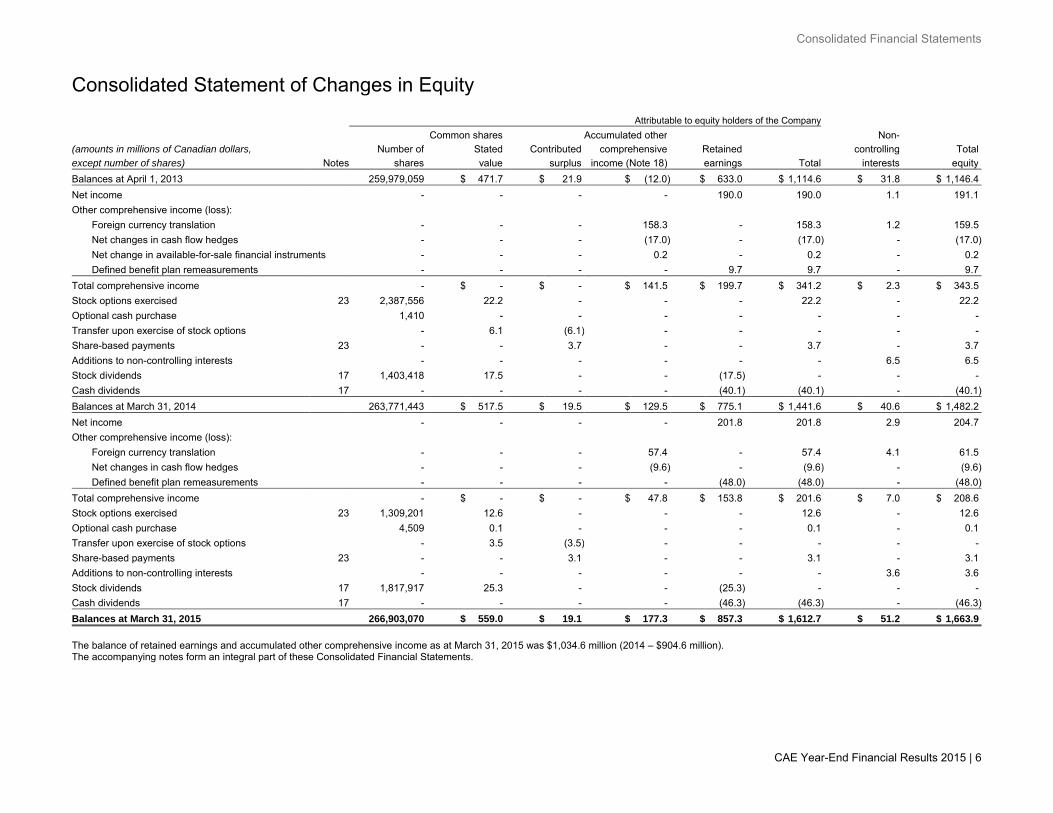
Consolidated Statement of Changes in Equity
Attributable to equity holders of the Company
Year ended March 31, 2014 Common shares Accumulated other Non-
(amounts in millions of Canadian dollars, Number of Stated Contributed comprehensive Retained controlling Total
except number of shares) Notes shares value surplus income (Note 18) earnings Total interests equity
Balances at April 1, 2013 259,979,059 $ 471.7 $ 21.9 $ (12.0) $ 633.0 $ 1,114.6 $ 31.8 $ 1,146.4
Net income - - - - 190.0 190.0 1.1 191.1
Other comprehensive income (loss):
Foreign currency translation - - - 158.3 - 158.3 1.2 159.5
Net changes in cash flow hedges - - - (17.0) - (17.0) - (17.0)
Net change in available-for-sale financial instruments - - - 0.2 - 0.2 - 0.2
Defined benefit plan remeasurements - - - - 9.7 9.7 - 9.7
Total comprehensive income - $ - $ - $ 141.5 $ 199.7 $ 341.2 $ 2.3 $ 343.5
Stock options exercised 23 2,387,556 22.2 - - - 22.2 - 22.2
Optional cash purchase 1,410 - - - - - - -
Transfer upon exercise of stock options - 6.1 (6.1) - - - - -
Share-based payments 23 - - 3.7 - - 3.7 - 3.7
Additions to non-controlling interests - - - - - - 6.5 6.5
Stock dividends 17 1,403,418 17.5 - - (17.5) - - -
Cash dividends 17 - - - - (40.1) (40.1) - (40.1)
Balances at March 31, 2014 263,771,443 $ 517.5 $ 19.5 $ 129.5 $ 775.1 $ 1,441.6 $ 40.6 $ 1,482.2
Net income - - - - 201.8 201.8 2.9 204.7
Other comprehensive income (loss):
Foreign currency translation - - - 57.4 - 57.4 4.1 61.5
Net changes in cash flow hedges - - - (9.6) - (9.6) - (9.6)
Defined benefit plan remeasurements - - - - (48.0) (48.0) - (48.0)
Total comprehensive income - $ - $ - $ 47.8 $ 153.8 $ 201.6 $ 7.0 $ 208.6
Stock options exercised 23 1,309,201 12.6 - - - 12.6 - 12.6
Optional cash purchase 4,509 0.1 - - - 0.1 - 0.1
Transfer upon exercise of stock options - 3.5 (3.5) - - - - -
Share-based payments 23 - - 3.1 - - 3.1 - 3.1
Additions to non-controlling interests - - - - - - 3.6 3.6
Stock dividends 17 1,817,917 25.3 - - (25.3) - - -
Cash dividends 17 - - - - (46.3) (46.3) - (46.3)
Balances at March 31, 2015 266,903,070 $ 559.0 $ 19.1 $ 177.3 $ 857.3 $ 1,612.7 $ 51.2 $ 1,663.9
The balance of retained earnings and accumulated other comprehensive income as at March 31, 2015 was $1,034.6 million (2014 – $904.6 million).The accompanying notes form an integral part of these Consolidated Financial Statements.
Consolidated Financial Statements
7 | CAE Year-End Financial Results 2015
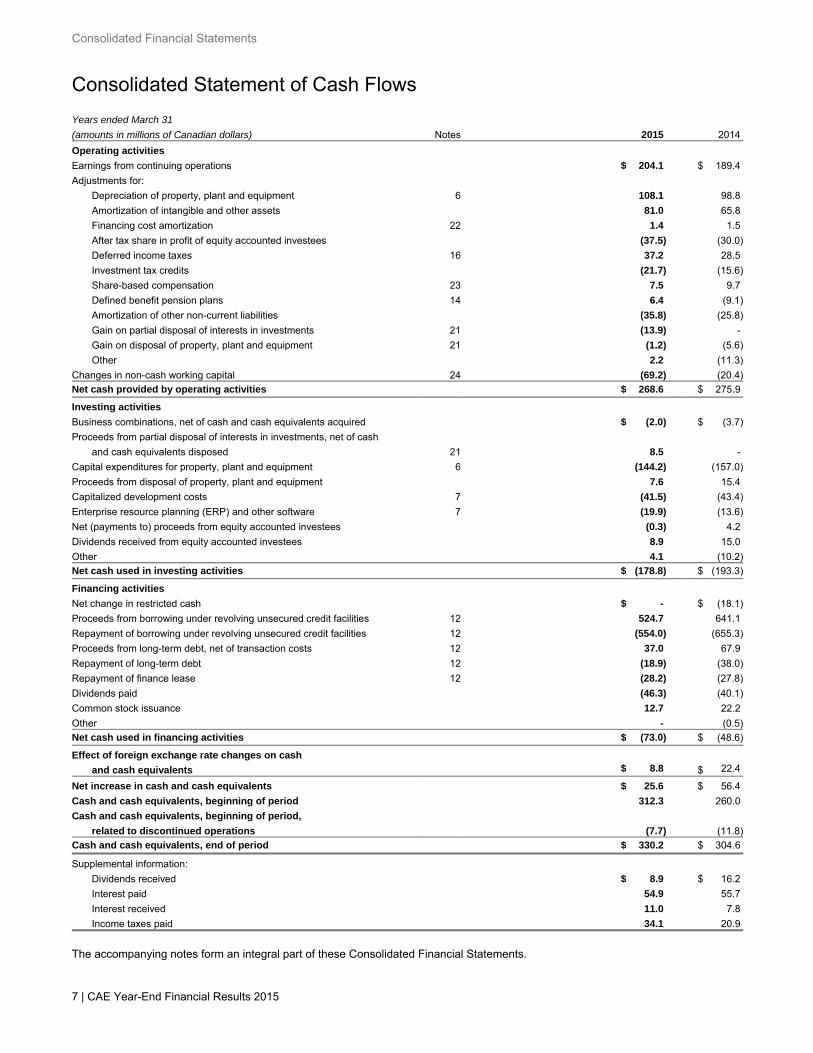
Consolidated Statement of Cash Flows
Years ended March 31
(amounts in millions of Canadian dollars) Notes 2015 2014
Operating activities
Earnings from continuing operations $ 204.1 $ 189.4
Adjustments for:
Depreciation of property, plant and equipment 6 108.1 98.8
Amortization of intangible and other assets 81.0 65.8
Financing cost amortization 22 1.4 1.5
After tax share in profit of equity accounted investees (37.5) (30.0)
Deferred income taxes 16 37.2 28.5
Investment tax credits (21.7) (15.6)
Share-based compensation 23 7.5 9.7
Defined benefit pension plans 14 6.4 (9.1)
Amortization of other non-current liabilities (35.8) (25.8)
Gain on partial disposal of interests in investments 21 (13.9) -
Gain on disposal of property, plant and equipment 21 (1.2) (5.6)
Other 2.2 (11.3)
Changes in non-cash working capital 24 (69.2) (20.4)
Net cash provided by operating activities $ 268.6 $ 275.9
Investing activities
Business combinations, net of cash and cash equivalents acquired $ (2.0) $ (3.7)
Proceeds from partial disposal of interests in investments, net of cash
and cash equivalents disposed 21 8.5 -
Capital expenditures for property, plant and equipment 6 (144.2) (157.0)
Proceeds from disposal of property, plant and equipment 7.6 15.4
Capitalized development costs 7 (41.5) (43.4)
Enterprise resource planning (ERP) and other software 7 (19.9) (13.6)
Net (payments to) proceeds from equity accounted investees (0.3) 4.2
Dividends received from equity accounted investees 8.9 15.0
Other 4.1 (10.2)
Net cash used in investing activities $ (178.8) $ (193.3)
Financing activities
Net change in restricted cash $ - $ (18.1)
Proceeds from borrowing under revolving unsecured credit facilities 12 524.7 641.1
Repayment of borrowing under revolving unsecured credit facilities 12 (554.0) (655.3)
Proceeds from long-term debt, net of transaction costs 12 37.0 67.9
Repayment of long-term debt 12 (18.9) (38.0)
Repayment of finance lease 12 (28.2) (27.8)
Dividends paid (46.3) (40.1)
Common stock issuance 12.7 22.2
Other - (0.5)
Net cash used in financing activities $ (73.0) $ (48.6)
Effect of foreign exchange rate changes on cash and cash equivalents $ 8.8 $ 22.4
Net increase in cash and cash equivalents $ 25.6 $ 56.4
Cash and cash equivalents, beginning of period 312.3 260.0
Cash and cash equivalents, beginning of period,
related to discontinued operations (7.7) (11.8)
Cash and cash equivalents, end of period $ 330.2 $ 304.6
Supplemental information:
Dividends received $ 8.9 $ 16.2
Interest paid 54.9 1 55.7
Interest received 11.0 1 7.8
Income taxes paid 34.1 1 20.9
The accompanying notes form an integral part of these Consolidated Financial Statements.
Notes to the Consolidated Financial Statements
CAE Year-End Financial Results 2015 | 8
Notes to the Consolidated Financial Statements (Unless otherwise stated, all tabular amounts are in millions of Canadian dollars) The consolidated financial statements were authorized for issue by the board of directors on May 26, 2015. NOTE 1 – NATURE OF OPERATIONS AND SUMMARY OF SIGNIFICANT ACCOUNTING POLICIES
Nature of operations CAE Inc. and its subsidiaries (or the Company) design, manufacture and supply simulation equipment, provide training and develop integrated training solutions for defence and security markets, commercial airlines, business aircraft operators, helicopter operators, aircraft manufacturers and for healthcare education and service providers. CAE’s flight simulators replicate aircraft performance in normal and abnormal operations as well as a comprehensive set of environmental conditions utilizing visual systems that contain an extensive database of airports, other landing areas, flying environments, mission-specific environments, and motion and sound cues to create a fully immersive training environment. The Company offers a range of flight training devices based on the same software used on its simulators. The Company also operates a global network of training centres with locations around the world. The Company’s operations are managed through three segments (see Note 2): (i) Civil Aviation Training Solutions – Provides comprehensive training solutions for flight, cabin, maintenance and ground personnel
in commercial, business and helicopter aviation, a range of flight simulation training devices, as well as ab initio pilot training and crew sourcing services;
(ii) Defence and Security – Is a training systems integrator for defence forces across the air, land and sea domains, and for government and civil security organizations responsible for public safety;
(iii) Healthcare – Designs, manufactures and markets simulators, simulation centre management solutions and courseware for training of medical and allied healthcare students and clinicians in educational institutions, hospitals and defence organizations.
The Company’s mining business which provides mining services and tools has been classified as held for sale (see Note 3). CAE is a limited liability company incorporated and domiciled in Canada. The address of the main office is 8585 Côte-de-Liesse, Saint-Laurent, Québec, Canada, H4T 1G6. CAE shares are traded on the Toronto Stock Exchange and on the New York Stock Exchange. Basis of preparation The key accounting policies applied in the preparation of these consolidated financial statements are described below. These policies have been consistently applied to all years presented, unless otherwise stated. The consolidated financial statements have been prepared in accordance with Part I of the CPA Canada Handbook, referred to as IFRS, as issued by the International Accounting Standards Board (IASB). The consolidated financial statements have been prepared under the historical cost convention, except for the following items measured at fair value: contingent consideration, derivative financial instruments, financial instruments at fair value through profit and loss, available-for-sale financial assets and liabilities for cash-settled share-based arrangements. The functional and presentation currency of CAE Inc. is the Canadian dollar. Basis of consolidation Subsidiaries Subsidiaries are all entities over which the Company has control. Control exists when the Company is exposed to, or has the rights to, variable returns from its involvement with the entity and has the ability to affect those returns through the power over the entity. Subsidiaries are fully consolidated from the date control is obtained and they are no longer consolidated on the date control ceases. Joint arrangements Joint arrangements are entities in which the Company exercises joint control as established by contracts requiring unanimous consent for decisions about the activities that significantly affect the arrangement’s returns. When the Company has the rights to the net assets of the arrangement, the arrangement is classified as a joint venture and is accounted for using the equity method. When the Company has rights to the assets and obligations for the liabilities relating to an arrangement, the arrangement is classified as a joint operation and the Company accounts for each of its assets, liabilities and transactions, including its share of those held or incurred jointly, in relation to the joint operation. The Company presently does not have any joint operations. Under the equity method of accounting, interests in joint ventures are initially recognized at cost and adjusted thereafter to recognize the Company’s share of the profits or losses and movements in other comprehensive income (loss) (OCI) of the investee. When the Company’s share of losses in a joint venture equals or exceeds its interests in the joint ventures, the Company does not recognize further losses, unless it will incur obligations or make payments on behalf of the joint ventures.
Notes to the Consolidated Financial Statements
9 | CAE Year-End Financial Results 2015
Unrealized gains resulting from transactions with joint ventures are eliminated, to the extent of the Company’s share in the joint venture. For sales of products or services from the Company to its joint ventures, the elimination of unrealized profits is considered in the carrying value of the investment in equity accounted investees in the consolidated statement of financial position and in the share in profit or loss of equity accounted investees in the consolidated income statement.
Business combinations Business combinations are accounted for under the acquisition method. The consideration transferred for the acquisition of a subsidiary is the fair value of the assets transferred, the liabilities incurred and the equity interests issued by the Company, if any, at the date control is obtained. The consideration transferred includes the fair value of any liability resulting from a contingent consideration arrangement. Acquisition-related costs, other than share and debt issue costs incurred to issue financial instruments that form part of the consideration transferred, are expensed as incurred. Identifiable assets acquired and liabilities assumed in a business combination are measured initially at their fair value at the acquisition date. If a business combination is achieved in stages, the Company remeasures its previously held interest in the acquiree at its acquisition-date fair value and recognizes the resulting gain or loss, if any, in net income. Contingent consideration classified as a provision is measured at fair value, with subsequent changes recognized in income. If the contingent consideration is classified as equity, it is not remeasured until it is finally settled within equity. New information obtained during the measurement period, up to 12 months following the acquisition date, about facts and circumstances existing at the acquisition date affect the acquisition accounting. Non-controlling interests Non-controlling interests (NCI) represent equity interests in subsidiaries owned by outside parties. The share of net assets of subsidiaries attributable to non-controlling interests is presented as a component of equity. Changes in the Company’s ownership interest in subsidiaries that do not result in a loss of control are accounted for as equity transactions. The Company treats transactions with non-controlling interests as transactions with equity owners of the Company. For interests purchased from non-controlling interests, the difference between any consideration paid and the relevant share acquired of the carrying value of net assets of the subsidiary is recorded in equity. Gains or losses on disposals of non-controlling interests are also recorded in equity. Financial instruments and hedging relationships Financial instruments Financial assets and financial liabilities A financial instrument is any contract that gives rise to a financial asset of one entity and a financial liability or equity instrument of another entity. Financial assets and financial liabilities, including derivatives, are recognized on the consolidated statement of financial position when the Company becomes a party to the contractual provisions of the financial instrument. On initial recognition, all financial instruments are measured at fair value. When there is a difference between the fair value of the consideration given or received at initial recognition and the amount determined using a valuation technique, such difference is recognized immediately in income unless it qualifies for recognition as some other type of asset or liability. Subsequent measurement of the financial instruments is based on their classification as described below. Financial assets can be classified into one of these categories: fair value through profit and loss, held-to-maturity investments, loans and receivables or available-for-sale. Financial liabilities can be classified into one of the following categories: fair value through profit and loss or other financial liabilities. The determination of the classification depends on the purpose for which the financial instruments were acquired and their characteristics. Except in very limited circumstances, the classification is not changed subsequent to the initial recognition.
Financial instruments at fair value through profit and loss Financial instruments classified at fair value through profit and loss (FVTPL) are carried at fair value at each reporting date with the change in fair value recorded in income. The FVTPL classification is applied when a financial instrument: Is a derivative, including embedded derivatives accounted for separately from the host contract, but excluding those derivatives
designated as effective hedging instruments; Has been acquired or incurred principally for the purpose of selling or repurchasing in the near future; Is part of a portfolio of financial instruments that are managed together and for which there is evidence of a recent actual pattern
of short-term profit-taking; or Has been irrevocably designated as such by the Company (fair value option). Held-to-maturity investments, loans and receivables and other financial liabilities Financial instruments classified as held-to-maturity investments, loans and receivables and other financial liabilities are carried at amortized cost using the effective interest method. Interest income or expense is included in income in the period as incurred.
Notes to the Consolidated Financial Statements
CAE Year-End Financial Results 2015 | 10
Available-for-sale Available-for-sale financial assets are non-derivative financial assets that are designated as available-for-sale or that are not classified in any of the preceding categories. Financial assets classified as available-for-sale are carried at fair value at each reporting date. Unrealized gains and losses, including changes in foreign exchange rates for non-monetary financial assets, are recognized in OCI in the period in which the changes arise and are transferred to income when the assets are derecognized or impairment occurs. Objective evidence of impairment of an equity investment includes a significant or prolonged decline in the fair value of the security below its cost. If a reliable estimate of the fair value of an unquoted equity instrument cannot be made, this instrument is measured at cost, less any impairment losses. Dividends are recognized in income when the right of payment has been established. As a result, the following classifications were determined: (i) Cash and cash equivalents, restricted cash and all derivative instruments, except for derivatives designated as effective hedging
instruments, are classified as FVTPL; (ii) Accounts receivable, contracts in progress, non-current receivables and advances are classified as loans and receivables,
except for those that the Company intends to sell immediately or in the near term which are classified as FVTPL; (iii) Portfolio investments are classified as available-for-sale; (iv) Accounts payable and accrued liabilities and long-term debt, including interest payable, as well as finance lease obligations and
royalty obligations are classified as other financial liabilities, all of which are measured at amortized cost using the effective interest rate method.
Transaction costs Transaction costs that are directly related to the acquisition or issuance of financial assets and financial liabilities (other than those classified as FVTPL) are included in the fair value initially recognized for those financial instruments. These costs are amortized to income using the effective interest rate method. Offsetting of financial assets and financial liabilities Financial assets and financial liabilities are offset and the net amount is presented in the consolidated statement of financial position when the Company has a legally enforceable right to set off the recognized amounts and intends to settle on a net basis or to realize the assets and settle the liabilities simultaneously. Impairment of financial assets carried at amortized cost At each reporting date, the carrying amounts of the financial assets other than those to be measured at FVTPL are assessed to determine whether there is objective evidence of impairment. Impairment losses on financial assets carried at amortized cost are reversed in subsequent periods if the amount of loss decreases and the decrease can be related objectively to an event occurring after the impairment was recognized. Fair value hierarchy transfers For financial instruments that are recognized at fair value on a recurring basis, the Company determines whether transfers have occurred between levels in the fair value hierarchy. The assessment is based on the lowest level input that is significant to the fair value measurement as a whole at the end of each period. Embedded derivatives Embedded derivatives are recorded at fair value separately from the host contract when their economic characteristics and risks are not clearly and closely related to those of the host contract. The Company may enter into freestanding derivative instruments which are not eligible for hedge accounting, to offset the foreign exchange exposure of embedded foreign currency derivatives. In such circumstances, both derivatives are carried at fair value at each statement of financial position date with the change in fair value recorded in consolidated net income. Hedge accounting Documentation At the inception of a hedge, if the Company elects to use hedge accounting, the Company formally documents the designation of the hedge, the risk management objectives and strategy, the hedging relationship between the hedged item and hedging item and the method for testing the effectiveness of the hedge, which must be reasonably assured over the term of the hedging relationship and can be reliably measured. The Company formally assesses, both at inception of the hedge relationship and on an ongoing basis, whether the derivatives that are used in hedging transactions are highly effective in offsetting changes in fair values or cash flows of hedged items in relation to the hedged risk. Method of accounting The method of recognizing fair value gains and losses depends on whether derivatives are at FVTPL or are designated as hedging instruments, and, if the latter, the nature of the risks being hedged. All gains and losses from changes in the fair value of derivatives not designated as hedges are recognized in income. When derivatives are designated as hedges, the Company classifies them either as: (a) hedges of the change in fair value of recognized assets or liabilities or firm commitments (fair value hedges); or (b) hedges of the variability in highly probable future cash flows attributable to a recognized asset or liability, a firm commitment or a forecasted transaction (cash flow hedges); or (c) hedges of a net investment in a foreign operation.
Notes to the Consolidated Financial Statements
11 | CAE Year-End Financial Results 2015
Fair value hedge For fair value hedges outstanding, gains or losses arising from the measurement of derivative hedging instruments at fair value are recorded in income and the carrying amount of the hedged items are adjusted by gains and losses on the hedged item attributable to the hedged risks which are recorded in income. Cash flow hedge The effective portion of changes in the fair value of derivative instruments that are designated and qualify as cash flow hedges is recognized in OCI, while the ineffective portion is recognized immediately in income. Amounts accumulated in OCI are reclassified to income in the period in which the hedged item affects income. However, when the forecasted transactions that are hedged items result in recognition of non-financial assets (for example, inventories or property, plant and equipment), gains and losses previously recognized in OCI are included in the initial carrying value of the related non-financial assets acquired or liabilities incurred. The deferred amounts are ultimately recognized in income as the related non-financial assets are derecognized or amortized. Hedge accounting is discontinued prospectively when the hedging relationship no longer meets the criteria for hedge accounting, when the designation is revoked, or when the hedging instrument expires or is sold. Any cumulative gain or loss directly recognized in OCI at that time remains in OCI until the hedged item is eventually recognized in income. When it is probable that a hedged transaction will not occur, the cumulative gain or loss that was recognized in OCI is recognized immediately in income. Hedge of net investments in foreign operations The Company has designated certain long-term debt as a hedge of CAE’s overall net investments in foreign operations whose activities are denominated in a currency other than the Company’s functional currency. The portion of gains or losses on the hedging item that is determined to be an effective hedge is recognized in OCI and is limited to the translation gain or loss on the net investment. Derecognition Financial assets A financial asset (or, where applicable a part of a financial asset or part of a group of similar financial assets) is derecognized when: The rights to receive cash flows from the asset have expired; The Company has transferred its rights to receive cash flows from the asset and either has transferred substantially all the risks
and rewards of the asset or has neither transferred nor retained substantially all the risks and rewards of the asset, but has transferred control of the asset.
Financial liabilities A financial liability is derecognized when the obligation under the liability is discharged, cancelled or expires. When an existing financial liability is replaced by another from the same lender on substantially different terms, or the terms of an existing liability are substantially modified, such an exchange or modification is treated as a derecognition of the original liability and the recognition of a new liability, and the difference in the respective carrying amounts is recognized in income. Foreign currency translation Foreign operations Assets and liabilities of subsidiaries that have a functional currency other than the Canadian dollar are translated from their functional currency to Canadian dollars at exchange rates in effect at the reporting date. Revenue and expenses are translated at the average exchange rates for the period. The resulting translation adjustments are included in OCI. When designated as hedges of net investments in foreign operations, translation gains or losses related to long term intercompany account balances, which form part of the overall net investment in foreign operations, and those arising from the translation of debt denominated in foreign currencies, are also included in OCI. Transactions and balances Monetary assets and liabilities denominated in foreign currencies are translated at the prevailing exchange rate at the reporting date. Non-monetary assets and liabilities, and revenue and expense items denominated in foreign currencies are translated into the functional currency using the exchange rate prevailing at the dates of the respective transactions. Foreign exchange gains and losses resulting from the settlement of such transactions are recognized in income, except when deferred in OCI as qualifying cash flow hedges and qualifying net investment hedges. Cash and cash equivalents Cash and cash equivalents consist of cash and highly-liquid investments with original terms to maturity of 90 days or less at the date of purchase. Accounts receivable Receivables are initially recognized at fair value and are subsequently carried at amortized cost, net of an allowance for doubtful accounts, based on expected recoverability. The amount of the allowance is the difference between the asset’s carrying amount and the present value of the estimated future cash flows, discounted at the original effective interest rate. The loss is recognized in income. Subsequent recoveries of amounts previously provided for or written-off are recognized in income.
Notes to the Consolidated Financial Statements
CAE Year-End Financial Results 2015 | 12
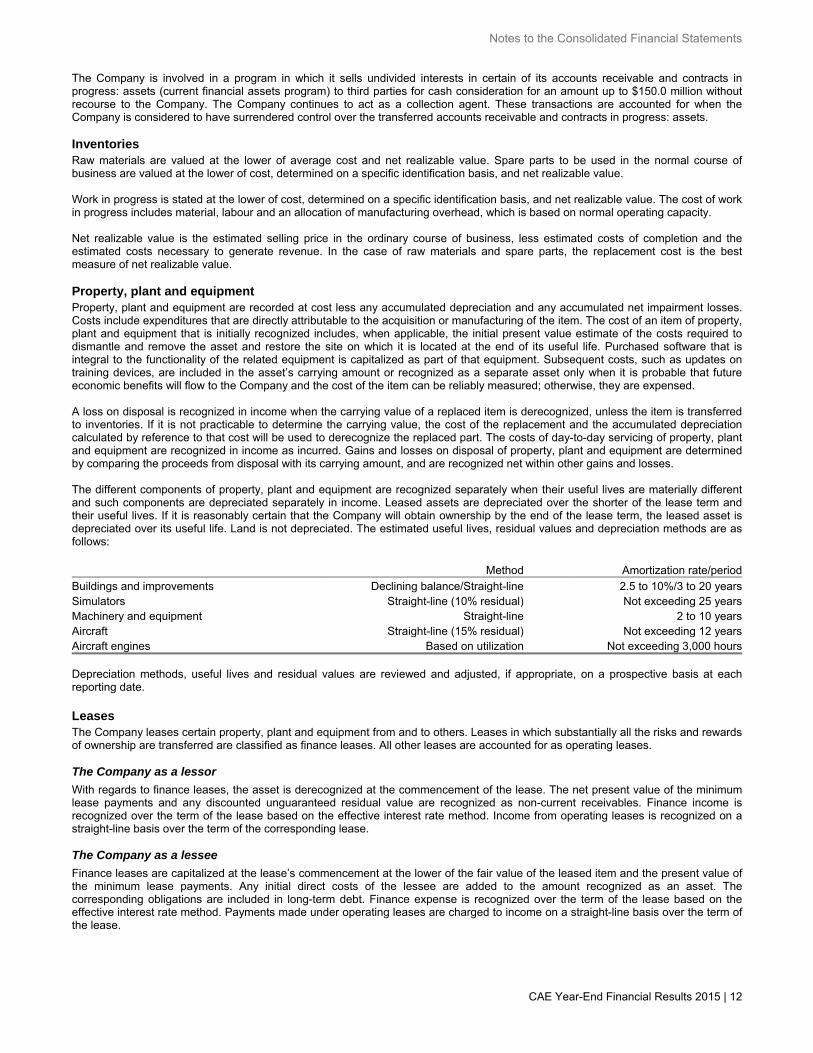
The Company is involved in a program in which it sells undivided interests in certain of its accounts receivable and contracts in progress: assets (current financial assets program) to third parties for cash consideration for an amount up to $150.0 million without recourse to the Company. The Company continues to act as a collection agent. These transactions are accounted for when the Company is considered to have surrendered control over the transferred accounts receivable and contracts in progress: assets. Inventories Raw materials are valued at the lower of average cost and net realizable value. Spare parts to be used in the normal course of business are valued at the lower of cost, determined on a specific identification basis, and net realizable value. Work in progress is stated at the lower of cost, determined on a specific identification basis, and net realizable value. The cost of work in progress includes material, labour and an allocation of manufacturing overhead, which is based on normal operating capacity. Net realizable value is the estimated selling price in the ordinary course of business, less estimated costs of completion and the estimated costs necessary to generate revenue. In the case of raw materials and spare parts, the replacement cost is the best measure of net realizable value. Property, plant and equipment Property, plant and equipment are recorded at cost less any accumulated depreciation and any accumulated net impairment losses. Costs include expenditures that are directly attributable to the acquisition or manufacturing of the item. The cost of an item of property, plant and equipment that is initially recognized includes, when applicable, the initial present value estimate of the costs required to dismantle and remove the asset and restore the site on which it is located at the end of its useful life. Purchased software that is integral to the functionality of the related equipment is capitalized as part of that equipment. Subsequent costs, such as updates on training devices, are included in the asset’s carrying amount or recognized as a separate asset only when it is probable that future economic benefits will flow to the Company and the cost of the item can be reliably measured; otherwise, they are expensed. A loss on disposal is recognized in income when the carrying value of a replaced item is derecognized, unless the item is transferred to inventories. If it is not practicable to determine the carrying value, the cost of the replacement and the accumulated depreciation calculated by reference to that cost will be used to derecognize the replaced part. The costs of day-to-day servicing of property, plant and equipment are recognized in income as incurred. Gains and losses on disposal of property, plant and equipment are determined by comparing the proceeds from disposal with its carrying amount, and are recognized net within other gains and losses. The different components of property, plant and equipment are recognized separately when their useful lives are materially different and such components are depreciated separately in income. Leased assets are depreciated over the shorter of the lease term and their useful lives. If it is reasonably certain that the Company will obtain ownership by the end of the lease term, the leased asset is depreciated over its useful life. Land is not depreciated. The estimated useful lives, residual values and depreciation methods are as follows:
Method Amortization rate/period
Buildings and improvements Declining balance/Straight-line 2.5 to 10%/3 to 20 yearsSimulators Straight-line (10% residual) Not exceeding 25 yearsMachinery and equipment Straight-line 2 to 10 yearsAircraft Straight-line (15% residual) Not exceeding 12 yearsAircraft engines Based on utilization Not exceeding 3,000 hours Depreciation methods, useful lives and residual values are reviewed and adjusted, if appropriate, on a prospective basis at eachreporting date. Leases The Company leases certain property, plant and equipment from and to others. Leases in which substantially all the risks and rewards of ownership are transferred are classified as finance leases. All other leases are accounted for as operating leases. The Company as a lessor
With regards to finance leases, the asset is derecognized at the commencement of the lease. The net present value of the minimum lease payments and any discounted unguaranteed residual value are recognized as non-current receivables. Finance income is recognized over the term of the lease based on the effective interest rate method. Income from operating leases is recognized on a straight-line basis over the term of the corresponding lease. The Company as a lessee
Finance leases are capitalized at the lease’s commencement at the lower of the fair value of the leased item and the present value of the minimum lease payments. Any initial direct costs of the lessee are added to the amount recognized as an asset. The corresponding obligations are included in long-term debt. Finance expense is recognized over the term of the lease based on the effective interest rate method. Payments made under operating leases are charged to income on a straight-line basis over the term of the lease.
Notes to the Consolidated Financial Statements
13 | CAE Year-End Financial Results 2015
Sale and leaseback transactions
The Company engages in sales and leaseback transactions as part of the Company’s financing strategy to support investment in the civil and military training and services business. Where a sale and leaseback transaction results in a finance lease, any excess of sales proceeds over the carrying amount is deferred and amortized over the lease term. Where a sale and leaseback transaction results in an operating lease, and it is clear that the transaction is established at fair value, any profit or loss is recognized in income. If the sales price is below fair value, the shortfall is recognized in income immediately except if the loss is compensated for by future lease payments at below market price, it is deferred and amortized in proportion to the lease payments over the period the asset is expected to be used. If the sale price is above fair value, the excess over fair value is deferred and amortized over the period the asset is expected to be used.
Intangible assets Goodwill
Goodwill is measured at cost less accumulated impairment losses, if any. Goodwill arises on the acquisition of subsidiaries. Goodwill represents the excess of the aggregate of the cost of an acquisition, including the Company’s best estimate of the fair value of contingent consideration and the acquisition-date fair value of any previous held equity interest in the acquiree, over the fair value of the net identifiable assets of the acquiree at the acquisition date. Gains and losses on the disposal of an entity include the carrying amount of goodwill relating to the entity sold. Research and development (R&D)
Research costs are expensed as incurred. Development costs are also charged to income in the period incurred unless they meet all the specific capitalization criteria established in IAS 38, Intangible Assets. Capitalized development costs are stated at cost and net of accumulated amortization and accumulated impairment losses, if any. Amortization of the capitalized development costs commences when the asset is available for use and is included in research and development expense. Other intangible assets
Intangible assets acquired separately are measured at cost upon initial recognition. The cost of intangible assets acquired in a business combination is the fair value as at the acquisition date. Following initial recognition, intangible assets are carried at cost, net of accumulated amortization and accumulated impairment losses, if any. The cost of an internally generated intangible asset comprises all directly attributable costs necessary to create, produce, and prepare the asset to be capable of operating in the manner intended by management. Gains and losses on disposal of intangible assets are determined by comparing the proceeds from disposal with its carrying amount and are recognized within other gains and losses.
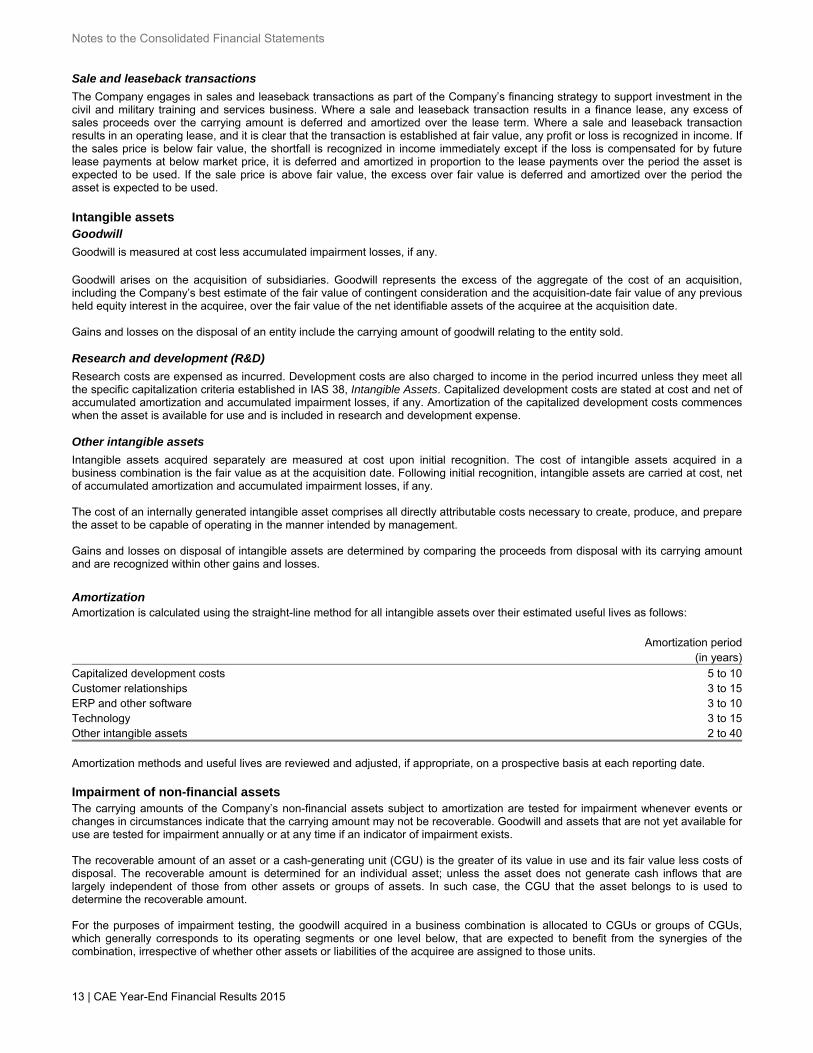
Amortization Amortization is calculated using the straight-line method for all intangible assets over their estimated useful lives as follows: Amortization period (in years)
Capitalized development costs 5 to 10Customer relationships 3 to 15ERP and other software 3 to 10Technology 3 to 15Other intangible assets 2 to 40 Amortization methods and useful lives are reviewed and adjusted, if appropriate, on a prospective basis at each reporting date. Impairment of non-financial assets The carrying amounts of the Company’s non-financial assets subject to amortization are tested for impairment whenever events or changes in circumstances indicate that the carrying amount may not be recoverable. Goodwill and assets that are not yet available for use are tested for impairment annually or at any time if an indicator of impairment exists. The recoverable amount of an asset or a cash-generating unit (CGU) is the greater of its value in use and its fair value less costs of disposal. The recoverable amount is determined for an individual asset; unless the asset does not generate cash inflows that are largely independent of those from other assets or groups of assets. In such case, the CGU that the asset belongs to is used to determine the recoverable amount. For the purposes of impairment testing, the goodwill acquired in a business combination is allocated to CGUs or groups of CGUs, which generally corresponds to its operating segments or one level below, that are expected to benefit from the synergies of the combination, irrespective of whether other assets or liabilities of the acquiree are assigned to those units.
Notes to the Consolidated Financial Statements
CAE Year-End Financial Results 2015 | 14
An impairment loss is recognized if the carrying amount of an asset or CGU exceeds its estimated recoverable amount. Where the recoverable amount of a CGU to which goodwill has been allocated is lower than the CGU’s carrying amount, the related goodwill is impaired. Any remaining amount of impairment exceeding the impaired goodwill is recognized on a pro rata basis of the carrying amount of each asset in the respective CGU. Impairment losses are recognized in income. The Company evaluates impairment losses, other than goodwill impairment, for potential reversals at each reporting date. An impairment loss is reversed if there is any indication that the loss has decreased or no longer exists due to changes in the estimates used to determine the recoverable amount. An impairment loss is reversed only to the extent that the asset’s carrying amount does not exceed the carrying amount that would have been determined, net of depreciation or amortization, if no impairment loss had been recognized. Such reversal is recognized in income. Borrowing costs Borrowing costs that are directly attributable to the acquisition or construction of a qualifying asset are capitalized as part of the cost of the asset. A qualifying asset is one that takes a substantial period of time to get ready for its intended use. Capitalization of borrowing costs ceases when the asset is completed and ready for its intended use. All other borrowing costs are recognized as finance expense in income, as incurred. Other assets Restricted cash The Company is required to hold a defined amount of cash as collateral under the terms of certain subsidiaries’ external bank financing, government-related sales contracts and business combination arrangements. Deferred financing costs Deferred financing costs related to the revolving unsecured term credit facilities, when it is probable that some or all of the facilities will be drawn down, and deferred financing costs related to sale and leaseback agreements are included in other assets at cost and are amortized on a straight-line basis over the term of the related financing agreements. Accounts payable and accrued liabilities Accounts payable and accrued liabilities are recognized initially at fair value and subsequently measured at amortized cost using the effective interest method. Provisions Provisions are recognized when the Company has a present legal or constructive obligation as a result of past events, it is probable that an outflow of resources will be required to settle the obligation and the amount can be reliably estimated. Provisions are not recognized for future operating losses. Provisions are measured at the present value of the expenditures expected to be required to settle the obligation using a pre-tax rate that reflects current market assessments of the time value of money and the risks specific to the obligation. The increase in the provision due to passage of time is recognized as a finance expense. When there are a number of similar obligations, the likelihood that an outflow will be required in settlement is determined by considering the class of obligations as a whole. Long-term debt Long-term debt is recognized initially at fair value, net of transaction costs incurred. They are subsequently stated at amortized cost. Any difference between the proceeds, net of transaction costs, and the redemption value is recognized in income over the period of borrowings using the effective interest method. Fees paid on the establishment of loan facilities are recognized as transaction costs of the loan to the extent that it is probable that some or all of the facility will be drawn down. In these cases, the fee is deferred until the drawdown occurs. To the extent that there is no evidence that it is probable that some or all of the facility will be drawn down, the fee is capitalized as a pre-payment for liquidity services and amortized over the period of the facility to which it relates. Share capital Common shares are classified as equity. Incremental costs directly attributable to the issue of new shares or options are shown in equity as a deduction, net of tax, from the proceeds.
Revenue recognition Revenue is measured at the fair value of the consideration received or receivable. Revenue is recognized when the amount can be reliably measured, when it is probable that future economic benefits will flow to the Company and when specific criteria have been met for each of the categories, as described below. Multiple component arrangements The Company sometimes enters into multiple component revenue arrangements, which may include a combination of design, engineering and manufacturing of flight simulators and other products, as well as the provision of training services, spare parts and maintenance. When a single sales transaction requires the delivery of more than one product or service (multiple components), the revenue recognition criteria are applied to the separately identifiable components. A component is considered separately identifiable if the delivered item has value to the customer on a stand-alone basis and the fair value associated with the product or service can be reliably measured.
Notes to the Consolidated Financial Statements
15 | CAE Year-End Financial Results 2015
The allocation of the revenue from a multiple component arrangement is based on the fair value of each element in relation to the fair value of the arrangement as a whole. The Company's revenues can be divided into two main accounting categories: construction contracts and sales of goods and services. Construction contracts A construction contract is a contract specifically negotiated for the construction of an asset or of a group of assets, which are interrelated in terms of their design, technology, function, purpose or use. According to its characteristics, a construction contract can be accounted for separately, be segmented into several components which are each accounted for separately, or be combined with another construction contract in order to form a single construction contract for accounting purposes in respect of which revenues and expense will be recognized. Revenue from construction contracts for the design, engineering and manufacturing of training devices is recognized using the percentage-of-completion method when it is probable that the economic benefits associated with the contract will flow to the Company, the revenue, contract costs to complete and the stage of contract completion at the end of the reporting period can be reliably measured and when the contract costs can be clearly identified and reliably measured so that actual contract costs incurred can be compared with prior estimates. The stage of completion is measured by reference to the contract costs incurred up to the end of the reporting period as a percentage of total estimated costs for each contract. When the criteria to use the percentage-of-completion method are not met, construction contract revenue is recognized to the extent of the contract costs incurred that are likely to be recoverable. Provisions for estimated contract losses are recognized in the period in which the loss is determined. Contract losses are measured at the amount by which the estimated total costs exceed the estimated total revenue from the contract. Warranty provisions are recorded when revenue is recognized based on past experience. The cumulative amount of costs incurred and profit recognized, reduced by losses and progress billing, is determined on a contract-by-contract basis. If this amount is positive it is classified in contracts in progress: assets. If this amount is negative it is classified in contracts in progress: liabilities. Post-delivery customer support is billed separately, and revenue is recognized over the support period. Sales of goods and services Software arrangements Revenue from off-the-shelf software sales is recognized when delivery has occurred. Revenue from fixed-price software arrangements and software customization contracts that require significant production, modification, or customization of software is recognized using the percentage-of-completion method. Spare parts Revenue from the sale of spare parts is primarily recognized upon shipment to the customer. Upon shipment, the significant risks and rewards of ownership of the goods are transferred and the Company retains neither continuing managerial involvement to the degree usually associated with ownership nor effective control over the goods sold. Product maintenance Revenue from maintenance contracts is generally recognized on the basis of the percentage-of-completion of the transaction. Training and consulting services Revenue from training and consulting services is recognized as the services are rendered. For flight schools, cadet training courses are offered mainly by way of ground school and live aircraft flight. During the ground school phase, revenue is recognized in income on a straight-line basis, while during the live aircraft flight phase, revenue is recognized based on actual flight hours.
Other Sales incentives to customers The Company may provide sales incentives in the form of discounts and volume rebates, these incentives are recorded as a reduction of revenues. Non-monetary transactions The Company may also enter into sales arrangements where little or no monetary consideration is involved. The non-monetary transactions are measured at the more reliable measure of the fair value of the asset given up and fair value of the asset received. Deferred revenue Cash payments received or advances currently due pursuant to contractual arrangements, with the exception of those related to construction contracts, are recorded as deferred revenue until all of the foregoing conditions of revenue recognition have been met.
Notes to the Consolidated Financial Statements
CAE Year-End Financial Results 2015 | 16
Employee benefits Defined benefit pension plans The Company maintains defined benefit pension plans that provide benefits based on length of service and final average earnings. The defined benefit asset or liability comprises the present value of the defined benefit obligation at the reporting date less the fair value of plan assets out of which the obligations are to be settled. The defined benefit obligations are actuarially determined for each plan using the projected unit credit method. The present value of the defined benefit obligation is determined by discounting the estimated future cash flows using the interest rate of high-quality corporate bonds that are denominated in the currency in which the benefit will be paid and that have terms to maturity approximating the terms of the related pension obligation. In countries where there is no deep market in such bonds, the market rates on government bonds are used. The value of any employee benefit asset recognized is restricted to the present value of any economic benefits available in the form of refunds from the plan or reductions in the future contributions to the plan (asset ceiling test). Minimum funding requirements may give rise to an additional liability to the extent that they require paying contributions to cover an existing shortfall. Plan assets can only be used to fund employee benefits, are not available to the creditors of the Company, nor can they be paid directly to the Company. Fair value of plan assets is based on market price information. The Company determines the net interest expense (income) by applying the discount rate used to measure the defined benefit obligation at the beginning of the period to the net defined benefit asset or liability. Actuarial gains and losses arising from experience adjustments, changes in actuarial assumptions and the effect of any asset ceiling and minimum liability are recognized to OCI in the period in which they arise. Past service costs are recognized as an expense as incurred at the earlier of when the plan amendment or curtailment occurs and when the entity recognizes related termination benefits. Defined contribution pension plans The Company also maintains defined contribution plans for which the Company pays fixed contributions to publicly or privately administered pension insurance plans on a mandatory, contractual or voluntary basis. The Company has no legal or constructive obligation to pay further amounts if the fund does not hold sufficient assets to pay the benefits to all employees. Obligations for contributions to defined contribution pension plans are recognized as an employee benefit expense in income as the services are provided. Termination benefits Termination benefits are recognized as an expense when the Company is demonstrably committed, without realistic possibility of withdrawal, to a formal detailed plan to either terminate employment before the normal retirement date, or to provide termination benefits as a result of an offer made to encourage voluntary redundancy. Termination benefits for voluntary redundancies are recognized as an expense, if the Company has made an offer of voluntary redundancy, based on the number of employees expected to accept the offer. Benefits falling due more than 12 months after the reporting date are discounted to their present value. Share-based payment transactions The Company’s share-based payment plans consist of two categories: the Employee Stock Option Plan (ESOP), which qualifies as an equity-settled share-based payment plan; and the Employee Stock Purchase Plan (ESPP), Deferred Share Unit (DSU) plan, Long-Term Incentive Time Based plans and Long-Term Incentive Performance Based plans which qualify as cash-settled share-based payments plans. Time Based plans include the Long-Term Incentive – Deferred Share Unit (LTI-DSU) plan and the Long-Term Incentive – Time Based Restricted Share Unit (LTI-TB RSU) plan. Performance Based plans include the Long-Term Incentive – Restricted Share Unit (LTI-RSU) plan and the Long-Term Incentive – Performance Share Unit (LTI-PSU) plan. For both categories, the fair value of the employee services received in exchange is recognized as an expense in income. Service and non-market performance conditions attached to the transactions are not taken into account in determining fair value. For the equity-settled plan, the cost of equity-settled transactions is measured at fair value using the Black-Scholes option pricing model. The compensation expense is measured at the grant date and recognized over the service period with a corresponding increase to contributed surplus. The cumulative expenses recognized for equity-settled transactions at each reporting date represents the extent to which the vesting period has expired and management’s best estimate of the number of equity instruments that will ultimately vest. For options with graded vesting, each tranche is considered a separate grant with a different vesting date and fair value, and each tranche is accounted for separately. When the options are exercised, the Company issues new shares and the proceeds received net of any directly attributable transaction costs are credited to share capital. For cash-settled plans, a corresponding liability is recognized. The fair value of employee services received is calculated by multiplying the number of units expected to vest with the fair value of one unit as of grant date based on the market price of the Company’s common shares. The fair value of the ESPP is a function of the Company’s contributions. Until the liability is settled, the Company re-measures the fair value of the liability at the end of each reporting period and at the date of settlement, with any changes in fair value recognized in income for the period. The Company has entered into equity swap agreements with two major Canadian financial institutions in order to reduce its earnings exposure related to the fluctuation in the Company’s share price relating to the DSU, LTI-DSU and LTI-TB RSU programs.
Notes to the Consolidated Financial Statements
17 | CAE Year-End Financial Results 2015
Current and deferred income tax Income tax expense comprises current and deferred tax. An income tax expense is recognized in income except to the extent that it relates to items recognized in OCI or directly in equity, in which case it is recognized in OCI or directly in equity, respectively. Current tax is the amount expected to be paid or recovered from taxation authorities on the taxable income or loss for the year, using tax rates enacted or substantively enacted at the reporting date in the countries where the Company and its subsidiaries operate and generate taxable income, and any adjustment to tax payable or receivable in respect of previous years. Management periodically evaluates positions taken in tax returns with respect to situations in which applicable tax regulation is subject to interpretation. It establishes provisions, where appropriate, on the basis of amounts expected to be paid to the tax authorities. Deferred tax is recognized using the balance sheet liability method, providing for temporary differences between the tax bases of assets or liabilities and their carrying amounts in the consolidated financial statements. Deferred income tax is provided on temporary differences arising on investments in subsidiaries, and jointly controlled entities, except where the timing of the reversal of the temporary difference is controlled by the Company and it is probable that the temporary difference will not reverse in the foreseeable future. Deferred tax is measured on an undiscounted basis at the tax rates that are expected to be applied to temporary differences when they reverse, based on the laws that have been enacted or substantively enacted by the reporting date. Deferred tax assets are recognized for all deductible temporary differences and carry forward of unused tax losses. The recognition of deferred tax assets are limited to the amount which is probable to be realized. Deferred tax assets are reviewed at each reporting date and are reduced to the extent that it is no longer probable that a recognized deferred tax asset will be realized. Unrecognized deferred tax assets are reassessed at each reporting date and are recognized to the extent that it has become probable that an unrecognized deferred tax asset will be realized. Deferred tax assets and liabilities are offset if there is a legally enforceable right to offset current tax liabilities and assets, and they relate to income taxes levied by the same tax authority on the same taxable entity, or on different taxable entities which intend to settle current tax liabilities and assets on a net basis or if their tax assets and liabilities will be realized simultaneously. Taxes on income in the interim periods are accrued by jurisdiction using the effective tax rate that would be applicable to expected total annual profit or loss of the jurisdiction. Investment tax credits Investment tax credits (ITCs) arising from R&D activities are deducted from the related costs and are accordingly included in the determination of net income when there is reasonable assurance that the credits will be realized. ITCs arising from the acquisition or development of property, plant and equipment and capitalized development costs are deducted from the cost of those assets with amortization calculated on the net amount. Investment tax credits expected to be recovered beyond 12 months are classified in Other assets.
Earnings per share Earnings per share is calculated by dividing the net income for the period attributable to the common shareholders of the Company by the weighted average number of common shares outstanding during the period. The diluted weighted average number of common shares outstanding is calculated by taking into account the dilution that would occur if the securities or other agreements for the issuance of common shares were exercised or converted into common shares at the later of the beginning of the period or the issuance date unless it is anti-dilutive. The treasury stock method is used to determine the dilutive effect of the stock options. The treasury stock method is a method of recognizing the use of proceeds that could be obtained upon the exercise of options in computing diluted earnings per share. It assumes that any proceeds would be used to purchase common shares at the average market price during the period. Only the Company’s stock options have a dilutive potential on common shares.
Government assistance Government contributions are recognized when there is reasonable assurance that the contributions will be received and all attached conditions will be complied with by the Company. Government assistance related to the acquisition of intangible assets is recorded as a reduction of the cost of the related asset while government assistance related to current expenses is recorded as a reduction of the related expenses. The Company benefits from investment tax credits that are deemed to be equivalent to government contributions. Contributions are received for Project New Core Markets from Investissement Québec (IQ) for costs incurred in R&D programs. Contributions were received in previous fiscal years for Project Phoenix from Industry Canada under the Technology Partnerships Canada (TPC) program and from IQ.
Notes to the Consolidated Financial Statements
CAE Year-End Financial Results 2015 | 18
Project New Core Markets and Project Phoenix require the Company to pay royalties. The obligation to pay royalties, recognized as royalty obligations, is recorded when the contribution is receivable and is estimated based on future projections. The obligation is discounted using the prevailing market rates of interest, at that time, for a similar instrument (similar as to currency, term, type of interest rate, guarantees or other factors) with a similar credit rating. The current portion is included as part of accrued liabilities. The difference between government contributions and the discounted value of royalty obligations is accounted for as a government assistance which is recognized as a reduction of related expenses or as a reduction of the cost of the related asset. The Company recognizes the Government of Canada’s participation in Project Falcon and Project Innovate as interest-bearing long-term debt. The initial measurement of the accounting liability is discounted using the prevailing market rates of interest, at that time, for a similar instrument (similar as to currency, term, type of interest rate, guarantees or other factors) with a similar credit rating. The difference between the face value of the long-term obligation and the discounted value of the long-term obligation is accounted for as a government contribution which is recognized as a reduction of costs or as a reduction of capitalized expenditures. Use of judgements, estimates and assumptions The preparation of the consolidated financial statements requires the Company’s management (management) to make judgements, estimates and assumptions that affect the application of accounting policies, the reported amounts of assets and liabilities and disclosures at the date of the consolidated financial statements, as well as the reported amounts of revenues and expenses for the period reported. It also requires management to exercise its judgement in applying the Company’s accounting policies. The areas involving a high degree of judgement or complexity, or areas where assumptions and estimates are significant to the consolidated financial statements are disclosed below. Actual results could differ from those estimates. Changes will be reported in the period in which they are identified. Business combinations Business combinations are accounted for in accordance with the acquisition method. The consideration transferred and the acquiree’s identifiable assets, liabilities and contingent liabilities are measured at their fair value. Depending on the complexity of determining these valuations, the Company either consults with independent experts or develops the fair value internally by using appropriate valuation techniques which are generally based on a forecast of the total expected future net discounted cash flows. These evaluations are linked closely to the assumptions made by management regarding the future performance of the related assets and the discount rate. Contingent consideration is measured at fair value using a discounted cash flow model. Development costs Development costs are recognized as intangible assets and are amortized over their useful lives when they meet the criteria for capitalization. Forecasted revenue and profitability for the relevant projects are used to assess compliance with the capitalization criteria and to assess the recoverable amount of the assets.
Impairment of non-financial assets The Company’s impairment test for goodwill is based on internal estimates (level 3) of fair value less costs of disposal calculations and uses valuation models such as the discounted cash flows model. Key assumptions which management has based its determination of fair value less costs of disposal include estimated growth rates, post-tax discount rates and tax rates. These estimates, including the methodology used, can have a material impact on the respective values and ultimately the amount of any goodwill impairment. Likewise, whenever property, plant and equipment and intangible assets are tested for impairment, the determination of the assets’ recoverable amount involves the use of estimates by management and can have a material impact on the respective values and ultimately the amount of any impairment. See Note 20 for further details regarding assumptions used. Revenue recognition The percentage-of-completion method requires the Company to estimate the work performed to date as a proportion of the total work to be performed. Management conducts monthly reviews of its estimated costs to complete, percentage-of-completion estimates and revenue and margins recognized, on a contract-by-contract basis. The impact of any revisions in cost and revenue estimates is reflected in the period in which the need for a revision becomes known. Defined benefit pension plans The cost of defined benefit pension plans and the present value of the employee benefits obligations are determined using actuarial valuations. Actuarial valuations involve, amongst others, making assumptions about discount rates, future salary increases and mortality rates. All assumptions are reviewed at each reporting date. Any changes in these assumptions will impact the carrying amount of the employee benefits obligations and the cost of the defined benefit pension plans. In determining the appropriate discount rate, management considers the interest rates of high quality corporate bonds that are denominated in the currency in which the benefits will be paid, and that have terms to maturity approximating the terms of the related pension liability. The mortality rate is based on publicly available mortality tables for the specific country. Future salary increases and pension increases are based on expected future inflation rates for the specific country. Other key assumptions for pension obligations are based, in part, on current market conditions. See Note 14 for further details regarding assumptions used.
Notes to the Consolidated Financial Statements
19 | CAE Year-End Financial Results 2015
Government assistance repayments
In determining the amount of repayable government assistance, assumptions and estimates are made in relation to discount rates, expected revenues and the expected timing of revenues. Revenue projections take into account past experience and represent management’s best estimate about the future. Revenues after a five-year period are extrapolated using estimated growth rates, ranging from 5% to 9%, over the period of repayments. The estimated repayments are discounted using average rates ranging from 6% to 13% based on terms of similar financial instruments. These estimates, along with the methodology used to derive the estimates, can have a material impact on the respective values and ultimately any repayable obligation in relation to government assistance. A 1% increase to the growth rates would increase the royalty obligation at March 31, 2015 by approximately $9.9 million (2014 − $9.4 million).
Share-based payments The Company measures the cost of cash and equity-settled transactions with employees by reference to the fair value of the related instruments at the date at which they are granted. Estimating fair value for share-based payments requires determining the most appropriate valuation model for a grant, which depends on the terms and conditions of the grant. This also requires making assumptions and determining the most appropriate inputs to the valuation model including the expected life of the option, volatility and dividend yield.
Income taxes The Company is subject to income tax laws in numerous jurisdictions. Judgement is required in determining the worldwide provision for income taxes. The determination of tax liabilities and assets involves uncertainties in the interpretation of complex tax regulations. The Company provides for potential tax liabilities based on the weighted average probability of the possible outcomes. Differences between actual results and those estimates could have an effect on the income tax liabilities and deferred tax liabilities in the period in which such determinations are made. Deferred tax assets are recognized to the extent that it is probable that taxable profit will be available against the losses that can be utilized. Significant management judgement is required to determine the amount of deferred tax assets that can be recognized, based upon the likely timing and the level of future taxable profits together with future tax planning strategies. The recorded amount of total deferred tax assets could be altered if estimates of projected future taxable income and benefits from available tax strategies are lowered, or if changes in current tax regulations are enacted that impose restrictions on the timing or extent of the Company’s ability to utilize future tax benefits. NOTE 2 – CHANGES IN ACCOUNTING POLICIES
Changes in accounting policies
Operating segments As at April 1, 2014, the Company modified its operating segments. The former segments, Training & Services/Civil and Simulation Products/Civil, have been combined to form Civil Simulation and Training and the former Training & Services/Military and Simulation Products/Military segments have been combined to form Defence and Security. This resulted from changes in the organizational structure undertaken to better reflect the Company’s operating segments with its integrated solutions approach to market. In addition, the former New Core Markets segment was renamed Healthcare following the Company’s decision to divest its mining business (see Note 3). This information reflects the way the management measures profitability and performance and how it allocates resources. As such, the Company believes the information presented to be more relevant as it is better aligned with the way the business is managed internally. The change has been made retrospectively in accordance with IAS 8, Accounting Policies, Changes in Accounting Estimates and Errors. The change did not impact the consolidated financial statement results. Operating segments’ disclosure has been restated to conform to the new operating segments (see Note 30). As at March 31, 2015, the Company renamed its Civil Simulation and Training segment to Civil Aviation Training Solutions.
New and amended standards adopted by the Company The amendments to IFRS effective for the fiscal year 2015 have no material impact on the Company’s consolidated financial statements results.
New and amended standards not yet adopted by the Company
Employee benefits In November 2013, the IASB amended IAS 19, Employee Benefits. The amendment clarifies the accounting for contributions from employees or third parties to defined benefit plans. The amendment is effective on April 1, 2015 and is not expected to have an impact on the Company’s consolidated financial statements. Revenue from contracts with customers In May 2014, the IASB released IFRS 15, Revenue from Contracts with Customers, which supersedes IAS 11, Construction Contracts and IAS 18, Revenue, and the related interpretations on revenue recognition: IFRIC 13, Customer Loyalty Programmes, IFRIC 15, Agreements for the Construction of Real Estate, IFRIC 18, Transfers of Assets from Customers and SIC 31, Revenue – Barter Transactions Involving Advertising Services. The standard is effective for annual periods beginning on or after January 1, 2017, with earlier application permitted. The Company is currently evaluating the impact of the standard on its consolidated financial statements.
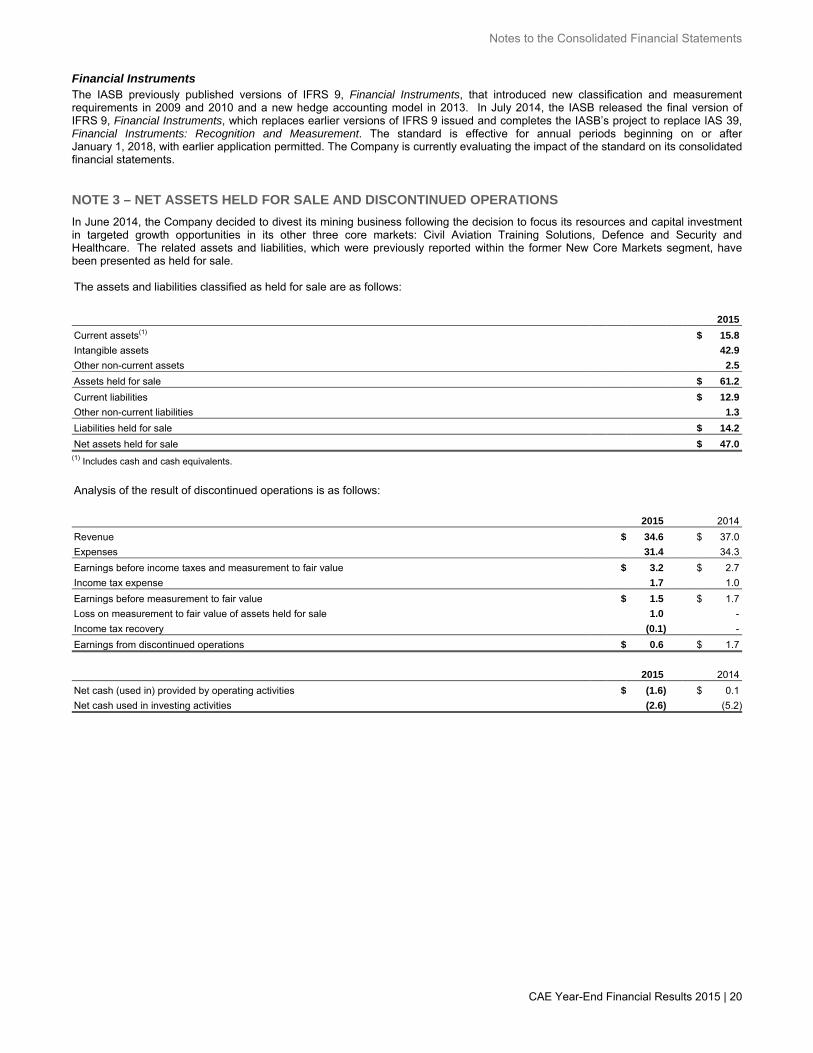
Notes to the Consolidated Financial Statements
CAE Year-End Financial Results 2015 | 20
Financial Instruments The IASB previously published versions of IFRS 9, Financial Instruments, that introduced new classification and measurement requirements in 2009 and 2010 and a new hedge accounting model in 2013. In July 2014, the IASB released the final version of IFRS 9, Financial Instruments, which replaces earlier versions of IFRS 9 issued and completes the IASB’s project to replace IAS 39, Financial Instruments: Recognition and Measurement. The standard is effective for annual periods beginning on or after January 1, 2018, with earlier application permitted. The Company is currently evaluating the impact of the standard on its consolidated financial statements. NOTE 3 – NET ASSETS HELD FOR SALE AND DISCONTINUED OPERATIONS
In June 2014, the Company decided to divest its mining business following the decision to focus its resources and capital investment in targeted growth opportunities in its other three core markets: Civil Aviation Training Solutions, Defence and Security and Healthcare. The related assets and liabilities, which were previously reported within the former New Core Markets segment, have been presented as held for sale. The assets and liabilities classified as held for sale are as follows:
2015 Current assets(1) $ 15.8 Intangible assets 42.9 Other non-current assets 2.5 Assets held for sale $ 61.2 Current liabilities $ 12.9 Other non-current liabilities 1.3 Liabilities held for sale $ 14.2 Net assets held for sale $ 47.0
(1) Includes cash and cash equivalents. Analysis of the result of discontinued operations is as follows:
(amounts in millions) 2015 2014 Revenue $ 34.6 $ 37.0 Expenses 31.4 34.3 Earnings before income taxes and measurement to fair value $ 3.2 $ 2.7 Income tax expense 1.7 1.0 Earnings before measurement to fair value $ 1.5 $ 1.7 Loss on measurement to fair value of assets held for sale 1.0 - Income tax recovery (0.1) - Earnings from discontinued operations $ 0.6 $ 1.7
(amounts in millions) 2015 2014 Net cash (used in) provided by operating activities $ (1.6) $ 0.1 Net cash used in investing activities (2.6) (5.2)
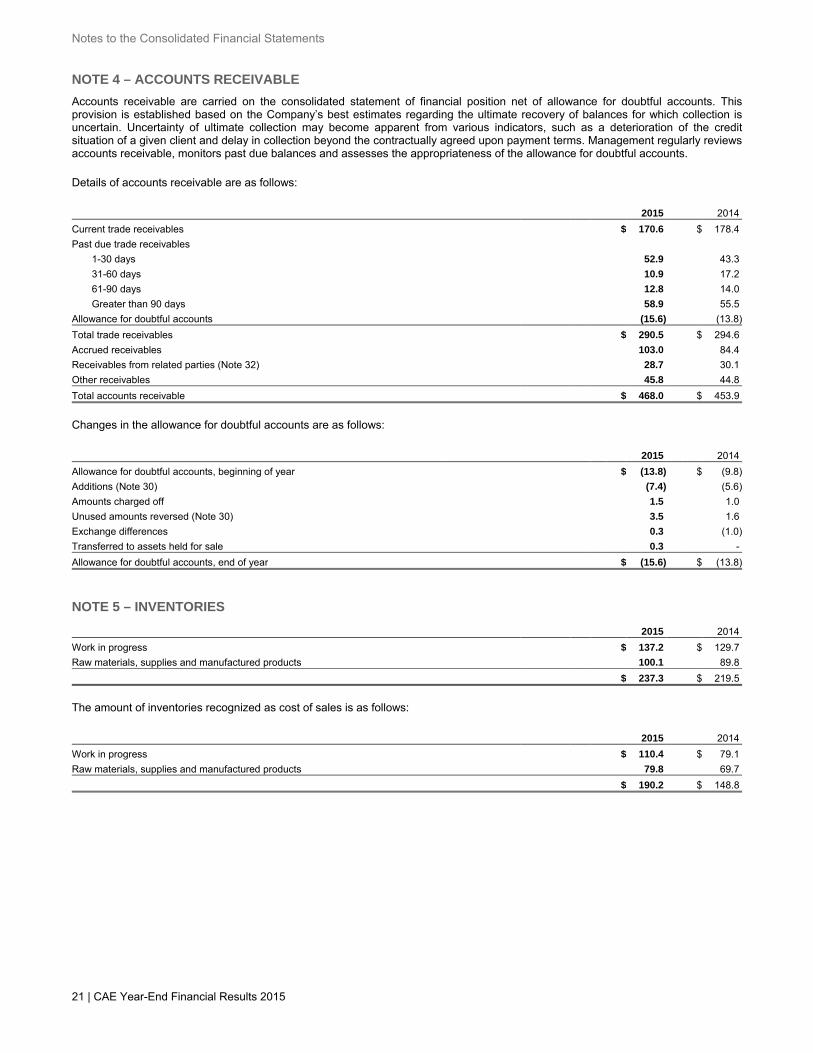
Notes to the Consolidated Financial Statements
21 | CAE Year-End Financial Results 2015
NOTE 4 – ACCOUNTS RECEIVABLE
Accounts receivable are carried on the consolidated statement of financial position net of allowance for doubtful accounts. This provision is established based on the Company’s best estimates regarding the ultimate recovery of balances for which collection is uncertain. Uncertainty of ultimate collection may become apparent from various indicators, such as a deterioration of the credit situation of a given client and delay in collection beyond the contractually agreed upon payment terms. Management regularly reviews accounts receivable, monitors past due balances and assesses the appropriateness of the allowance for doubtful accounts.
Details of accounts receivable are as follows: (amounts in millions) 2015 2014
Current trade receivables $ 170.6 $ 178.4
Past due trade receivables
1-30 days 52.9 43.3
31-60 days 10.9 17.2
61-90 days 12.8 14.0
Greater than 90 days 58.9 55.5
Allowance for doubtful accounts (15.6) (13.8)
Total trade receivables $ 290.5 $ 294.6
Accrued receivables 103.0 84.4
Receivables from related parties (Note 32) 28.7 30.1
Other receivables 45.8 44.8
Total accounts receivable $ 468.0 $ 453.9
Changes in the allowance for doubtful accounts are as follows: (amounts in millions) 2015 2014
Allowance for doubtful accounts, beginning of year $ (13.8) $ (9.8)
Additions (Note 30) (7.4) (5.6)
Amounts charged off 1.5 1.0
Unused amounts reversed (Note 30) 3.5 1.6
Exchange differences 0.3 (1.0)
Transferred to assets held for sale 0.3 -
Allowance for doubtful accounts, end of year $ (15.6) $ (13.8)
NOTE 5 – INVENTORIES
(amounts in millions) 2015 2014
Work in progress $ 137.2 $ 129.7
Raw materials, supplies and manufactured products 100.1 89.8
$ 237.3 $ 219.5
The amount of inventories recognized as cost of sales is as follows: (amounts in millions) 2015 2014
Work in progress $ 110.4 $ 79.1
Raw materials, supplies and manufactured products 79.8 69.7
$ 190.2 $ 148.8
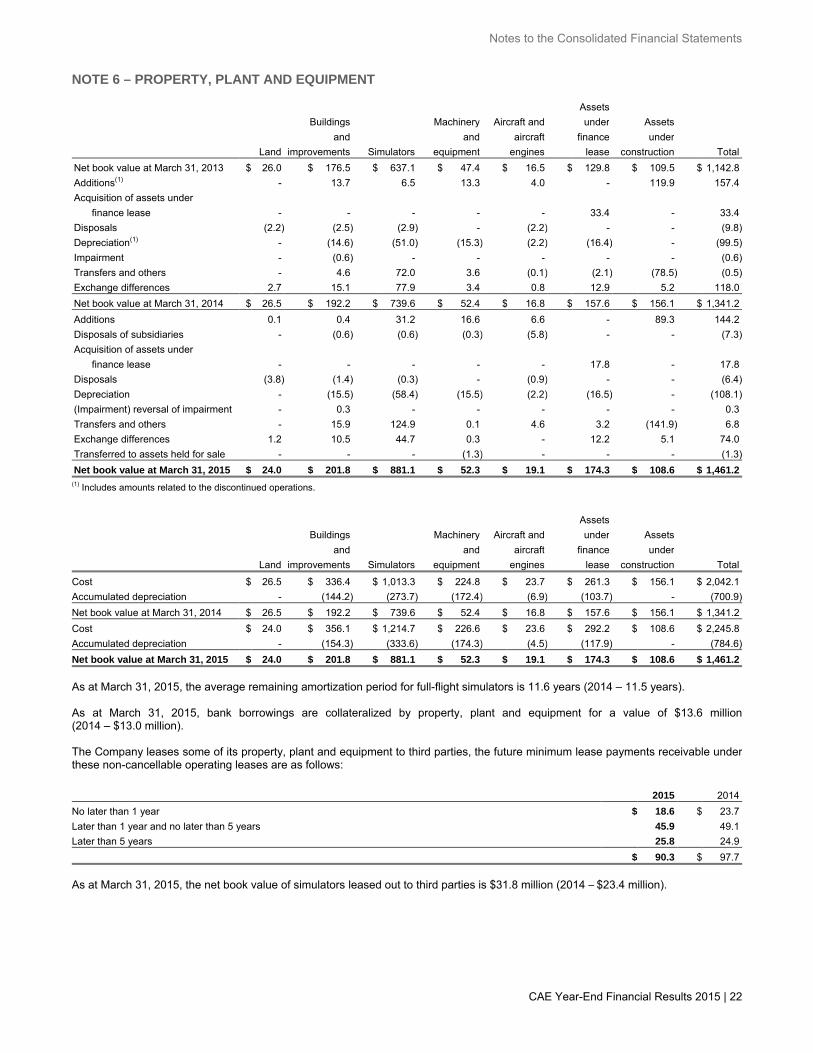
Notes to the Consolidated Financial Statements
CAE Year-End Financial Results 2015 | 22
NOTE 6 – PROPERTY, PLANT AND EQUIPMENT
Assets Buildings Machinery Aircraft and under Assets and and aircraft finance under (amounts in millions) Land improvements Simulators equipment engines lease construction Total Net book value at March 31, 2013 $ 26.0 $ 176.5 $ 637.1 $ 47.4 $ 16.5 $ 129.8 $ 109.5 $ 1,142.8 Additions(1) - 13.7 6.5 13.3 4.0 - 119.9 157.4 Acquisition of assets under finance lease - - - - - 33.4 - 33.4 Disposals (2.2) (2.5) (2.9) - (2.2) - - (9.8) Depreciation(1) - (14.6) (51.0) (15.3) (2.2) (16.4) - (99.5) Impairment - (0.6) - - - - - (0.6) Transfers and others - 4.6 72.0 3.6 (0.1) (2.1) (78.5) (0.5) Exchange differences 2.7 15.1 77.9 3.4 0.8 12.9 5.2 118.0 Net book value at March 31, 2014 $ 26.5 $ 192.2 $ 739.6 $ 52.4 $ 16.8 $ 157.6 $ 156.1 $ 1,341.2 Additions 0.1 0.4 31.2 16.6 6.6 - 89.3 144.2 Disposals of subsidiaries - (0.6) (0.6) (0.3) (5.8) - - (7.3) Acquisition of assets under finance lease - - - - - 17.8 - 17.8 Disposals (3.8) (1.4) (0.3) - (0.9) - - (6.4) Depreciation - (15.5) (58.4) (15.5) (2.2) (16.5) - (108.1) (Impairment) reversal of impairment - 0.3 - - - - - 0.3 Transfers and others - 15.9 124.9 0.1 4.6 3.2 (141.9) 6.8 Exchange differences 1.2 10.5 44.7 0.3 - 12.2 5.1 74.0 Transferred to assets held for sale - - - (1.3) - - - (1.3) Net book value at March 31, 2015 $ 24.0 $ 201.8 $ 881.1 $ 52.3 $ 19.1 $ 174.3 $ 108.6 $ 1,461.2 (1) Includes amounts related to the discontinued operations.
Assets
Buildings Machinery Aircraft and under Assets
and and aircraft finance under
(amounts in millions) Land improvements Simulators equipment engines lease construction Total
Cost $ 26.5 $ 336.4 $ 1,013.3 $ 224.8 $ 23.7 $ 261.3 $ 156.1 $ 2,042.1
Accumulated depreciation - (144.2) (273.7) (172.4) (6.9) (103.7) - (700.9)
Net book value at March 31, 2014 $ 26.5 $ 192.2 $ 739.6 $ 52.4 $ 16.8 $ 157.6 $ 156.1 $ 1,341.2
Cost $ 24.0 $ 356.1 $ 1,214.7 $ 226.6 $ 23.6 $ 292.2 $ 108.6 $ 2,245.8
Accumulated depreciation - (154.3) (333.6) (174.3) (4.5) (117.9) - (784.6)
Net book value at March 31, 2015 $ 24.0 $ 201.8 $ 881.1 $ 52.3 $ 19.1 $ 174.3 $ 108.6 $ 1,461.2
As at March 31, 2015, the average remaining amortization period for full-flight simulators is 11.6 years (2014 – 11.5 years). As at March 31, 2015, bank borrowings are collateralized by property, plant and equipment for a value of $13.6 million (2014 – $13.0 million). The Company leases some of its property, plant and equipment to third parties, the future minimum lease payments receivable under these non-cancellable operating leases are as follows: (amounts in millions) 2015 2014
No later than 1 year $ 18.6 $ 23.7
Later than 1 year and no later than 5 years 45.9 49.1
Later than 5 years 25.8 24.9
$ 90.3 $ 97.7
As at March 31, 2015, the net book value of simulators leased out to third parties is $31.8 million (2014 – $23.4 million).
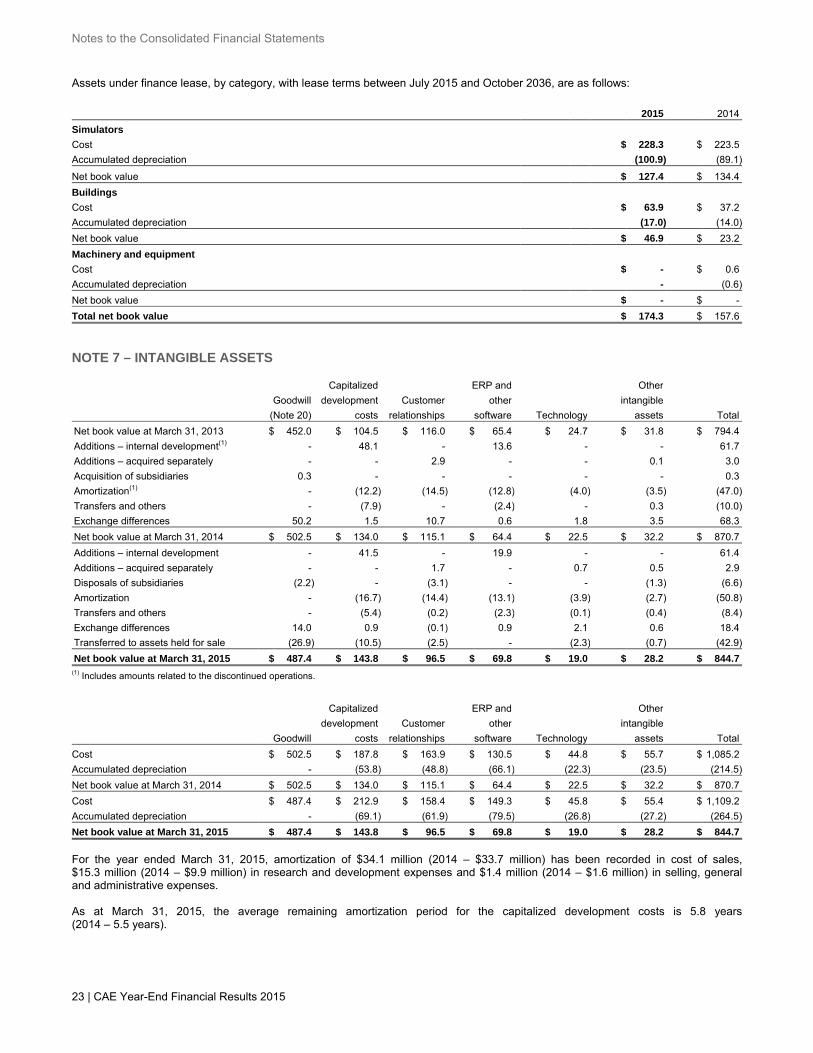
Notes to the Consolidated Financial Statements
23 | CAE Year-End Financial Results 2015
Assets under finance lease, by category, with lease terms between July 2015 and October 2036, are as follows: (amounts in millions) 2015 2014
Simulators
Cost $ 228.3 $ 223.5
Accumulated depreciation (100.9) (89.1)
Net book value $ 127.4 $ 134.4
Buildings
Cost $ 63.9 $ 37.2
Accumulated depreciation (17.0) (14.0)
Net book value $ 46.9 $ 23.2
Machinery and equipment
Cost $ - $ 0.6
Accumulated depreciation - (0.6)
Net book value $ - $ -
Total net book value $ 174.3 $ 157.6
NOTE 7 – INTANGIBLE ASSETS
Capitalized ERP and Other Goodwill development Customer other intangible
(amounts in millions) (Note 20) costs relationships software Technology assets Total Net book value at March 31, 2013 $ 452.0 $ 104.5 $ 116.0 $ 65.4 $ 24.7 $ 31.8 $ 794.4 Additions – internal development(1) - 48.1 - 13.6 - - 61.7 Additions – acquired separately - - 2.9 - - 0.1 3.0 Acquisition of subsidiaries 0.3 - - - - - 0.3 Amortization(1) - (12.2) (14.5) (12.8) (4.0) (3.5) (47.0) Transfers and others - (7.9) - (2.4) - 0.3 (10.0) Exchange differences 50.2 1.5 10.7 0.6 1.8 3.5 68.3 Net book value at March 31, 2014 $ 502.5 $ 134.0 $ 115.1 $ 64.4 $ 22.5 $ 32.2 $ 870.7 Additions – internal development - 41.5 - 19.9 - - 61.4 Additions – acquired separately - - 1.7 - 0.7 0.5 2.9 Disposals of subsidiaries (2.2) - (3.1) - - (1.3) (6.6) Amortization - (16.7) (14.4) (13.1) (3.9) (2.7) (50.8) Transfers and others - (5.4) (0.2) (2.3) (0.1) (0.4) (8.4) Exchange differences 14.0 0.9 (0.1) 0.9 2.1 0.6 18.4 Transferred to assets held for sale (26.9) (10.5) (2.5) - (2.3) (0.7) (42.9) Net book value at March 31, 2015 $ 487.4 $ 143.8 $ 96.5 $ 69.8 $ 19.0 $ 28.2 $ 844.7 (1) Includes amounts related to the discontinued operations.
Capitalized ERP and Other
development Customer other intangible
(amounts in millions) Goodwill costs relationships software Technology assets Total
Cost $ 502.5 $ 187.8 $ 163.9 $ 130.5 $ 44.8 $ 55.7 $ 1,085.2
Accumulated depreciation - (53.8) (48.8) (66.1) (22.3) (23.5) (214.5)
Net book value at March 31, 2014 $ 502.5 $ 134.0 $ 115.1 $ 64.4 $ 22.5 $ 32.2 $ 870.7
Cost $ 487.4 $ 212.9 $ 158.4 $ 149.3 $ 45.8 $ 55.4 $ 1,109.2
Accumulated depreciation - (69.1) (61.9) (79.5) (26.8) (27.2) (264.5)
Net book value at March 31, 2015 $ 487.4 $ 143.8 $ 96.5 $ 69.8 $ 19.0 $ 28.2 $ 844.7
For the year ended March 31, 2015, amortization of $34.1 million (2014 – $33.7 million) has been recorded in cost of sales, $15.3 million (2014 – $9.9 million) in research and development expenses and $1.4 million (2014 – $1.6 million) in selling, general and administrative expenses. As at March 31, 2015, the average remaining amortization period for the capitalized development costs is 5.8 years (2014 – 5.5 years).
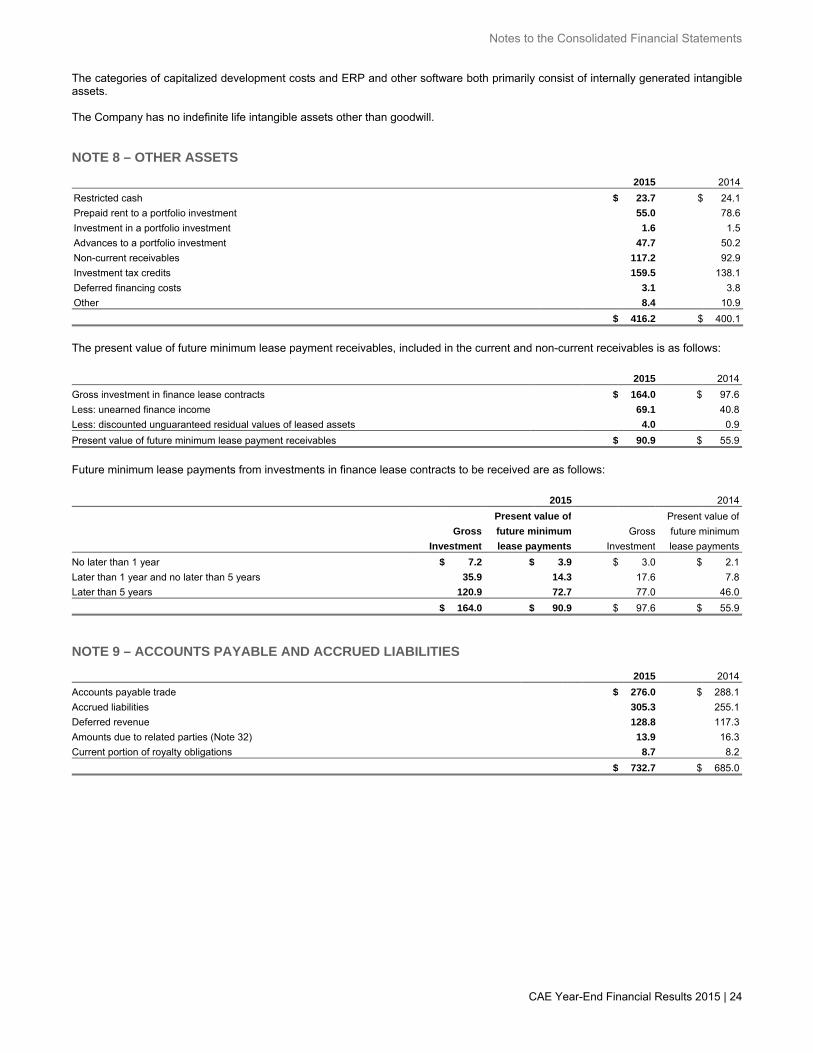
Notes to the Consolidated Financial Statements
CAE Year-End Financial Results 2015 | 24
The categories of capitalized development costs and ERP and other software both primarily consist of internally generated intangible assets. The Company has no indefinite life intangible assets other than goodwill. NOTE 8 – OTHER ASSETS
(amounts in millions) 2015 2014 Restricted cash $ 23.7 $ 24.1 Prepaid rent to a portfolio investment 55.0 78.6 Investment in a portfolio investment 1.6 1.5 Advances to a portfolio investment 47.7 50.2 Non-current receivables 117.2 92.9 Investment tax credits 159.5 138.1 Deferred financing costs 3.1 3.8 Other 8.4 10.9 $ 416.2 $ 400.1
The present value of future minimum lease payment receivables, included in the current and non-current receivables is as follows: (amounts in millions) 2015 2014
Gross investment in finance lease contracts $ 164.0 $ 97.6
Less: unearned finance income 69.1 40.8
Less: discounted unguaranteed residual values of leased assets 4.0 0.9
Present value of future minimum lease payment receivables $ 90.9 $ 55.9
Future minimum lease payments from investments in finance lease contracts to be received are as follows: (amounts in millions) 2015 2014
Present value of Present value of
Gross future minimum Gross future minimum
Investment lease payments Investment lease payments
No later than 1 year $ 7.2 $ 3.9 $ 3.0 $ 2.1
Later than 1 year and no later than 5 years 35.9 14.3 17.6 7.8
Later than 5 years 120.9 72.7 77.0 46.0
$ 164.0 $ 90.9 $ 97.6 $ 55.9
NOTE 9 – ACCOUNTS PAYABLE AND ACCRUED LIABILITIES
(amounts in millions) 2015 2014
Accounts payable trade $ 276.0 $ 288.1
Accrued liabilities 305.3 255.1
Deferred revenue 128.8 117.3
Amounts due to related parties (Note 32) 13.9 16.3
Current portion of royalty obligations 8.7 8.2
$ 732.7 $ 685.0
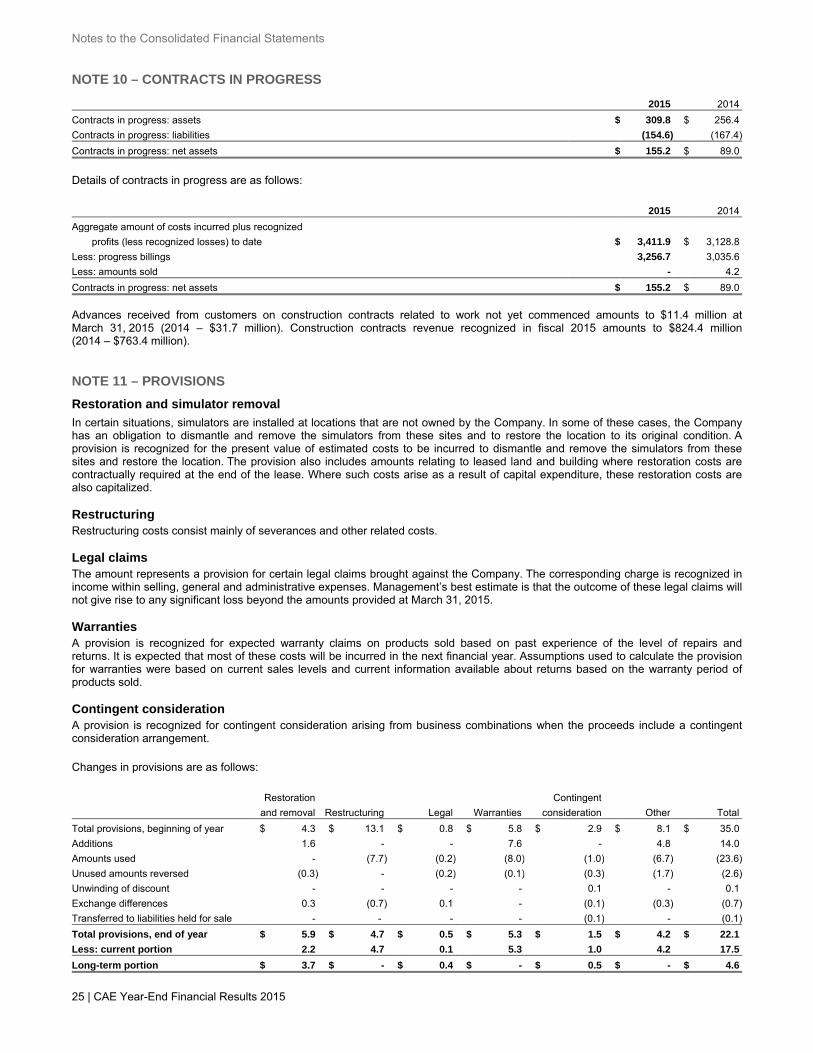
Notes to the Consolidated Financial Statements
25 | CAE Year-End Financial Results 2015
NOTE 10 – CONTRACTS IN PROGRESS
(amounts in millions) 2015 2014
Contracts in progress: assets $ 309.8 $ 256.4
Contracts in progress: liabilities (154.6) (167.4)
Contracts in progress: net assets $ 155.2 $ 89.0
Details of contracts in progress are as follows: (amounts in millions) 2015 2014
Aggregate amount of costs incurred plus recognized
profits (less recognized losses) to date $ 3,411.9 $ 3,128.8
Less: progress billings 3,256.7 3,035.6
Less: amounts sold - 4.2
Contracts in progress: net assets $ 155.2 $ 89.0
Advances received from customers on construction contracts related to work not yet commenced amounts to $11.4 million at March 31, 2015 (2014 – $31.7 million). Construction contracts revenue recognized in fiscal 2015 amounts to $824.4 million (2014 – $763.4 million). NOTE 11 – PROVISIONS
Restoration and simulator removal
In certain situations, simulators are installed at locations that are not owned by the Company. In some of these cases, the Company has an obligation to dismantle and remove the simulators from these sites and to restore the location to its original condition. A provision is recognized for the present value of estimated costs to be incurred to dismantle and remove the simulators from these sites and restore the location. The provision also includes amounts relating to leased land and building where restoration costs are contractually required at the end of the lease. Where such costs arise as a result of capital expenditure, these restoration costs are also capitalized. Restructuring Restructuring costs consist mainly of severances and other related costs. Legal claims The amount represents a provision for certain legal claims brought against the Company. The corresponding charge is recognized in income within selling, general and administrative expenses. Management’s best estimate is that the outcome of these legal claims will not give rise to any significant loss beyond the amounts provided at March 31, 2015. Warranties A provision is recognized for expected warranty claims on products sold based on past experience of the level of repairs and returns. It is expected that most of these costs will be incurred in the next financial year. Assumptions used to calculate the provision for warranties were based on current sales levels and current information available about returns based on the warranty period of products sold. Contingent consideration A provision is recognized for contingent consideration arising from business combinations when the proceeds include a contingent consideration arrangement.
Changes in provisions are as follows:
Restoration Contingent
(amounts in millions) and removal Restructuring Legal Warranties consideration Other Total
Total provisions, beginning of year $ 4.3 $ 13.1 $ 0.8 $ 5.8 $ 2.9 $ 8.1 $ 35.0
Additions 1.6 - - 7.6 - 4.8 14.0
Amounts used - (7.7) (0.2) (8.0) (1.0) (6.7) (23.6)
Unused amounts reversed (0.3) - (0.2) (0.1) (0.3) (1.7) (2.6)
Unwinding of discount - - - - 0.1 - 0.1
Exchange differences 0.3 (0.7) 0.1 - (0.1) (0.3) (0.7)
Transferred to liabilities held for sale - - - - (0.1) - (0.1)
Total provisions, end of year $ 5.9 $ 4.7 $ 0.5 $ 5.3 $ 1.5 $ 4.2 $ 22.1
Less: current portion 2.2 4.7 0.1 5.3 1.0 4.2 17.5
Long-term portion $ 3.7 $ - $ 0.4 $ - $ 0.5 $ - $ 4.6
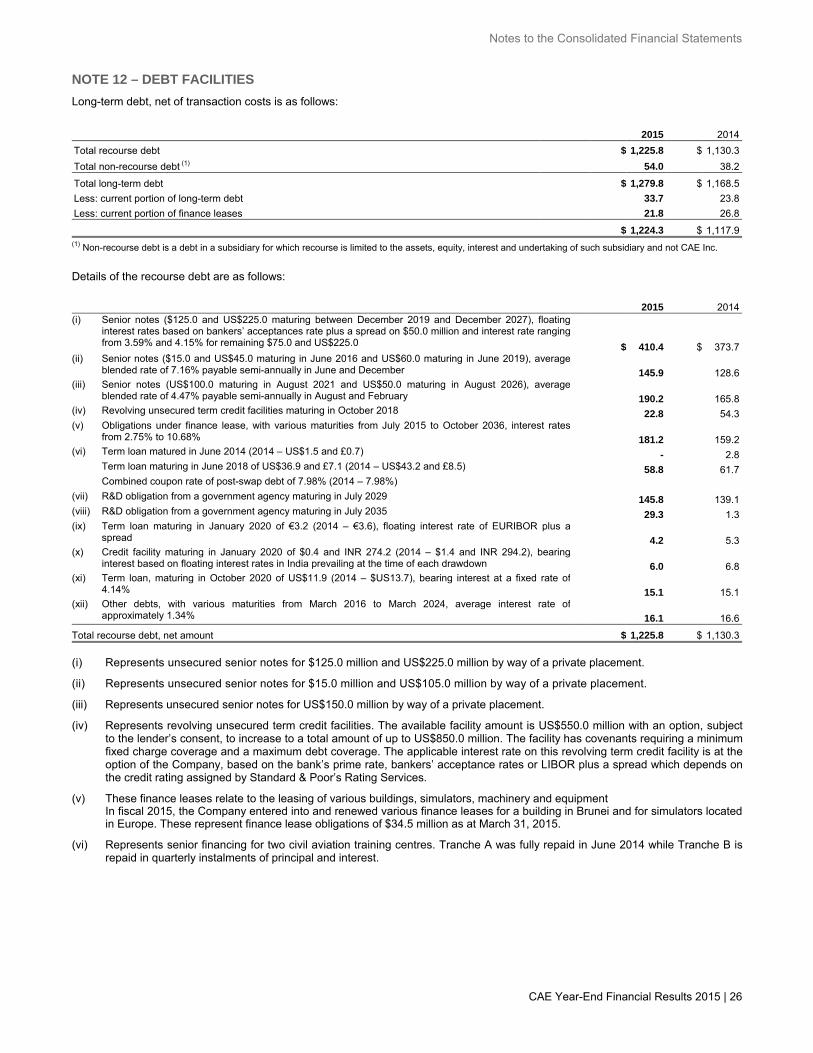
Notes to the Consolidated Financial Statements
CAE Year-End Financial Results 2015 | 26
NOTE 12 – DEBT FACILITIES
Long-term debt, net of transaction costs is as follows: (amounts in millions) 2015 2014 Total recourse debt $ 1,225.8 $ 1,130.3 Total non-recourse debt (1) 54.0 38.2 Total long-term debt $ 1,279.8 $ 1,168.5 Less: current portion of long-term debt 33.7 23.8 Less: current portion of finance leases 21.8 26.8 $ 1,224.3 $ 1,117.9 (1) Non-recourse debt is a debt in a subsidiary for which recourse is limited to the assets, equity, interest and undertaking of such subsidiary and not CAE Inc. Details of the recourse debt are as follows: (amounts in millions) 2015 2014 (i) Senior notes ($125.0 and US$225.0 maturing between December 2019 and December 2027), floating
interest rates based on bankers’ acceptances rate plus a spread on $50.0 million and interest rate rangingfrom 3.59% and 4.15% for remaining $75.0 and US$225.0 $ 410.4 $ 373.7
(ii) Senior notes ($15.0 and US$45.0 maturing in June 2016 and US$60.0 maturing in June 2019), averageblended rate of 7.16% payable semi-annually in June and December 145.9 128.6
(iii) Senior notes (US$100.0 maturing in August 2021 and US$50.0 maturing in August 2026), average blended rate of 4.47% payable semi-annually in August and February 190.2 165.8
(iv) Revolving unsecured term credit facilities maturing in October 2018 22.8 54.3 (v) Obligations under finance lease, with various maturities from July 2015 to October 2036, interest rates
from 2.75% to 10.68% 181.2 159.2 (vi) Term loan matured in June 2014 (2014 – US$1.5 and £0.7) - 2.8 Term loan maturing in June 2018 of US$36.9 and £7.1 (2014 – US$43.2 and £8.5) 58.8 61.7
Combined coupon rate of post-swap debt of 7.98% (2014 – 7.98%) (vii) R&D obligation from a government agency maturing in July 2029 145.8 139.1 (viii) R&D obligation from a government agency maturing in July 2035 29.3 1.3 (ix) Term loan maturing in January 2020 of €3.2 (2014 – €3.6), floating interest rate of EURIBOR plus a
spread 4.2 5.3 (x) Credit facility maturing in January 2020 of $0.4 and INR 274.2 (2014 – $1.4 and INR 294.2), bearing
interest based on floating interest rates in India prevailing at the time of each drawdown 6.0 6.8 (xi) Term loan, maturing in October 2020 of US$11.9 (2014 – $US13.7), bearing interest at a fixed rate of
4.14% 15.1 15.1 (xii) Other debts, with various maturities from March 2016 to March 2024, average interest rate of
approximately 1.34% 16.1 16.6
Total recourse debt, net amount $ 1,225.8 $ 1,130.3
(i) Represents unsecured senior notes for $125.0 million and US$225.0 million by way of a private placement. (ii) Represents unsecured senior notes for $15.0 million and US$105.0 million by way of a private placement. (iii) Represents unsecured senior notes for US$150.0 million by way of a private placement. (iv) Represents revolving unsecured term credit facilities. The available facility amount is US$550.0 million with an option, subject
to the lender’s consent, to increase to a total amount of up to US$850.0 million. The facility has covenants requiring a minimum fixed charge coverage and a maximum debt coverage. The applicable interest rate on this revolving term credit facility is at the option of the Company, based on the bank’s prime rate, bankers’ acceptance rates or LIBOR plus a spread which depends on the credit rating assigned by Standard & Poor’s Rating Services.
(v) These finance leases relate to the leasing of various buildings, simulators, machinery and equipment
In fiscal 2015, the Company entered into and renewed various finance leases for a building in Brunei and for simulators located in Europe. These represent finance lease obligations of $34.5 million as at March 31, 2015.
(vi) Represents senior financing for two civil aviation training centres. Tranche A was fully repaid in June 2014 while Tranche B is
repaid in quarterly instalments of principal and interest.
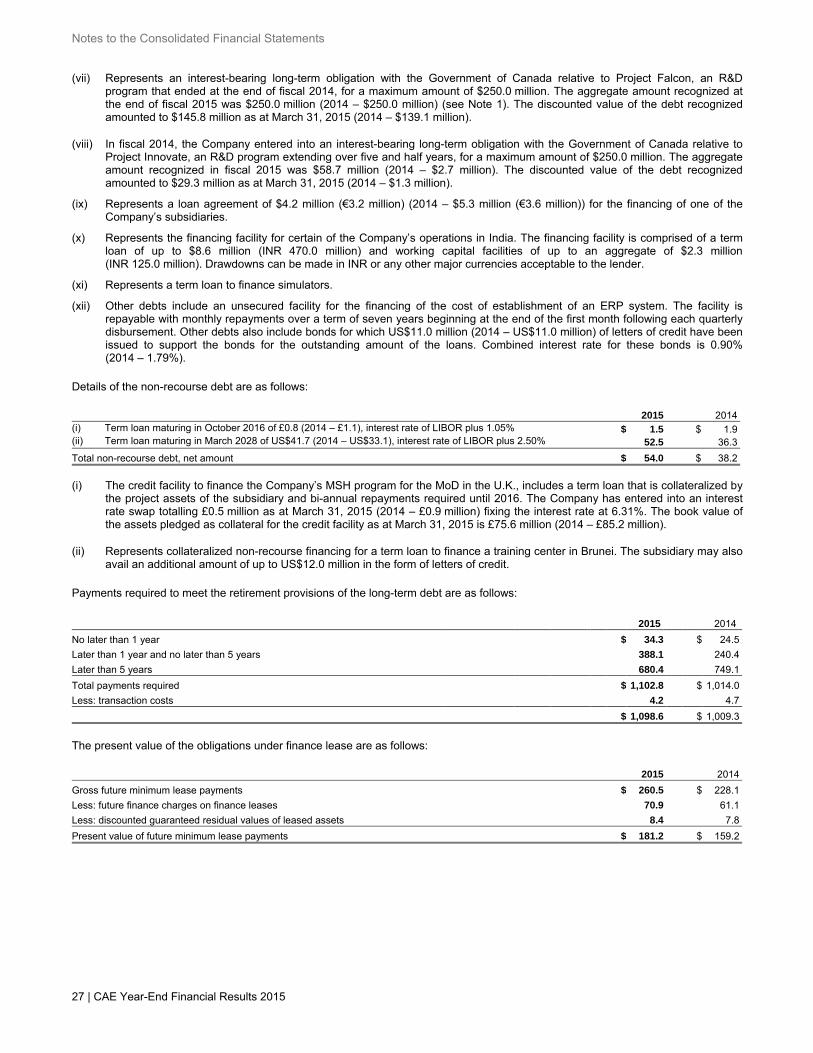
Notes to the Consolidated Financial Statements
27 | CAE Year-End Financial Results 2015
(vii) Represents an interest-bearing long-term obligation with the Government of Canada relative to Project Falcon, an R&D program that ended at the end of fiscal 2014, for a maximum amount of $250.0 million. The aggregate amount recognized at the end of fiscal 2015 was $250.0 million (2014 – $250.0 million) (see Note 1). The discounted value of the debt recognized amounted to $145.8 million as at March 31, 2015 (2014 – $139.1 million).
(viii) In fiscal 2014, the Company entered into an interest-bearing long-term obligation with the Government of Canada relative to
Project Innovate, an R&D program extending over five and half years, for a maximum amount of $250.0 million. The aggregate amount recognized in fiscal 2015 was $58.7 million (2014 – $2.7 million). The discounted value of the debt recognized amounted to $29.3 million as at March 31, 2015 (2014 – $1.3 million).
(ix) Represents a loan agreement of $4.2 million (€3.2 million) (2014 – $5.3 million (€3.6 million)) for the financing of one of the
Company’s subsidiaries. (x) Represents the financing facility for certain of the Company’s operations in India. The financing facility is comprised of a term
loan of up to $8.6 million (INR 470.0 million) and working capital facilities of up to an aggregate of $2.3 million (INR 125.0 million). Drawdowns can be made in INR or any other major currencies acceptable to the lender.
(xi) Represents a term loan to finance simulators. (xii) Other debts include an unsecured facility for the financing of the cost of establishment of an ERP system. The facility is
repayable with monthly repayments over a term of seven years beginning at the end of the first month following each quarterly disbursement. Other debts also include bonds for which US$11.0 million (2014 – US$11.0 million) of letters of credit have been issued to support the bonds for the outstanding amount of the loans. Combined interest rate for these bonds is 0.90% (2014 – 1.79%).
Details of the non-recourse debt are as follows:
(amounts in millions) 2015 2014(i) Term loan maturing in October 2016 of £0.8 (2014 – £1.1), interest rate of LIBOR plus 1.05% $ 1.5 $ 1.9(ii) Term loan maturing in March 2028 of US$41.7 (2014 – US$33.1), interest rate of LIBOR plus 2.50% 52.5 36.3
Total non-recourse debt, net amount $ 54.0 $ 38.2
(i) The credit facility to finance the Company’s MSH program for the MoD in the U.K., includes a term loan that is collateralized by
the project assets of the subsidiary and bi-annual repayments required until 2016. The Company has entered into an interest rate swap totalling £0.5 million as at March 31, 2015 (2014 – £0.9 million) fixing the interest rate at 6.31%. The book value of the assets pledged as collateral for the credit facility as at March 31, 2015 is £75.6 million (2014 – £85.2 million).
(ii) Represents collateralized non-recourse financing for a term loan to finance a training center in Brunei. The subsidiary may also
avail an additional amount of up to US$12.0 million in the form of letters of credit.
Payments required to meet the retirement provisions of the long-term debt are as follows: (amounts in millions) 2015 2014
No later than 1 year $ 34.3 $ 24.5
Later than 1 year and no later than 5 years 388.1 240.4
Later than 5 years 680.4 749.1
Total payments required $ 1,102.8 $ 1,014.0
Less: transaction costs 4.2 4.7
$ 1,098.6 $ 1,009.3
The present value of the obligations under finance lease are as follows: (amounts in millions) 2015 2014
Gross future minimum lease payments $ 260.5 $ 228.1
Less: future finance charges on finance leases 70.9 61.1
Less: discounted guaranteed residual values of leased assets 8.4 7.8
Present value of future minimum lease payments $ 181.2 $ 159.2
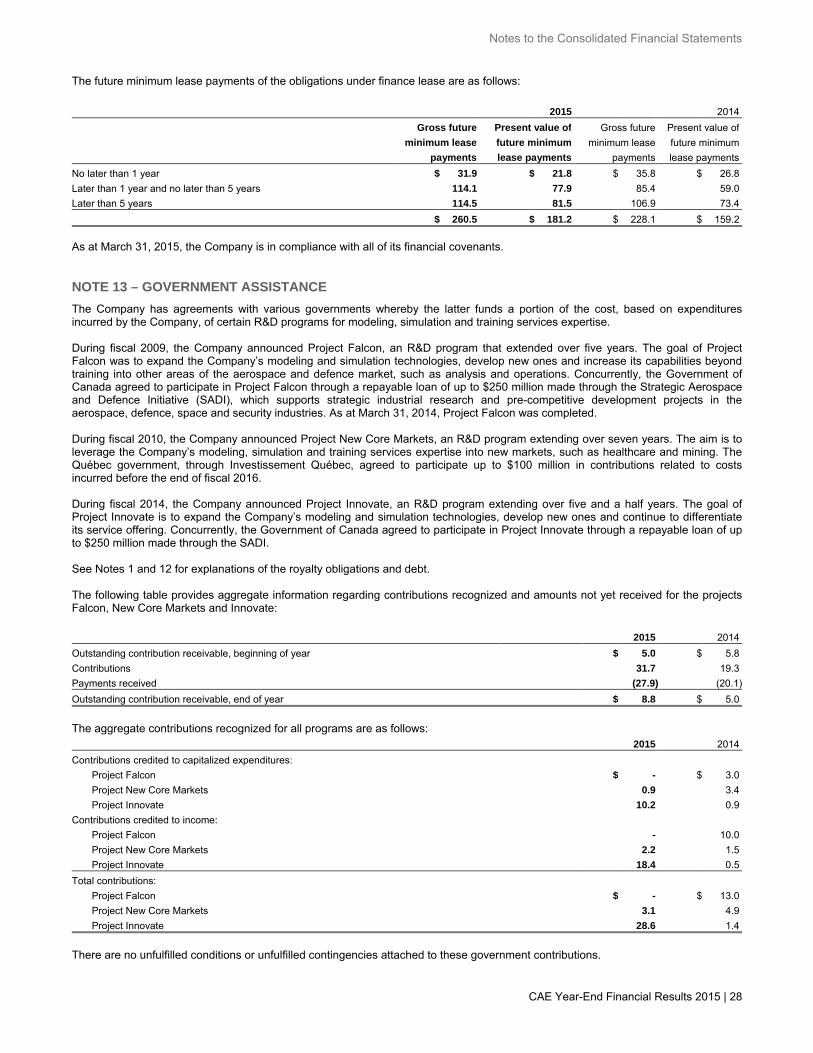
Notes to the Consolidated Financial Statements
CAE Year-End Financial Results 2015 | 28
The future minimum lease payments of the obligations under finance lease are as follows: (amounts in millions) 2015 2014
Gross future Present value of Gross future Present value of
minimum lease future minimum minimum lease future minimum
payments lease payments payments lease payments
No later than 1 year $ 31.9 $ 21.8 $ 35.8 $ 26.8
Later than 1 year and no later than 5 years 114.1 77.9 85.4 59.0
Later than 5 years 114.5 81.5 106.9 73.4
$ 260.5 $ 181.2 $ 228.1 $ 159.2
As at March 31, 2015, the Company is in compliance with all of its financial covenants. NOTE 13 – GOVERNMENT ASSISTANCE
The Company has agreements with various governments whereby the latter funds a portion of the cost, based on expenditures incurred by the Company, of certain R&D programs for modeling, simulation and training services expertise. During fiscal 2009, the Company announced Project Falcon, an R&D program that extended over five years. The goal of Project Falcon was to expand the Company’s modeling and simulation technologies, develop new ones and increase its capabilities beyond training into other areas of the aerospace and defence market, such as analysis and operations. Concurrently, the Government of Canada agreed to participate in Project Falcon through a repayable loan of up to $250 million made through the Strategic Aerospace and Defence Initiative (SADI), which supports strategic industrial research and pre-competitive development projects in the aerospace, defence, space and security industries. As at March 31, 2014, Project Falcon was completed. During fiscal 2010, the Company announced Project New Core Markets, an R&D program extending over seven years. The aim is to leverage the Company’s modeling, simulation and training services expertise into new markets, such as healthcare and mining. The Québec government, through Investissement Québec, agreed to participate up to $100 million in contributions related to costs incurred before the end of fiscal 2016. During fiscal 2014, the Company announced Project Innovate, an R&D program extending over five and a half years. The goal of Project Innovate is to expand the Company’s modeling and simulation technologies, develop new ones and continue to differentiate its service offering. Concurrently, the Government of Canada agreed to participate in Project Innovate through a repayable loan of up to $250 million made through the SADI. See Notes 1 and 12 for explanations of the royalty obligations and debt. The following table provides aggregate information regarding contributions recognized and amounts not yet received for the projects Falcon, New Core Markets and Innovate:
(amounts in millions) 2015 2014
Outstanding contribution receivable, beginning of year $ 5.0 $ 5.8
Contributions 31.7 19.3
Payments received (27.9) (20.1)
Outstanding contribution receivable, end of year $ 8.8 $ 5.0
The aggregate contributions recognized for all programs are as follows:(amounts in millions) 2015 2014
Contributions credited to capitalized expenditures:
Project Falcon $ - $ 3.0
Project New Core Markets 0.9 3.4
Project Innovate 10.2 0.9
Contributions credited to income:
Project Falcon - 10.0
Project New Core Markets 2.2 1.5
Project Innovate 18.4 0.5
Total contributions:
Project Falcon $ - $ 13.0
Project New Core Markets 3.1 4.9
Project Innovate 28.6 1.4
There are no unfulfilled conditions or unfulfilled contingencies attached to these government contributions.
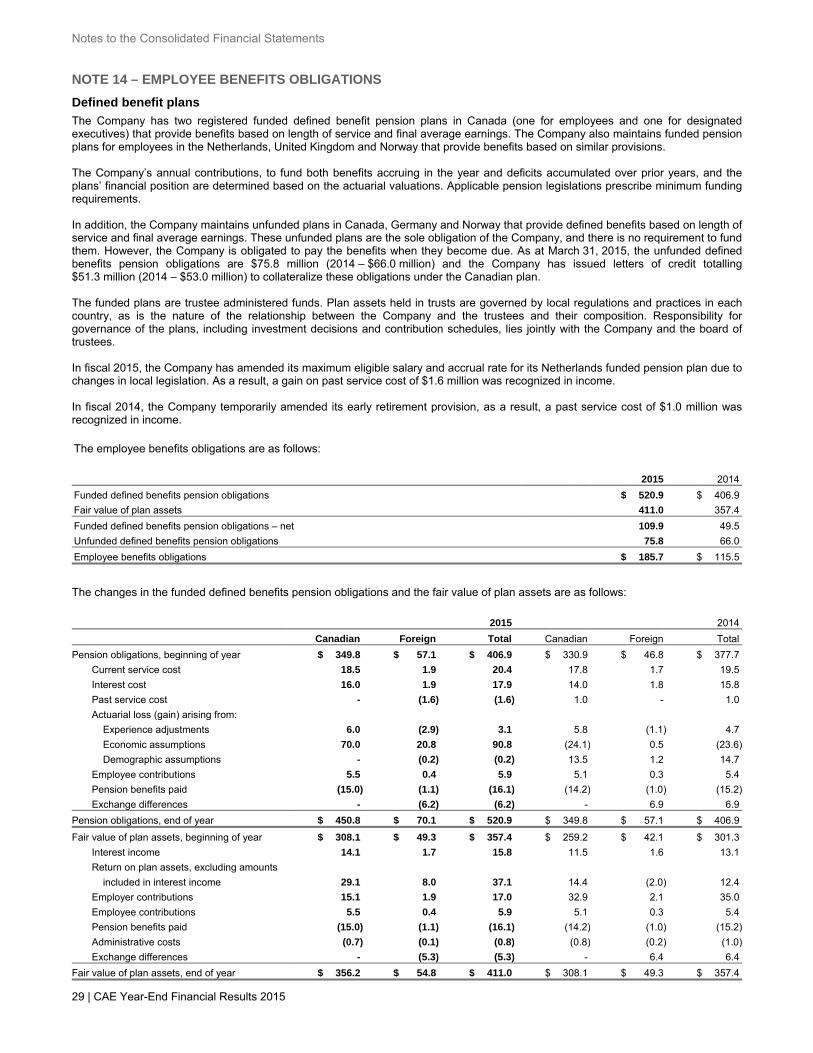
Notes to the Consolidated Financial Statements
29 | CAE Year-End Financial Results 2015
NOTE 14 – EMPLOYEE BENEFITS OBLIGATIONS
Defined benefit plans
The Company has two registered funded defined benefit pension plans in Canada (one for employees and one for designated executives) that provide benefits based on length of service and final average earnings. The Company also maintains funded pension plans for employees in the Netherlands, United Kingdom and Norway that provide benefits based on similar provisions. The Company’s annual contributions, to fund both benefits accruing in the year and deficits accumulated over prior years, and the plans’ financial position are determined based on the actuarial valuations. Applicable pension legislations prescribe minimum funding requirements. In addition, the Company maintains unfunded plans in Canada, Germany and Norway that provide defined benefits based on length of service and final average earnings. These unfunded plans are the sole obligation of the Company, and there is no requirement to fund them. However, the Company is obligated to pay the benefits when they become due. As at March 31, 2015, the unfunded defined benefits pension obligations are $75.8 million (2014 – $66.0 million) and the Company has issued letters of credit totalling $51.3 million (2014 – $53.0 million) to collateralize these obligations under the Canadian plan. The funded plans are trustee administered funds. Plan assets held in trusts are governed by local regulations and practices in each country, as is the nature of the relationship between the Company and the trustees and their composition. Responsibility for governance of the plans, including investment decisions and contribution schedules, lies jointly with the Company and the board of trustees. In fiscal 2015, the Company has amended its maximum eligible salary and accrual rate for its Netherlands funded pension plan due to changes in local legislation. As a result, a gain on past service cost of $1.6 million was recognized in income. In fiscal 2014, the Company temporarily amended its early retirement provision, as a result, a past service cost of $1.0 million was recognized in income. The employee benefits obligations are as follows: (amounts in millions) 2015 2014 Funded defined benefits pension obligations $ 520.9 $ 406.9 Fair value of plan assets 411.0 357.4 Funded defined benefits pension obligations – net 109.9 49.5 Unfunded defined benefits pension obligations 75.8 66.0 Employee benefits obligations $ 185.7 $ 115.5
The changes in the funded defined benefits pension obligations and the fair value of plan assets are as follows: (amounts in millions) 2015 2014
Canadian Foreign Total Canadian Foreign Total
Pension obligations, beginning of year $ 349.8 $ 57.1 $ 406.9 $ 330.9 $ 46.8 $ 377.7
Current service cost 18.5 1.9 20.4 17.8 1.7 19.5
Interest cost 16.0 1.9 17.9 14.0 1.8 15.8
Past service cost - (1.6) (1.6) 1.0 - 1.0
Actuarial loss (gain) arising from:
Experience adjustments 6.0 (2.9) 3.1 5.8 (1.1) 4.7
Economic assumptions 70.0 20.8 90.8 (24.1) 0.5 (23.6)
Demographic assumptions - (0.2) (0.2) 13.5 1.2 14.7
Employee contributions 5.5 0.4 5.9 5.1 0.3 5.4
Pension benefits paid (15.0) (1.1) (16.1) (14.2) (1.0) (15.2)
Exchange differences - (6.2) (6.2) - 6.9 6.9
Pension obligations, end of year $ 450.8 $ 70.1 $ 520.9 $ 349.8 $ 57.1 $ 406.9
Fair value of plan assets, beginning of year $ 308.1 $ 49.3 $ 357.4 $ 259.2 $ 42.1 $ 301.3
Interest income 14.1 1.7 15.8 11.5 1.6 13.1
Return on plan assets, excluding amounts
included in interest income 29.1 8.0 37.1 14.4 (2.0) 12.4
Employer contributions 15.1 1.9 17.0 32.9 2.1 35.0
Employee contributions 5.5 0.4 5.9 5.1 0.3 5.4
Pension benefits paid (15.0) (1.1) (16.1) (14.2) (1.0) (15.2)
Administrative costs (0.7) (0.1) (0.8) (0.8) (0.2) (1.0)
Exchange differences - (5.3) (5.3) - 6.4 6.4
Fair value of plan assets, end of year $ 356.2 $ 54.8 $ 411.0 $ 308.1 $ 49.3 $ 357.4
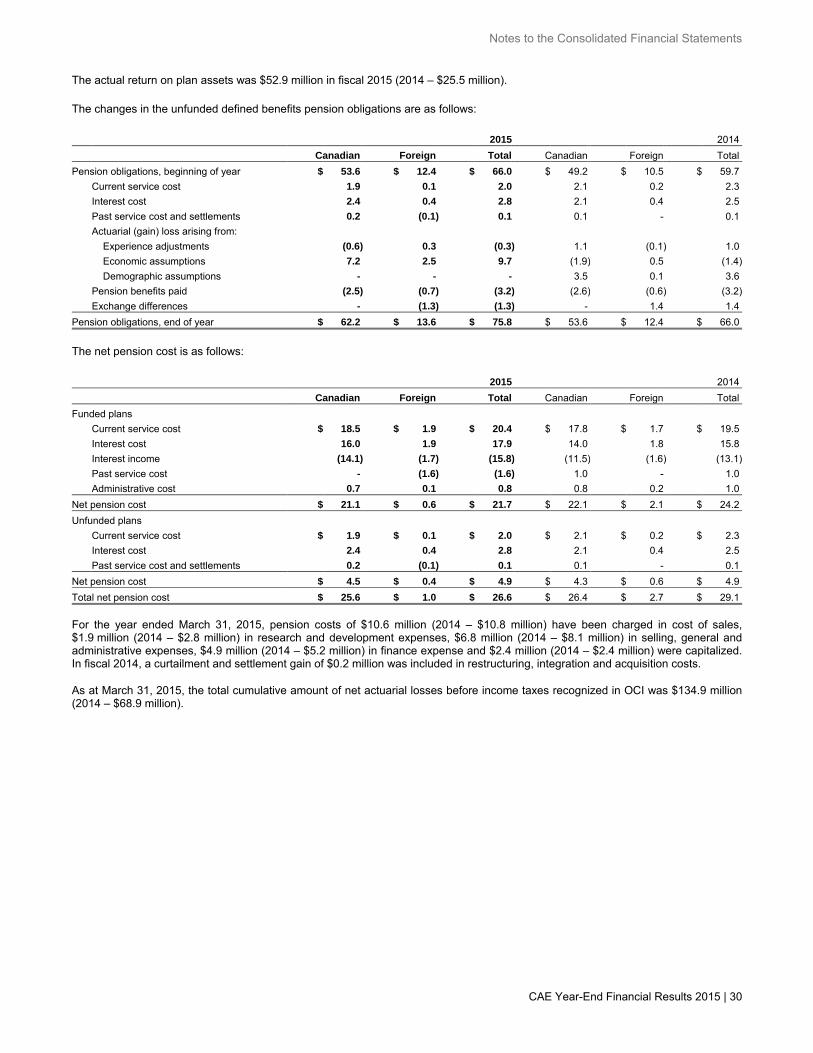
Notes to the Consolidated Financial Statements
CAE Year-End Financial Results 2015 | 30
The actual return on plan assets was $52.9 million in fiscal 2015 (2014 – $25.5 million).
The changes in the unfunded defined benefits pension obligations are as follows: (amounts in millions) 2015 2014
Canadian Foreign Total Canadian Foreign Total
Pension obligations, beginning of year $ 53.6 $ 12.4 $ 66.0 $ 49.2 $ 10.5 $ 59.7
Current service cost 1.9 0.1 2.0 2.1 0.2 2.3
Interest cost 2.4 0.4 2.8 2.1 0.4 2.5
Past service cost and settlements 0.2 (0.1) 0.1 0.1 - 0.1
Actuarial (gain) loss arising from:
Experience adjustments (0.6) 0.3 (0.3) 1.1 (0.1) 1.0
Economic assumptions 7.2 2.5 9.7 (1.9) 0.5 (1.4)
Demographic assumptions - - - 3.5 0.1 3.6
Pension benefits paid (2.5) (0.7) (3.2) (2.6) (0.6) (3.2)
Exchange differences - (1.3) (1.3) - 1.4 1.4
Pension obligations, end of year $ 62.2 $ 13.6 $ 75.8 $ 53.6 $ 12.4 $ 66.0
The net pension cost is as follows:Years ended March 31 (amounts in millions) 2015 2014
Canadian Foreign Total Canadian Foreign Total
Funded plans
Current service cost $ 18.5 $ 1.9 $ 20.4 $ 17.8 $ 1.7 $ 19.5
Interest cost 16.0 1.9 17.9 14.0 1.8 15.8
Interest income (14.1) (1.7) (15.8) (11.5) (1.6) (13.1)
Past service cost - (1.6) (1.6) 1.0 - 1.0
Administrative cost 0.7 0.1 0.8 0.8 0.2 1.0
Net pension cost $ 21.1 $ 0.6 $ 21.7 $ 22.1 $ 2.1 $ 24.2
Unfunded plans
Current service cost $ 1.9 $ 0.1 $ 2.0 $ 2.1 $ 0.2 $ 2.3
Interest cost 2.4 0.4 2.8 2.1 0.4 2.5
Past service cost and settlements 0.2 (0.1) 0.1 0.1 - 0.1
Net pension cost $ 4.5 $ 0.4 $ 4.9 $ 4.3 $ 0.6 $ 4.9
Total net pension cost $ 25.6 $ 1.0 $ 26.6 $ 26.4 $ 2.7 $ 29.1
For the year ended March 31, 2015, pension costs of $10.6 million (2014 – $10.8 million) have been charged in cost of sales, $1.9 million (2014 – $2.8 million) in research and development expenses, $6.8 million (2014 – $8.1 million) in selling, general and administrative expenses, $4.9 million (2014 – $5.2 million) in finance expense and $2.4 million (2014 – $2.4 million) were capitalized. In fiscal 2014, a curtailment and settlement gain of $0.2 million was included in restructuring, integration and acquisition costs. As at March 31, 2015, the total cumulative amount of net actuarial losses before income taxes recognized in OCI was $134.9 million (2014 – $68.9 million).
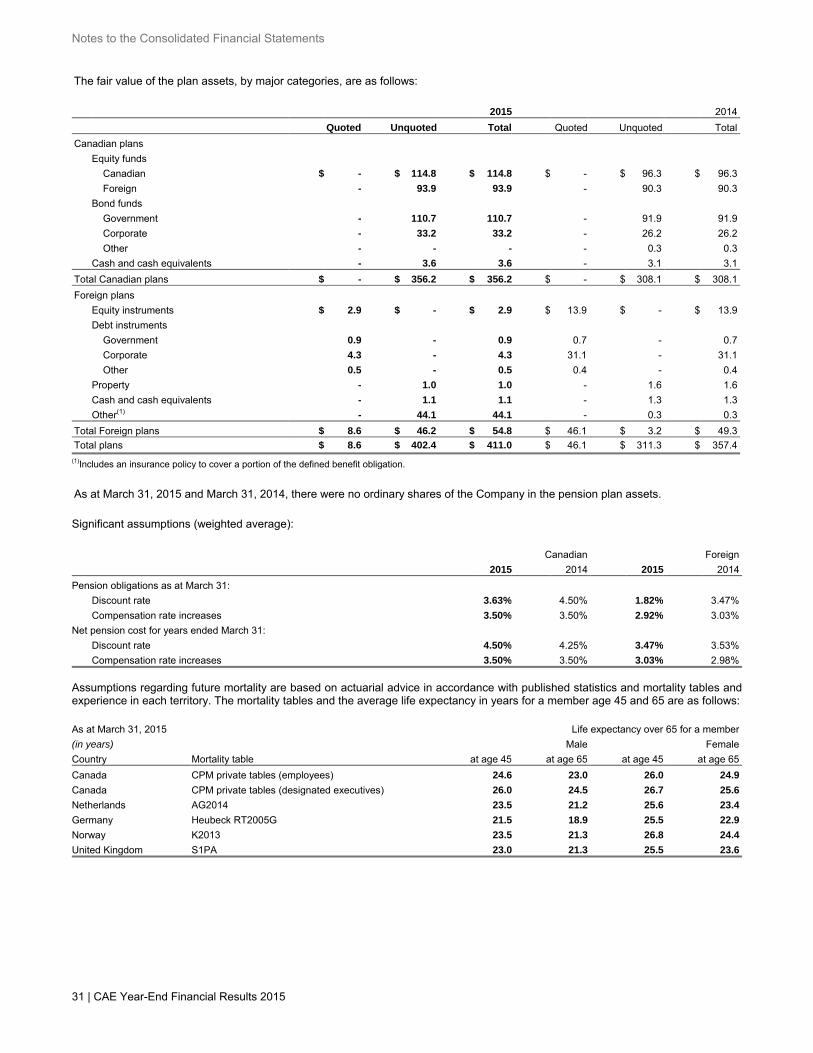
Notes to the Consolidated Financial Statements
31 | CAE Year-End Financial Results 2015
The fair value of the plan assets, by major categories, are as follows: (amounts in millions) 2015 2014
Quoted Unquoted Total Quoted Unquoted Total Canadian plans
Equity funds Canadian $ - $ 114.8 $ 114.8 $ - $ 96.3 $ 96.3 Foreign - 93.9 93.9 - 90.3 90.3 Bond funds Government - 110.7 110.7 - 91.9 91.9 Corporate - 33.2 33.2 - 26.2 26.2 Other - - - - 0.3 0.3 Cash and cash equivalents - 3.6 3.6 - 3.1 3.1 Total Canadian plans $ - $ 356.2 $ 356.2 $ - $ 308.1 $ 308.1
Foreign plans
Equity instruments $ 2.9 $ - $ 2.9 $ 13.9 $ - $ 13.9 Debt instruments Government 0.9 - 0.9 0.7 - 0.7 Corporate 4.3 - 4.3 31.1 - 31.1 Other 0.5 - 0.5 0.4 - 0.4 Property - 1.0 1.0 - 1.6 1.6 Cash and cash equivalents - 1.1 1.1 - 1.3 1.3
Other(1) - 44.1 44.1 - 0.3 0.3
Total Foreign plans $ 8.6 $ 46.2 $ 54.8 $ 46.1 $ 3.2 $ 49.3
Total plans $ 8.6 $ 402.4 $ 411.0 $ 46.1 $ 311.3 $ 357.4
(1)Includes an insurance policy to cover a portion of the defined benefit obligation. As at March 31, 2015 and March 31, 2014, there were no ordinary shares of the Company in the pension plan assets. Significant assumptions (weighted average): Canadian Foreign
2015 2014 2015 2014
Pension obligations as at March 31:
Discount rate 3.63% 4.50% 1.82% 3.47%
Compensation rate increases 3.50% 3.50% 2.92% 3.03%
Net pension cost for years ended March 31:
Discount rate 4.50% 4.25% 3.47% 3.53%
Compensation rate increases 3.50% 3.50% 3.03% 2.98%
Assumptions regarding future mortality are based on actuarial advice in accordance with published statistics and mortality tables and experience in each territory. The mortality tables and the average life expectancy in years for a member age 45 and 65 are as follows: As at March 31, 2015 Life expectancy over 65 for a member
(in years) Male Female
Country Mortality table at age 45 at age 65 at age 45 at age 65
Canada CPM private tables (employees) 24.6 23.0 26.0 24.9
Canada CPM private tables (designated executives) 26.0 24.5 26.7 25.6
Netherlands AG2014 23.5 21.2 25.6 23.4
Germany Heubeck RT2005G 21.5 18.9 25.5 22.9
Norway K2013 23.5 21.3 26.8 24.4
United Kingdom S1PA 23.0 21.3 25.5 23.6
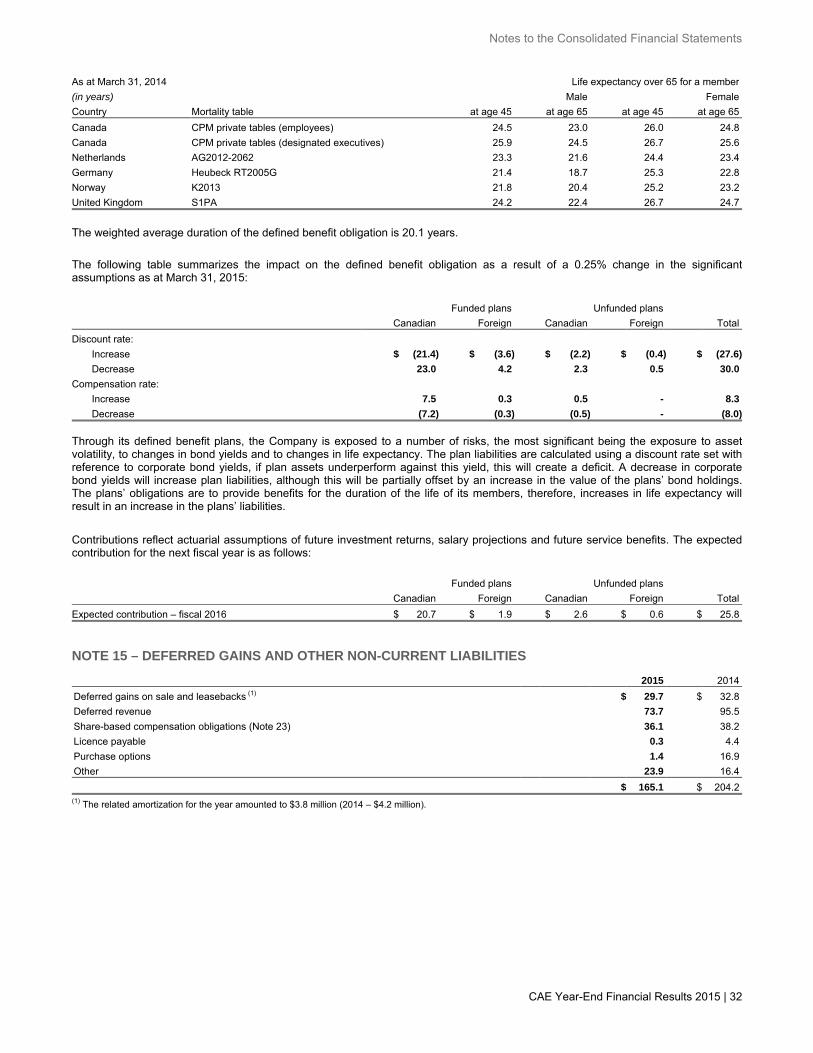
Notes to the Consolidated Financial Statements
CAE Year-End Financial Results 2015 | 32
As at March 31, 2014 Life expectancy over 65 for a member
(in years) Male Female
Country Mortality table at age 45 at age 65 at age 45 at age 65
Canada CPM private tables (employees) 24.5 23.0 26.0 24.8
Canada CPM private tables (designated executives) 25.9 24.5 26.7 25.6
Netherlands AG2012-2062 23.3 21.6 24.4 23.4
Germany Heubeck RT2005G 21.4 18.7 25.3 22.8
Norway K2013 21.8 20.4 25.2 23.2
United Kingdom S1PA 24.2 22.4 26.7 24.7
The weighted average duration of the defined benefit obligation is 20.1 years.
The following table summarizes the impact on the defined benefit obligation as a result of a 0.25% change in the significant assumptions as at March 31, 2015: Funded plans Unfunded plans
Canadian Foreign Canadian Foreign Total
Discount rate:
Increase $ (21.4) $ (3.6) $ (2.2) $ (0.4) $ (27.6)
Decrease 23.0 4.2 2.3 0.5 30.0
Compensation rate:
Increase 7.5 0.3 0.5 - 8.3
Decrease (7.2) (0.3) (0.5) - (8.0)
Through its defined benefit plans, the Company is exposed to a number of risks, the most significant being the exposure to asset volatility, to changes in bond yields and to changes in life expectancy. The plan liabilities are calculated using a discount rate set with reference to corporate bond yields, if plan assets underperform against this yield, this will create a deficit. A decrease in corporate bond yields will increase plan liabilities, although this will be partially offset by an increase in the value of the plans’ bond holdings. The plans’ obligations are to provide benefits for the duration of the life of its members, therefore, increases in life expectancy will result in an increase in the plans’ liabilities.
Contributions reflect actuarial assumptions of future investment returns, salary projections and future service benefits. The expected contribution for the next fiscal year is as follows: Funded plans Unfunded plans
(amounts in millions) Canadian Foreign Canadian Foreign Total
Expected contribution – fiscal 2016 $ 20.7 $ 1.9 $ 2.6 $ 0.6 $ 25.8
NOTE 15 – DEFERRED GAINS AND OTHER NON-CURRENT LIABILITIES
(amounts in millions) 2015 2014 Deferred gains on sale and leasebacks (1) $ 29.7 $ 32.8 Deferred revenue 73.7 95.5 Share-based compensation obligations (Note 23) 36.1 38.2 Licence payable 0.3 4.4 Purchase options 1.4 16.9 Other 23.9 16.4 $ 165.1 $ 204.2 (1) The related amortization for the year amounted to $3.8 million (2014 – $4.2 million).
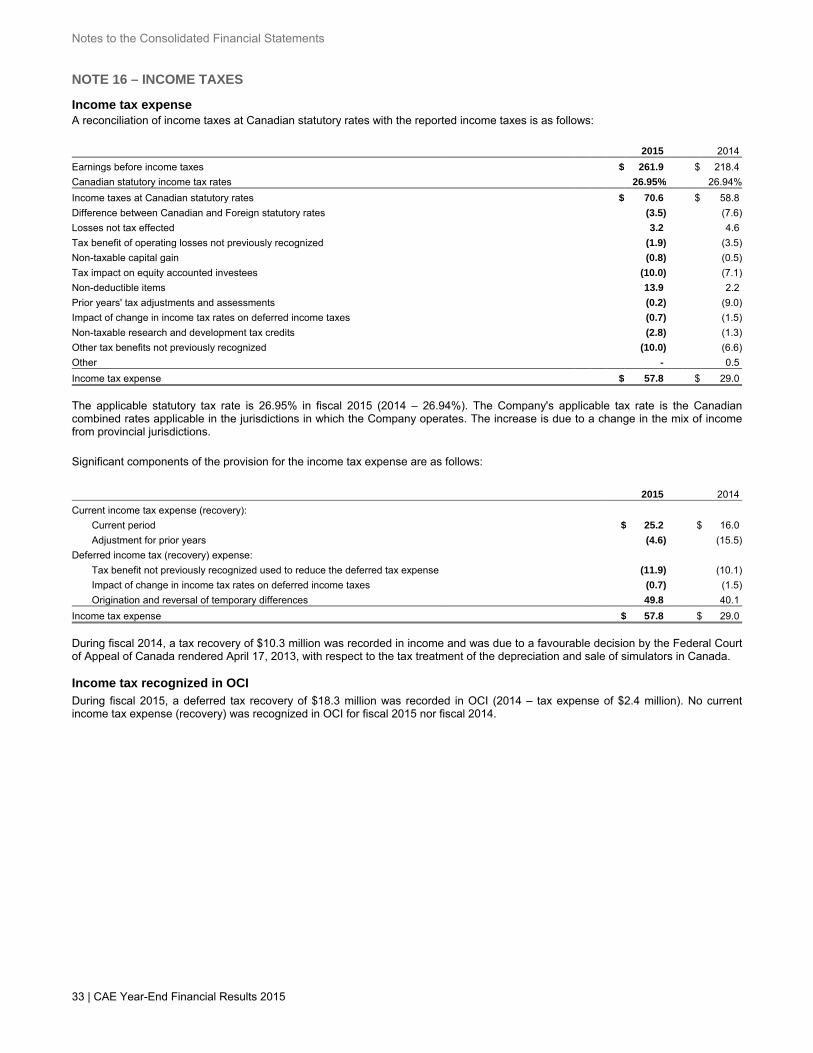
Notes to the Consolidated Financial Statements
33 | CAE Year-End Financial Results 2015
NOTE 16 – INCOME TAXES
Income tax expense A reconciliation of income taxes at Canadian statutory rates with the reported income taxes is as follows: Years ended March 31 2015 2014
Earnings before income taxes $ 261.9 $ 218.4
Canadian statutory income tax rates 26.95% 26.94%
Income taxes at Canadian statutory rates $ 70.6 $ 58.8
Difference between Canadian and Foreign statutory rates (3.5) (7.6)
Losses not tax effected 3.2 4.6
Tax benefit of operating losses not previously recognized (1.9) (3.5)
Non-taxable capital gain (0.8) (0.5)
Tax impact on equity accounted investees (10.0) (7.1)
Non-deductible items 13.9 2.2
Prior years' tax adjustments and assessments (0.2) (9.0)
Impact of change in income tax rates on deferred income taxes (0.7) (1.5)
Non-taxable research and development tax credits (2.8) (1.3)
Other tax benefits not previously recognized (10.0) (6.6)
Other - 0.5
Income tax expense $ 57.8 $ 29.0
The applicable statutory tax rate is 26.95% in fiscal 2015 (2014 – 26.94%). The Company's applicable tax rate is the Canadian combined rates applicable in the jurisdictions in which the Company operates. The increase is due to a change in the mix of income from provincial jurisdictions.
Significant components of the provision for the income tax expense are as follows:
(amounts in millions) 2015 2014
Current income tax expense (recovery):
Current period $ 25.2 $ 16.0
Adjustment for prior years (4.6) (15.5)
Deferred income tax (recovery) expense:
Tax benefit not previously recognized used to reduce the deferred tax expense (11.9) (10.1)
Impact of change in income tax rates on deferred income taxes (0.7) (1.5)
Origination and reversal of temporary differences 49.8 40.1
Income tax expense $ 57.8 $ 29.0
During fiscal 2014, a tax recovery of $10.3 million was recorded in income and was due to a favourable decision by the Federal Court of Appeal of Canada rendered April 17, 2013, with respect to the tax treatment of the depreciation and sale of simulators in Canada. Income tax recognized in OCI During fiscal 2015, a deferred tax recovery of $18.3 million was recorded in OCI (2014 – tax expense of $2.4 million). No current income tax expense (recovery) was recognized in OCI for fiscal 2015 nor fiscal 2014.
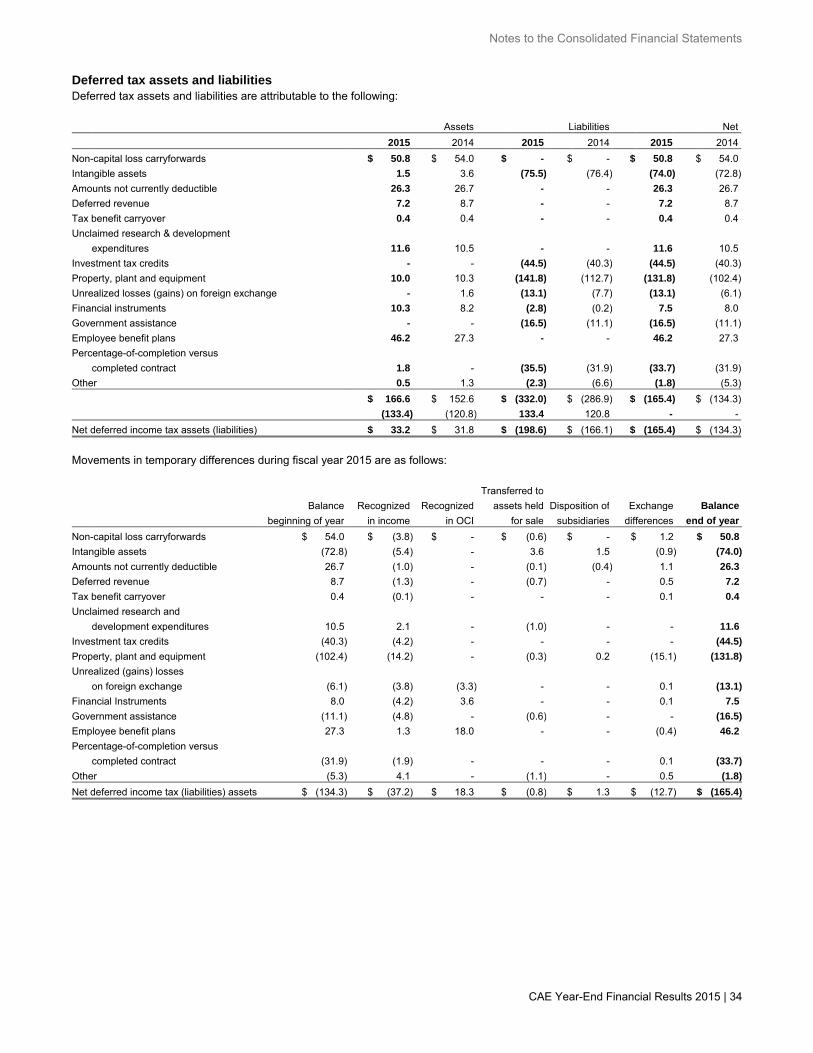
Notes to the Consolidated Financial Statements
CAE Year-End Financial Results 2015 | 34
Deferred tax assets and liabilities Deferred tax assets and liabilities are attributable to the following: (amounts in millions) Assets Liabilities Net
2015 2014 2015 2014 2015 2014
Non-capital loss carryforwards $ 50.8 $ 54.0 $ - $ - $ 50.8 $ 54.0
Intangible assets 1.5 3.6 (75.5) (76.4) (74.0) (72.8)
Amounts not currently deductible 26.3 26.7 - - 26.3 26.7
Deferred revenue 7.2 8.7 - - 7.2 8.7
Tax benefit carryover 0.4 0.4 - - 0.4 0.4
Unclaimed research & development
expenditures 11.6 10.5 - - 11.6 10.5
Investment tax credits - - (44.5) (40.3) (44.5) (40.3)
Property, plant and equipment 10.0 10.3 (141.8) (112.7) (131.8) (102.4)
Unrealized losses (gains) on foreign exchange - 1.6 (13.1) (7.7) (13.1) (6.1)
Financial instruments 10.3 8.2 (2.8) (0.2) 7.5 8.0
Government assistance - - (16.5) (11.1) (16.5) (11.1)
Employee benefit plans 46.2 27.3 - - 46.2 27.3
Percentage-of-completion versus
completed contract 1.8 - (35.5) (31.9) (33.7) (31.9)
Other 0.5 1.3 (2.3) (6.6) (1.8) (5.3)
$ 166.6 $ 152.6 $ (332.0) $ (286.9) $ (165.4) $ (134.3)
(133.4) (120.8) 133.4 120.8 - -
Net deferred income tax assets (liabilities) $ 33.2 $ 31.8 $ (198.6) $ (166.1) $ (165.4) $ (134.3)
Movements in temporary differences during fiscal year 2015 are as follows: Transferred to
Balance Recognized Recognized assets held Disposition of Exchange Balance
beginning of year in income in OCI for sale subsidiaries differences end of year
Non-capital loss carryforwards $ 54.0 $ (3.8) $ - $ (0.6) $ - $ 1.2 $ 50.8
Intangible assets (72.8) (5.4) - 3.6 1.5 (0.9) (74.0)
Amounts not currently deductible 26.7 (1.0) - (0.1) (0.4) 1.1 26.3
Deferred revenue 8.7 (1.3) - (0.7) - 0.5 7.2
Tax benefit carryover 0.4 (0.1) - - - 0.1 0.4
Unclaimed research and
development expenditures 10.5 2.1 - (1.0) - - 11.6
Investment tax credits (40.3) (4.2) - - - - (44.5)
Property, plant and equipment (102.4) (14.2) - (0.3) 0.2 (15.1) (131.8)
Unrealized (gains) losses
on foreign exchange (6.1) (3.8) (3.3) - - 0.1 (13.1)
Financial Instruments 8.0 (4.2) 3.6 - - 0.1 7.5
Government assistance (11.1) (4.8) - (0.6) - - (16.5)
Employee benefit plans 27.3 1.3 18.0 - - (0.4) 46.2
Percentage-of-completion versus
completed contract (31.9) (1.9) - - - 0.1 (33.7)
Other (5.3) 4.1 - (1.1) - 0.5 (1.8)
Net deferred income tax (liabilities) assets $ (134.3) $ (37.2) $ 18.3 $ (0.8) $ 1.3 $ (12.7) $ (165.4)
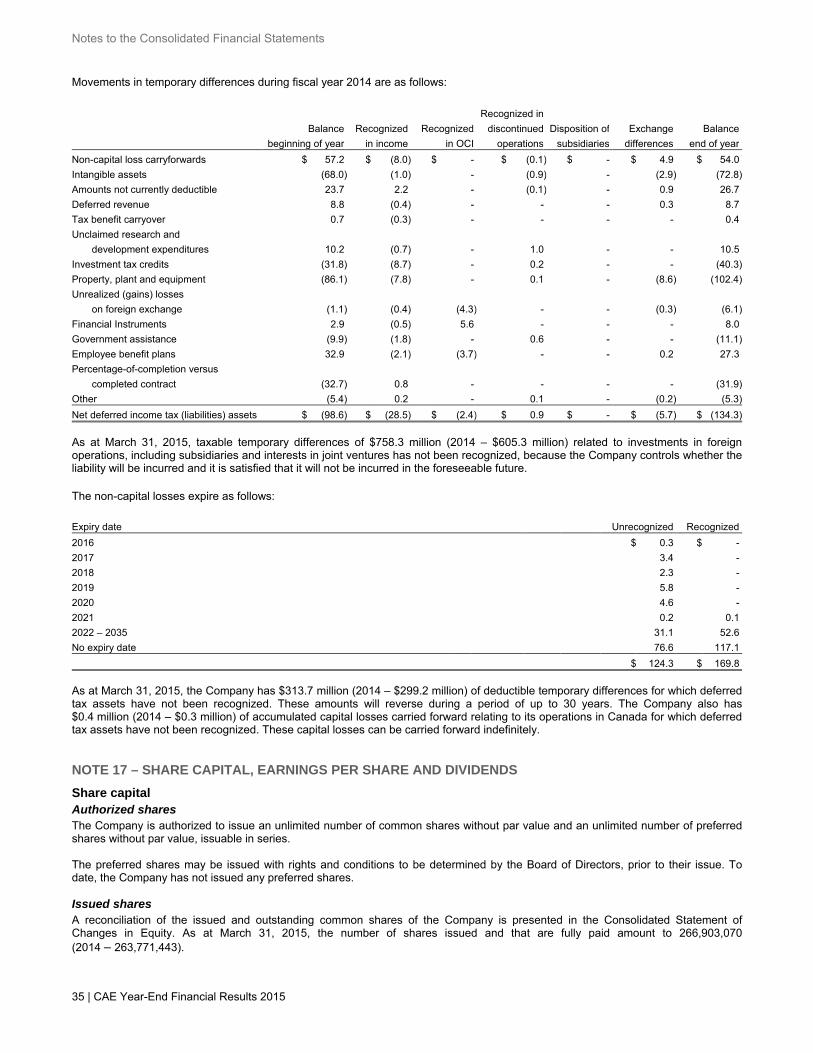
Notes to the Consolidated Financial Statements
35 | CAE Year-End Financial Results 2015
Movements in temporary differences during fiscal year 2014 are as follows:
Recognized in
Balance Recognized Recognized discontinued Disposition of Exchange Balance
(amounts in millions) beginning of year in income in OCI operations subsidiaries differences end of year
Non-capital loss carryforwards $ 57.2 $ (8.0) $ - $ (0.1) $ - $ 4.9 $ 54.0
Intangible assets (68.0) (1.0) - (0.9) - (2.9) (72.8)
Amounts not currently deductible 23.7 2.2 - (0.1) - 0.9 26.7
Deferred revenue 8.8 (0.4) - - - 0.3 8.7
Tax benefit carryover 0.7 (0.3) - - - - 0.4
Unclaimed research and
development expenditures 10.2 (0.7) - 1.0 - - 10.5
Investment tax credits (31.8) (8.7) - 0.2 - - (40.3)
Property, plant and equipment (86.1) (7.8) - 0.1 - (8.6) (102.4)
Unrealized (gains) losses
on foreign exchange (1.1) (0.4) (4.3) - - (0.3) (6.1)
Financial Instruments 2.9 (0.5) 5.6 - - - 8.0
Government assistance (9.9) (1.8) - 0.6 - - (11.1)
Employee benefit plans 32.9 (2.1) (3.7) - - 0.2 27.3
Percentage-of-completion versus
completed contract (32.7) 0.8 - - - - (31.9)
Other (5.4) 0.2 - 0.1 - (0.2) (5.3)
Net deferred income tax (liabilities) assets $ (98.6) $ (28.5) $ (2.4) $ 0.9 $ - $ (5.7) $ (134.3)
As at March 31, 2015, taxable temporary differences of $758.3 million (2014 – $605.3 million) related to investments in foreign operations, including subsidiaries and interests in joint ventures has not been recognized, because the Company controls whether the liability will be incurred and it is satisfied that it will not be incurred in the foreseeable future. The non-capital losses expire as follows: (amounts in millions)
Expiry date Unrecognized Recognized
2016 $ 0.3 $ -
2017 3.4 -
2018 2.3 -
2019 5.8 -
2020 4.6 -
2021 0.2 0.1
2022 – 2035 31.1 52.6
No expiry date 76.6 117.1
$ 124.3 $ 169.8
As at March 31, 2015, the Company has $313.7 million (2014 – $299.2 million) of deductible temporary differences for which deferred tax assets have not been recognized. These amounts will reverse during a period of up to 30 years. The Company also has $0.4 million (2014 – $0.3 million) of accumulated capital losses carried forward relating to its operations in Canada for which deferred tax assets have not been recognized. These capital losses can be carried forward indefinitely. NOTE 17 – SHARE CAPITAL, EARNINGS PER SHARE AND DIVIDENDS
Share capital Authorized shares The Company is authorized to issue an unlimited number of common shares without par value and an unlimited number of preferred shares without par value, issuable in series. The preferred shares may be issued with rights and conditions to be determined by the Board of Directors, prior to their issue. To date, the Company has not issued any preferred shares. Issued shares A reconciliation of the issued and outstanding common shares of the Company is presented in the Consolidated Statement of Changes in Equity. As at March 31, 2015, the number of shares issued and that are fully paid amount to 266,903,070 (2014 – 263,771,443).
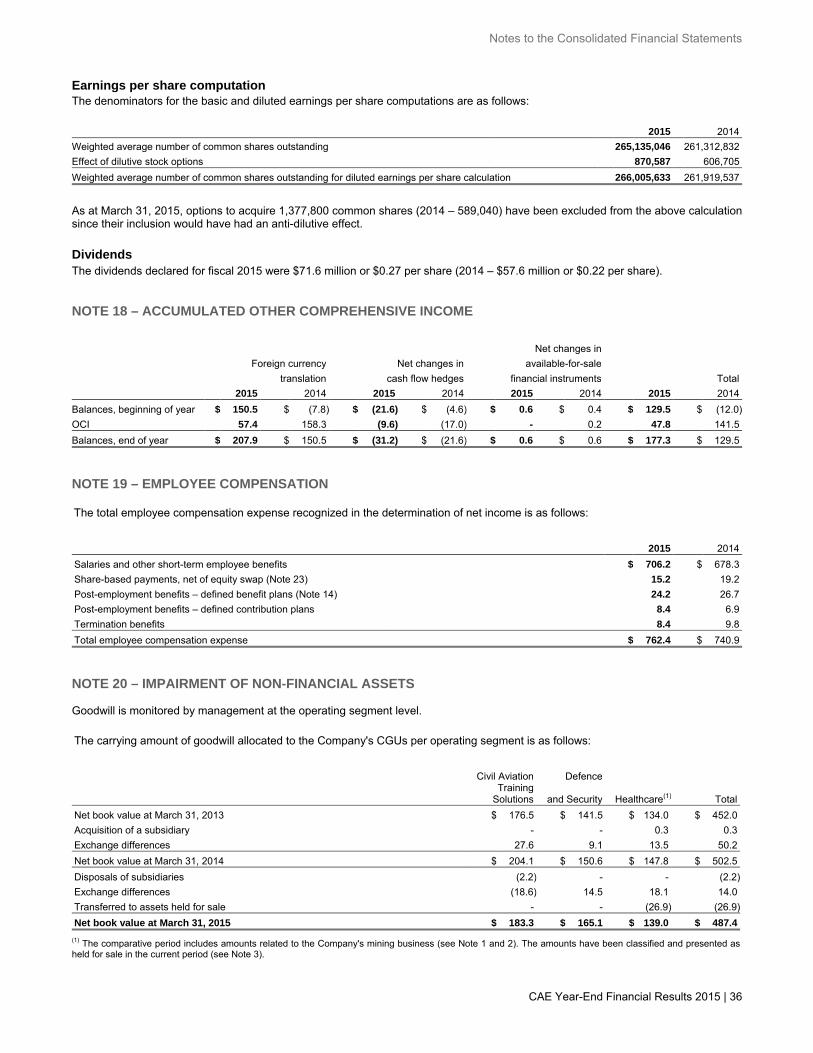
Notes to the Consolidated Financial Statements
CAE Year-End Financial Results 2015 | 36
Earnings per share computation The denominators for the basic and diluted earnings per share computations are as follows: Years ended March 31 2015 2014
Weighted average number of common shares outstanding 265,135,046 261,312,832
Effect of dilutive stock options 870,587 606,705
Weighted average number of common shares outstanding for diluted earnings per share calculation 266,005,633 261,919,537
As at March 31, 2015, options to acquire 1,377,800 common shares (2014 – 589,040) have been excluded from the above calculation since their inclusion would have had an anti-dilutive effect.
Dividends The dividends declared for fiscal 2015 were $71.6 million or $0.27 per share (2014 – $57.6 million or $0.22 per share). NOTE 18 – ACCUMULATED OTHER COMPREHENSIVE INCOME Net changes in
Foreign currency Net changes in available-for-sale
As at March 31 translation cash flow hedges financial instruments Total
(amounts in millions) 2015 2014 2015 2014 2015 2014 2015 2014
Balances, beginning of year $ 150.5 $ (7.8) $ (21.6) $ (4.6) $ 0.6 $ 0.4 $ 129.5 $ (12.0)
OCI 57.4 158.3 (9.6) (17.0) - 0.2 47.8 141.5
Balances, end of year $ 207.9 $ 150.5 $ (31.2) $ (21.6) $ 0.6 $ 0.6 $ 177.3 $ 129.5
NOTE 19 – EMPLOYEE COMPENSATION
The total employee compensation expense recognized in the determination of net income is as follows: (amounts in millions) 2015 2014 Salaries and other short-term employee benefits $ 706.2 $ 678.3 Share-based payments, net of equity swap (Note 23) 15.2 19.2 Post-employment benefits – defined benefit plans (Note 14) 24.2 26.7 Post-employment benefits – defined contribution plans 8.4 6.9 Termination benefits 8.4 9.8 Total employee compensation expense $ 762.4 $ 740.9
NOTE 20 – IMPAIRMENT OF NON-FINANCIAL ASSETS Goodwill is monitored by management at the operating segment level. The carrying amount of goodwill allocated to the Company's CGUs per operating segment is as follows:
Civil Aviation Defence
(amounts in millions)
Training Solutions and Security Healthcare(1) Total
Net book value at March 31, 2013 $ 176.5 $ 141.5 $ 134.0 $ 452.0 Acquisition of a subsidiary - - 0.3 0.3 Exchange differences 27.6 9.1 13.5 50.2 Net book value at March 31, 2014 $ 204.1 $ 150.6 $ 147.8 $ 502.5 Disposals of subsidiaries (2.2) - - (2.2) Exchange differences (18.6) 14.5 18.1 14.0 Transferred to assets held for sale - - (26.9) (26.9) Net book value at March 31, 2015 $ 183.3 $ 165.1 $ 139.0 $ 487.4
(1) The comparative period includes amounts related to the Company's mining business (see Note 1 and 2). The amounts have been classified and presented as held for sale in the current period (see Note 3).
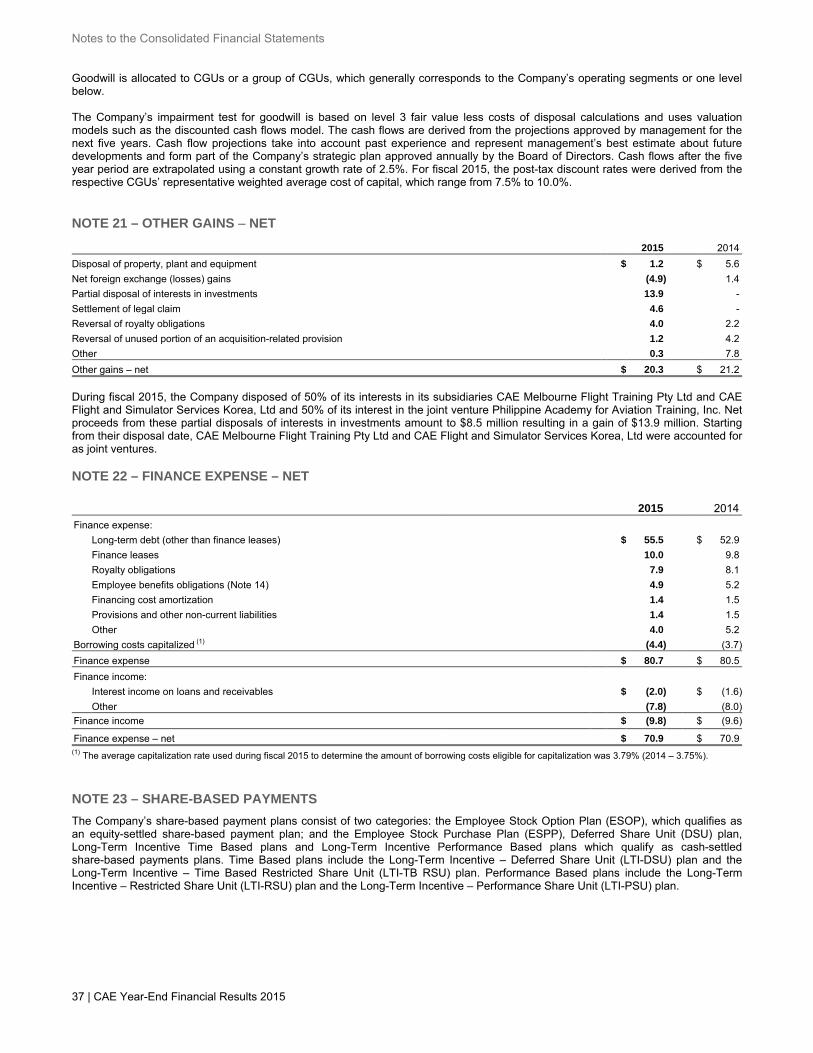
Notes to the Consolidated Financial Statements
37 | CAE Year-End Financial Results 2015
Goodwill is allocated to CGUs or a group of CGUs, which generally corresponds to the Company’s operating segments or one level below. The Company’s impairment test for goodwill is based on level 3 fair value less costs of disposal calculations and uses valuation models such as the discounted cash flows model. The cash flows are derived from the projections approved by management for the next five years. Cash flow projections take into account past experience and represent management’s best estimate about future developments and form part of the Company’s strategic plan approved annually by the Board of Directors. Cash flows after the five year period are extrapolated using a constant growth rate of 2.5%. For fiscal 2015, the post-tax discount rates were derived from the respective CGUs’ representative weighted average cost of capital, which range from 7.5% to 10.0%.
NOTE 21 – OTHER GAINS – NET
(amounts in millions) 2015 2014
Disposal of property, plant and equipment $ 1.2 $ 5.6
Net foreign exchange (losses) gains (4.9) 1.4
Partial disposal of interests in investments 13.9 -
Settlement of legal claim 4.6 -
Reversal of royalty obligations 4.0 2.2
Reversal of unused portion of an acquisition-related provision 1.2 4.2
Other 0.3 7.8
Other gains – net $ 20.3 $ 21.2
During fiscal 2015, the Company disposed of 50% of its interests in its subsidiaries CAE Melbourne Flight Training Pty Ltd and CAE Flight and Simulator Services Korea, Ltd and 50% of its interest in the joint venture Philippine Academy for Aviation Training, Inc. Net proceeds from these partial disposals of interests in investments amount to $8.5 million resulting in a gain of $13.9 million. Starting from their disposal date, CAE Melbourne Flight Training Pty Ltd and CAE Flight and Simulator Services Korea, Ltd were accounted for as joint ventures. NOTE 22 – FINANCE EXPENSE – NET (amounts in millions) 2015 2014 Finance expense: Long-term debt (other than finance leases) $ 55.5 $ 52.9 Finance leases 10.0 9.8 Royalty obligations 7.9 8.1 Employee benefits obligations (Note 14) 4.9 5.2 Financing cost amortization 1.4 1.5 Provisions and other non-current liabilities 1.4 1.5 Other 4.0 5.2 Borrowing costs capitalized (1) (4.4) (3.7) Finance expense $ 80.7 $ 80.5 Finance income: Interest income on loans and receivables $ (2.0) $ (1.6) Other (7.8) (8.0) Finance income $ (9.8) $ (9.6) Finance expense – net $ 70.9 $ 70.9 (1) The average capitalization rate used during fiscal 2015 to determine the amount of borrowing costs eligible for capitalization was 3.79% (2014 – 3.75%). NOTE 23 – SHARE-BASED PAYMENTS
The Company’s share-based payment plans consist of two categories: the Employee Stock Option Plan (ESOP), which qualifies as an equity-settled share-based payment plan; and the Employee Stock Purchase Plan (ESPP), Deferred Share Unit (DSU) plan, Long-Term Incentive Time Based plans and Long-Term Incentive Performance Based plans which qualify as cash-settled share-based payments plans. Time Based plans include the Long-Term Incentive – Deferred Share Unit (LTI-DSU) plan and the Long-Term Incentive – Time Based Restricted Share Unit (LTI-TB RSU) plan. Performance Based plans include the Long-Term Incentive – Restricted Share Unit (LTI-RSU) plan and the Long-Term Incentive – Performance Share Unit (LTI-PSU) plan.
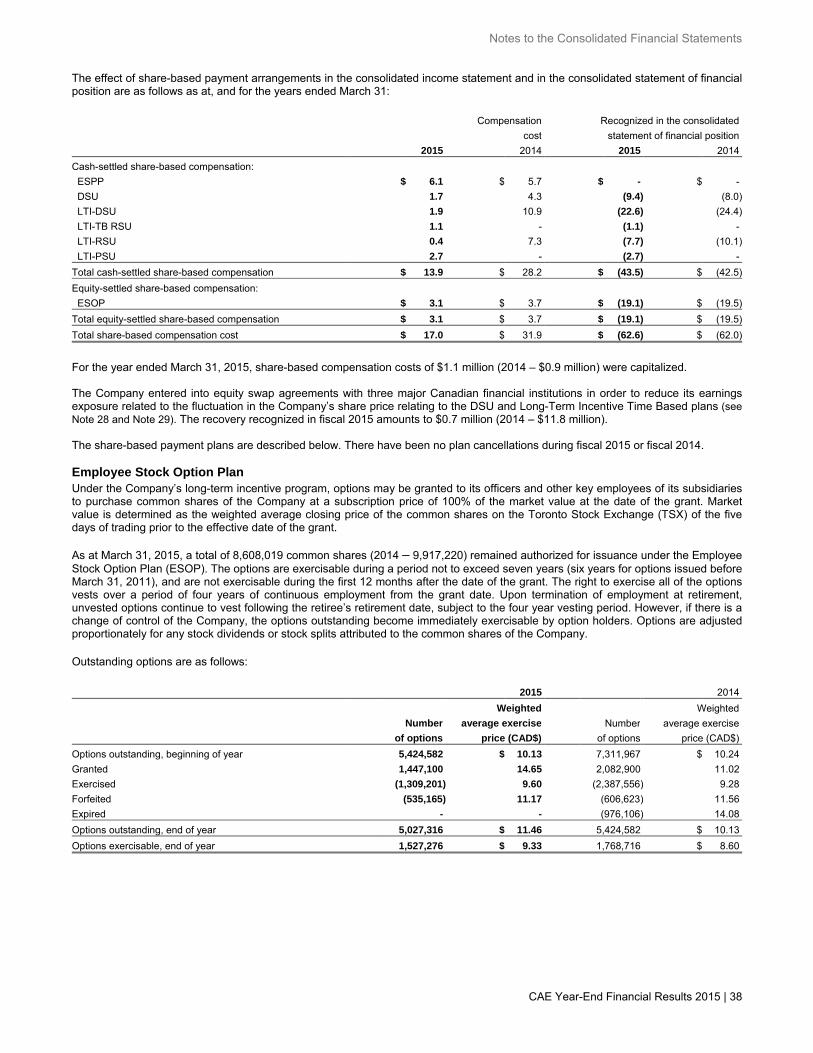
Notes to the Consolidated Financial Statements
CAE Year-End Financial Results 2015 | 38
The effect of share-based payment arrangements in the consolidated income statement and in the consolidated statement of financial position are as follows as at, and for the years ended March 31:
Compensation Recognized in the consolidated
cost statement of financial position
2015 2014 2015 2014
Cash-settled share-based compensation:
ESPP $ 6.1 $ 5.7 $ - $ -
DSU 1.7 4.3 (9.4) (8.0)
LTI-DSU 1.9 10.9 (22.6) (24.4)
LTI-TB RSU 1.1 - (1.1) -
LTI-RSU 0.4 7.3 (7.7) (10.1)
LTI-PSU 2.7 - (2.7) -
Total cash-settled share-based compensation $ 13.9 $ 28.2 $ (43.5) $ (42.5)
Equity-settled share-based compensation:
ESOP $ 3.1 $ 3.7 $ (19.1) $ (19.5)
Total equity-settled share-based compensation $ 3.1 $ 3.7 $ (19.1) $ (19.5)
Total share-based compensation cost $ 17.0 $ 31.9 $ (62.6) $ (62.0)
For the year ended March 31, 2015, share-based compensation costs of $1.1 million (2014 – $0.9 million) were capitalized. The Company entered into equity swap agreements with three major Canadian financial institutions in order to reduce its earnings exposure related to the fluctuation in the Company’s share price relating to the DSU and Long-Term Incentive Time Based plans (see Note 28 and Note 29). The recovery recognized in fiscal 2015 amounts to $0.7 million (2014 – $11.8 million). The share-based payment plans are described below. There have been no plan cancellations during fiscal 2015 or fiscal 2014. Employee Stock Option Plan Under the Company’s long-term incentive program, options may be granted to its officers and other key employees of its subsidiaries to purchase common shares of the Company at a subscription price of 100% of the market value at the date of the grant. Market value is determined as the weighted average closing price of the common shares on the Toronto Stock Exchange (TSX) of the five days of trading prior to the effective date of the grant. As at March 31, 2015, a total of 8,608,019 common shares (2014 – 9,917,220) remained authorized for issuance under the Employee Stock Option Plan (ESOP). The options are exercisable during a period not to exceed seven years (six years for options issued before March 31, 2011), and are not exercisable during the first 12 months after the date of the grant. The right to exercise all of the options vests over a period of four years of continuous employment from the grant date. Upon termination of employment at retirement, unvested options continue to vest following the retiree’s retirement date, subject to the four year vesting period. However, if there is a change of control of the Company, the options outstanding become immediately exercisable by option holders. Options are adjusted proportionately for any stock dividends or stock splits attributed to the common shares of the Company. Outstanding options are as follows: Years ended March 31 2015 2014
Weighted Weighted
Number average exercise Number average exercise
of options price (CAD$) of options price (CAD$)
Options outstanding, beginning of year 5,424,582 $ 10.13 7,311,967 $ 10.24
Granted 1,447,100 14.65 2,082,900 11.02
Exercised (1,309,201) 9.60 (2,387,556) 9.28
Forfeited (535,165) 11.17 (606,623) 11.56
Expired - - (976,106) 14.08
Options outstanding, end of year 5,027,316 $ 11.46 5,424,582 $ 10.13
Options exercisable, end of year 1,527,276 $ 9.33 1,768,716 $ 8.60
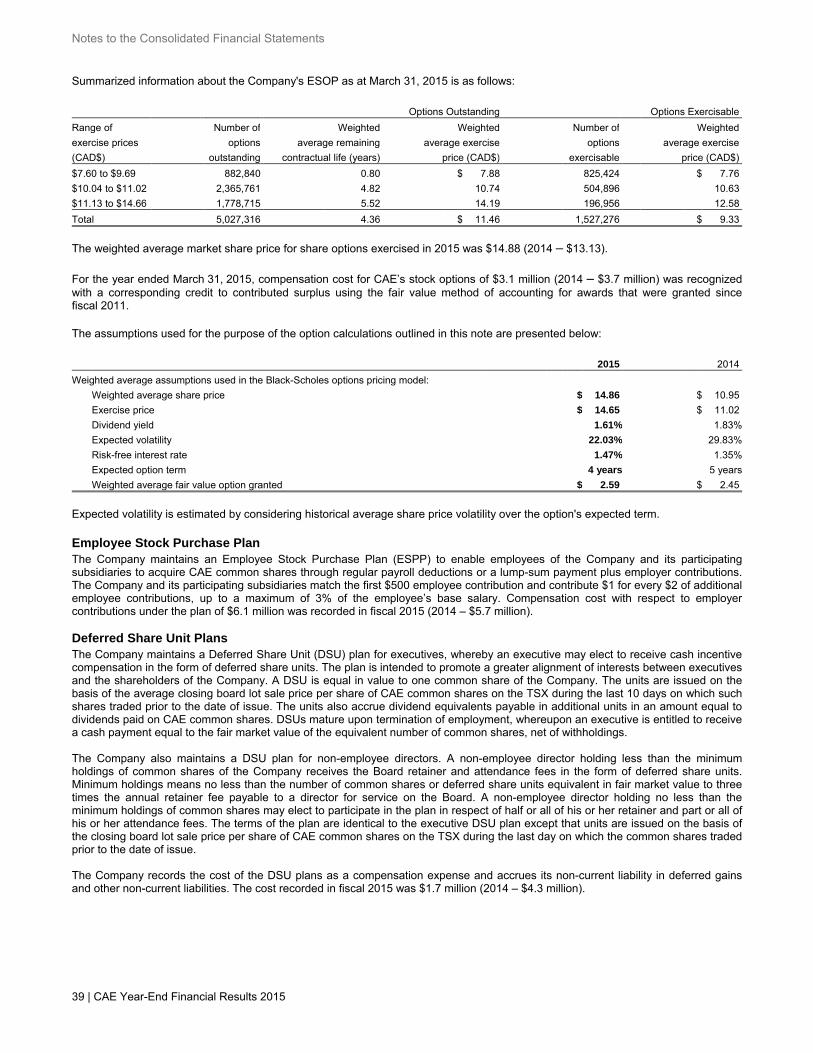
Notes to the Consolidated Financial Statements
39 | CAE Year-End Financial Results 2015
Summarized information about the Company's ESOP as at March 31, 2015 is as follows: Options Outstanding Options Exercisable
Range of Number of Weighted Weighted Number of Weighted
exercise prices options average remaining average exercise options average exercise
(CAD$) outstanding contractual life (years) price (CAD$) exercisable price (CAD$)
$7.60 to $9.69 882,840 0.80 $ 7.88 825,424 $ 7.76
$10.04 to $11.02 2,365,761 4.82 10.74 504,896 10.63
$11.13 to $14.66 1,778,715 5.52 14.19 196,956 12.58
Total 5,027,316 4.36 $ 11.46 1,527,276 $ 9.33
The weighted average market share price for share options exercised in 2015 was $14.88 (2014 – $13.13). For the year ended March 31, 2015, compensation cost for CAE’s stock options of $3.1 million (2014 – $3.7 million) was recognized with a corresponding credit to contributed surplus using the fair value method of accounting for awards that were granted since fiscal 2011. The assumptions used for the purpose of the option calculations outlined in this note are presented below: 2015 2014
Weighted average assumptions used in the Black-Scholes options pricing model:
Weighted average share price $ 14.86 $ 10.95
Exercise price $ 14.65 $ 11.02
Dividend yield 1.61% 1.83%
Expected volatility 22.03% 29.83%
Risk-free interest rate 1.47% 1.35%
Expected option term 4 years 5 years
Weighted average fair value option granted $ 2.59 $ 2.45
Expected volatility is estimated by considering historical average share price volatility over the option's expected term. Employee Stock Purchase Plan The Company maintains an Employee Stock Purchase Plan (ESPP) to enable employees of the Company and its participating subsidiaries to acquire CAE common shares through regular payroll deductions or a lump-sum payment plus employer contributions. The Company and its participating subsidiaries match the first $500 employee contribution and contribute $1 for every $2 of additional employee contributions, up to a maximum of 3% of the employee’s base salary. Compensation cost with respect to employer contributions under the plan of $6.1 million was recorded in fiscal 2015 (2014 – $5.7 million). Deferred Share Unit Plans The Company maintains a Deferred Share Unit (DSU) plan for executives, whereby an executive may elect to receive cash incentive compensation in the form of deferred share units. The plan is intended to promote a greater alignment of interests between executives and the shareholders of the Company. A DSU is equal in value to one common share of the Company. The units are issued on the basis of the average closing board lot sale price per share of CAE common shares on the TSX during the last 10 days on which such shares traded prior to the date of issue. The units also accrue dividend equivalents payable in additional units in an amount equal to dividends paid on CAE common shares. DSUs mature upon termination of employment, whereupon an executive is entitled to receive a cash payment equal to the fair market value of the equivalent number of common shares, net of withholdings. The Company also maintains a DSU plan for non-employee directors. A non-employee director holding less than the minimum holdings of common shares of the Company receives the Board retainer and attendance fees in the form of deferred share units. Minimum holdings means no less than the number of common shares or deferred share units equivalent in fair market value to three times the annual retainer fee payable to a director for service on the Board. A non-employee director holding no less than the minimum holdings of common shares may elect to participate in the plan in respect of half or all of his or her retainer and part or all of his or her attendance fees. The terms of the plan are identical to the executive DSU plan except that units are issued on the basis of the closing board lot sale price per share of CAE common shares on the TSX during the last day on which the common shares traded prior to the date of issue. The Company records the cost of the DSU plans as a compensation expense and accrues its non-current liability in deferred gains and other non-current liabilities. The cost recorded in fiscal 2015 was $1.7 million (2014 – $4.3 million).
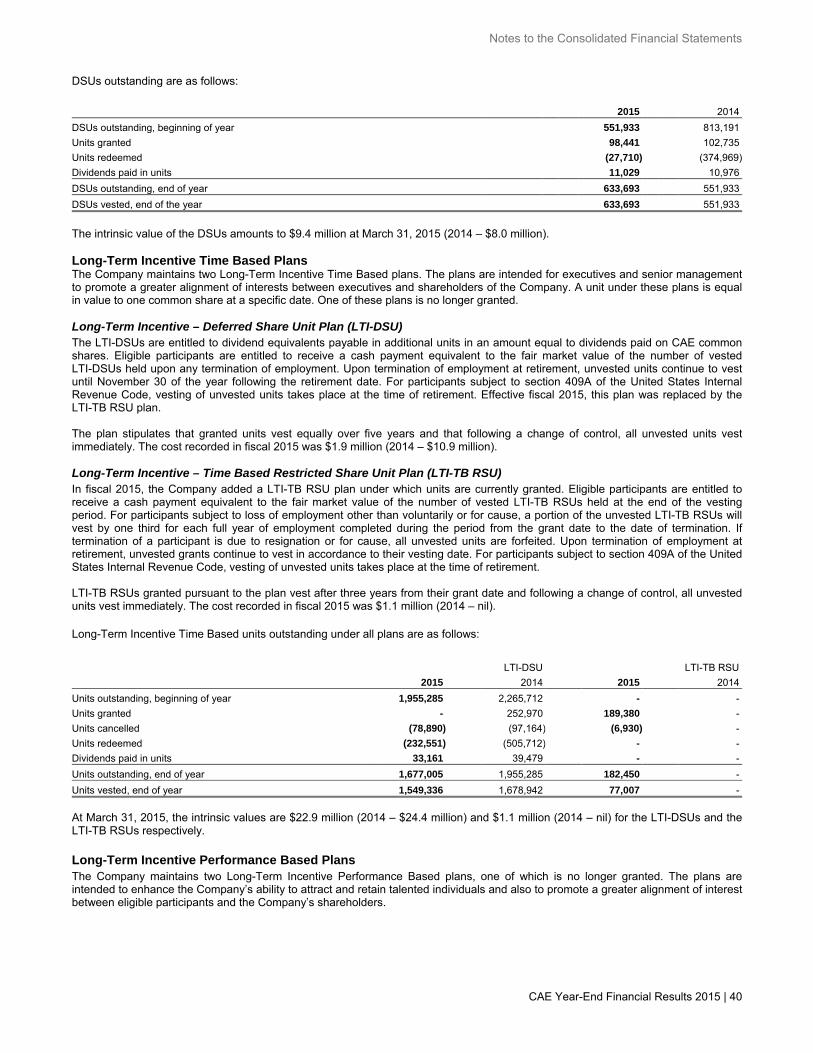
Notes to the Consolidated Financial Statements
CAE Year-End Financial Results 2015 | 40
DSUs outstanding are as follows: Years ended March 31 2015 2014
DSUs outstanding, beginning of year 551,933 813,191
Units granted 98,441 102,735
Units redeemed (27,710) (374,969)
Dividends paid in units 11,029 10,976
DSUs outstanding, end of year 633,693 551,933
DSUs vested, end of the year 633,693 551,933
The intrinsic value of the DSUs amounts to $9.4 million at March 31, 2015 (2014 – $8.0 million). Long-Term Incentive Time Based Plans The Company maintains two Long-Term Incentive Time Based plans. The plans are intended for executives and senior management to promote a greater alignment of interests between executives and shareholders of the Company. A unit under these plans is equal in value to one common share at a specific date. One of these plans is no longer granted. Long-Term Incentive – Deferred Share Unit Plan (LTI-DSU) The LTI-DSUs are entitled to dividend equivalents payable in additional units in an amount equal to dividends paid on CAE common shares. Eligible participants are entitled to receive a cash payment equivalent to the fair market value of the number of vested LTI-DSUs held upon any termination of employment. Upon termination of employment at retirement, unvested units continue to vest until November 30 of the year following the retirement date. For participants subject to section 409A of the United States Internal Revenue Code, vesting of unvested units takes place at the time of retirement. Effective fiscal 2015, this plan was replaced by the LTI-TB RSU plan. The plan stipulates that granted units vest equally over five years and that following a change of control, all unvested units vest immediately. The cost recorded in fiscal 2015 was $1.9 million (2014 – $10.9 million). Long-Term Incentive – Time Based Restricted Share Unit Plan (LTI-TB RSU) In fiscal 2015, the Company added a LTI-TB RSU plan under which units are currently granted. Eligible participants are entitled to receive a cash payment equivalent to the fair market value of the number of vested LTI-TB RSUs held at the end of the vesting period. For participants subject to loss of employment other than voluntarily or for cause, a portion of the unvested LTI-TB RSUs will vest by one third for each full year of employment completed during the period from the grant date to the date of termination. If termination of a participant is due to resignation or for cause, all unvested units are forfeited. Upon termination of employment at retirement, unvested grants continue to vest in accordance to their vesting date. For participants subject to section 409A of the United States Internal Revenue Code, vesting of unvested units takes place at the time of retirement. LTI-TB RSUs granted pursuant to the plan vest after three years from their grant date and following a change of control, all unvested units vest immediately. The cost recorded in fiscal 2015 was $1.1 million (2014 – nil). Long-Term Incentive Time Based units outstanding under all plans are as follows:
LTI-DSU LTI-TB RSU
Years ended March 31 2015 2014 2015 2014
Units outstanding, beginning of year 1,955,285 2,265,712 - -
Units granted - 252,970 189,380 -
Units cancelled (78,890) (97,164) (6,930) -
Units redeemed (232,551) (505,712) - -
Dividends paid in units 33,161 39,479 - -
Units outstanding, end of year 1,677,005 1,955,285 182,450 -
Units vested, end of year 1,549,336 1,678,942 77,007 -
At March 31, 2015, the intrinsic values are $22.9 million (2014 – $24.4 million) and $1.1 million (2014 – nil) for the LTI-DSUs and the LTI-TB RSUs respectively. Long-Term Incentive Performance Based Plans The Company maintains two Long-Term Incentive Performance Based plans, one of which is no longer granted. The plans are intended to enhance the Company’s ability to attract and retain talented individuals and also to promote a greater alignment of interest between eligible participants and the Company’s shareholders.
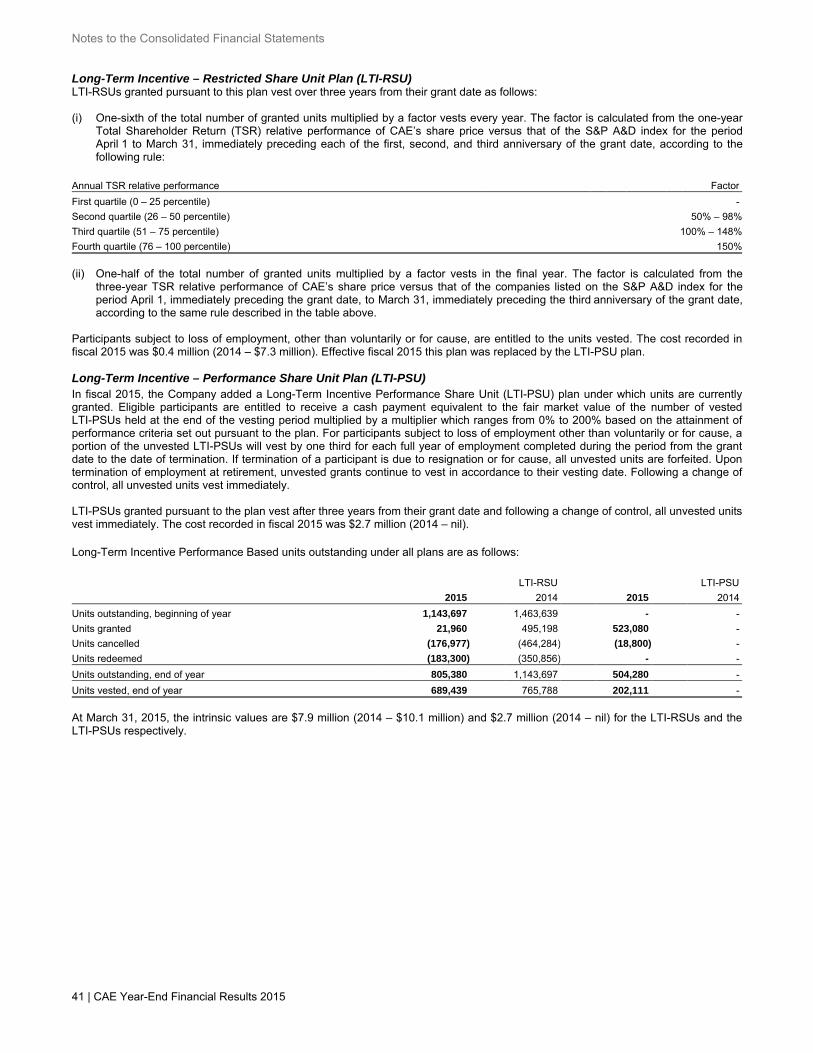
Notes to the Consolidated Financial Statements
41 | CAE Year-End Financial Results 2015
Long-Term Incentive – Restricted Share Unit Plan (LTI-RSU) LTI-RSUs granted pursuant to this plan vest over three years from their grant date as follows: (i) One-sixth of the total number of granted units multiplied by a factor vests every year. The factor is calculated from the one-year
Total Shareholder Return (TSR) relative performance of CAE’s share price versus that of the S&P A&D index for the period April 1 to March 31, immediately preceding each of the first, second, and third anniversary of the grant date, according to the following rule:
Annual TSR relative performance Factor
First quartile (0 – 25 percentile) -
Second quartile (26 – 50 percentile) 50% – 98%
Third quartile (51 – 75 percentile) 100% – 148%
Fourth quartile (76 – 100 percentile) 150%
(ii) One-half of the total number of granted units multiplied by a factor vests in the final year. The factor is calculated from the
three-year TSR relative performance of CAE’s share price versus that of the companies listed on the S&P A&D index for the period April 1, immediately preceding the grant date, to March 31, immediately preceding the third anniversary of the grant date, according to the same rule described in the table above.
Participants subject to loss of employment, other than voluntarily or for cause, are entitled to the units vested. The cost recorded in fiscal 2015 was $0.4 million (2014 – $7.3 million). Effective fiscal 2015 this plan was replaced by the LTI-PSU plan. Long-Term Incentive – Performance Share Unit Plan (LTI-PSU) In fiscal 2015, the Company added a Long-Term Incentive Performance Share Unit (LTI-PSU) plan under which units are currently granted. Eligible participants are entitled to receive a cash payment equivalent to the fair market value of the number of vested LTI-PSUs held at the end of the vesting period multiplied by a multiplier which ranges from 0% to 200% based on the attainment of performance criteria set out pursuant to the plan. For participants subject to loss of employment other than voluntarily or for cause, a portion of the unvested LTI-PSUs will vest by one third for each full year of employment completed during the period from the grant date to the date of termination. If termination of a participant is due to resignation or for cause, all unvested units are forfeited. Upon termination of employment at retirement, unvested grants continue to vest in accordance to their vesting date. Following a change of control, all unvested units vest immediately. LTI-PSUs granted pursuant to the plan vest after three years from their grant date and following a change of control, all unvested units vest immediately. The cost recorded in fiscal 2015 was $2.7 million (2014 – nil). Long-Term Incentive Performance Based units outstanding under all plans are as follows: LTI-RSU LTI-PSU
Years ended March 31 2015 2014 2015 2014
Units outstanding, beginning of year 1,143,697 1,463,639 - -
Units granted 21,960 495,198 523,080 -
Units cancelled (176,977) (464,284) (18,800) -
Units redeemed (183,300) (350,856) - -
Units outstanding, end of year 805,380 1,143,697 504,280 -
Units vested, end of year 689,439 765,788 202,111 -
At March 31, 2015, the intrinsic values are $7.9 million (2014 – $10.1 million) and $2.7 million (2014 – nil) for the LTI-RSUs and the LTI-PSUs respectively.
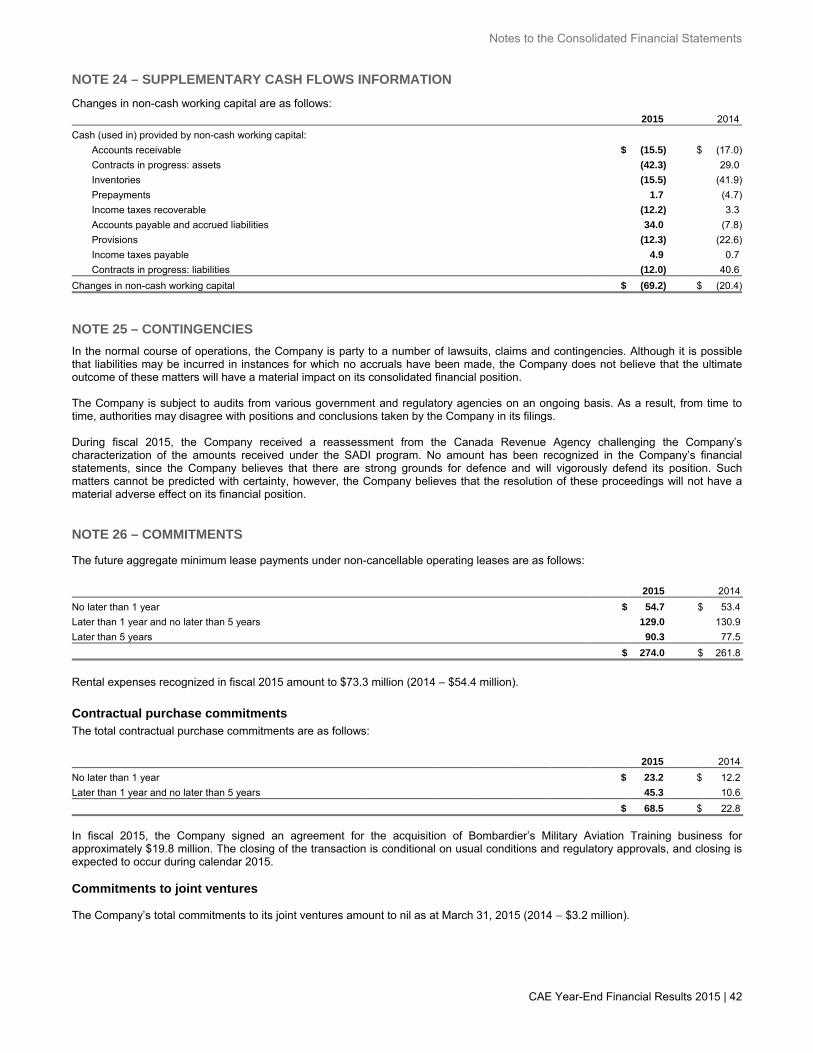
Notes to the Consolidated Financial Statements
CAE Year-End Financial Results 2015 | 42
NOTE 24 – SUPPLEMENTARY CASH FLOWS INFORMATION
Changes in non-cash working capital are as follows:
(amounts in millions) 2015 2014
Cash (used in) provided by non-cash working capital:
Accounts receivable $ (15.5) $ (17.0)
Contracts in progress: assets (42.3) 29.0
Inventories (15.5) (41.9)
Prepayments 1.7 (4.7)
Income taxes recoverable (12.2) 3.3
Accounts payable and accrued liabilities 34.0 (7.8)
Provisions (12.3) (22.6)
Income taxes payable 4.9 0.7
Contracts in progress: liabilities (12.0) 40.6
Changes in non-cash working capital $ (69.2) $ (20.4)
NOTE 25 – CONTINGENCIES
In the normal course of operations, the Company is party to a number of lawsuits, claims and contingencies. Although it is possible that liabilities may be incurred in instances for which no accruals have been made, the Company does not believe that the ultimate outcome of these matters will have a material impact on its consolidated financial position. The Company is subject to audits from various government and regulatory agencies on an ongoing basis. As a result, from time to time, authorities may disagree with positions and conclusions taken by the Company in its filings. During fiscal 2015, the Company received a reassessment from the Canada Revenue Agency challenging the Company’s characterization of the amounts received under the SADI program. No amount has been recognized in the Company’s financial statements, since the Company believes that there are strong grounds for defence and will vigorously defend its position. Such matters cannot be predicted with certainty, however, the Company believes that the resolution of these proceedings will not have a material adverse effect on its financial position. NOTE 26 – COMMITMENTS
The future aggregate minimum lease payments under non-cancellable operating leases are as follows: (amounts in millions) 2015 2014
No later than 1 year $ 54.7 $ 53.4
Later than 1 year and no later than 5 years 129.0 130.9
Later than 5 years 90.3 77.5
$ 274.0 $ 261.8
Rental expenses recognized in fiscal 2015 amount to $73.3 million (2014 – $54.4 million).
Contractual purchase commitments The total contractual purchase commitments are as follows: (amounts in millions) 2015 2014
No later than 1 year $ $ 23.2 $ 12.2
Later than 1 year and no later than 5 years 45.3 10.6
$ $ 68.5 $ 22.8
In fiscal 2015, the Company signed an agreement for the acquisition of Bombardier’s Military Aviation Training business for approximately $19.8 million. The closing of the transaction is conditional on usual conditions and regulatory approvals, and closing is expected to occur during calendar 2015. Commitments to joint ventures The Company’s total commitments to its joint ventures amount to nil as at March 31, 2015 (2014 – $3.2 million).
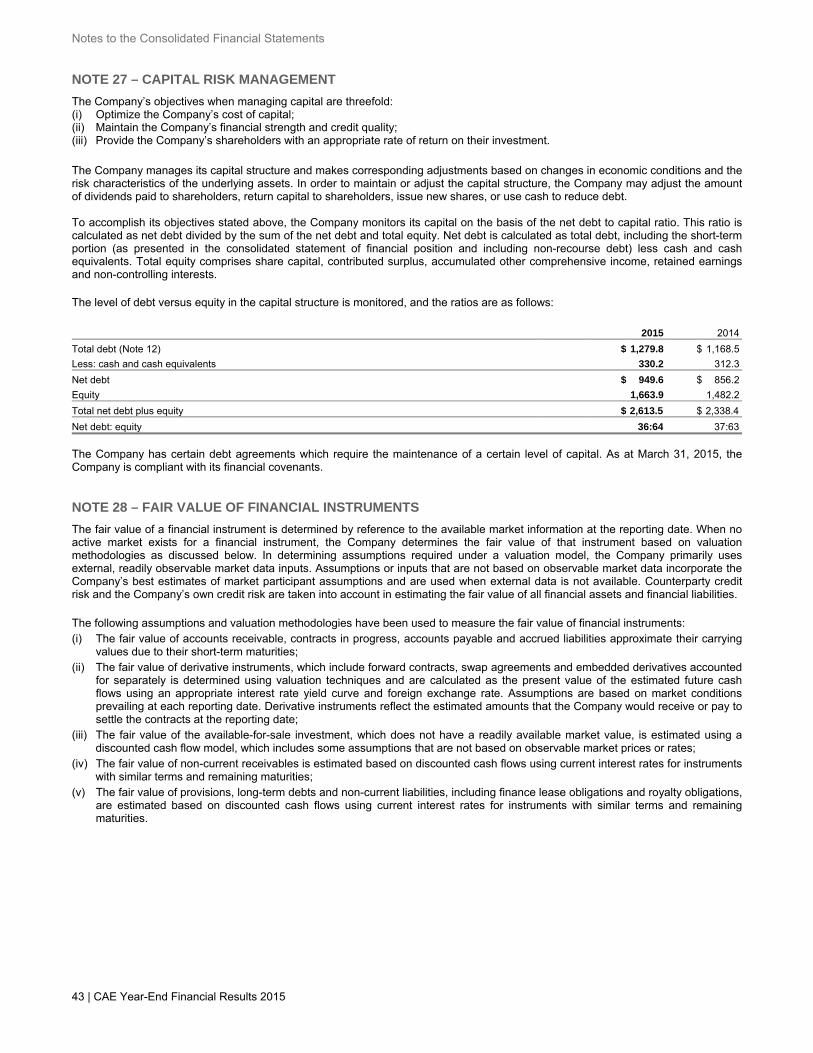
Notes to the Consolidated Financial Statements
43 | CAE Year-End Financial Results 2015
NOTE 27 – CAPITAL RISK MANAGEMENT
The Company’s objectives when managing capital are threefold: (i) Optimize the Company’s cost of capital; (ii) Maintain the Company’s financial strength and credit quality; (iii) Provide the Company’s shareholders with an appropriate rate of return on their investment.
The Company manages its capital structure and makes corresponding adjustments based on changes in economic conditions and the risk characteristics of the underlying assets. In order to maintain or adjust the capital structure, the Company may adjust the amount of dividends paid to shareholders, return capital to shareholders, issue new shares, or use cash to reduce debt. To accomplish its objectives stated above, the Company monitors its capital on the basis of the net debt to capital ratio. This ratio is calculated as net debt divided by the sum of the net debt and total equity. Net debt is calculated as total debt, including the short-term portion (as presented in the consolidated statement of financial position and including non-recourse debt) less cash and cash equivalents. Total equity comprises share capital, contributed surplus, accumulated other comprehensive income, retained earnings and non-controlling interests. The level of debt versus equity in the capital structure is monitored, and the ratios are as follows: (amounts in millions) 2015 2014
Total debt (Note 12) $ 1,279.8 $ 1,168.5
Less: cash and cash equivalents 330.2 312.3
Net debt $ 949.6 $ 856.2
Equity 1,663.9 1,482.2
Total net debt plus equity $ 2,613.5 $ 2,338.4
Net debt: equity 36:64 37:63
The Company has certain debt agreements which require the maintenance of a certain level of capital. As at March 31, 2015, the Company is compliant with its financial covenants. NOTE 28 – FAIR VALUE OF FINANCIAL INSTRUMENTS
The fair value of a financial instrument is determined by reference to the available market information at the reporting date. When no active market exists for a financial instrument, the Company determines the fair value of that instrument based on valuation methodologies as discussed below. In determining assumptions required under a valuation model, the Company primarily uses external, readily observable market data inputs. Assumptions or inputs that are not based on observable market data incorporate the Company’s best estimates of market participant assumptions and are used when external data is not available. Counterparty credit risk and the Company’s own credit risk are taken into account in estimating the fair value of all financial assets and financial liabilities. The following assumptions and valuation methodologies have been used to measure the fair value of financial instruments: (i) The fair value of accounts receivable, contracts in progress, accounts payable and accrued liabilities approximate their carrying
values due to their short-term maturities; (ii) The fair value of derivative instruments, which include forward contracts, swap agreements and embedded derivatives accounted
for separately is determined using valuation techniques and are calculated as the present value of the estimated future cash flows using an appropriate interest rate yield curve and foreign exchange rate. Assumptions are based on market conditions prevailing at each reporting date. Derivative instruments reflect the estimated amounts that the Company would receive or pay to settle the contracts at the reporting date;
(iii) The fair value of the available-for-sale investment, which does not have a readily available market value, is estimated using a discounted cash flow model, which includes some assumptions that are not based on observable market prices or rates;
(iv) The fair value of non-current receivables is estimated based on discounted cash flows using current interest rates for instruments with similar terms and remaining maturities;
(v) The fair value of provisions, long-term debts and non-current liabilities, including finance lease obligations and royalty obligations, are estimated based on discounted cash flows using current interest rates for instruments with similar terms and remaining maturities.
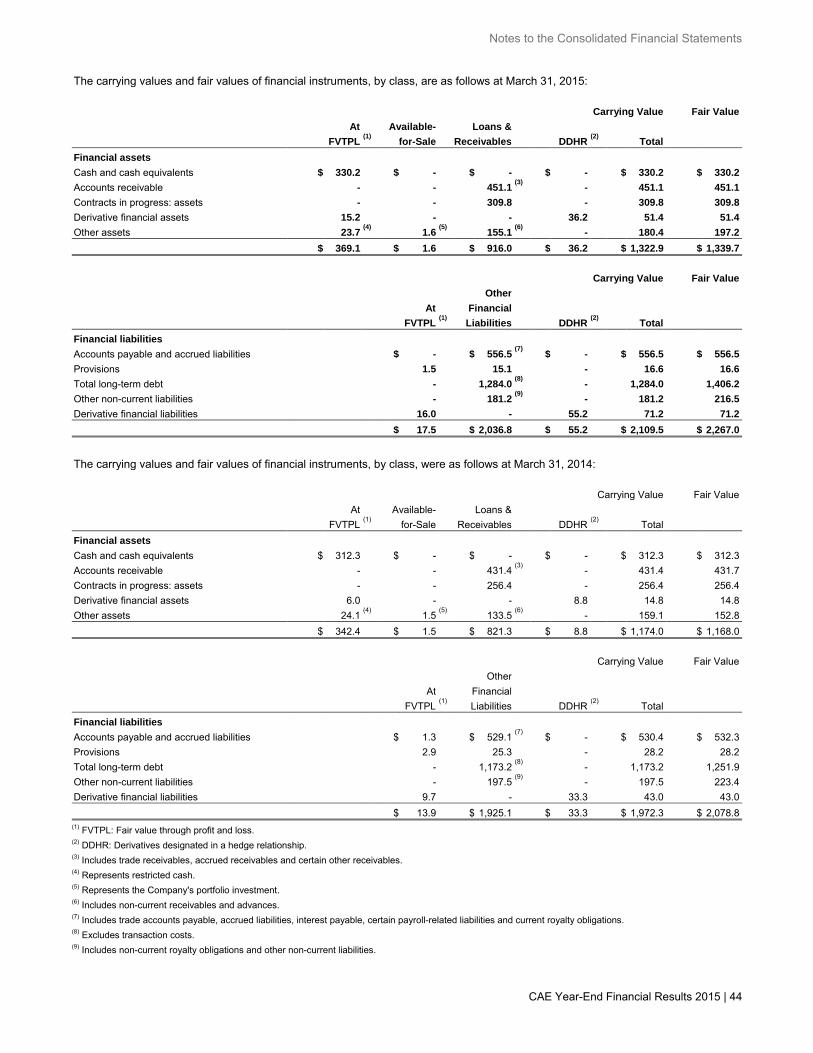
Notes to the Consolidated Financial Statements
CAE Year-End Financial Results 2015 | 44
The carrying values and fair values of financial instruments, by class, are as follows at March 31, 2015: Carrying Value Fair Value At Available- Loans & (amounts in millions) FVTPL
(1)for-Sale Receivables DDHR
(2) Total
Financial assets Cash and cash equivalents $ 330.2 $ - $ - $ - $ 330.2 $ 330.2 Accounts receivable - - 451.1
(3) - 451.1 451.1
Contracts in progress: assets - - 309.8 - 309.8 309.8 Derivative financial assets 15.2 - - 36.2 51.4 51.4 Other assets 23.7
(4) 1.6
(5) 155.1
(6) - 180.4 197.2
$ 369.1 $ 1.6 $ 916.0 $ 36.2 $ 1,322.9 $ 1,339.7 Carrying Value Fair Value Other At Financial FVTPL
(1)Liabilities DDHR
(2) Total
Financial liabilities Accounts payable and accrued liabilities $ - $ 556.5
(7)$ - $ 556.5 $ 556.5
Provisions 1.5 15.1 - 16.6 16.6 Total long-term debt - 1,284.0
(8) - 1,284.0 1,406.2
Other non-current liabilities - 181.2 (9)
- 181.2 216.5 Derivative financial liabilities 16.0 - 55.2 71.2 71.2 $ 17.5 $ 2,036.8 $ 55.2 $ 2,109.5 $ 2,267.0 The carrying values and fair values of financial instruments, by class, were as follows at March 31, 2014: Carrying Value Fair Value At Available- Loans & (amounts in millions) FVTPL
(1)for-Sale Receivables DDHR
(2) Total
Financial assets Cash and cash equivalents $ 312.3 $ - $ - $ - $ 312.3 $ 312.3 Accounts receivable - - 431.4
(3) - 431.4 431.7
Contracts in progress: assets - - 256.4 - 256.4 256.4 Derivative financial assets 6.0 - - 8.8 14.8 14.8 Other assets 24.1
(4) 1.5
(5) 133.5
(6) - 159.1 152.8
$ 342.4 $ 1.5 $ 821.3 $ 8.8 $ 1,174.0 $ 1,168.0 Carrying Value Fair Value Other At Financial FVTPL
(1)Liabilities DDHR
(2) Total
Financial liabilities Accounts payable and accrued liabilities $ 1.3 $ 529.1
(7)$ - $ 530.4 $ 532.3
Provisions 2.9 25.3 - 28.2 28.2 Total long-term debt - 1,173.2
(8) - 1,173.2 1,251.9
Other non-current liabilities - 197.5 (9)
- 197.5 223.4 Derivative financial liabilities 9.7 - 33.3 43.0 43.0 $ 13.9 $ 1,925.1 $ 33.3 $ 1,972.3 $ 2,078.8 (1) FVTPL: Fair value through profit and loss. (2) DDHR: Derivatives designated in a hedge relationship. (3) Includes trade receivables, accrued receivables and certain other receivables. (4) Represents restricted cash. (5) Represents the Company's portfolio investment. (6) Includes non-current receivables and advances. (7) Includes trade accounts payable, accrued liabilities, interest payable, certain payroll-related liabilities and current royalty obligations. (8) Excludes transaction costs. (9) Includes non-current royalty obligations and other non-current liabilities.
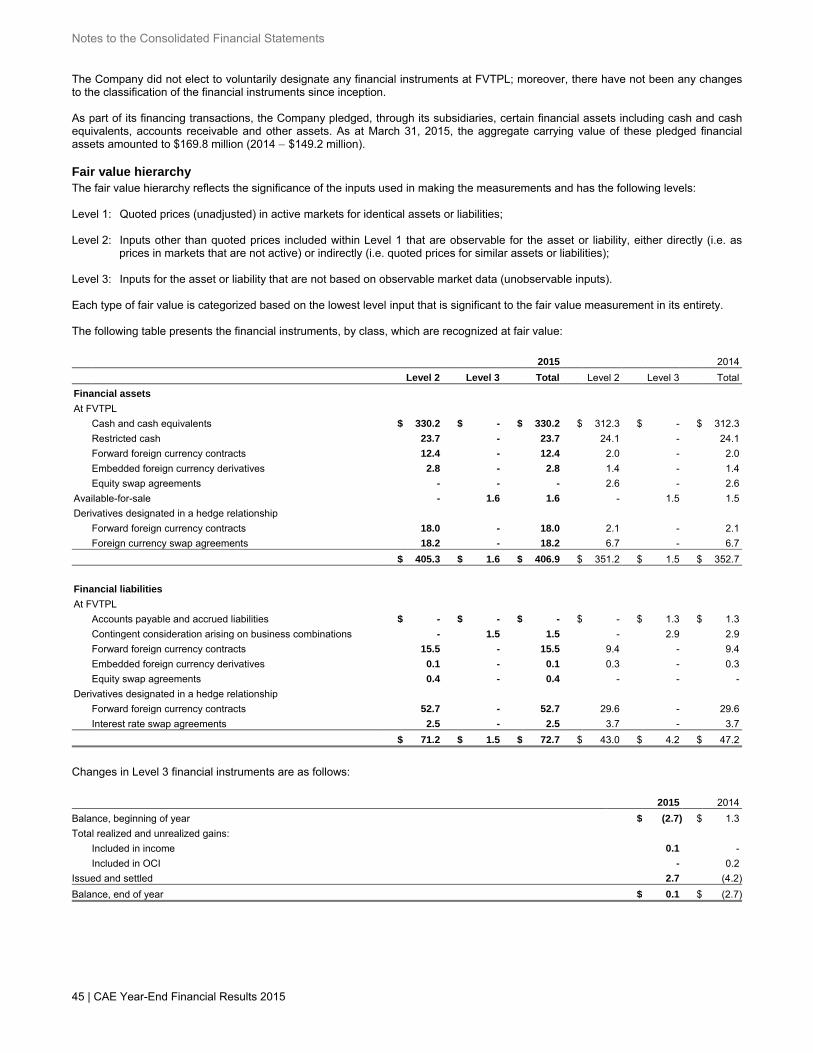
Notes to the Consolidated Financial Statements
45 | CAE Year-End Financial Results 2015
The Company did not elect to voluntarily designate any financial instruments at FVTPL; moreover, there have not been any changes to the classification of the financial instruments since inception. As part of its financing transactions, the Company pledged, through its subsidiaries, certain financial assets including cash and cash equivalents, accounts receivable and other assets. As at March 31, 2015, the aggregate carrying value of these pledged financial assets amounted to $169.8 million (2014 – $149.2 million).
Fair value hierarchy The fair value hierarchy reflects the significance of the inputs used in making the measurements and has the following levels: Level 1: Quoted prices (unadjusted) in active markets for identical assets or liabilities; Level 2: Inputs other than quoted prices included within Level 1 that are observable for the asset or liability, either directly (i.e. as
prices in markets that are not active) or indirectly (i.e. quoted prices for similar assets or liabilities); Level 3: Inputs for the asset or liability that are not based on observable market data (unobservable inputs). Each type of fair value is categorized based on the lowest level input that is significant to the fair value measurement in its entirety. The following table presents the financial instruments, by class, which are recognized at fair value: (amounts in millions) 2015 2014 Level 2 Level 3 Total Level 2 Level 3 Total Financial assets At FVTPL Cash and cash equivalents $ 330.2 $ - $ 330.2 $ 312.3 $ - $ 312.3 Restricted cash 23.7 - 23.7 24.1 - 24.1 Forward foreign currency contracts 12.4 - 12.4 2.0 - 2.0 Embedded foreign currency derivatives 2.8 - 2.8 1.4 - 1.4 Equity swap agreements - - - 2.6 - 2.6 Available-for-sale - 1.6 1.6 - 1.5 1.5 Derivatives designated in a hedge relationship Forward foreign currency contracts 18.0 - 18.0 2.1 - 2.1 Foreign currency swap agreements 18.2 - 18.2 6.7 - 6.7 $ 405.3 $ 1.6 $ 406.9 $ 351.2 $ 1.5 $ 352.7 Financial liabilities At FVTPL Accounts payable and accrued liabilities $ - $ - $ - $ - $ 1.3 $ 1.3 Contingent consideration arising on business combinations - 1.5 1.5 - 2.9 2.9 Forward foreign currency contracts 15.5 - 15.5 9.4 - 9.4 Embedded foreign currency derivatives 0.1 - 0.1 0.3 - 0.3 Equity swap agreements 0.4 - 0.4 - - - Derivatives designated in a hedge relationship Forward foreign currency contracts 52.7 - 52.7 29.6 - 29.6 Interest rate swap agreements 2.5 - 2.5 3.7 - 3.7 $ 71.2 $ 1.5 $ 72.7 $ 43.0 $ 4.2 $ 47.2
Changes in Level 3 financial instruments are as follows:
(amounts in millions) 2015 2014
Balance, beginning of year $ (2.7) $ 1.3
Total realized and unrealized gains:
Included in income 0.1 -
Included in OCI - 0.2
Issued and settled 2.7 (4.2)
Balance, end of year $ 0.1 $ (2.7)
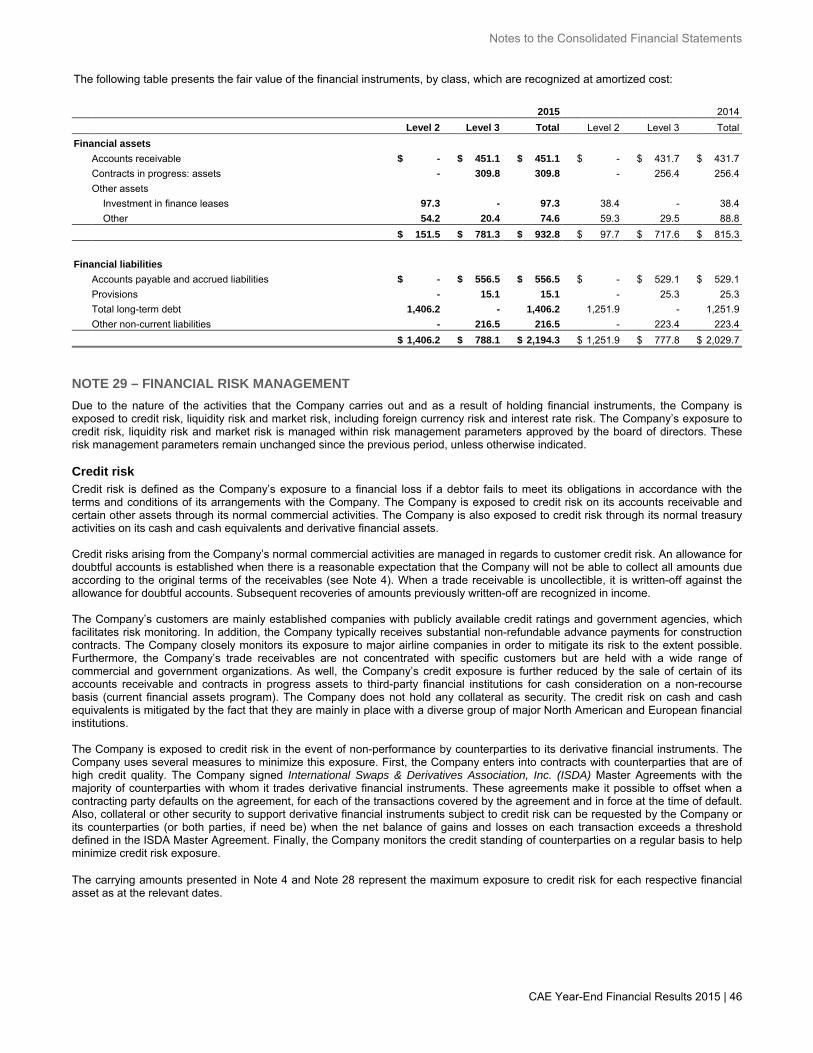
Notes to the Consolidated Financial Statements
CAE Year-End Financial Results 2015 | 46
The following table presents the fair value of the financial instruments, by class, which are recognized at amortized cost: (amounts in millions) 2015 2014 Level 2 Level 3 Total Level 2 Level 3 Total Financial assets Accounts receivable $ - $ 451.1 $ 451.1 $ - $ 431.7 $ 431.7 Contracts in progress: assets - 309.8 309.8 - 256.4 256.4 Other assets Investment in finance leases 97.3 - 97.3 38.4 - 38.4 Other 54.2 20.4 74.6 59.3 29.5 88.8 $ 151.5 $ 781.3 $ 932.8 $ 97.7 $ 717.6 $ 815.3 Financial liabilities Accounts payable and accrued liabilities $ - $ 556.5 $ 556.5 $ - $ 529.1 $ 529.1 Provisions - 15.1 15.1 - 25.3 25.3 Total long-term debt 1,406.2 - 1,406.2 1,251.9 - 1,251.9 Other non-current liabilities - 216.5 216.5 - 223.4 223.4 $ 1,406.2 $ 788.1 $ 2,194.3 $ 1,251.9 $ 777.8 $ 2,029.7 NOTE 29 – FINANCIAL RISK MANAGEMENT
Due to the nature of the activities that the Company carries out and as a result of holding financial instruments, the Company is exposed to credit risk, liquidity risk and market risk, including foreign currency risk and interest rate risk. The Company’s exposure to credit risk, liquidity risk and market risk is managed within risk management parameters approved by the board of directors. These risk management parameters remain unchanged since the previous period, unless otherwise indicated. Credit risk Credit risk is defined as the Company’s exposure to a financial loss if a debtor fails to meet its obligations in accordance with the terms and conditions of its arrangements with the Company. The Company is exposed to credit risk on its accounts receivable and certain other assets through its normal commercial activities. The Company is also exposed to credit risk through its normal treasury activities on its cash and cash equivalents and derivative financial assets. Credit risks arising from the Company’s normal commercial activities are managed in regards to customer credit risk. An allowance for doubtful accounts is established when there is a reasonable expectation that the Company will not be able to collect all amounts due according to the original terms of the receivables (see Note 4). When a trade receivable is uncollectible, it is written-off against the allowance for doubtful accounts. Subsequent recoveries of amounts previously written-off are recognized in income. The Company’s customers are mainly established companies with publicly available credit ratings and government agencies, which facilitates risk monitoring. In addition, the Company typically receives substantial non-refundable advance payments for construction contracts. The Company closely monitors its exposure to major airline companies in order to mitigate its risk to the extent possible. Furthermore, the Company’s trade receivables are not concentrated with specific customers but are held with a wide range of commercial and government organizations. As well, the Company’s credit exposure is further reduced by the sale of certain of its accounts receivable and contracts in progress assets to third-party financial institutions for cash consideration on a non-recourse basis (current financial assets program). The Company does not hold any collateral as security. The credit risk on cash and cash equivalents is mitigated by the fact that they are mainly in place with a diverse group of major North American and European financial institutions. The Company is exposed to credit risk in the event of non-performance by counterparties to its derivative financial instruments. The Company uses several measures to minimize this exposure. First, the Company enters into contracts with counterparties that are of high credit quality. The Company signed International Swaps & Derivatives Association, Inc. (ISDA) Master Agreements with the majority of counterparties with whom it trades derivative financial instruments. These agreements make it possible to offset when a contracting party defaults on the agreement, for each of the transactions covered by the agreement and in force at the time of default. Also, collateral or other security to support derivative financial instruments subject to credit risk can be requested by the Company or its counterparties (or both parties, if need be) when the net balance of gains and losses on each transaction exceeds a threshold defined in the ISDA Master Agreement. Finally, the Company monitors the credit standing of counterparties on a regular basis to help minimize credit risk exposure. The carrying amounts presented in Note 4 and Note 28 represent the maximum exposure to credit risk for each respective financial asset as at the relevant dates.
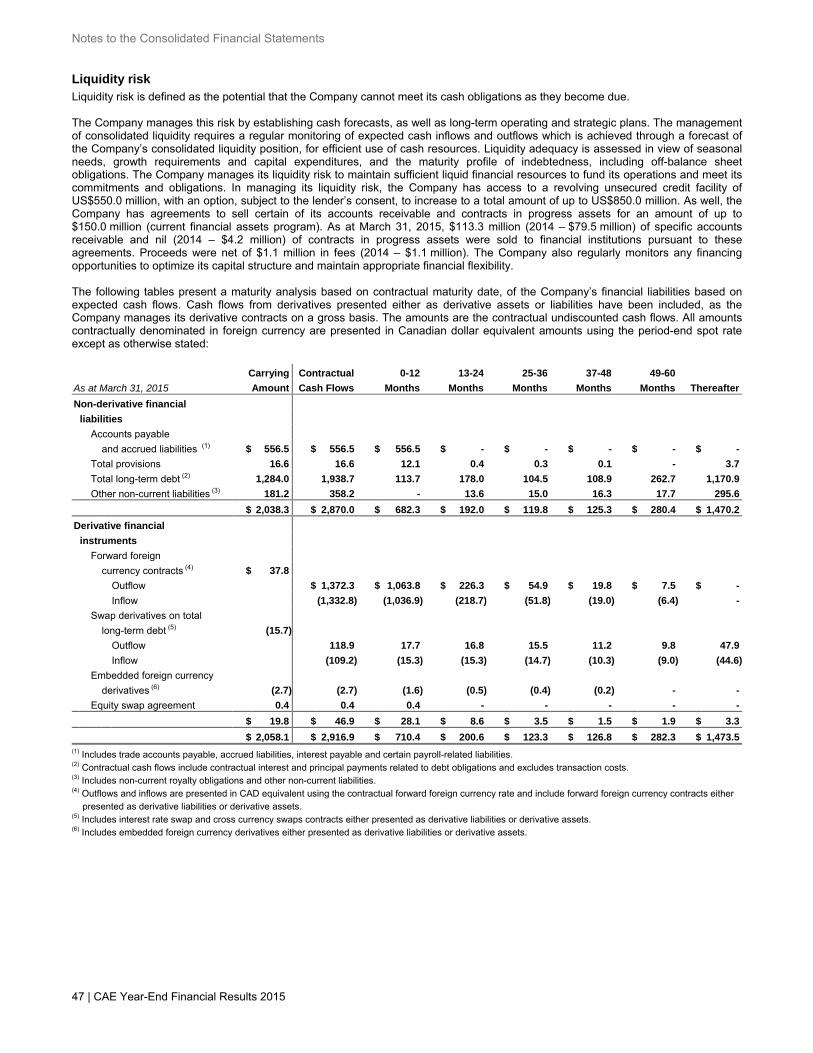
Notes to the Consolidated Financial Statements
47 | CAE Year-End Financial Results 2015
Liquidity risk Liquidity risk is defined as the potential that the Company cannot meet its cash obligations as they become due. The Company manages this risk by establishing cash forecasts, as well as long-term operating and strategic plans. The management of consolidated liquidity requires a regular monitoring of expected cash inflows and outflows which is achieved through a forecast of the Company’s consolidated liquidity position, for efficient use of cash resources. Liquidity adequacy is assessed in view of seasonal needs, growth requirements and capital expenditures, and the maturity profile of indebtedness, including off-balance sheet obligations. The Company manages its liquidity risk to maintain sufficient liquid financial resources to fund its operations and meet its commitments and obligations. In managing its liquidity risk, the Company has access to a revolving unsecured credit facility of US$550.0 million, with an option, subject to the lender’s consent, to increase to a total amount of up to US$850.0 million. As well, the Company has agreements to sell certain of its accounts receivable and contracts in progress assets for an amount of up to $150.0 million (current financial assets program). As at March 31, 2015, $113.3 million (2014 – $79.5 million) of specific accounts receivable and nil (2014 – $4.2 million) of contracts in progress assets were sold to financial institutions pursuant to these agreements. Proceeds were net of $1.1 million in fees (2014 – $1.1 million). The Company also regularly monitors any financing opportunities to optimize its capital structure and maintain appropriate financial flexibility. The following tables present a maturity analysis based on contractual maturity date, of the Company’s financial liabilities based on expected cash flows. Cash flows from derivatives presented either as derivative assets or liabilities have been included, as the Company manages its derivative contracts on a gross basis. The amounts are the contractual undiscounted cash flows. All amounts contractually denominated in foreign currency are presented in Canadian dollar equivalent amounts using the period-end spot rate except as otherwise stated: Carrying Contractual 0-12 13-24 25-36 37-48 49-60 As at March 31, 2015 Amount Cash Flows Months Months Months Months Months Thereafter Non-derivative financial liabilities Accounts payable and accrued liabilities (1) $ 556.5 $ 556.5 $ 556.5 $ - $ - $ - $ - $ - Total provisions 16.6 16.6 12.1 0.4 0.3 0.1 - 3.7 Total long-term debt (2) 1,284.0 1,938.7 113.7 178.0 104.5 108.9 262.7 1,170.9 Other non-current liabilities (3) 181.2 358.2 - 13.6 15.0 16.3 17.7 295.6 $ 2,038.3 $ 2,870.0 $ 682.3 $ 192.0 $ 119.8 $ 125.3 $ 280.4 $ 1,470.2 Derivative financial instruments Forward foreign currency contracts (4) $ 37.8 Outflow $ 1,372.3 $ 1,063.8 $ 226.3 $ 54.9 $ 19.8 $ 7.5 $ - Inflow (1,332.8) (1,036.9) (218.7) (51.8) (19.0) (6.4) - Swap derivatives on total long-term debt (5) (15.7) Outflow 118.9 17.7 16.8 15.5 11.2 9.8 47.9 Inflow (109.2) (15.3) (15.3) (14.7) (10.3) (9.0) (44.6) Embedded foreign currency derivatives (6) (2.7) (2.7) (1.6) (0.5) (0.4) (0.2) - - Equity swap agreement 0.4 0.4 0.4 - - - - - $ 19.8 $ 46.9 $ 28.1 $ 8.6 $ 3.5 $ 1.5 $ 1.9 $ 3.3 $ 2,058.1 $ 2,916.9 $ 710.4 $ 200.6 $ 123.3 $ 126.8 $ 282.3 $ 1,473.5(1) Includes trade accounts payable, accrued liabilities, interest payable and certain payroll-related liabilities.(2) Contractual cash flows include contractual interest and principal payments related to debt obligations and excludes transaction costs. (3) Includes non-current royalty obligations and other non-current liabilities. (4) Outflows and inflows are presented in CAD equivalent using the contractual forward foreign currency rate and include forward foreign currency contracts either presented as derivative liabilities or derivative assets. (5) Includes interest rate swap and cross currency swaps contracts either presented as derivative liabilities or derivative assets. (6) Includes embedded foreign currency derivatives either presented as derivative liabilities or derivative assets.
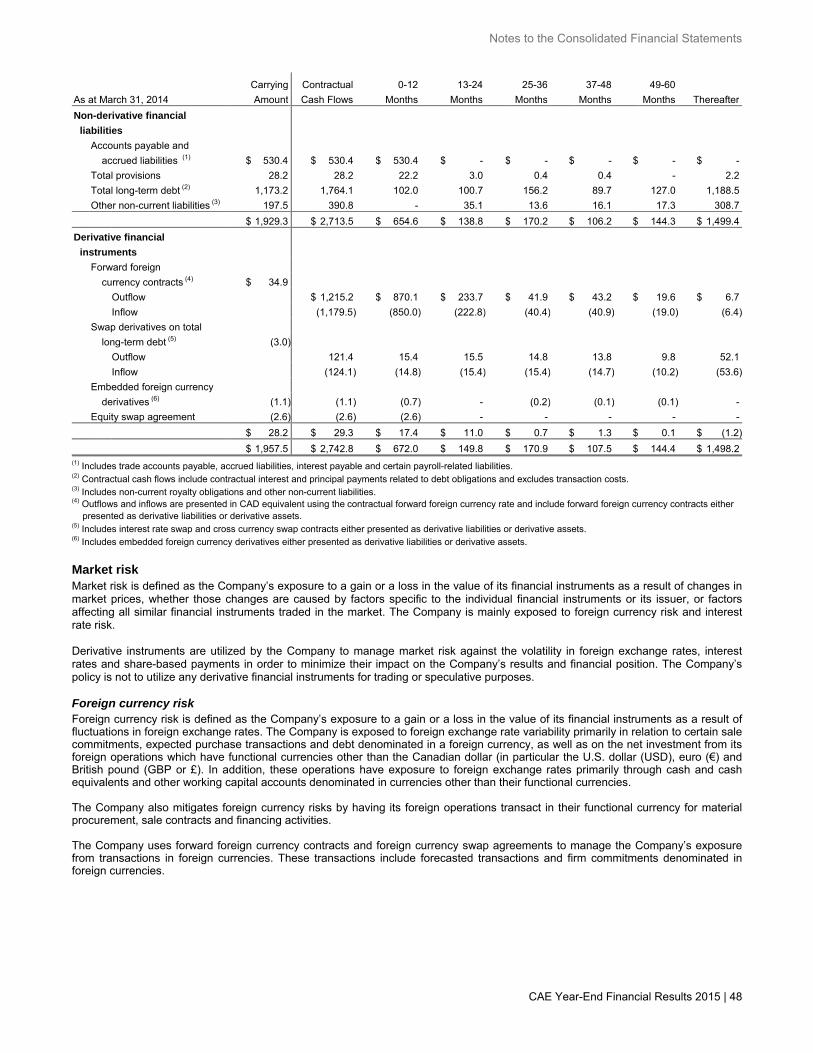
Notes to the Consolidated Financial Statements
CAE Year-End Financial Results 2015 | 48
Carrying Contractual 0-12 13-24 25-36 37-48 49-60 As at March 31, 2014 Amount Cash Flows Months Months Months Months Months Thereafter Non-derivative financial liabilities Accounts payable and accrued liabilities (1) $ 530.4 $ 530.4 $ 530.4 $ - $ - $ - $ - $ - Total provisions 28.2 28.2 22.2 3.0 0.4 0.4 - 2.2 Total long-term debt (2) 1,173.2 1,764.1 102.0 100.7 156.2 89.7 127.0 1,188.5 Other non-current liabilities (3) 197.5 390.8 - 35.1 13.6 16.1 17.3 308.7 $ 1,929.3 $ 2,713.5 $ 654.6 $ 138.8 $ 170.2 $ 106.2 $ 144.3 $ 1,499.4 Derivative financial instruments Forward foreign currency contracts (4) $ 34.9 Outflow $ 1,215.2 $ 870.1 $ 233.7 $ 41.9 $ 43.2 $ 19.6 $ 6.7 Inflow (1,179.5) (850.0) (222.8) (40.4) (40.9) (19.0) (6.4) Swap derivatives on total long-term debt (5) (3.0) Outflow 121.4 15.4 15.5 14.8 13.8 9.8 52.1 Inflow (124.1) (14.8) (15.4) (15.4) (14.7) (10.2) (53.6) Embedded foreign currency derivatives (6) (1.1) (1.1) (0.7) - (0.2) (0.1) (0.1) - Equity swap agreement (2.6) (2.6) (2.6) - - - - - $ 28.2 $ 29.3 $ 17.4 $ 11.0 $ 0.7 $ 1.3 $ 0.1 $ (1.2) $ 1,957.5 $ 2,742.8 $ 672.0 $ 149.8 $ 170.9 $ 107.5 $ 144.4 $ 1,498.2 (1) Includes trade accounts payable, accrued liabilities, interest payable and certain payroll-related liabilities.(2) Contractual cash flows include contractual interest and principal payments related to debt obligations and excludes transaction costs. (3) Includes non-current royalty obligations and other non-current liabilities. (4) Outflows and inflows are presented in CAD equivalent using the contractual forward foreign currency rate and include forward foreign currency contracts either presented as derivative liabilities or derivative assets. (5) Includes interest rate swap and cross currency swap contracts either presented as derivative liabilities or derivative assets. (6) Includes embedded foreign currency derivatives either presented as derivative liabilities or derivative assets. Market risk Market risk is defined as the Company’s exposure to a gain or a loss in the value of its financial instruments as a result of changes in market prices, whether those changes are caused by factors specific to the individual financial instruments or its issuer, or factors affecting all similar financial instruments traded in the market. The Company is mainly exposed to foreign currency risk and interest rate risk. Derivative instruments are utilized by the Company to manage market risk against the volatility in foreign exchange rates, interest rates and share-based payments in order to minimize their impact on the Company’s results and financial position. The Company’s policy is not to utilize any derivative financial instruments for trading or speculative purposes. Foreign currency risk Foreign currency risk is defined as the Company’s exposure to a gain or a loss in the value of its financial instruments as a result of fluctuations in foreign exchange rates. The Company is exposed to foreign exchange rate variability primarily in relation to certain sale commitments, expected purchase transactions and debt denominated in a foreign currency, as well as on the net investment from its foreign operations which have functional currencies other than the Canadian dollar (in particular the U.S. dollar (USD), euro (€) and British pound (GBP or £). In addition, these operations have exposure to foreign exchange rates primarily through cash and cash equivalents and other working capital accounts denominated in currencies other than their functional currencies. The Company also mitigates foreign currency risks by having its foreign operations transact in their functional currency for material procurement, sale contracts and financing activities. The Company uses forward foreign currency contracts and foreign currency swap agreements to manage the Company’s exposure from transactions in foreign currencies. These transactions include forecasted transactions and firm commitments denominated in foreign currencies.
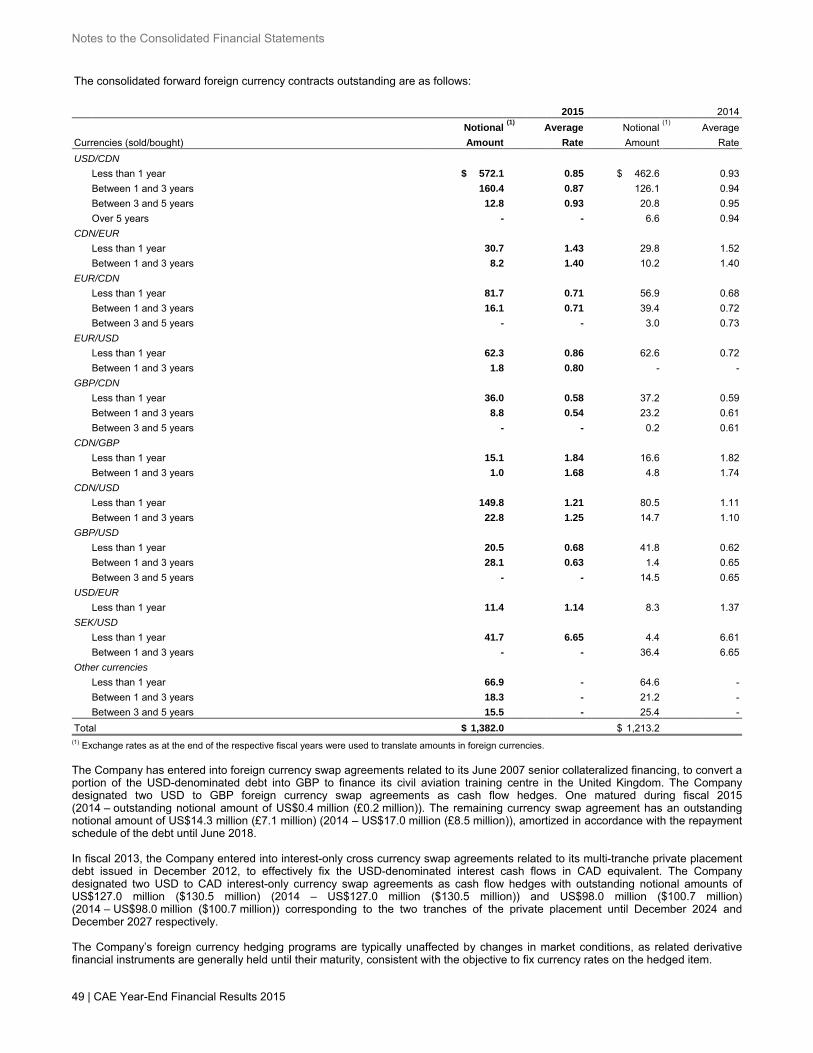
Notes to the Consolidated Financial Statements
49 | CAE Year-End Financial Results 2015
The consolidated forward foreign currency contracts outstanding are as follows: (amounts in millions, except average rate) 2015 2014 Notional
(1)Average Notional
(1)Average
Currencies (sold/bought) Amount Rate Amount Rate
USD/CDN
Less than 1 year $ 572.1 0.85 $ 462.6 0.93
Between 1 and 3 years 160.4 0.87 126.1 0.94
Between 3 and 5 years 12.8 0.93 20.8 0.95
Over 5 years - - 6.6 0.94
CDN/EUR
Less than 1 year 30.7 1.43 29.8 1.52
Between 1 and 3 years 8.2 1.40 10.2 1.40
EUR/CDN
Less than 1 year 81.7 0.71 56.9 0.68
Between 1 and 3 years 16.1 0.71 39.4 0.72
Between 3 and 5 years - - 3.0 0.73
EUR/USD
Less than 1 year 62.3 0.86 62.6 0.72 Between 1 and 3 years 1.8 0.80 - - GBP/CDN
Less than 1 year 36.0 0.58 37.2 0.59 Between 1 and 3 years 8.8 0.54 23.2 0.61 Between 3 and 5 years - - 0.2 0.61 CDN/GBP
Less than 1 year 15.1 1.84 16.6 1.82
Between 1 and 3 years 1.0 1.68 4.8 1.74
CDN/USD
Less than 1 year 149.8 1.21 80.5 1.11
Between 1 and 3 years 22.8 1.25 14.7 1.10
GBP/USD
Less than 1 year 20.5 0.68 41.8 0.62 Between 1 and 3 years 28.1 0.63 1.4 0.65 Between 3 and 5 years - - 14.5 0.65 USD/EUR
Less than 1 year 11.4 1.14 8.3 1.37 SEK/USD
Less than 1 year 41.7 6.65 4.4 6.61
Between 1 and 3 years - - 36.4 6.65
Other currencies
Less than 1 year 66.9 - 64.6 - Between 1 and 3 years 18.3 - 21.2 - Between 3 and 5 years 15.5 - 25.4 - Total $ 1,382.0 $ 1,213.2
(1) Exchange rates as at the end of the respective fiscal years were used to translate amounts in foreign currencies. The Company has entered into foreign currency swap agreements related to its June 2007 senior collateralized financing, to convert a portion of the USD-denominated debt into GBP to finance its civil aviation training centre in the United Kingdom. The Company designated two USD to GBP foreign currency swap agreements as cash flow hedges. One matured during fiscal 2015 (2014 – outstanding notional amount of US$0.4 million (£0.2 million)). The remaining currency swap agreement has an outstanding notional amount of US$14.3 million (£7.1 million) (2014 – US$17.0 million (£8.5 million)), amortized in accordance with the repayment schedule of the debt until June 2018. In fiscal 2013, the Company entered into interest-only cross currency swap agreements related to its multi-tranche private placement debt issued in December 2012, to effectively fix the USD-denominated interest cash flows in CAD equivalent. The Company designated two USD to CAD interest-only currency swap agreements as cash flow hedges with outstanding notional amounts of US$127.0 million ($130.5 million) (2014 – US$127.0 million ($130.5 million)) and US$98.0 million ($100.7 million) (2014 – US$98.0 million ($100.7 million)) corresponding to the two tranches of the private placement until December 2024 and December 2027 respectively. The Company’s foreign currency hedging programs are typically unaffected by changes in market conditions, as related derivative financial instruments are generally held until their maturity, consistent with the objective to fix currency rates on the hedged item.
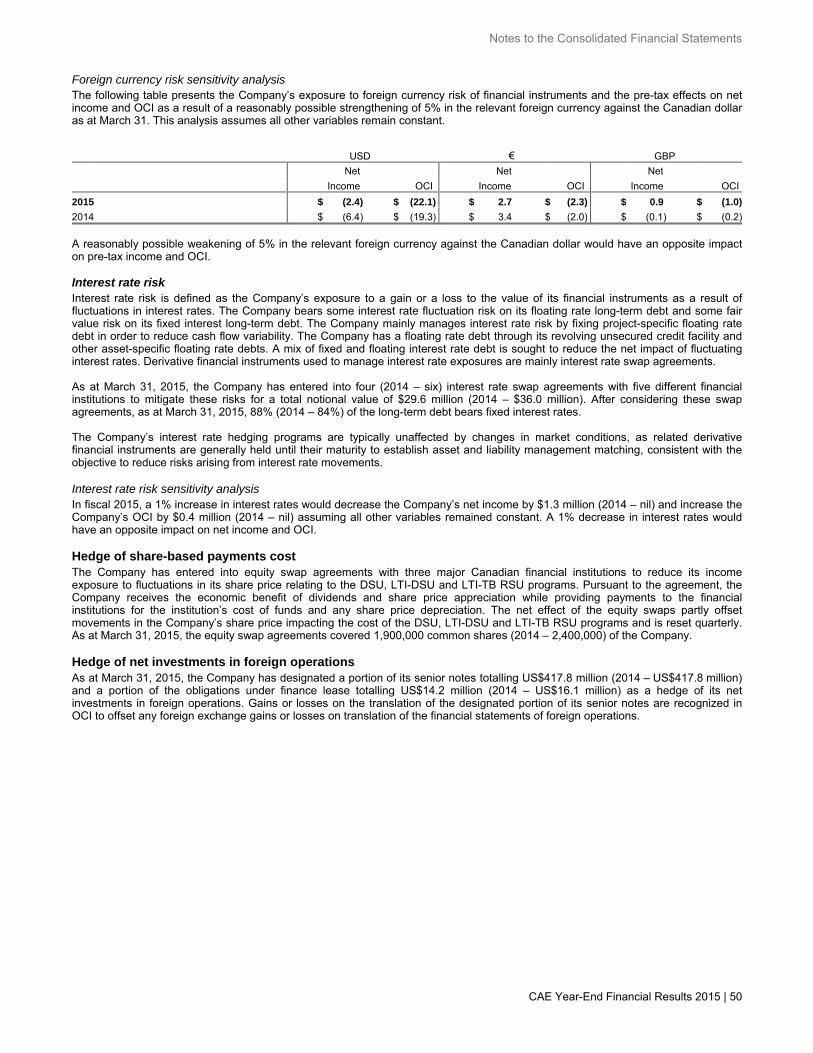
Notes to the Consolidated Financial Statements
CAE Year-End Financial Results 2015 | 50
Foreign currency risk sensitivity analysis The following table presents the Company’s exposure to foreign currency risk of financial instruments and the pre-tax effects on net income and OCI as a result of a reasonably possible strengthening of 5% in the relevant foreign currency against the Canadian dollar as at March 31. This analysis assumes all other variables remain constant.
(amounts in millions) USD € GBP
Net Net Net
Income OCI Income OCI Income OCI
2015 $ (2.4) $ (22.1) $ 2.7 $ (2.3) $ 0.9 $ (1.0)
2014 $ (6.4) $ (19.3) $ 3.4 $ (2.0) $ (0.1) $ (0.2)
A reasonably possible weakening of 5% in the relevant foreign currency against the Canadian dollar would have an opposite impact on pre-tax income and OCI. Interest rate risk Interest rate risk is defined as the Company’s exposure to a gain or a loss to the value of its financial instruments as a result of fluctuations in interest rates. The Company bears some interest rate fluctuation risk on its floating rate long-term debt and some fair value risk on its fixed interest long-term debt. The Company mainly manages interest rate risk by fixing project-specific floating rate debt in order to reduce cash flow variability. The Company has a floating rate debt through its revolving unsecured credit facility and other asset-specific floating rate debts. A mix of fixed and floating interest rate debt is sought to reduce the net impact of fluctuating interest rates. Derivative financial instruments used to manage interest rate exposures are mainly interest rate swap agreements. As at March 31, 2015, the Company has entered into four (2014 – six) interest rate swap agreements with five different financial institutions to mitigate these risks for a total notional value of $29.6 million (2014 – $36.0 million). After considering these swap agreements, as at March 31, 2015, 88% (2014 – 84%) of the long-term debt bears fixed interest rates. The Company’s interest rate hedging programs are typically unaffected by changes in market conditions, as related derivative financial instruments are generally held until their maturity to establish asset and liability management matching, consistent with the objective to reduce risks arising from interest rate movements. Interest rate risk sensitivity analysis In fiscal 2015, a 1% increase in interest rates would decrease the Company’s net income by $1.3 million (2014 – nil) and increase the Company’s OCI by $0.4 million (2014 – nil) assuming all other variables remained constant. A 1% decrease in interest rates would have an opposite impact on net income and OCI. Hedge of share-based payments cost The Company has entered into equity swap agreements with three major Canadian financial institutions to reduce its income exposure to fluctuations in its share price relating to the DSU, LTI-DSU and LTI-TB RSU programs. Pursuant to the agreement, the Company receives the economic benefit of dividends and share price appreciation while providing payments to the financial institutions for the institution’s cost of funds and any share price depreciation. The net effect of the equity swaps partly offset movements in the Company’s share price impacting the cost of the DSU, LTI-DSU and LTI-TB RSU programs and is reset quarterly. As at March 31, 2015, the equity swap agreements covered 1,900,000 common shares (2014 – 2,400,000) of the Company. Hedge of net investments in foreign operations As at March 31, 2015, the Company has designated a portion of its senior notes totalling US$417.8 million (2014 – US$417.8 million) and a portion of the obligations under finance lease totalling US$14.2 million (2014 – US$16.1 million) as a hedge of its net investments in foreign operations. Gains or losses on the translation of the designated portion of its senior notes are recognized in OCI to offset any foreign exchange gains or losses on translation of the financial statements of foreign operations.
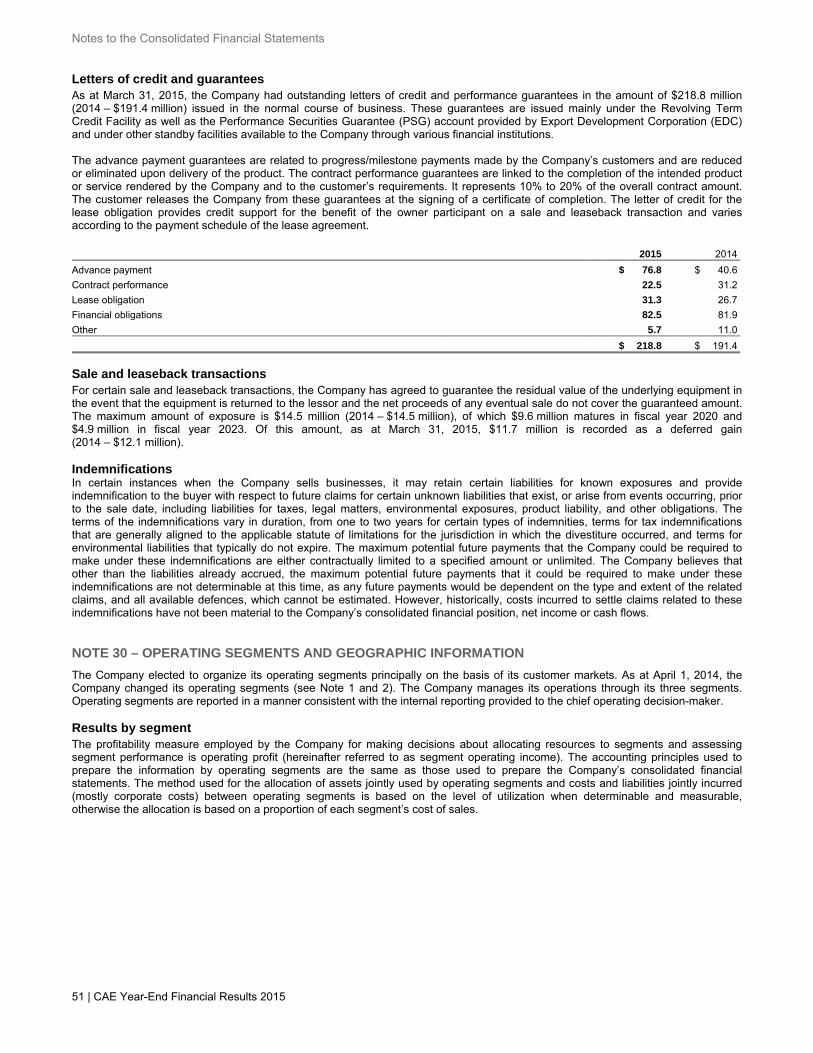
Notes to the Consolidated Financial Statements
51 | CAE Year-End Financial Results 2015
Letters of credit and guarantees As at March 31, 2015, the Company had outstanding letters of credit and performance guarantees in the amount of $218.8 million (2014 – $191.4 million) issued in the normal course of business. These guarantees are issued mainly under the Revolving Term Credit Facility as well as the Performance Securities Guarantee (PSG) account provided by Export Development Corporation (EDC) and under other standby facilities available to the Company through various financial institutions. The advance payment guarantees are related to progress/milestone payments made by the Company’s customers and are reduced or eliminated upon delivery of the product. The contract performance guarantees are linked to the completion of the intended product or service rendered by the Company and to the customer’s requirements. It represents 10% to 20% of the overall contract amount. The customer releases the Company from these guarantees at the signing of a certificate of completion. The letter of credit for the lease obligation provides credit support for the benefit of the owner participant on a sale and leaseback transaction and varies according to the payment schedule of the lease agreement. (amounts in millions) 2015 2014
Advance payment $ 76.8 $ 40.6
Contract performance 22.5 31.2
Lease obligation 31.3 26.7
Financial obligations 82.5 81.9
Other 5.7 11.0
$ 218.8 $ 191.4
Sale and leaseback transactions For certain sale and leaseback transactions, the Company has agreed to guarantee the residual value of the underlying equipment in the event that the equipment is returned to the lessor and the net proceeds of any eventual sale do not cover the guaranteed amount. The maximum amount of exposure is $14.5 million (2014 – $14.5 million), of which $9.6 million matures in fiscal year 2020 and $4.9 million in fiscal year 2023. Of this amount, as at March 31, 2015, $11.7 million is recorded as a deferred gain (2014 – $12.1 million). Indemnifications In certain instances when the Company sells businesses, it may retain certain liabilities for known exposures and provide indemnification to the buyer with respect to future claims for certain unknown liabilities that exist, or arise from events occurring, prior to the sale date, including liabilities for taxes, legal matters, environmental exposures, product liability, and other obligations. The terms of the indemnifications vary in duration, from one to two years for certain types of indemnities, terms for tax indemnifications that are generally aligned to the applicable statute of limitations for the jurisdiction in which the divestiture occurred, and terms for environmental liabilities that typically do not expire. The maximum potential future payments that the Company could be required to make under these indemnifications are either contractually limited to a specified amount or unlimited. The Company believes that other than the liabilities already accrued, the maximum potential future payments that it could be required to make under these indemnifications are not determinable at this time, as any future payments would be dependent on the type and extent of the related claims, and all available defences, which cannot be estimated. However, historically, costs incurred to settle claims related to these indemnifications have not been material to the Company’s consolidated financial position, net income or cash flows. NOTE 30 – OPERATING SEGMENTS AND GEOGRAPHIC INFORMATION
The Company elected to organize its operating segments principally on the basis of its customer markets. As at April 1, 2014, the Company changed its operating segments (see Note 1 and 2). The Company manages its operations through its three segments. Operating segments are reported in a manner consistent with the internal reporting provided to the chief operating decision-maker. Results by segment The profitability measure employed by the Company for making decisions about allocating resources to segments and assessing segment performance is operating profit (hereinafter referred to as segment operating income). The accounting principles used to prepare the information by operating segments are the same as those used to prepare the Company’s consolidated financial statements. The method used for the allocation of assets jointly used by operating segments and costs and liabilities jointly incurred (mostly corporate costs) between operating segments is based on the level of utilization when determinable and measurable, otherwise the allocation is based on a proportion of each segment’s cost of sales.
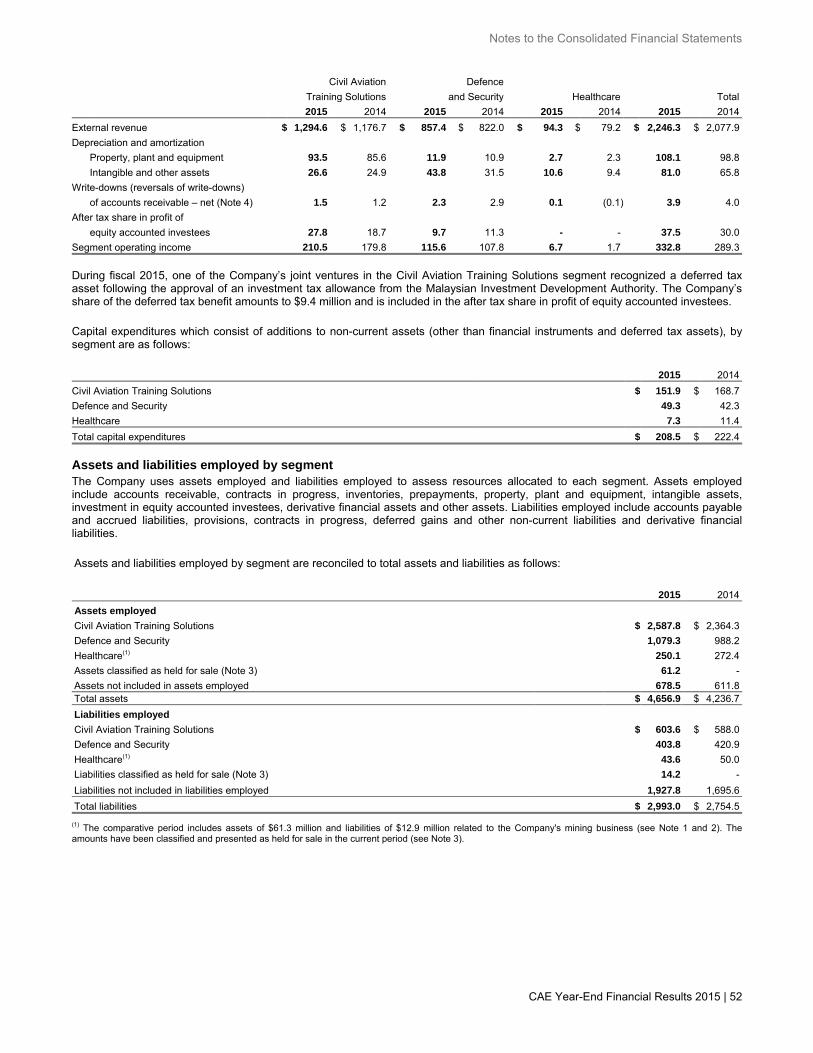
Notes to the Consolidated Financial Statements
CAE Year-End Financial Results 2015 | 52
Year ended March 31, 2015 Civil Aviation Defence
(amounts in millions) Training Solutions and Security Healthcare Total
2015 2014 2015 2014 2015 2014 2015 2014
External revenue $ 1,294.6 $ 1,176.7 $ 857.4 $ 822.0 $ 94.3 $ 79.2 $ 2,246.3 $ 2,077.9
Depreciation and amortization
Property, plant and equipment 93.5 85.6 11.9 10.9 2.7 2.3 108.1 98.8
Intangible and other assets 26.6 24.9 43.8 31.5 10.6 9.4 81.0 65.8
Write-downs (reversals of write-downs)
of accounts receivable – net (Note 4) 1.5 1.2 2.3 2.9 0.1 (0.1) 3.9 4.0
After tax share in profit of
equity accounted investees 27.8 18.7 9.7 11.3 - - 37.5 30.0
Segment operating income 210.5 179.8 115.6 107.8 6.7 1.7 332.8 289.3
During fiscal 2015, one of the Company’s joint ventures in the Civil Aviation Training Solutions segment recognized a deferred tax asset following the approval of an investment tax allowance from the Malaysian Investment Development Authority. The Company’s share of the deferred tax benefit amounts to $9.4 million and is included in the after tax share in profit of equity accounted investees.
Capital expenditures which consist of additions to non-current assets (other than financial instruments and deferred tax assets), bysegment are as follows: (amounts in millions) 2015 2014
Civil Aviation Training Solutions $ 151.9 $ 168.7
Defence and Security 49.3 42.3
Healthcare 7.3 11.4
Total capital expenditures $ 208.5 $ 222.4
Assets and liabilities employed by segment The Company uses assets employed and liabilities employed to assess resources allocated to each segment. Assets employed include accounts receivable, contracts in progress, inventories, prepayments, property, plant and equipment, intangible assets, investment in equity accounted investees, derivative financial assets and other assets. Liabilities employed include accounts payable and accrued liabilities, provisions, contracts in progress, deferred gains and other non-current liabilities and derivative financial liabilities. Assets and liabilities employed by segment are reconciled to total assets and liabilities as follows:
(amounts in millions) 2015 2014 Assets employed
Civil Aviation Training Solutions $ 2,587.8 $ 2,364.3 Defence and Security 1,079.3 988.2 Healthcare(1) 250.1 272.4 Assets classified as held for sale (Note 3) 61.2 - Assets not included in assets employed 678.5 611.8 Total assets $ 4,656.9 $ 4,236.7 Liabilities employed Civil Aviation Training Solutions $ 603.6 $ 588.0 Defence and Security 403.8 420.9 Healthcare(1) 43.6 50.0 Liabilities classified as held for sale (Note 3) 14.2 - Liabilities not included in liabilities employed 1,927.8 1,695.6 Total liabilities $ 2,993.0 $ 2,754.5
(1) The comparative period includes assets of $61.3 million and liabilities of $12.9 million related to the Company's mining business (see Note 1 and 2). Theamounts have been classified and presented as held for sale in the current period (see Note 3).
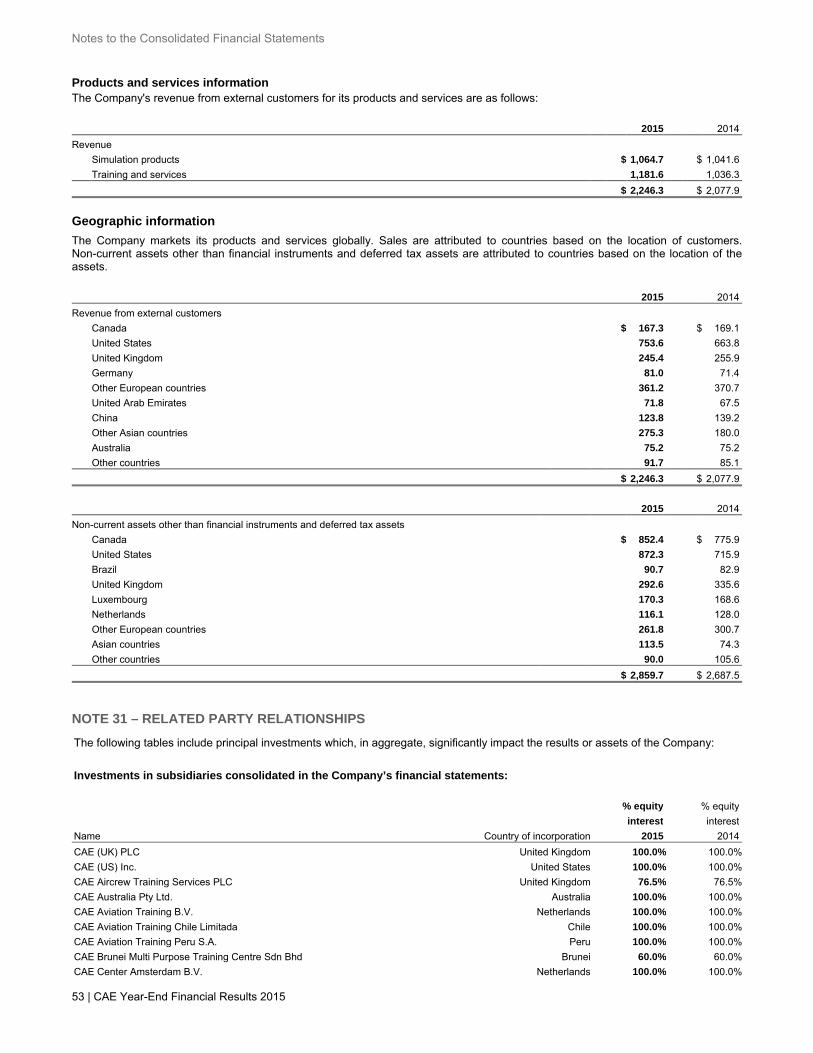
Notes to the Consolidated Financial Statements
53 | CAE Year-End Financial Results 2015
Products and services information The Company's revenue from external customers for its products and services are as follows:Years ended March 31 (amounts in millions) 2015 2014
Revenue
Simulation products $ 1,064.7 $ 1,041.6
Training and services 1,181.6 1,036.3
$ 2,246.3 $ 2,077.9
Geographic information
The Company markets its products and services globally. Sales are attributed to countries based on the location of customers. Non-current assets other than financial instruments and deferred tax assets are attributed to countries based on the location of the assets. (amounts in millions) 2015 2014
Revenue from external customers
Canada $ 167.3 $ 169.1
United States 753.6 663.8
United Kingdom 245.4 255.9
Germany 81.0 71.4
Other European countries 361.2 370.7
United Arab Emirates 71.8 67.5
China 123.8 139.2
Other Asian countries 275.3 180.0
Australia 75.2 75.2
Other countries 91.7 85.1
$ 2,246.3 $ 2,077.9
(amounts in millions) 2015 2014
Non-current assets other than financial instruments and deferred tax assets
Canada $ 852.4 $ 775.9
United States 872.3 715.9
Brazil 90.7 82.9
United Kingdom 292.6 335.6
Luxembourg 170.3 168.6
Netherlands 116.1 128.0
Other European countries 261.8 300.7
Asian countries 113.5 74.3
Other countries 90.0 105.6
$ 2,859.7 $ 2,687.5
NOTE 31 – RELATED PARTY RELATIONSHIPS The following tables include principal investments which, in aggregate, significantly impact the results or assets of the Company:
Investments in subsidiaries consolidated in the Company’s financial statements: % equity % equity As at March 31 interest interest Name Country of incorporation 2015 2014 CAE (UK) PLC United Kingdom 100.0% 100.0% CAE (US) Inc. United States 100.0% 100.0% CAE Aircrew Training Services PLC United Kingdom 76.5% 76.5% CAE Australia Pty Ltd. Australia 100.0% 100.0% CAE Aviation Training B.V. Netherlands 100.0% 100.0% CAE Aviation Training Chile Limitada Chile 100.0% 100.0% CAE Aviation Training Peru S.A. Peru 100.0% 100.0% CAE Brunei Multi Purpose Training Centre Sdn Bhd Brunei 60.0% 60.0% CAE Center Amsterdam B.V. Netherlands 100.0% 100.0%
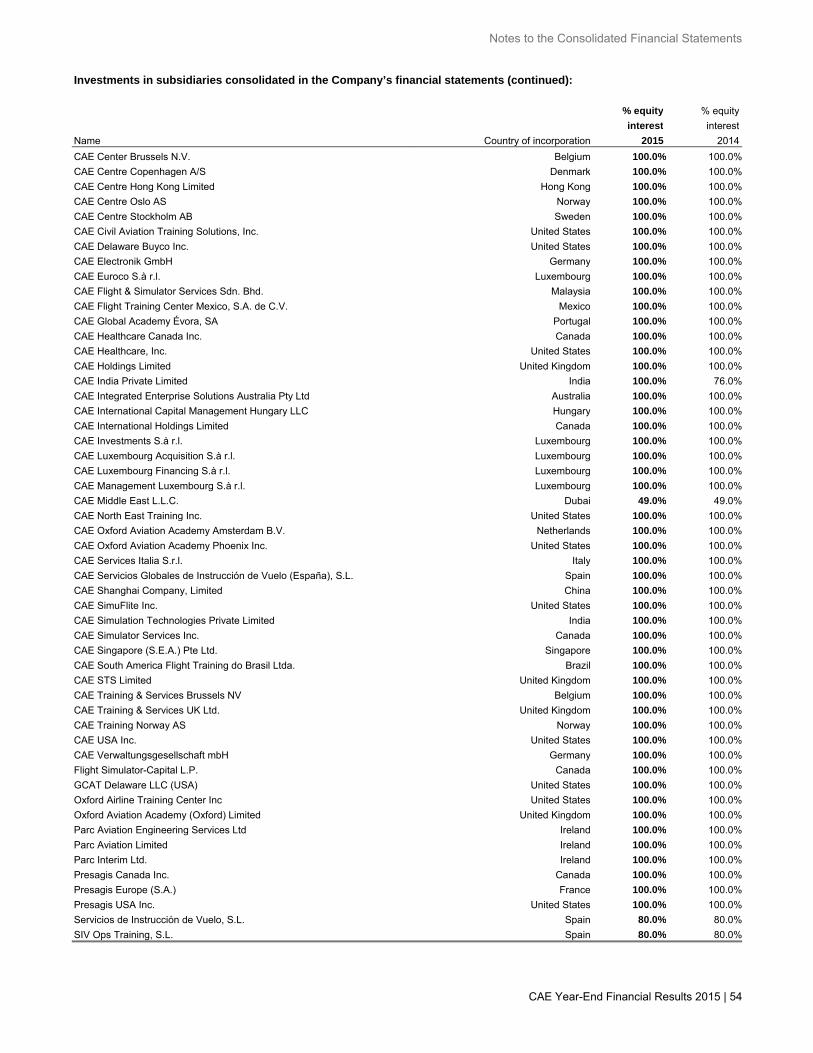
Notes to the Consolidated Financial Statements
CAE Year-End Financial Results 2015 | 54
Investments in subsidiaries consolidated in the Company’s financial statements (continued): % equity % equity interest interest Name Country of incorporation 2015 2014 CAE Center Brussels N.V. Belgium 100.0% 100.0% CAE Centre Copenhagen A/S Denmark 100.0% 100.0% CAE Centre Hong Kong Limited Hong Kong 100.0% 100.0% CAE Centre Oslo AS Norway 100.0% 100.0% CAE Centre Stockholm AB Sweden 100.0% 100.0% CAE Civil Aviation Training Solutions, Inc. United States 100.0% 100.0% CAE Delaware Buyco Inc. United States 100.0% 100.0% CAE Electronik GmbH Germany 100.0% 100.0% CAE Euroco S.à r.l. Luxembourg 100.0% 100.0% CAE Flight & Simulator Services Sdn. Bhd. Malaysia 100.0% 100.0% CAE Flight Training Center Mexico, S.A. de C.V. Mexico 100.0% 100.0% CAE Global Academy Évora, SA Portugal 100.0% 100.0% CAE Healthcare Canada Inc. Canada 100.0% 100.0% CAE Healthcare, Inc. United States 100.0% 100.0% CAE Holdings Limited United Kingdom 100.0% 100.0% CAE India Private Limited India 100.0% 76.0% CAE Integrated Enterprise Solutions Australia Pty Ltd Australia 100.0% 100.0% CAE International Capital Management Hungary LLC Hungary 100.0% 100.0% CAE International Holdings Limited Canada 100.0% 100.0% CAE Investments S.à r.l. Luxembourg 100.0% 100.0% CAE Luxembourg Acquisition S.à r.l. Luxembourg 100.0% 100.0% CAE Luxembourg Financing S.à r.l. Luxembourg 100.0% 100.0% CAE Management Luxembourg S.à r.l. Luxembourg 100.0% 100.0% CAE Middle East L.L.C. Dubai 49.0% 49.0% CAE North East Training Inc. United States 100.0% 100.0% CAE Oxford Aviation Academy Amsterdam B.V. Netherlands 100.0% 100.0% CAE Oxford Aviation Academy Phoenix Inc. United States 100.0% 100.0% CAE Services Italia S.r.l. Italy 100.0% 100.0% CAE Servicios Globales de Instrucción de Vuelo (España), S.L. Spain 100.0% 100.0% CAE Shanghai Company, Limited China 100.0% 100.0% CAE SimuFlite Inc. United States 100.0% 100.0% CAE Simulation Technologies Private Limited India 100.0% 100.0% CAE Simulator Services Inc. Canada 100.0% 100.0% CAE Singapore (S.E.A.) Pte Ltd. Singapore 100.0% 100.0% CAE South America Flight Training do Brasil Ltda. Brazil 100.0% 100.0% CAE STS Limited United Kingdom 100.0% 100.0% CAE Training & Services Brussels NV Belgium 100.0% 100.0% CAE Training & Services UK Ltd. United Kingdom 100.0% 100.0% CAE Training Norway AS Norway 100.0% 100.0% CAE USA Inc. United States 100.0% 100.0% CAE Verwaltungsgesellschaft mbH Germany 100.0% 100.0% Flight Simulator-Capital L.P. Canada 100.0% 100.0% GCAT Delaware LLC (USA) United States 100.0% 100.0% Oxford Airline Training Center Inc United States 100.0% 100.0% Oxford Aviation Academy (Oxford) Limited United Kingdom 100.0% 100.0% Parc Aviation Engineering Services Ltd Ireland 100.0% 100.0% Parc Aviation Limited Ireland 100.0% 100.0% Parc Interim Ltd. Ireland 100.0% 100.0% Presagis Canada Inc. Canada 100.0% 100.0% Presagis Europe (S.A.) France 100.0% 100.0% Presagis USA Inc. United States 100.0% 100.0% Servicios de Instrucción de Vuelo, S.L. Spain 80.0% 80.0% SIV Ops Training, S.L. Spain 80.0% 80.0%
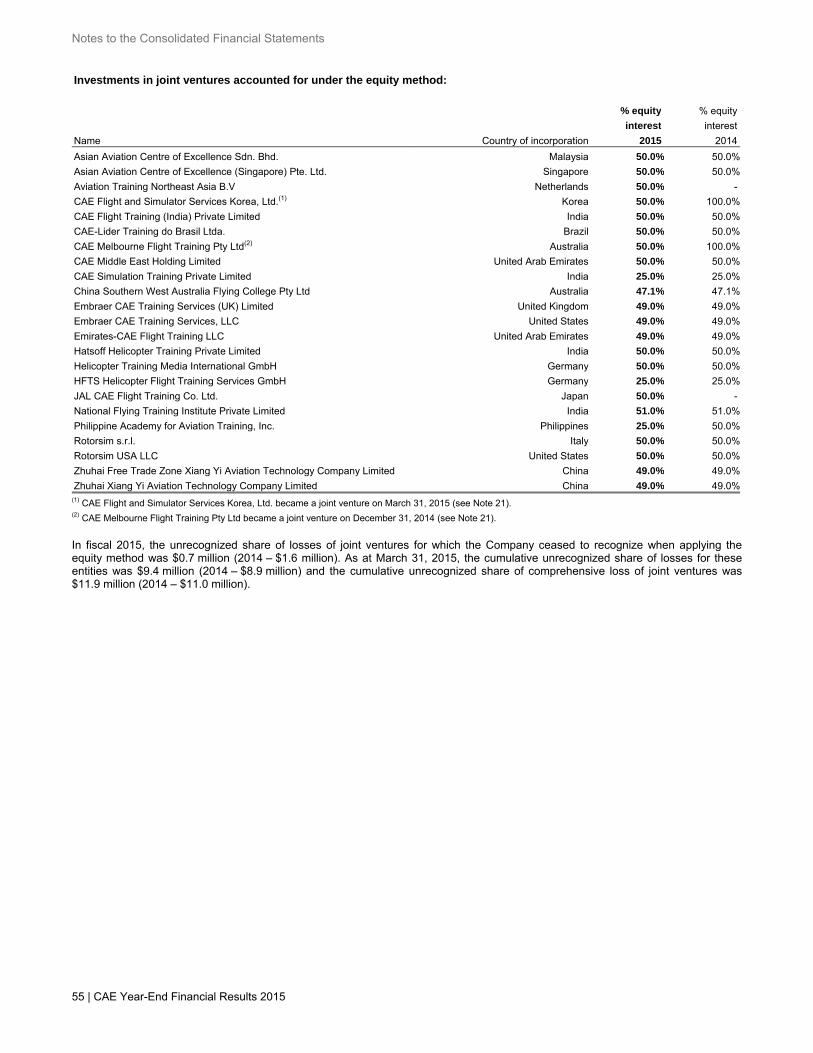
Notes to the Consolidated Financial Statements
55 | CAE Year-End Financial Results 2015
Investments in joint ventures accounted for under the equity method: % equity % equity As at March 31 interest interest Name Country of incorporation 2015 2014 Asian Aviation Centre of Excellence Sdn. Bhd. Malaysia 50.0% 50.0% Asian Aviation Centre of Excellence (Singapore) Pte. Ltd. Singapore 50.0% 50.0% Aviation Training Northeast Asia B.V Netherlands 50.0% - CAE Flight and Simulator Services Korea, Ltd.(1) Korea 50.0% 100.0% CAE Flight Training (India) Private Limited India 50.0% 50.0% CAE-Lider Training do Brasil Ltda. Brazil 50.0% 50.0% CAE Melbourne Flight Training Pty Ltd(2) Australia 50.0% 100.0% CAE Middle East Holding Limited United Arab Emirates 50.0% 50.0% CAE Simulation Training Private Limited India 25.0% 25.0% China Southern West Australia Flying College Pty Ltd Australia 47.1% 47.1% Embraer CAE Training Services (UK) Limited United Kingdom 49.0% 49.0% Embraer CAE Training Services, LLC United States 49.0% 49.0% Emirates-CAE Flight Training LLC United Arab Emirates 49.0% 49.0% Hatsoff Helicopter Training Private Limited India 50.0% 50.0% Helicopter Training Media International GmbH Germany 50.0% 50.0% HFTS Helicopter Flight Training Services GmbH Germany 25.0% 25.0% JAL CAE Flight Training Co. Ltd. Japan 50.0% - National Flying Training Institute Private Limited India 51.0% 51.0% Philippine Academy for Aviation Training, Inc. Philippines 25.0% 50.0% Rotorsim s.r.l. Italy 50.0% 50.0% Rotorsim USA LLC United States 50.0% 50.0% Zhuhai Free Trade Zone Xiang Yi Aviation Technology Company Limited China 49.0% 49.0% Zhuhai Xiang Yi Aviation Technology Company Limited China 49.0% 49.0%(1) CAE Flight and Simulator Services Korea, Ltd. became a joint venture on March 31, 2015 (see Note 21).(2) CAE Melbourne Flight Training Pty Ltd became a joint venture on December 31, 2014 (see Note 21). In fiscal 2015, the unrecognized share of losses of joint ventures for which the Company ceased to recognize when applying the equity method was $0.7 million (2014 – $1.6 million). As at March 31, 2015, the cumulative unrecognized share of losses for these entities was $9.4 million (2014 – $8.9 million) and the cumulative unrecognized share of comprehensive loss of joint ventures was $11.9 million (2014 – $11.0 million).
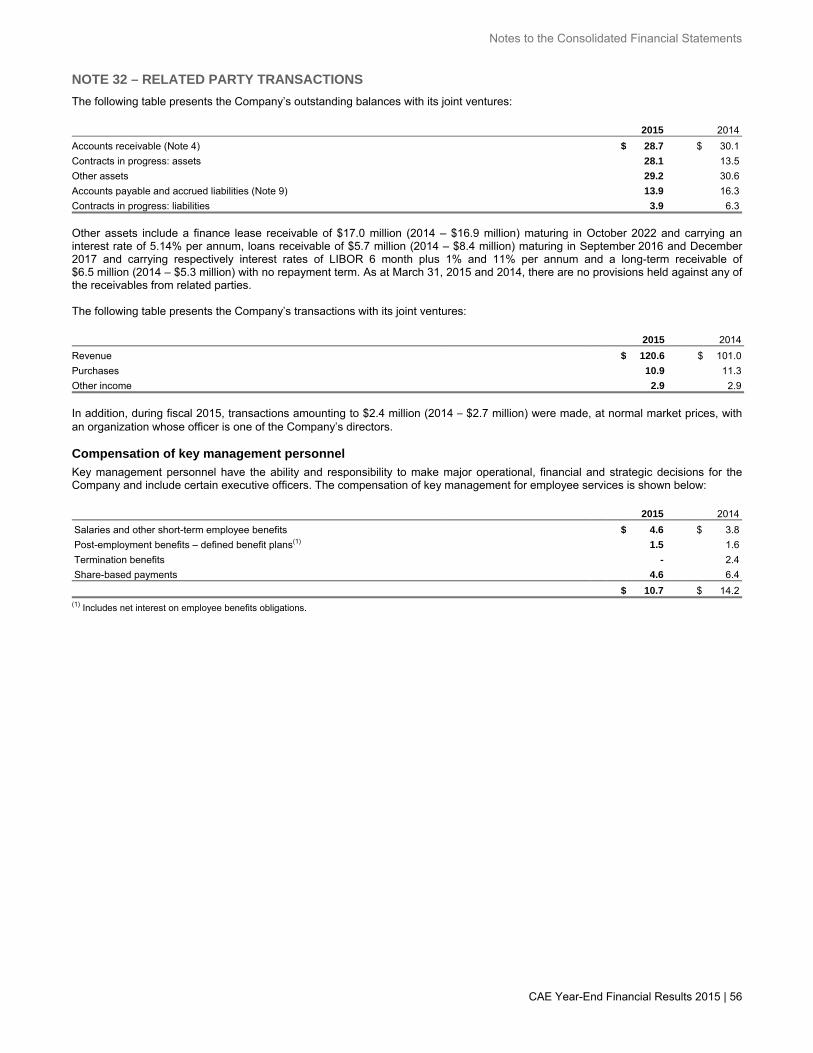
Notes to the Consolidated Financial Statements
CAE Year-End Financial Results 2015 | 56
NOTE 32 – RELATED PARTY TRANSACTIONS
The following table presents the Company’s outstanding balances with its joint ventures: (amounts in millions) 2015 2014
Accounts receivable (Note 4) $ 28.7 $ 30.1
Contracts in progress: assets 28.1 13.5
Other assets 29.2 30.6
Accounts payable and accrued liabilities (Note 9) 13.9 16.3
Contracts in progress: liabilities 3.9 6.3
Other assets include a finance lease receivable of $17.0 million (2014 – $16.9 million) maturing in October 2022 and carrying an interest rate of 5.14% per annum, loans receivable of $5.7 million (2014 – $8.4 million) maturing in September 2016 and December 2017 and carrying respectively interest rates of LIBOR 6 month plus 1% and 11% per annum and a long-term receivable of $6.5 million (2014 – $5.3 million) with no repayment term. As at March 31, 2015 and 2014, there are no provisions held against any of the receivables from related parties. The following table presents the Company’s transactions with its joint ventures: (amounts in millions) 2015 2014
Revenue $ 120.6 $ 101.0
Purchases 10.9 11.3
Other income 2.9 2.9
In addition, during fiscal 2015, transactions amounting to $2.4 million (2014 – $2.7 million) were made, at normal market prices, with an organization whose officer is one of the Company’s directors. Compensation of key management personnel
Key management personnel have the ability and responsibility to make major operational, financial and strategic decisions for the Company and include certain executive officers. The compensation of key management for employee services is shown below: (amounts in millions) 2015 2014 Salaries and other short-term employee benefits $ 4.6 $ 3.8 Post-employment benefits – defined benefit plans(1) 1.5 1.6 Termination benefits - 2.4 Share-based payments 4.6 6.4 $ 10.7 $ 14.2
(1) Includes net interest on employee benefits obligations.


