

California High-Speed Rail: Operations Report
FY14-15, FY15-16 and Program Metrics
September 2015
Finance & Audit Committee Meeting

Agenda
F&A Committee Meeting – September 2015 2
Operations Report Metrics
– Executive Summary
– ROW
– Contract Management
– Finance/Budget
– Risk
– Back-Up ROW Information

Executive Summary
3
ROW Acquisition The current report presents ROW acquisition progress relative to CP1 and CP2-3 through August 28st As of that date, the Authority has
secured legal possession of 335 parcels, with 288 delivered to the design-builder. Both CP1 and CP2-3 delivery plans will be re-baselined in September per the terms of the contracts. The team has already engaged mitigation
actions and identified early construction sections to determine top priority parcels to be delivered in these sections so that construction delays are minimized.
The ROW dataset has been updated to incorporate 124 additional Local Agency parcels (current roadways). These parcels have now been defined (these parcels do not have Assessor’s Parcel Numbers) as a result of the Transfer Agreements developed between the Authority and the Local Agency. The forecast anticipates delivery of these 124 additional public parcels by the end of November. The previously identified public parcels will be acquired based on the current schedules. These additional public parcels have not been incorporated into previously completed probabilistic analysis.
The forecast has been updated to reflect the current scheduled delivery for each parcel. An “Alternative” forecast has been developed to reflect potential delays that are outside the control of the Authority and are more in line with recent trends. The most likely delivery schedule will be between these forecasts curves. The probability analysis will be updated in October to evaluate the schedule risk and determine if the ROW delays continue to fall within the established contingency envelop of the CP1 project.
Results from the probabilistic analysis based on the August ROW delivery forecast indicate that forecasts for delivery are unlikely to be met, highlighting the need for an update to forecasts. There are several reasons for the delivery delays, including: – Inability to access Prop 1A bonds due to legal challenges – Securing Fresno to Merced and Fresno to Bakersfield RODs and permits were delayed – Delay in finalizing Amendment 5 (FRA commitment was August 31, 2012; however, they did not finalize agreement until December 5,
2012) – FRA delayed access to ROW proceeds from December 5, 2012 until April 23, 2013 causing the need to update appraisals that caused
additional delays in ROW acquisition – ROW plan was too aggressive when originally set. A new Plan will be established in September working with the DB
Future positive changes in delivery have the potential to significantly alter the outcome of the probabilistic analysis as it is based upon short term historical trends. As the dataset grows to include the benefits of these changes, improvements will be reflected in the results and reliability of the forecasts.
F&A Committee Meeting – September 2015

Executive Summary
4
Finance/Budget
In FY 2014/15, the focus was on fully utilizing cap and trade funding of $250m for planning and construction which was achieved. The current balance is subject to change due to pending approval of tapered match and federal reimbursements
In FY 2014/15, expenditure graphs tracked actuals and forecast. Going forward in FY 2015/16, the expenditure graphs will track budget along with actuals and forecast. We are in the process of updating our forecast.
July-2015 actual expenditures have not been received as of the publication of this Operations Report. The September-2015 Operations Reports actuals are zero as a result.
Delays in ROW are impacting construction schedules. Mitigation measures are in place to prioritize critical parcels required for major construction work. An analysis is currently being performed to verify that ARRA Federal Funds will not be at-risk even by using the Alternative Forecast. Continued monitoring will be performed to assess any changes should the ROW delivery be delayed further than anticipated.
Contract Management
CP 1 - Despite initial delays to construction activities, TPZP is progressing with construction at the Fresno River Bridge and is preparing to start construction at additional locations in the coming months.
The increase in CP 1 earned value during the August pay period is primarily a result of revising the way the Contractor is compensated for administrative overhead incurred to date. This will not have a significant impact in the expenditure of ARRA funds.
CP 2-3 - The Joint Venture of Dragados/Flatiron has been issued a full Notice to Proceed. The Joint Venture continues to mobilize and plan the work, including developing its baseline schedule and corresponding ROW priorities.
F&A Committee Meeting – September 2015

Agenda
5
Operations Report Metrics
– Executive Summary
– ROW
– Contract Management
– Finance/Budget
– Risk
– Back-Up ROW Information
F&A Committee Meeting – September 2015

ROW Metrics - Context
6
The following slides track parcels delivered to design-builder (DB), which is the last step of the ROW process as well as several other key process steps.
– Four metrics related to “delivered to DB” are tracked:
• Plan: For CP1, the negotiated schedule of parcel delivery as of December 2014 plus additional public parcels and design changes; for CP2-3, planned delivery is currently a placeholder and will be re-baselined in September/October per the new contract
• Actual: Actual parcels delivered each month
• Early Forecast: Refined every month based on future expected delivery
• Alternative Forecast: Forecast that anticipates additional delays for elements outside the control of the Authority and reflects rates more in line with historic delivery
Forecasts are based on inputs from the ROW Consultants and the Authority
The total number of CP1 parcels needed for delivery has changed (542 to 683) over time for two main reasons:
– Any design refinement can impact alignment or width of needed ROW and as a result the counts of impacted parcels/parcels needed to be acquired can fluctuate up or down
– The number of public property parcels were based upon 15% designs; as the ROW Transfer Agreements are being completed with the local agencies, the number of parcels is being refined
ROW
F&A Committee Meeting – September 2015

ROW – CP1 Parcels Delivered to Design-Build by Month Plan vs. Actual vs. Forecast
7
212
683 683 683
0
50
100
150
200
250
300
0
100
200
300
400
500
600
700
F Jan 2017
D N O S A J J M A M F Jan 2016
D N O S A
334
J J M A M F Jan 2015
D N O S A J Pre-FY14-
15
M A M J N D O S A J
Alternative Forecast - Cumulative
Early Forecast - Cumulative
Plan - Cumulative
Actual - Cumulative Early Forecast
Plan
Actual
Alternative Forecast
CP1 - Delivered to DB (number of parcels)
Notes: 1. The total number of parcels required for CP1 has increased from 542 to 683 to reflect additional public roadway parcels that are now defined 2. “Plan”: Negotiated schedule as of December 2014 plus public parcels (124), design changes (16) and 1 new parcel per request of the DB 3. “Early Forecast” and “Alternative Forecast”: Early forecast will be continually refined based on expected delivery schedule. The Alternative Forecast is meant to reflect potential delays outside control of CHSRA and are more in line with historical delivery rates. Forecasts may exceed the plan in certain months as a result of the anticipated or actual delays from plan parcels scheduled earlier 4. 84 parcels with City of Fresno executed agreement scheduled for September delivery to DB once PWB approves them on September 1; 32 public parcels being delivered from County of Madera in October
CP1 ROW
Source: Aug 28, 2015 ROW Weekly Report
Aug actual data through Aug 28
F&A Committee Meeting – September 2015

Notes: 1. “Plan”: Negotiated schedule as of December 2014
ROW – CP1 Historic Performance
8
1966
1629
90
29101312
0
20
40
60
80
9
Aug 2015
14
Jul 2015
Jun 2015
14
May 2015
Apr 2015
37
15
Mar 2015
17 27
Feb 2015
9
Jan 2015
10
Dec 2014
8
Nov 2014
Oct 2014
7
Sep 2014
15
Aug 2014
Plan Actual Actual parcels delivered compared to planned
CP1 Performance (in number of parcels)
121616209999
14
9
191527
91015
0
20
40
60
80
8
Nov 2014
6
Oct 2014
7
Sep 2014
5
Aug 2014
6 7 8
Jan 2015
Dec 2014
Jun 2015
14
May 2015
17
Sept 2015
Aug 2015
Jul 2015
14
Apr 2015
Mar 2015
Feb 2015
Actual
3-Month Rolling Avg (average of prior 3 months)
- - - - -4 -3 -1 10 -22 -10 -76
#
CP1 ROW
-15
Aug actual data and Sept rolling average based on data through Aug 28
Source: August 28, 2015 ROW Weekly Report
-7
F&A Committee Meeting – September 2015

28
10
29
50
34
06
28
00
28
88
0
10
20
30
Pipeline Out In Pipeline Out In Pipeline Out In Pipeline Out In Pipeline Out In
111155
110210
3
108
0
10
20
30
Pipeline Out In Pipeline Out In Pipeline Out In Pipeline Out In Pipeline Out In
ROW – CP1 Pipeline by Process (1 out of 4 pages) Volume of Activity by Process (Flow) - Pipeline
9
CP1 ROW
Appraisal
Just Com-pensation
Completion
1,000
500
0 Total
683
To Date
655
1,000
500
0 Total
683
To Date
654
PRELIMINARY MODELING OUTPUTS – SUBJECT TO CHANGE
Source: August 28, 2015 ROW Weekly Report
May 2015 June 2015 July 2015 August 2015 April 2015
• Parcels in pipeline a function of pending design refinement submittals, reviews and approvals
• Pipeline nearly clear
Draft - Confidential

78
54
79
172
94
172
109
121
120
45
100
50
100
Pipeline Out In Pipeline Out In Pipeline Out In Pipeline Out In Pipeline Out In
ROW – CP1 Pipeline by Process (2 out of 4 pages) Volume of Activity by Process (Flow) - Pipeline
10
CP1 ROW PRELIMINARY MODELING OUTPUTS – SUBJECT TO CHANGE
Source: August 28, 2015 ROW Weekly Report
Completion
2341
2625
2321
2411
241010
0
50
100
Pipeline Out In Pipeline Out In Pipeline Out In Pipeline Out In Pipeline Out In
First Written Offer
1,000
500
0 Total
683
To Date
631
• Pipeline consists of 20 railroad parcels and 2 state of California parcels that are handled through other means than First Written Offers
Negotiation Acquisition
1,000
500
0 Total
683
To Date
240
• 29 agreements being processed and in escrow pending close of escrow (COE) and the balance pending property owner decision to sign or enter condemnation
Draft - Confidential
May 2015 June 2015 July 2015 August 2015 April 2015

26180
441914
49
83
5438
2
90
248
0
50
100
Pipeline Out In In Pipeline Out In Pipeline Out In Out Out Pipeline In Pipeline
105
64
107
1716
108
73
112
327
88
616
0
50
100
Out In Pipeline Pipeline Pipeline Out In In Pipeline Out Out In In Pipeline Out
ROW – CP1 Pipeline by Process (3 out of 4 pages) Volume of Activity by Process (Flow) - Pipeline
11
CP1 ROW
Condem-nation
Eminent Domain
Completion
200
100
0 To Date
163
Total
0
50
150
100
200
To Date Total
16
PRELIMINARY MODELING OUTPUTS – SUBJECT TO CHANGE
Source: August 28, 2015 ROW Weekly Report
• Pipeline comprised of suit packages at Caltrans legal pending filing with the courts
• Pipeline exists pending court hearings seeking Orders of Possession
(1) Total parcels that may take the condemnation route is unknown
(1)
(1)
Draft - Confidential
May 2015 June 2015 July 2015 August 2015 April 2015

1,000
500
0
Total
180
To Date
0
ROW – CP1 Pipeline by Process (4 out of 4 pages) Volume of Activity by Process (Flow) - Pipeline
12
CP1 ROW PRELIMINARY MODELING OUTPUTS – SUBJECT TO CHANGE
Source: August 28, 2015 ROW Weekly Report
Completion
180
00
180
00
180
01
179
00
179
080
50100
150
200
Pipeline Out In Pipeline Out In Pipeline Out In Pipeline Out In Pipeline Out In
Public Agency
• 124 public parcels associated with roadway ROW are scheduled for delivery by November 30th. Other public parcels are scheduled individually.
2895
32141630141430191039
1527
0
50
100
150
200
Pipeline Out In Pipeline Out In Pipeline Out In Pipeline Out In Pipeline Out In
Delivery
1,000
500
0 Total
683
To Date
212
• 22 parcels require relocations, balance available to be transferred to DB
Draft - Confidential
May 2015 June 2015 July 2015 August 2015 April 2015

CP1 Probabilistic Analysis of Meeting CP1 Forecast
13
The team has developed a new parcels handover forecast for CP1 based on actual and past performance in terms of numbers of parcels delivered per month
The forecast is refined monthly as new information is integrated and present a trajectory that the team uses to achieve the plan agreed with the contractor TPZP (negotiated schedule as of December 2014)
A probabilistic distribution of monthly handover rates is specified based on monthly handovers during previous delivery periods (3 months and 6 months)
The distribution is then compared to the forecast handover rates of each month in a Monte Carlo simulation to determine the probability of meeting monthly (clean slate) and cumulative (rolling over delayed parcels to next month) targets
When relevant the analysis determines the likely delay to the forecasted completion date
A Pessimistic case and an Optimistic case bracket the Median case; all presented in the detailed results in Appendix
An updated probabilistic analysis will be prepared in October 2015
F&A Committee Meeting – September 2015

CP1 Probabilistic Analysis – Summary and Preliminary Results from August 2015 Forecasts
14
Past 6-Month Parcel
Handover Rate
Range used for historic period : 9 – 27 parcels per month (Median = 17 parcels per month)
Meeting monthly targets (clean slate) : 9 / 18 months Meeting monthly targets (roll over) : 1 / 18 months Accumulated parcel delivery deficit of delivery of parcels
(iceberg) reaches 105 parcels in the median case creating cost impacts to the contract if delays are not avoided or mitigated
Handover of the final parcel anticipated to be delayed 7 months
Past 3-Month Parcel
Handover Rate
Range used for historic period : 15 – 27 parcels per month (Median = 21 parcels per month)
Meeting monthly targets (clean slate) : 9 / 18 months Meeting monthly targets (roll over) : 4 / 18 months While the final parcel is likely (85.6%) to be delivered by
Dec 2016, delays (and likely associated claims) will have been accumulated by that date.
Notes: The deficits presented are in addition to the delays already accrued. Deficits measured against our own internal forecast NOT contractual obligations to the contractor.
F&A Committee Meeting – September 2015

ROW – CP2-3 Parcels Delivered to Design-Build by Month Planned vs. Actual vs. Forecast
15
11
3431
311
97
61
18
586260
30
120
212
121191010122329313741
322835403439
16
76
543 543
0
50
100
150
200
250
300
0
50
100
150
200
250
300
350
400
450
500
550
Apr Mar Feb Jan 2017
Dec Nov Oct Sep Aug Jul Jun May Apr Mar Feb Jan 2016
Dec Nov
27
Oct Sep Aug Jul Pre-FY15-
16
Forecast - Cumulative
Plan - Cumulative
Actual - Cumulative
Forecast
Plan
Actual
CP2-3 - Delivered to DB (in number of parcels)
Notes: 1. The “Plan” numbers have been developed as a placeholder until acquisition plan with DB is finalized 2. “Forecast”: Continually refined based on expected delivery 3. Total number of parcels will increase once public parcels and design changes are accounted for; forecast will be revised once they are in
CP2-3 ROW
Aug actual data through Aug 28
Source: August 28, 2015 ROW Weekly Report
8-month delay due to ATCs; contractor required to mitigate and bring back to schedule
Draft - Confidential
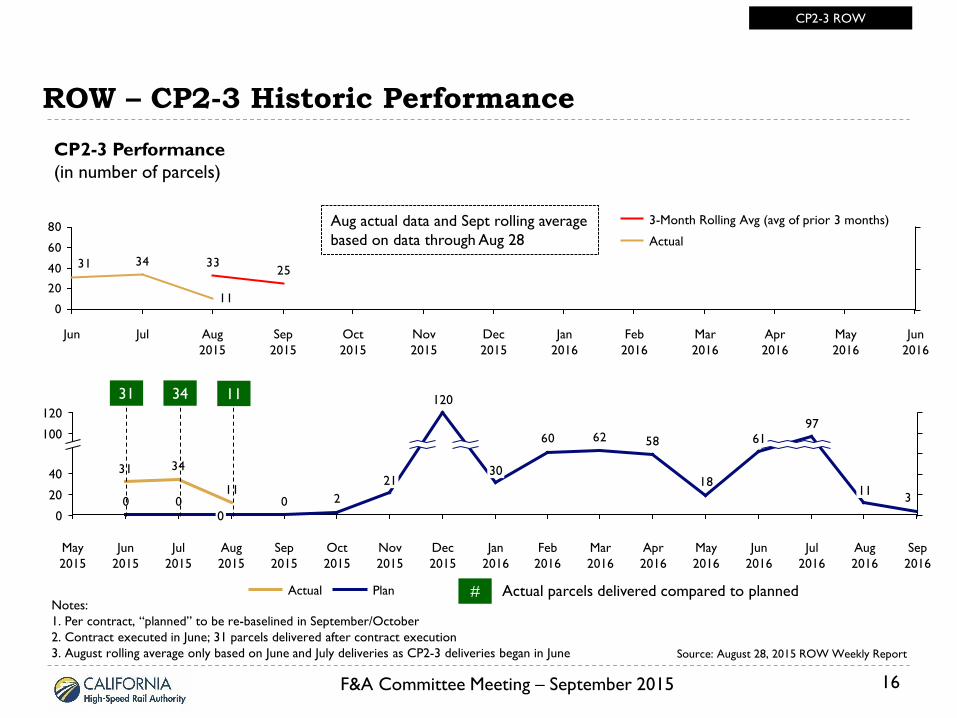
Notes: 1. Per contract, “planned” to be re-baselined in September/October 2. Contract executed in June; 31 parcels delivered after contract execution 3. August rolling average only based on June and July deliveries as CP2-3 deliveries began in June
ROW – CP2-3 Historic Performance
16
11
3431
318
586260
200020
40
120
100
0
Aug 2016
11
Jul 2016
97
Jun 2016
61
May 2016
Apr 2016
Mar 2016
Feb 2016
Sep 2016
Jan 2016
30
Dec 2015
120
Nov 2015
21
Oct 2015
Sep 2015
Aug 2015
0
Jul 2015
Jun 2015
May 2015
Plan Actual Actual parcels delivered compared to planned
CP2-3 Performance (in number of parcels)
2533
11
3431
0
20
40
60
80
Jun 2016
May 2016
Apr 2016
Mar 2016
Feb 2016
Jan 2016
Dec 2015
Nov 2015
Oct 2015
Sep 2015
Aug 2015
Jul Jun
31
#
CP2-3 ROW
34
Source: August 28, 2015 ROW Weekly Report
F&A Committee Meeting – September 2015
Actual
3-Month Rolling Avg (avg of prior 3 months) Aug actual data and Sept rolling average based on data through Aug 28
11

1520
17
20
19
10
2012
0
32
120
0
20
40
60
Out In Pipeline Pipeline Out In Pipeline Out In Pipeline Out In Pipeline Out In
25
72
30
22
30
13
1
42
126
4845
12
0
20
40
60
Pipeline Out In Pipeline Out In Pipeline Out In Pipeline Out In Pipeline Out In
ROW – CP2-3 Pipeline by Process (1 out of 4 pages) Volume of Activity by Process (Flow) - Pipeline
17
CP2-3 ROW
Appraisal
Just Com-pensation
Completion
0
200
400
600
Total
543
To Date
522
600
0
400
200
Total
543
To Date
491
PRELIMINARY MODELING OUTPUTS – SUBJECT TO CHANGE
Source: August 28, 2015 ROW Weekly Report
• Parcels in pipeline a function of pending design refinement submittals, reviews and approvals
• Pipeline pending DGS setting Just Compensation
Draft - Confidential
May 2015 June 2015 July 2015 August 2015 April 2015

101
213
119
314
146
578
195
4717
225
5969
0
100
200
Pipeline Out In Pipeline Out In Pipeline Out In Pipeline Out In Pipeline Out In
ROW – CP2-3 Pipeline by Process (2 out of 4 pages) Volume of Activity by Process (Flow) - Pipeline
18
CP2-3 ROW PRELIMINARY MODELING OUTPUTS – SUBJECT TO CHANGE
Source: August 28, 2015 ROW Weekly Report
Completion
3837
3440
3881333328
576945
0
100
200
Pipeline Out In Pipeline Out In Pipeline Out In Pipeline Out In Pipeline Out In
First Written Offer
200
400
600
0 Total
543
To Date
438
• Pipeline consists of 24 railroad parcels and 12 that are under appraisal refinement
Negotiation Acquisition
95
200
400
600
0 Total
543
To Date
• 59 agreements being processed to and in escrow pending close of escrow (COE) and the balance pending property owner decision to sign or enter condemnation
Draft - Confidential
May 2015 June 2015 July 2015 August 2015 April 2015
95
89
94
2815
107
2241
8861
21
128
3932
0
50
100
150
Pipeline Out In Pipeline Out In Pipeline Out In Pipeline Out In Pipeline Out In
65
62
69
11
56
51744
213728
317 24
0
50
100
150
Pipeline Out In Pipeline Out In Pipeline Out In Pipeline Out In Pipeline Out In
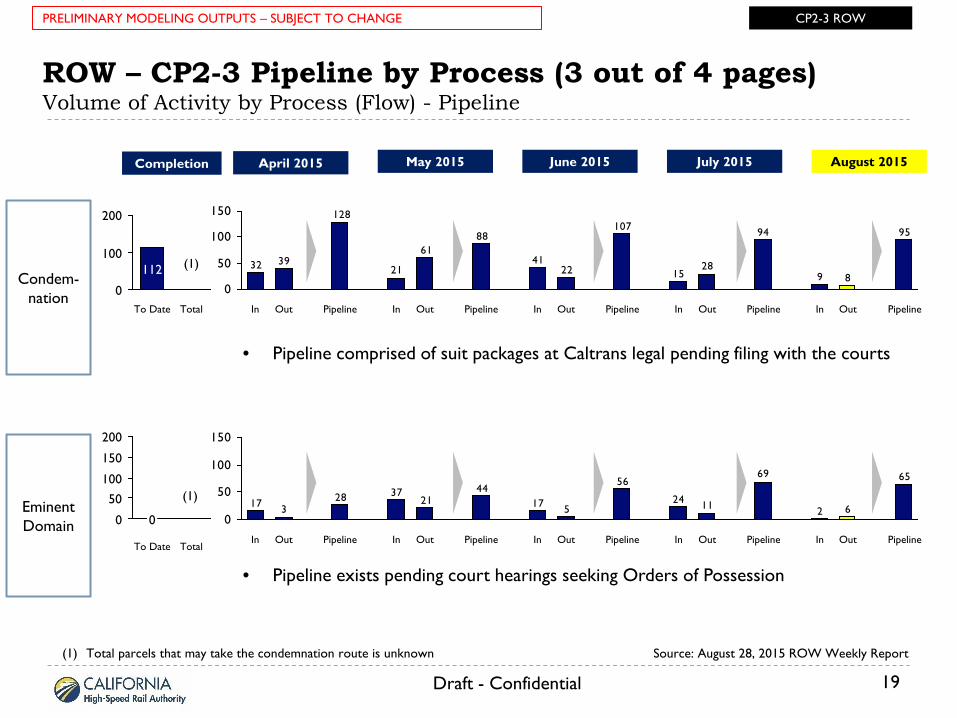
ROW – CP2-3 Pipeline by Process (3 out of 4 pages) Volume of Activity by Process (Flow) - Pipeline
19
CP2-3 ROW
Condem-nation
Eminent Domain
Completion
200
100
0 Total To Date
112
200
150
100
50
0
Total To Date
0
PRELIMINARY MODELING OUTPUTS – SUBJECT TO CHANGE
Source: August 28, 2015 ROW Weekly Report
• Pipeline comprised of suit packages at Caltrans legal pending filing with the courts
• Pipeline exists pending court hearings seeking Orders of Possession
(1) Total parcels that may take the condemnation route is unknown
(1)
(1)
Draft - Confidential
May 2015 June 2015 July 2015 August 2015 April 2015

1.0
0.5
0.0
Total To Date
0
ROW – CP2-3 Pipeline by Process (4 out of 4 pages) Volume of Activity by Process (Flow) - Pipeline
20
CP2-3 ROW PRELIMINARY MODELING OUTPUTS – SUBJECT TO CHANGE
Source: August 28, 2015 ROW Weekly Report
(1)
(1) Total number of public parcels to be identified
Completion
13
00
13
0211
0011
0011
011
0
20
40
60
Pipeline Out In Pipeline Out In Pipeline Out In Pipeline Out In Pipeline Out In
Public Agency
• Transfer agreements will be prepared with exhibits and increase the number of distinct parcels
191110
20
34
15
3931
15
55
07
48
0
24
0
20
40
60
Pipeline Out In Pipeline Out In Pipeline Out In Pipeline Out In Pipeline Out In
Delivery
1,000
500
0
Total
543
To Date
76
• 15 parcels require relocations, balance available to be transferred to DB
Draft - Confidential
May 2015 June 2015 July 2015 August 2015 April 2015

Agenda
21
Operations Report Metrics
– Executive Summary
– ROW
– Contract Management
– Finance/Budget
– Risk
– Back-Up ROW Information
F&A Committee Meeting – September 2015
Contract Management Metrics - Context
22
There are 2 contract management metrics included:
– Contingency Value
• This value is based on remaining contingency as a percentage of the remaining contract balance
– Expenditure Schedule
• Earned value refers to total invoices to date
• Planned value refers to forecasted invoices to date
Contract management metrics for CP1 and CP2-3 are included
Updates to the report will be made monthly
Contract Management
F&A Committee Meeting – September 2015

CP1 Contract Management – Contingency Value
23
CP1 – Contract Balance Remaining (in millions $)
Contract Management CP1 - Contingency
CP1 – Contingency Balance Remaining (millions $)
(% of contract balance remaining)
Jun 2016 May 2016 Mar 2016 Feb 2016 Jan 2016 Dec 2015 Nov 2015 Oct 2015 Sep 2015 Aug 2015 Jul 2015
$150.9 (16.7%)
End of FY14-15
$150.9 (16.6%)
$150.6 (16.8%)
Aug 2015 Oct 2015
$904
Nov 2015 May 2016 Jul 2015 End of FY-14-15
Mar 2016 Sep 2015 Jan 2016 Feb 2016 Dec 2015 Jun 2016
$907 $898
Data as of: August 20, 2015
If remaining contingency against amount of contract / work left falls below 10%, corrective action may be necessary.
F&A Committee Meeting – September 2015
Notes: 1. Contract balance only accounts for approved invoices in determining contract balance, so this number may not reconcile with ”earned value” in schedule performance index metric 2. Based upon the amount of CP 1 work remaining, both the remaining contingency balance and the contingency percentage, measured against the contract balance remaining, fall within the established contingency envelope of the project

CP1 Contract Management Raw Data: Contingency Value
24
End of FY 14-15
July 2015
Aug 2015
Sept 2015
Oct 2015
Nov 2015
Dec 2015
Jan 2016
Feb 2016
Mar 2016
Apr 2016
May 2016
June 2016
Contract Balance Remaining
$906.8m $904.2m $898.2m
Contingency $160m $160m $160m
Change Orders (from contingency)
$9.1m $0 $0.3m
Contingency Balance Remaining
$150.9m $150.9m $150.6m
Contingency % 16.6% 16.7% 16.8%
CP1 – Contingency (millions $)
Contract Management CP1 - Contingency
Data as of: August 20, 2015
F&A Committee Meeting – September 2015

CP1 Contract Management – Schedule Performance Index
25
CP1 Schedule – Total Planned Value of Contract Earned (in millions $)
Contract Management CP1 - Schedule
0
700
600
500
400
300
200
100
$ millions
Jun 2016
$730
May 2016
$710
Apr 2016
$695
Mar 2016
$673
Feb 2016
$653
Jan 2016
$632
Dec 2015
$598
Nov 2015
$569
Oct 2015
$538
Sep 2015
$506
Aug 2015
$468
Jul 2015
$134 (31%)
$430
Jun 2015
$128 (32%)
$401
May 2015
$125 (33%)
$375
Apr 2015
$120 (35%)
$348
Mar 2015
$117 (36%)
$329
Feb 2015
$113 (37%)
$301
Jan 2015
$110 (38%)
$291
Dec 2014
$105 (41%)
$257
Oct 2014
$94 (45%)
$208
Sep 2014
$88 (48%)
$183
Aug 2014
$80 (57%)
$141
Jul 2014
$172 (37%)
(forecasted value of contract earned)
(actual value of contract earned)
Data as of: August 20, 2015
Notes: 1. No report produced in November 2014 2. Total amount earned refers to progress on the schedule, not approved contract invoices 3. The increase in the CP 1 earned value during the August pay period is primarily a result of revising the way the
Contractor is compensated for administrative overhead incurred to date
Earned Value/Invoiced to Date
Planned Value
Full contract amount: $1.032b Contract end date: March 2018
F&A Committee Meeting – September 2015

CP1 Contract Management Raw Data: Schedule Performance Index
26
End of FY 14-15
July 2015
Aug 2015
Sept 2015
Oct 2015
Nov 2015
Dec 2015
Jan 2016
Feb 2016
Mar 2016
Apr 2016
May 2016
June 2016
Earned Value/ Invoiced to Date
$127.9m $134.4m $171.5m
Planned Value $400.8m $430.3m $468.0m
Schedule Performance Index
32% 31% 37%
CP1 – Schedule (millions $)
Contract Management CP1 - Schedule
Data as of: August 20, 2015
F&A Committee Meeting – September 2015
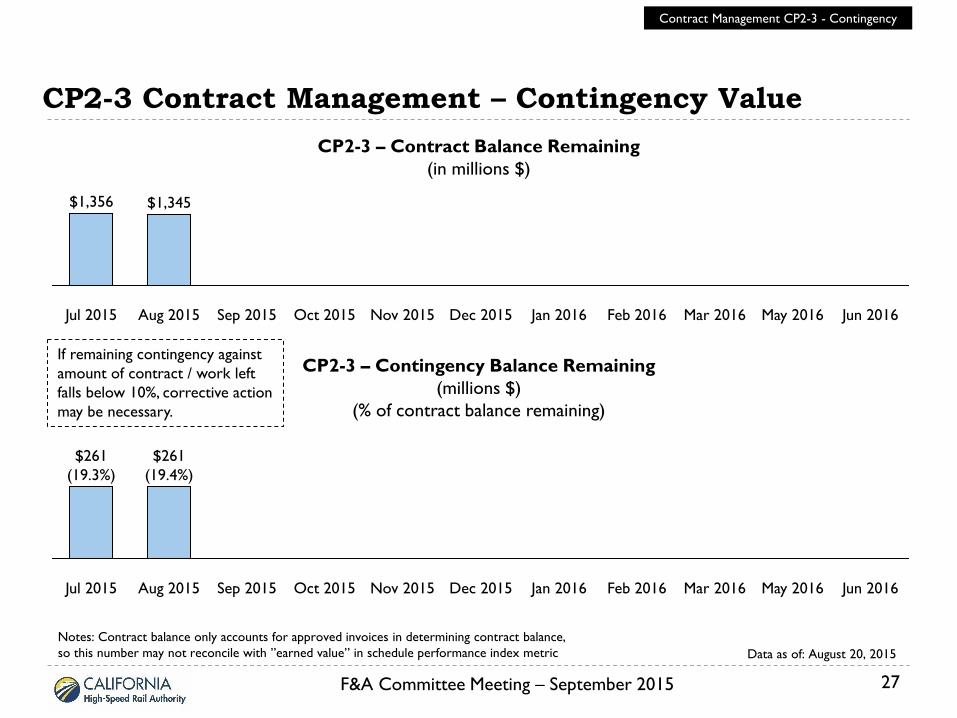
CP2-3 Contract Management – Contingency Value
27
CP2-3 – Contract Balance Remaining (in millions $)
Contract Management CP2-3 - Contingency
CP2-3 – Contingency Balance Remaining (millions $)
(% of contract balance remaining)
Jun 2016 May 2016 Mar 2016 Feb 2016 Jan 2016 Dec 2015 Nov 2015 Oct 2015 Sep 2015 Aug 2015 Jul 2015
$261 (19.3%)
$261 (19.4%)
Jun 2016 May 2016 Mar 2016 Feb 2016 Jan 2016 Dec 2015 Nov 2015 Oct 2015 Sep 2015 Aug 2015 Jul 2015
$1,356 $1,345
If remaining contingency against amount of contract / work left falls below 10%, corrective action may be necessary.
F&A Committee Meeting – September 2015
Data as of: August 20, 2015 Notes: Contract balance only accounts for approved invoices in determining contract balance, so this number may not reconcile with ”earned value” in schedule performance index metric

CP2-3 Contract Management Raw Data: Contingency Value
28
July 2015
Aug 2015
Sept 2015
Oct 2015
Nov 2015
Dec 2015
Jan 2016
Feb 2016
Mar 2016
Apr 2016
May 2016
June 2016
Contract Balance Remaining
$1,356m $1,345m
Contingency $261.2m $261.2m
Change Orders (from contingency)
$0 $0
Contingency Balance Remaining
$261.2m $261.2m
Contingency % 19.3% 19.4%
CP2-3 – Contingency (millions $)
Contract Management CP2-3 - Contingency
Data as of: August 20, 2015
F&A Committee Meeting – September 2015

CP2-3 Contract Management – Schedule Performance Index
29
CP2-3 Schedule – Total Planned Value of Contract Earned (in millions $)
Contract Management CP2-3 - Schedule
100
90
80
70
60
50
40
30
20
10
0
$ millions
Jun 2016 May 2016 Mar 2016 Feb 2016 Jan 2016 Dec 2015 Nov 2015 Oct 2015 Sep 2015 Aug 2015 Jul 2015
$38 (100%)
$38
$50
$50 (100%)
(forecasted value of contract earned) (actual value of contract earned)
Earned Value/Invoiced to Date
Planned Value
Planned value schedule still being finalized
F&A Committee Meeting – September 2015
Data as of: August 20, 2015 Notes: Total amount earned refers to progress on the schedule, not approved contract invoices

CP2-3 Contract Management Raw Data: Schedule Performance Index
30
July 2015
Aug 2015
Sept 2015
Oct 2015
Nov 2015
Dec 2015
Jan 2016
Feb 2016
Mar 2016
Apr 2016
May 2016
June 2016
Earned Value/ Invoiced to Date
$38.1m $50.4m
Planned Value $38.1m $50.4m
Schedule Performance Index
100% 100%
CP2-3 – Schedule (millions $)
Contract Management CP2-3 - Schedule
Data as of: August 20, 2015
F&A Committee Meeting – September 2015

Agenda
31
Operations Report Metrics
– Executive Summary
– ROW
– Contract Management
– Finance/Budget
– Risk
– Back-Up ROW Information
F&A Committee Meeting – September 2015

Finance/Budget Metrics – Context
32
Metrics organized by:
– Summary of current fiscal environment
– FY 2015-16 finance/budget data, which includes ROW, planning, environmental and construction
For FY 2015-16, this report presents:
– Budget expenditures: based on FCP budget
– Forecast expenditures: will adjust monthly to show trajectory, based on performance
– Actual expenditures: incorporated each month
All data shown is at the end of each month
– Numbers used reflect actual expenditures in the months they occur and include adjustments from published versions of capital outlay reports
– There is a 1-month lag to produce the F&A Capital Outlay Reports, which is the source of the data
• For example, a July Capital Outlay Report includes financial data through May
Finance/Budget
F&A Committee Meeting – September 2015

The Authority has spent 68% of FY14-15 budget, 25.9% of the federal ARRA fund and 100% of C&T fund
33
*F&A Capital Outlay Report, Sept 2015
TOTAL Planning Construction
Budget Expended Budget Expend to Date Budget Expend to Date
ARRA Grant* $2.553b $0.662b $0.322b $0.274b $2.231b $0.388b
FY10 Grant $0.928b $- $- $- $0.928b $-
PROP 1A** $2.563b $0.154b $0.192b $0.154b $2.372b $-
LOCAL $0.052b $- $0.052b $- $- $-
C&T (FY14/15 only)* $0.250b $0.250b $0.058 $0.059b $0.191b $0.191b
Total $6.347b $1.066b $0.624b $0.487b $5.722b $0.579b
Total Expenditures to Date* (as of July 2015)
*Source: F&A Capital Outlay Report, Sept 2015 – balance subject to change due to pending approval of tapered match and federal reimbursements **There is a total of $2.813b in Prop 1A appropriations, but the budgeted total excludes $250m that were supplanted by C&T funds Note: Numbers may not add due to rounding
ARRA expenditures are 25.9% of federal ARRA grant funds and 10.4% of $6.34b total budget
FY15-16 Expenditures to Date* (as of July 2015)
Total Appropriation
FY15-16 Budget
Expenditures to Date
Expenditures - % of Budget
June 30 July 31 June 30 July 31 June 30 July 31
$7.292b $0.479b $1.74b $0.328b $0.000b 68% 0%
Total appropriation includes some funding for Phase II planning and FY15/16 C&T creating a difference with the total budget above.
Finance/Budget
July expenditures have not been received as of the production of this report
F&A Committee Meeting – September 2015

0
1,800
1,600
1,400
1,200
1,000
800
600
400
200
$ millions
$27m FY14-15 Average monthly spend Jun
2016
$183
$1,743
May 2016
$162
$1,560
Apr 2016
$120
$1,397
Mar 2016
$137
$1,277
Feb 2016
$120
$1,140
Jan 2016
$123
$1,020
Dec 2015
$143
$897
Nov 2015
$158
$754
Oct 2015
$160
$597
Sep 2015
$141
$437
Aug 2015
$156
$296
July 2015
$140
Total FY 14-15
$479
$328
Finance/Budget – FY15-16 Expenditures
34
Finance/Budget – FY15-16
FY 15-16 Monthly and Cumulative Expenditures Budget, Forecast and Actual
Source: F&A Capital Outlay and Expenditure Reports (Sept 2014 – Sept 2015) Notes: Forecast data will shift each month (budget and forecasts only equal at outset of FY15-16)
• No July 2015 actual expenditures received as of the production of this report
F&A Committee Meeting – September 2015
Budget Cumulative Expenditure
Actual Cumulative Expenditures
Budget Monthly Expenditures
Actual Monthly Expenditure
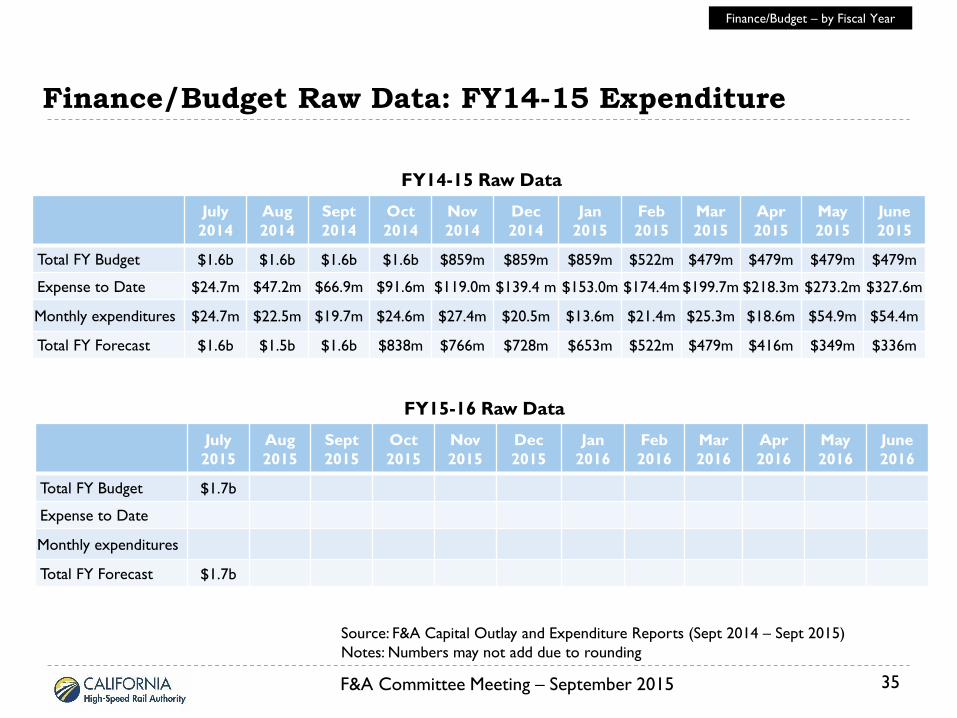
Finance/Budget Raw Data: FY14-15 Expenditure
35
July 2014
Aug 2014
Sept 2014
Oct 2014
Nov 2014
Dec 2014
Jan 2015
Feb 2015
Mar 2015
Apr 2015
May 2015
June 2015
Total FY Budget $1.6b $1.6b $1.6b $1.6b $859m $859m $859m $522m $479m $479m $479m $479m
Expense to Date $24.7m $47.2m $66.9m $91.6m $119.0m $139.4 m $153.0m $174.4m $199.7m $218.3m $273.2m $327.6m
Monthly expenditures $24.7m $22.5m $19.7m $24.6m $27.4m $20.5m $13.6m $21.4m $25.3m $18.6m $54.9m $54.4m
Total FY Forecast $1.6b $1.5b $1.6b $838m $766m $728m $653m $522m $479m $416m $349m $336m
FY14-15 Raw Data
Finance/Budget – by Fiscal Year
Source: F&A Capital Outlay and Expenditure Reports (Sept 2014 – Sept 2015) Notes: Numbers may not add due to rounding
July 2015
Aug 2015
Sept 2015
Oct 2015
Nov 2015
Dec 2015
Jan 2016
Feb 2016
Mar 2016
Apr 2016
May 2016
June 2016
Total FY Budget $1.7b
Expense to Date
Monthly expenditures
Total FY Forecast $1.7b
FY15-16 Raw Data
F&A Committee Meeting – September 2015

Agenda
36
Operations Report Metrics
– Executive Summary
– ROW
– Contract Management
– Finance/Budget
– Risk
– Back-Up ROW Information
F&A Committee Meeting – September 2015

CP1 Contract – Current Contingency Level
37
Contract Milestones CP1 Contract
Remaining Contingency
Major Change Orders Approved as of August 20, 2015
CP1 Contract NTP
$ 160.0 M
As of 20-Aug-2015 $ 150.6 M
• Class 1/2 Hazmat ($5.25M) • Scope Changes - Revised Shear Wave Boring, Weed Abatement, etc. • Env. Permit Changes, etc. • Regulatory Changes - Archaeological, Biological, Native American monitoring
($1.31M) • Ped. Arch Field Surveys • Other administrative, 3rd party, regulatory changes and additional scope items
Note: The approved change orders for CP1 includes both anticipated and unanticipated risks/uncertainty initially considered in the contract contingency analysis (Aug 2013).
Risk – CP1
F&A Committee Meeting – September 2015

CP1 Contract – Establishing Contingency Floor
38
Based on an analysis of the risks associated with CP 1, a contingency of $160 M or slightly less than 16% of the contract value, was set aside.
3% of the contract value or approximately $31 M of the contingency was reserved for potential additional costs arising at or following substantial completion. This percentage is based on FTA guidance and is intended to serve as an added layer of protection against potential unidentified (additional) costs.
Between these points, the floor is set based on FTA’s contingency targets for the amount of work outstanding at each milestone, for example, an additional 10% of contract value was reserved for potential additional cost arising between the start of construction and substantial completion, making the total required contingency at the 100% design stage to 13% of the contract value.
* Based on FTA Project and Construction Management Guidelines (July 2011)
Risk – CP1
3%
5%
3%
5%
Total contingency
$160M (16% of
contract value)
CP1 NTP
100% Design
50% Construction
Substantial Completion
F&A Committee Meeting – September 2015

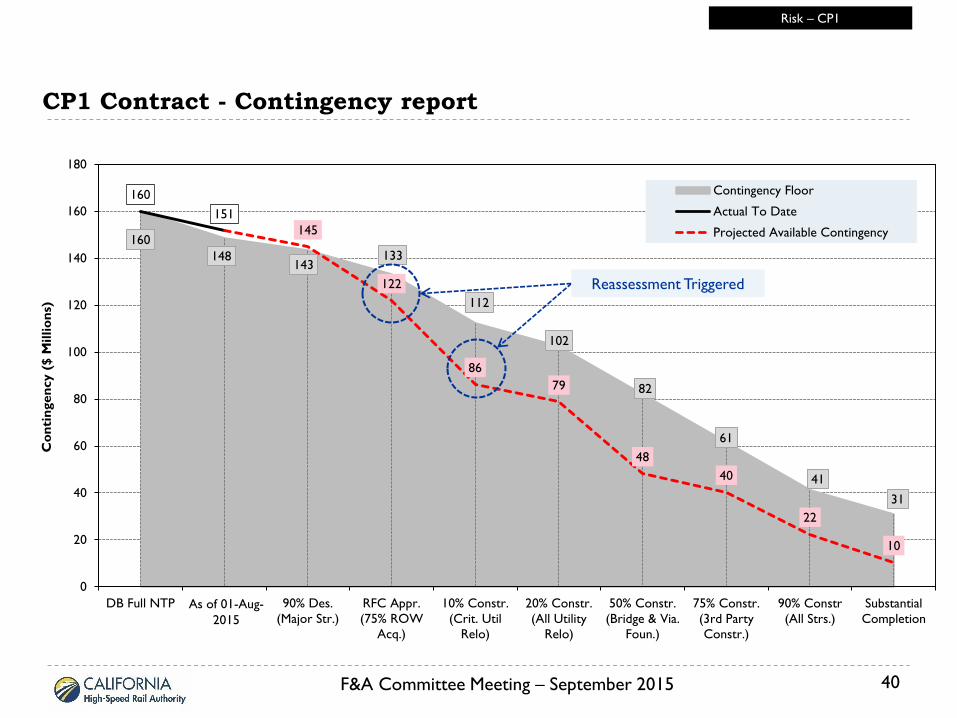
Projected Available Contingency Level at Future Milestones
39
Contract Milestones Projected Available
Contingency ($M) Potential Risks Expected to Occur at Contract Milestones
Mean Rem. Risk Exposure
($M)
As of Apr 01, 2015 151.7
90% Design 144.8 • Scope changes as per environmental requirements modifications 6.9
100% RFC Design 122.0 • Madera County Design roadway revisions (Avenues 9, 12, 13, 15 and 15.5) • Other Known scope changes incl. McKinley, GSB, etc. • City of Fresno Tier 2 requirements
22.9
10% Construction 86.2
• Delays in agreement with RR agencies (50% impact) • ROW acquisition delays (50% impact) • Delays in obtaining permits (50% impact) • SJVRR Spurs - Scope considers one spur in the vicinity of Dry Creek Canal
35.8
20% Construction 78.7 • Utility Provisional Sum • Construction contract work Prov. Sums
7.5
50% Construction 48.2 • Changed/Differing Site Conditions • Class I & II Hazmat
30.5
75% Construction 40.3 • Change or mis-representation of environmental requirements • SR99 & SR180 Interface Coordination
7.9
90% Construction 22.4 • Direct costs associated with intrusion protection 17.9
Substantial Complete 10.4 • ROW acquisition delays (50% impact) • Delays in obtaining permits (50% impact) • Delays in acquiring compensatory mitigation sites
24.1
Risk – CP1
Note: Content as of 01-Apr-2015. The projections for remaining contingency available will be reviewed and adjusted at major project milestones. This will take into account actual known impact of risks that are realized and free-up the mean impact of the risks that are avoided.
F&A Committee Meeting – September 2015
160 148
143 133
112
102
82
61
41
31
160 151
145
122
86 79
48 40
22
10
0
20
40
60
80
100
120
140
160
180
DB Full NTP As of 01-Apr-2015
90% Des.(Major Str.)
RFC Appr.(75% ROW
Acq.)
10% Constr.(Crit. Util
Relo)
20% Constr.(All Utility
Relo)
50% Constr.(Bridge & Via.
Foun.)
75% Constr.(3rd PartyConstr.)
90% Constr(All Strs.)
SubstantialCompletion
Con
ting
ency
($
Mill
ions
)
Contingency Floor
Actual To Date
Projected Available Contingency
CP1 Contract - Contingency report
40
Reassessment Triggered
Risk – CP1
F&A Committee Meeting – September 2015
As of 01-Aug-2015

CP2-3 Contract Cost Summary
41
Base Cost item Cost
CP2-3 D-B Base Cost 1,234,567,890
PG&E Allowance 160,000,000
Third Parties / Support Costs 140,000,000
Total CP2-3 Contract D-B Cost 1,534,567,890
Allocated Contingency 261,200,000
Risk – CP2-3
Note: Figures from Task 8 – Design-Build Funding Contribution Plan as of May 2015.
F&A Committee Meeting – September 2015

42
CP2-3 Contract – Establishing Contingency Floor
Based on an analysis of the risks associated with CP 2-3, a contingency of $261.2 M or slightly over 17% of the contract value (base contract plus the PG&E provision sums and third party allowance), was set aside.
3% of the contract value or approximately $46 M of the contingency was reserved for potential additional costs arising at or following substantial completion. This percentage is based on FTA guidance and is intended to serve as an added layer of protection against potential unidentified (additional) costs.
Between these points, the floor is set based on FTA’s contingency targets for the amount of work outstanding at each milestone, for example, an additional 10% of contract value was reserved for potential additional cost arising between the start of construction and substantial completion, making the total required contingency at the 100% design stage to 13% of the contract value.
* Based on FTA Project and Construction Management Guidelines (July 2011)
Risk – CP2-3
4%
5%
3%
5%
Total contingency
$261.2M (17% of
contract value)
CP2-3 NTP
100% Design
50% Construction
Substantial Completion
F&A Committee Meeting – September 2015

43
Projected Available Contingency Level at Future Milestones
Contract Milestones
Projected Available
Contingency ($M) Potential Risks Expected to Occur at Contract Milestones
P90 Risk Exposure
($M)
CP2-3 NTP 261
60% Design 253.6 • Scope changes as per Environmental requirement modifications 15.3
90% Design 233.6 • Kings County Roadway Modifications • Notice of approval of restricted drawings
20.0
100% RFC Design 202.8 • Fresno & Tulare County Roadway Modifications • SBE/DBE participation, community benefits agreement and NTHI
30.8
10% Construction 186.8
• Delays in agreement with RR agencies (20% impact) • ROW acquisition delays (20% impact); Delays in obtaining permits (20% impact) • Uncooperative Kings County delaying HSR work (20% impact) • CPUC delays (20% impact)
16.0
20% Construction 147.3 • Uncertainty in utility relocation costs; Uncertainty in canal relocation costs • Construction Water hard to find
39.5
50% Construction 125.3 • Changed/Differing Site Conditions • Class I & II Hazmat
22.0
75% Construction 79.7 • BNSF railroad intrusion protection measures (50%) 45.6
90% Construction 67.2 • Agricultural crossings at Hanford and Cross Creek necessitated by embankments. 12.5
Substantial Complete
47.2 • ROW acquisition delays (50% impact) • Delays in obtaining permits (50% impact) • Delays in acquiring compensatory mitigation sites (50% impact)
40.1
Risk – CP2-3
Note: Content as of 11-Jun-2015. The projections for remaining contingency available will be reviewed and adjusted at major project milestones. This will take into account actual known impact of risks that are realized and free-up the P90 impact of the risks that are avoided.
F&A Committee Meeting – September 2015

44
CP2-3 Contract - Contingency report
Risk – CP2-3
230
215
199
176 153
123 92
61
46
261 254
234
203
187
147 125
80
67
47
0
50
100
150
200
250
300
DB Full NTP 60% Des.(Major Str.)
90% Des.(Major Str.)
RFC Appr.(75% ROW
Acq.)
10% Constr.(Crit. Util
Relo)
20% Constr.(All Utility
Relo)
50% Constr.(Bridge & Via.
Foun.)
75% Constr.(3rd PartyConstr.)
90% Constr(All Strs.)
SubstantialCompletion
Con
ting
ency
($
Mill
ions
)
Contingency Floor
Projected Available Contingency
Reassessment Triggered
F&A Committee Meeting – September 2015

Agenda
45
Operations Report Metrics
– Executive Summary
– ROW
– Contract Management
– Finance/Budget
– Risk
– Back-Up ROW Information
F&A Committee Meeting – September 2015

ROW – CP1: Monthly Forecast Parcel Handover Rate vs Probabilistic Handover Rate based on prior 6 month’s results
46
A probabilistic distribution of monthly handover rates was specified based on monthly handovers during January – June 2015 period (below). This was then compared to the forecast handover rates of each month in a Monte Carlo simulation to determine the probability of meeting monthly and cumulative (rolling over delayed parcels to next month) targets. • Based on this analysis, the accumulated deficit of parcel delivery (iceberg)
is large and reached 108 parcels in the median case • The probability of handing over the requisite number of parcels by
December 2016 is negligible • It is projected that handover will not be complete until at least April 2017 • Analysis based purely on historic delivery. As such the additional parcels
anticipated to be delivered court Orders of Possession starting in August and ramping up are not captured due to lack of history
F&A Committee Meeting – September 2015

ROW – CP1: Projected surpluses and deficits based on prior 6 month’s handover rates (Jan – Jun 2015) Deficits are projected to be less than Pessimistic Case 90% of the time Deficits are projected to be greater than Optimistic Case 90% of the time
47
Represents simulated delivery starting July 2015, not meant to reflect total delay in delivery
Simulation based upon 6 month historical handover rate average of 17 parcels per month
Anticipated delivery rates do not account for additional parcels via Court Orders of Possession
Forecasts are being corrected to reflect realistic expectations and will be updated in next report
F&A Committee Meeting – September 2015

ROW – CP1: Probability of meeting or bettering forecast based upon 3 month’s results (March to May 2015)
48
It is projected that CP 1 will carry a deficit for much of the remaining ROW acquisition period, though the deficit is projected to diminish from Jun 16 forward and clear by the end of the handover period (Dec 2016). The accumulated deficit of parcels delivery is less significant than the 6 month analysis and reaches 58 parcels in the median case While 9 of 18 remaining months have individual forecasts that could be met by current handover rates, in 7 of these 9 handover rates are insufficient to address both the parcels due in that period and deficits accrued from previous periods
F&A Committee Meeting – September 2015

ROW – CP1: Projected surpluses and deficits end of July 2015 to end of December 2016 based upon 3 month’s results (March to May 2015) Deficits are projected to be less than Pessimistic Case 90% of the time Deficits are projected to be greater than and Surpluses are projected to be smaller than Optimistic Case 90% of the time
49
Anticipated delivery rates do not account for additional parcels via Court Orders of Possession
Forecasts are being corrected to reflect realistic expectations and will be updated in next report
Represents simulated delivery starting July 2015, not meant to reflect total delay in delivery
Simulation based upon 3 month historical handover rate average of 21 parcels per month
F&A Committee Meeting – September 2015


