

Can the revival of interest in agricultural land
produce outcomes which are sustainable or fair?
Main results of the World Bank study on land acquisition
Presentation: Harris SELOD 1
Briefing on Rural Development in Central AfricaAccess to land, the acquisition of land and rural development: new issues, new
opportunities, 27–28 September 2010

Objectives
• Report to clarify the phenomenon of large-scale land acquisition and facilitate an enlightened debate on the issues.
• Four main objectives:– To supply factual elements whereby what is happening on the ground can be more accurately
measured– To re-focus the phenomenon in respect of the determining factors in land supply and demand
while highlighting the economic, social and environmental issues (risks and opportunities) and the effects of the policies
– To move on to geographically referenced analysis of the “availability” of land which is potentially suited to agricultural production
– To identify the options for minimising risk and striving to make the most of opportunities for economic growth and poverty reduction
2

Approach
• General studies on relevant subject areas (world level)– Historical expansion of land area under cultivation and types of agriculture involved– Figures clarifying the “availability” of land (geographically referenced agricultural/ecological data)– Characteristics and determining factors regarding investment projects (press articles and
econometrics)– Possible role of multi-player initiatives to improve practices
• Country studies (Brazil, Cambodia, DRC, Ethiopia, Indonesia, Laos, Liberia, Mexico, Mozambique, Nigeria, Pakistan, Paraguay, Peru, Sudan, Ukraine, Zambia)
– Institutional context and land tenure governance (standardised diagnostic tool)– Inventories of large-scale projects based on administrative statistics over 5 years
• Study of projects (19 selected from the inventories)– Economic, social and environmental aspects
3

Plan (of the report and the discussion}
1. Increase in cultivated areas: lessons and expectations2. Do recent procedures break with the past?3. Towards a national categorisation system: establishing the connection
between allocations and strategy4. Policies and the legal and institutional framework5. Conclusion: converting challenges into opportunities
4

1. Increase in cultivated areas: lessons and expectations (1/3)
• Area cultivated world-wide: 1.5 million hectares• Growth: +2.7 million hectares/year
– Fall-off in the industrialised countries (-0.9 million hectares / year)– Fall-off in the transitional countries (-2 million hectares / year)– Growth in the developing countries (+5.5 million hectares / year):
Sub-Saharan Africa, Latin America and Asia
5

1. Increase in cultivated areas: lessons and expectations (2/3)
• Produce concerned: – Vegetable oils– Sugar cane– Rice– Maize– Forestry plantations
• The expansion of areas under cultivation is set to continue (population growth, urban sprawl) :
– At least 6 million hectares/year in the developing countries up to 2030– of which 4 million hectares will be in sub-Saharan Africa and Latin America
• Considerable gaps between observed and potential yields (yield gap)– Gaps calculated for five major crops (wheat, maize, soya, sugar cane, palm oil) – Making up these shortfalls will slow down the expansion of cultivated land
6

1. Increase in cultivated areas: lessons and expectations (3/3)
• Expansion is taking place in a variety of regional contexts and has had a range of effects• Latin America
– Deforested land in the Amazon basin subsequently not used in a productive way– Considerable technological success for soya in Brazil (profitability of acid soils and conservation work) but little effect on poverty reduction because
of mechanisation– Competitive and transparent land transfer procedures (auction) attracting investment and creating jobs (Pacific coast of Peru)
• East and South Asia– Palm oil (big increase in Indonesia with the creation of jobs but concern about the environment and social conflict associated with land tenure
rights). Possibility of reorienting expansion towards degraded zones.– Significant increase in rice growing in Thailand and Vietnam for export (small and medium producers benefiting from a clarification of
property rights and public investment in technology access)
• Africa– Production by small farmers– Fruitless attempts at large-scale agriculture (Sudan, Tanzania, Zambia)– Technology gap, weak institutions and low levels of public investment
• Eastern Europe and Central Asia– Investment in very large farming ventures (concentration) contrasting with the shrinking of areas under cultivation
7

2. Do recent procedures break with the past? (1/4)
• Revival of interest in agricultural land (as a response to agricultural produce price hikes in 2008)• According to the press: a demand of at least 42 Million Ha in less than one year, two-thirds of which
was in sub-Saharan Africa
8

2. Do recent procedures break with the past? (2/4)
9
Cumulative demand for land identified by the press and expansion of arable land and permanent crops over the past 10 years (in millions of hectares)

2. Do recent procedures break with the past? (3/4)
• What makes a country attractive (all other things being equal)– Amount of land suitable for agriculture excluding forest and zones already under cultivation– Low level of acknowledgement of rural land-ownership rights! (and poor land ownership security in
general), which highlights the need to improve land ownership governance
• The amount of interest expressed has not yet turned into reality (20% under production)
• Comparison with the national “inventories” of the projects (2005–2009)
10
Table 1. Large-scale acquisition of land in various countries
Country No. of projectsTotal area(1,000 ha)
Median size (ha)
% Nationala
Cambodia 61 958 8,985 70
Ethiopia 406 1,190 700 49
Liberia 17 1,602 59,374 7
Mozambique 405 2,670 2,225 53
Nigeria 115 793 1,500 97
Sudan 132 3,965 7,980 78
Note: The data refer to the 20042009 period except for Cambodia and Nigeria where it is the 1990-2006 period which is covered. The figures for Liberia refer to renegotiated land transfers which had been granted in the past. Source: Inventories of national projects set up for the purposes of the study.a.“% National” is the total proportion of the area allocated to national investors (as against foreign investors) and not the percentage of the number of projects.

2. Do recent procedures break with the past? (3/4)
• What makes a country attractive (all other things being equal)– Amount of land suitable for agriculture excluding forest and zones already under cultivation– Low level of acknowledgement of rural land-ownership rights! (and poor land ownership security in
general), which highlights the need to improve land ownership governance
• The amount of interest expressed has not yet turned into reality (20% under production)
• Comparison with the national “inventories” of the projects(2005–2009)
11
Table 1. Large-scale acquisition of land in various countries
Country No. of projectsTotal area(1,000 ha)
Median size (ha)
% Nationala
Cambodia 61 958 8 985 70
Ethiopia 406 1 190 700 49
Liberia 17 1 602 59 374 7
Mozambique 405 2 670 2 225 53
Nigeria 115 793 1 500 97
Sudan 132 3 965 7 980 78
Note: The data refer to the 2004-2009 period except for Cambodia and Nigeria where it is the 1990-2006 period which is covered. The figures for Liberia refer to renegotiated land transfers which had been granted in the past. Source: Inventories of national projects set up for the purposes of the study.a.“% National ” is the total proportion of the area allocated to national investors (as against foreign investors) and not the percentage of the number of projects.
2. Do recent procedures break with the past? (4/4)
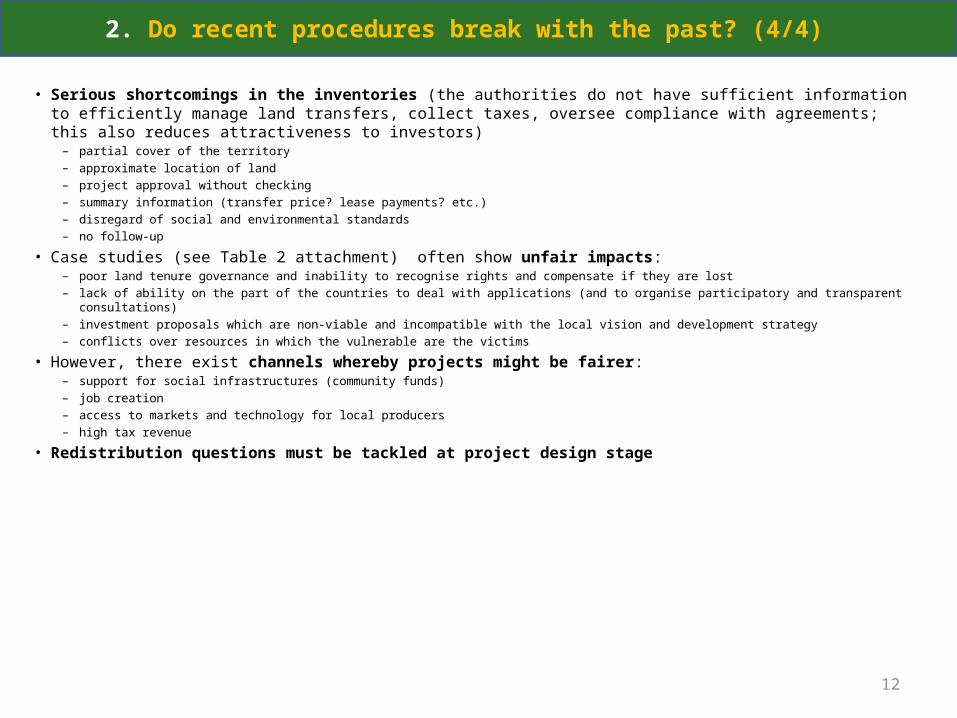
• Serious shortcomings in the inventories (the authorities do not have sufficient information to efficiently manage land transfers, collect taxes, oversee compliance with agreements; this also reduces attractiveness to investors)
– partial cover of the territory– approximate location of land– project approval without checking– summary information (transfer price? lease payments? etc.)– disregard of social and environmental standards– no follow-up
• Case studies (see Table 2 attachment) often show unfair impacts:– poor land tenure governance and inability to recognise rights and compensate if they are lost– lack of ability on the part of the countries to deal with applications (and to organise participatory and transparent consultations)– investment proposals which are non-viable and incompatible with the local vision and development strategy– conflicts over resources in which the vulnerable are the victims
• However, there exist channels whereby projects might be fairer:– support for social infrastructures (community funds)– job creation– access to markets and technology for local producers– high tax revenue
• Redistribution questions must be tackled at project design stage
12

3. Towards a national categorisation system: making the connection between allocations and strategy (1/6)
• Clarify strategic choices in terms of development (investments, agricultural models, land use planning, etc.)
• Important element: balance the demand for land with information about potential land– participatory planning– measures to protect land tenure rights and to train local populations– estimation of the land value (assess alternative options; negotiate more carefully)
• Defining criteria for the measurement of potentially available land:– land suitable for agricultural use (agricultural/ecological data; 5 main crops; rain-dependent farming)– land identified as non-cultivated– excluding forests– excluding protected zones– with low population densities
< 25 persons / km2: 445 million hectares
< 10 persons / km2: 305 million hectares
• Definitions as precise as possible (analysis at country level)– cross reference mapping with ownership rights (e.g.: rural community land)– exclusion from war zones
13

3. Towards a national categorisation system: making the connection between allocations and strategy (2/6)
• Preponderance of Africa and Latin America
• Concentration in 10 pays of which 5 are in Africa (Sudan, DRC, Mozambique, Madagascar, Chad and Zambia)
• In Africa 53% of the land is over 6 hours away from a market (24% in Latin America)
14

3. Towards a national categorisation system: making the connection between allocations and strategy (4/6)
• Category of the country according to two factors:– “relative” availability of land (ratio of available land / cultivated land )– “yield gap” between actual and potential yield (margin for improvement in yield)
• Useful information for deciding on development options
Potential availability of land for agricultural purposes and margin for improving yield
15
CHN
MYS
PHL
VNM
EGY
JOR
INDPAKHUN
KAZ
LTUPOL
ROM RUS
SVN
TKMUKR
ARGBRA
CHL COL
SLV
GUY
MEX
PER
URY
AGOBEN
BDI
COGZAR
GHAMWI
MOZ
NGA
RWA
SDN
TZAZMB
Type 1 Type 2
Type 3 Type 4
.2.4
.6.8
1
Yie
ld G
ap
-10 -5 0 5Suitable relative to cultivated area (in logarithms)
Difference
in
yield
Ratio of land available for agriculture/cultivated land (as a logarithm)

3. Towards a national categorisation system: making the connection between allocations and strategy (4/6)
• Category of the country according to two factors:– “relative” availability of land (ratio of available land / cultivated land )– “yield gap” between actual and potential yield (margin for improvement in yield)
• Useful information for deciding on development options
Potential availability of land for agricultural purposes and margin for improving yield
Africa = Types 3 and 4: low yields (only 20-30% of potential) and availability or otherwise of land
16
CHN
MYS
PHL
VNM
EGY
JOR
INDPAKHUN
KAZ
LTUPOL
ROM RUS
SVN
TKMUKR
ARGBRA
CHL COL
SLV
GUY
MEX
PER
URY
AGOBEN
BDI
COGZAR
GHAMWI
MOZ
NGA
RWA
SDN
TZAZMB
Type 1 Type 2
Type 3 Type 4
.2.4
.6.8
1
Yie
ld G
ap
-10 -5 0 5Suitable relative to cultivated area (in logarithms)
Difference
in
yield
Ratio of land available for agriculture/cultivated land (as a logarithm)
3. Towards a national categorisation system: making the connection between allocations and strategy (5/6)
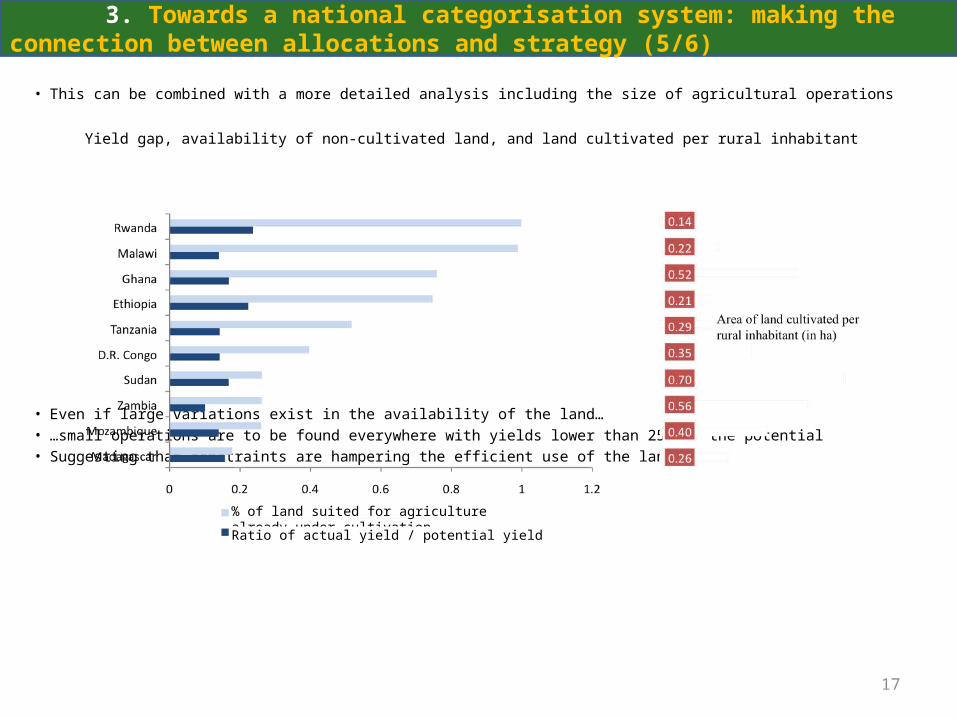
• This can be combined with a more detailed analysis including the size of agricultural operations
Yield gap, availability of non-cultivated land, and land cultivated per rural inhabitant
• Even if large variations exist in the availability of the land…• …small operations are to be found everywhere with yields lower than 25% of the potential• Suggesting that constraints are hampering the efficient use of the land
17
% of land suited for agriculture already under cultivation
Ratio of actual yield / potential yield

3. Towards a national categorisation system: making the connection between allocations and strategy (6/6)
• The case of countries with large areas of land and small, low yield, farmers• Development choice:
– intensification or expansion of land under cultivation? – the constraints on productivity must be fathomed and solutions found (in the case of some production
situations, overcoming the productivity gap might increase production more successfully than making the available land profitable)
• What kind of development will suit the agricultural sector?– the development of a medium-scale agriculture coexisting with the small farmers? (if the labour supply is
limiting the small farmers’ operations, productivity might be increased by mechanisation)– dual structure with mega-farms and a large number of smallholders?
• Role of the public sector– infrastructures– institutional framework– information about economic models
18

4. Policy and the legal and institutional framework (1/2)
• Considerable variations between countries in five large areas. Main lessons:• Recognising rights
– defining, recognising and identifying individual and collective land tenure rights on the ground, without eliminating secondary rights, to guarantee land tenure security and to encourage investments over the long term
– inexpensive participatory tools exist (Mexico, Ethiopia, Vietnam)
• Voluntary transfers– informed and voluntary consent and not expropriation– provide information about rights, the value of the land, contractual options, negotiating with investors– fair return: direct participation, cash transfers (including rent), community funds for public services
• Transparency– public information on opportunities (potential of the land, technical parameters), transfers undertaken
(prices, contracts, rights, land use), and economic, social and environmental impacts
19

4. Policy and the legal and institutional framework (2/2)
• Technical and economic viability – mechanisms to guarantee the viability of projects and consistency with the organisation of the territory
(in the context of national and local strategies)– identify desirable investments (zones, crops) with regard to allocations and the mapping of land tenure rights– competitive selection/approval procedures for investments with prior commitments regarding the capital
invested and jobs created– only allocate in respect of incentives which are transparently supported– improve the ability of the public sector to tackle these questions
• Social and environmental sustainability– avoid negative externalities (and factor them into the actual design of the project)– regulatory framework for the protection of the zones and rights of at-risk populations– ex ante assessment of environmental and social impacts – definition of environmental standards, monitoring and recourse in case of non-compliance
20

5. Conclusion: converting issues into opportunities (1/2)
• Lessons– Problems concerned with eviction, non-viable projects (subsidised), negative environmental and social externalities, encroachment on non-transferred
land, etc.– The contribution of private investors does not automatically imply the acquisition of the land – A long-term strategy may make for a better use of existing allocations– The lack of information on the part of the players prevents the available options from being explored– There is a need for investment in technology, infrastructures, access to markets, and the strengthening of institutions
• Governments can– Identify the strategic priorities (How can productivity achieve its potential? Will large-scale investments assist development?)– Identify the public infrastructures or technological investments required in the process of participatory land use planning and educate the players– It is essential to improve land tenure governance whatever option is chosen (identification of the land, transfer procedures, information about land
tenure rights, conflict resolution)– If large-scale investments are envisaged, powers regarding the following must be upgraded
• effective consultation• coordination between agencies and impact assessment• terms and conditions in existence for the acquisition of land• recording of relevant information• technical examination and screening
21

5. Conclusion: converting issues into opportunities (2/2)
• The investors can– Abide by basic principles: extend their participation and the cover of the existing initiatives (which can then be converted into
legislation)– Adopt effective information mechanisms including third-party checks
• Civil society and the local authorities can – Raise the awareness of the communities to the exercise of their rights– Help in the design of the projects, negotiations with the investors, implementation and monitoring– Undertake critical examination of the projects supporting the development of national strategies
• The international organisations can– Help to incorporate information and analyses into national strategies– Offer technical and financial support to strengthen powers– Work for the convergence of the various players and the principles which may be implemented and monitored– Provide information and best practices and support multi-player initiatives which could facilitate monitoring and the sharing
of experience
22


