

B E L G I A N C A N C E R R E G I S T R Y
Belg
ium
200
4-20
08
Brus
sels
-Cap
ital R
egio
n 20
04-2
008
Wal
loon
Reg
ion
2004
-200
8
Flem
ish
Regi
on 19
99-2
008
Cancer Survival in Belgium


Belg
ium
200
4-20
08
Brus
sels
-Cap
ital R
egio
n 20
04-2
008
Wal
loon
Reg
ion
2004
-200
8
Flem
ish
Regi
on 19
99-2
008
Cancer Survival in Belgium

© 2012 Belgian Cancer RegistryStichting Kankerregister - Fondation Registre du Cancer - Stiftung Krebsregister
Staff at the Cancer Registry:Julie Francart, Cindy De Gendt, Jessica Vandeven, Marielle Adam, Viki Schillemans, Francesco Giusti, Tamara Vandendael, David Jegou, Mia Slabbaert, Martine Verstreken, Greet Pieters, Linda Thibaut, Frédéric Calay, Marie-José Hoovelts, Sophie Petit, Emilie Vandeghinste, Christel Vervoort, Annelies Goossens, Nico Van Hecke, Jérôme Xicluna, Linda Picalausa, Annemie Haelens, Caroline Androgé, Maaike Goekint, Lynn Huyck, Céline Degaillier, Eva Van der Stock, Nancy Van Damme, Joke Werbrouck, Sofie Pardon, Marijke Vanspauwen, Jeroen Eeckhaut, Kris Henau, Karen Vos, Amandine Vercauteren, Katia Emmerechts, Liesbet Van Eycken
Editorial team:Harlinde De Schutter, Marielle Adam, Francesco Giusti, Viki Schillemans, Cindy De Gendt, David Jegou, Kris Henau, Julie Francart, Katia Emmerechts, Liesbet Van Eycken
Responsible editor:Liesbet Van Eycken, Koningsstraat 215, 1210 Brussel
Design:Echo Design, www.echodesign.be
D/2012/11.846/1
Use of data:The information in this publication may be used freely on condition of correct quotation of the source and reference.
Recommended reference:Cancer Survival in Belgium, Belgian Cancer Registry, Brussels 2012
Additional information can be requested at:Tel. 0032-2-250 10 10Fax 0032-2-250 10 11email: [email protected] [email protected]
With the financial support of:
Acknowledgements:It is with pleasure that we underline our appreciation for all the registration work of the physicians, the pathologists and the data managers in the hospitals. We are grateful for a fruitful collaboration with the IMA-AIM, KCE and the Cancer Centre.We especially thank for this publication the Kruispuntbank Sociale Zekerheid – Banque Carrefour de la Sécurité Sociale, Sectoraal Comité van de Sociale Zekerheid en van de Gezondheid, afdeling Gezondheid - Comité Sectoriel de la Sécurité Sociale et de la Santé, section Santé and eHealth for their esteemed collaboration and advise on confidentiality and privacy issues.

fo
re
wo
rd
Be
lg
ian
Ca
nC
er
re
gis
tr
y
5
Foreword
The Belgian Cancer Registry, founded in 2005, progressively achieves more results on population based cancer statistics.
Data on cancer incidence are available for Belgium from 2004 on and for the Flemish Region from 1999 onwards. We
gradually obtain more insight into cancer incidence trends and geographic variation in Belgium for recent years thanks to
sustained registration efforts.
The analysis of survival data is a logical next step. The current publication gives a detailed overview of cancer survival
results in Belgium, the Walloon Region, the Brussels-Capital Region (5-year survival estimates) and in the Flemish Region
(10-year survival estimates). It is well known that survival rates differ strongly depending on the type of cancer, tumour
stage and age at diagnosis. This is illustrated in the different chapters in our booklet.
Cancer survival is an emotionally charged expression for individuals and results can be very confronting for patients.
However, the figures should be shown because of their relevance in different contexts. The data are used for the
evaluation of treatment regimens and the quality of cancer care. For some tumour types, survival results show the progress
made or indicate the difficulties encountered to improve the patients prognosis over time. Our results are hopeful and
more patients do survive cancer. The growing cancer prevalence and the ageing of our population should therefore be
taken into account when planning health care services. Cancer survivorship invites us more and more to listen carefully to
the patient’s voice and integrate quality of life aspects in clinical and population based research.
We hope that the increasing availability of information encourages the clinicians, researchers, authorities and others
concerned to make optimal use of the data.
Liesbet Van Eycken
Director

Ca
nC
er
su
rv
iva
l i
n b
el
giu
mb
el
gia
n C
an
Ce
r r
eg
ist
ry
6
Table of contents
FoREwoRD 5
TAblE oF ConTEnTS 6
liST oF TAblES 8
liST oF FigURES 11
1 i inTRoDUCTion i 15
1.1 The Belgian Cancer Registry 15
1.2 Population and Region 16
1.3 Data collection 17
– Notification and submission to the registry 17
– Quality control and data linkage 17
– Exclusion criteria 17
– Quality of the cancer registry data 17
2 i METhoDology i 18
2.1 Data selection 18
– General selection criteria 18
– Additional criteria for particular tumour sites 19
2.2 Calculation of survival 20
– Censoring 20
– Observed survival 20
– Median Survival 20
– Relative Survival 20
– Age-standardisation 20
– Software 20
2.3 Presentation of results 21
– General results (chapter 3) 21
– Results per tumour type (chapters 4 to 13) 21
3 i gEnERAl SURvivAl RESUlTS i 24
3.1 All Tumours (ICD-10: C00-C43, C45-C96) 24
3.2 Summary of results 26
4 i hEAD AnD nECk (iCD-10: C00-C14, C30-C32) i 30
5 i DigESTivE TRACT i 35

ta
Bl
e o
f C
on
te
nt
sB
el
gia
n C
an
Ce
r r
eg
ist
ry
7
5.1 Oesophagus (ICD-10: C15-C16.0) 35
5.2 Stomach (ICD-10: C16.1-9) 38
5.3 Colon and rectum (ICD-10: C18-C20) 41
5.4 Liver (ICD-10: C22) 46
5.5 Gallbladder and biliary tract (ICD-10: C23-C24) 49
5.6 Pancreas (ICD-10: C25) 52
6 i RESpiRAToRy TRACT i 55
6.1 Lung (ICD-10: C34) 55
6.2 Mesothelioma (ICD-10: C45) 58
7 i MAlignAnT MElAnoMA oF Skin (iCD-10: C43) i 61
8 i bREAST (iCD-10:C50) i 64
9 i FEMAlE gEniTAl oRgAnS i 67
9.1 Gynaecological tumours: summary 67
9.2 Cervix (ICD-10: C53) 68
9.3 Corpus uteri (ICD-10: C54) 70
9.4 Ovary (ICD10: C56) 73
10 i MAlE gEniTAl oRgAnS i 75
10.1 Prostate (ICD-10: C61) 75
10.2 Testis (ICD-10: C62) 77
11 i URinARy TRACT i 79
11.1 Kidney (ICD-10: C64) 79
11.2 Bladder (ICD-10: C67) 81
12 i CEnTRAl nERvoUS SySTEM (iCD-10: C71-C72) i 83
13 i ThyRoiD (iCD-10: C73) i 86
AppEnDiCES 89Appendix 1 – Overview by ICD-10: observed and relative survival 89
Appendix 2 – Overview by tumour group analysed: number of deaths, crude and age-standardised 5-year
relative survival, Belgium (2004-2008) 101
Appendix 3 – Details on analyses by sublocalisation and morphology 103
– Analyses by localisation and sublocalisation 103
– Analyses by morphology 104
REFEREnCE liST 106

Ca
nC
er
su
rv
iva
l i
n b
el
giu
mb
el
gia
n C
an
Ce
r r
eg
ist
ry
8
List of tables
table 1 - Financial contributors to the Belgian Cancer Registry 15
table 2 - Overview of the subgroup analyses by tumour primary site 22
table 3 - Availability of information on tumour stage (clinical, pathological and combined), Belgium 2004-2008 23
table 4 - All tumours: observed and relative survival by sex in Belgium (2004-2008) and in the Flemish Region (1999-2008) 24
table 5 - All tumours: relative survival by region and sex (2004-2008) 25
table 6 - Head and neck cancer: observed and relative survival by sex in Belgium (2004-2008) and in the Flemish Region (1999-2008) 30
table 7 - Head and neck cancer: relative survival by region and sex (Belgium, 2004-2008) 32
table 8 - Head and neck cancer: relative survival by clinical stage and sex (Belgium, 2004-2008) 32
table 9 - Head and neck cancer: relative survival by sublocalisation and sex (Belgium, 2004-2008) 33
table 10 - Oropharyngeal cancer: relative survival by clinical stage and sex (Belgium, 2004-2008) 34
table 11 - Oesophageal cancer: observed and relative survival by sex in Belgium (2004-2008) and in the Flemish Region (1999-2008) 35
table 12 - Oesophageal cancer: relative survival by region and sex (2004-2008) 36
table 13 - Oesophageal cancer: relative survival by stage and sex (Belgium, 2004-2008) 36
table 14 - Stomach cancer: observed and relative survival by sex in Belgium (2004-2008) and in the Flemish Region (1999-2008) 39
table 15 - Stomach cancer: relative survival by region and sex (2004-2008) 39
table 16 - Stomach cancer: relative survival by stage and sex (Belgium, 2004-2008) 39
table 17 - Colon cancer: observed and relative survival by sex in Belgium (2004-2008) and in the Flemish Region (1999-2008) 42
table 18 - Colon cancer: relative survival by region and sex (2004-2008) 42
table 19 - Rectal cancer: observed and relative survival by sex in Belgium (2004-2008) and in the Flemish Region (1999-2008) 44
table 20 - Rectal cancer: relative survival by region and sex (2004-2008) 44
table 21 - Liver cancer: observed and relative survival by sex in Belgium (2004-2008) and in the Flemish Region (1999-2008) 47
table 23 - Liver cancer: relative survival by region and sex (2004-2008) 48
table 24 - Liver cancer: relative survival by age group and sex (Belgium, 2004-2008) 48
table 25 - Cancer of the gallbladder and biliary tract: observed and relative survival by sex in Belgium (2004-2008) and in the Flemish Region (1999-2008) 49
table 26 - Cancer of the gallbladder and biliary tract: relative survival by region and sex (2004-2008) 51

lis
t o
f t
aB
le
sB
el
gia
n C
an
Ce
r r
eg
ist
ry
9
table 27 - Pancreatic cancer: observed and relative survival by sex in Belgium (2004-2008) and in the Flemish Region (1999-2008) 52
table 28 - Pancreatic cancer: relative survival by region and sex (2004-2008) 52
table 29 - Pancreatic cancer: relative survival by age group and sex (Belgium, 2004-2008) 52
table 30 - Pancreatic cancer: relative survival by morphology and sex (Belgium, 2004-2008) 54
table 31 - Lung cancer: observed and relative survival by sex in Belgium (2004-2008) and in the Flemish Region (1999-2008) 55
table 32 - Lung cancer: relative survival by region and sex (2004-2008) 56
table 33 - Lung cancer: relative survival by morphology and sex (Belgium, 2004-2008) 56
table 34 - Mesothelioma: observed and relative survival by sex in Belgium (2004-2008) and in the Flemish Region (1999-2008) 58
table 35 - Mesothelioma: relative survival by region and sex (2004-2008) 58
table 36 - Mesothelioma: relative survival by stage and sex (Belgium, 2004-2008) 60
table 37 - Malignant melanoma of skin: observed and relative survival by sex in Belgium (2004-2008) and in the Flemish Region (1999-2008) 61
table 38 - Malignant melanoma of skin: relative survival by region and sex (Belgium, 2004-2008) 62
table 39 - Malignant melanoma of skin: relative survival by stage and sex (Belgium, 2004-2008) 62
table 40 - Malignant melanoma of skin: relative survival by sublocalisation and sex (Belgium, 2004-2008) 62
table 41 - Breast cancer: observed and relative survival in Belgium (2004-2008) and in the Flemish Region (1999-2008) 65
table 42 - Breast cancer: relative survival by region in females (2004-2008) 66
table 43 - Breast cancer: relative survival by age group in females (Belgium, 2004-2008) 66
table 44 - Gynaecological invasive tumours: incidence and mortality (2008) and 5-year relative survival in Belgium (2004-2008) 67
table 45 - Cervical cancer (invasive): observed and relative survival in Belgium (2004-2008) and in the Flemish Region (1999-2008) 68
table 46 - Cervical cancer (invasive): relative survival by region (2004-2008) 69
table 47 - Corpus uteri cancer: observed and relative survival in Belgium (2004-2008) and in the Flemish Region (1999-2008) 70
table 48 - Corpus uteri cancer: relative survival by region (2004-2008) 70
table 49 - Corpus uteri cancer: relative survival by age group (Belgium, 2004-2008) 70
table 50 - Corpus uteri cancer: relative survival by histopathological grade within carcinoma (Belgium, 2004-2008) 70
table 51 - Ovarian cancer (invasive): observed and relative survival in Belgium (2004-2008) and in the Flemish Region (1999-2008) 73
table 52 - Ovarian cancer (invasive): relative survival by region (2004-2008) 73
table 53 - Ovarian cancer (invasive): relative survival by morphology (Belgium, 2004-2008) 74
table 54 - Prostate cancer: observed and relative survival in Belgium (2004-2008) and in the Flemish Region (1999-2008) 75

Ca
nC
er
su
rv
iva
l i
n b
el
giu
mb
el
gia
n C
an
Ce
r r
eg
ist
ry
1 0
table 55 - Prostate cancer: relative survival by region (2004-2008) 76
table 56 - Prostate cancer: relative survival by age group (Belgium, 2004-2008) 76
table 57 - Testicular cancer: observed and relative survival in Belgium (2004-2008) and in the Flemish Region (1999-2008) 78
table 58 - Testicular cancer: relative survival by region (2004-2008) 78
table 59 - Testicular cancer: relative survival by age group (Belgium, 2004-2008) 78
table 60 - Testicular cancer: relative survival by morphology (Belgium, 2004-2008) 78
table 61 - Kidney cancer: observed and relative survival by sex in Belgium (2004-2008) and in the Flemish Region (1999-2008) 80
table 62 - Kidney cancer: relative survival by region and sex (2004-2008) 80
table 63 - Bladder cancer (invasive): observed and relative survival by sex in Belgium (2004-2008) and in the Flemish Region (1999-2008) 81
table 64 - Bladder cancer (invasive): relative survival by region and sex (2004-2008) 82
table 65 - Bladder cancer (invasive): relative survival by age group and sex (Belgium, 2004-2008) 82
table 66 - Tumours of the central nervous system: observed and relative survival by sex in Belgium (2004-2008) and in the Flemish Region (1999-2008) 83
table 67 - Tumours of the central nervous system: relative survival by region and sex (2004-2008) 83
table 68 - Tumours of the central nervous system: relative survival by age group and sex (Belgium, 2004-2008) 83
table 69 - Tumours of the central nervous system: relative survival by morphology and sex (Belgium, 2004-2008) 84
table 70 - Thyroid cancer: observed and relative survival by sex in Belgium (2004-2008) and in the Flemish Region (1999-2008) 86
table 71 - Thyroid cancer: relative survival by region and sex (2004-2008) 87
table 72 - Thyroid cancer: relative survival by stage and sex (Belgium, 2004-2008) 87
table 73 - Thyroid cancer: relative survival by morphology and sex (Belgium, 2004-2008) 88
table 74 - Overview by ICD-10: observed and relative survival in males, Belgium (2004-2008) 89
table 75 - Overview by ICD-10: observed and relative survival in females, Belgium (2004-2008) 92
table 76 - Overview by ICD-10: observed and relative survival in males, Flemish Region (1999-2008) 95
table 77 - Overview by ICD-10: observed and relative survival in Females, Flemish Region (1999-2008) 98
table 78 - Overview by tumour group studied: age-standardised relative survival in males, Belgium (2004-2008) 101
table 79 - Overview by tumour group studied: age-standardised relative survival in females, Belgium (2004-2008) 102

List of figures
figure 1 - Belgium 16
figure 2 - Age structure of the Belgian population (2008) [5] 16
figure 3 - General selection flowchart 18
figure 4 - All tumours: 5-year relative survival by sex (Belgium, 2004-2008) 25
figure 5 - All tumours: 10-year relative survival by sex (Flemish Region, 1999-2008) 25
figure 6 - All tumours: 5-year relative survival by age group in males (Belgium, 2004-2008) 25
figure 7 - All tumours: 5-year relative survival by age group in females (Belgium 2004-2008) 25
figure 8 - 5-year relative survival (2004-2008) by age-standardised incidence (2008) in Belgium, males 26
figure 9 - 5-year relative survival (2004-2008) by age-standardised incidence (2008) in Belgium, females 27
figure 10 - Tumours with the highest 5-year relative survival by sex (Belgium, 2004-2008) 28
figure 11 - Tumours with the lowest 5-year relative survival by sex (Belgium, 2004-2008) 28
figure 12 - 5-year relative survival point estimates and 95% confidence intervals by tumour site in males (Belgium 2004-2008) 29
figure 13 - 5-year relative survival point estimates and 95% confidence intervals by tumour site in females (Belgium 2004-2008) 29
figure 14 - Head and neck cancer: relative survival by sex in Belgium (2004-2008) 31
figure 15 - Head and neck cancer: relative survival by sex in the Flemish Region (1999-2008) 31
figure 16 - Head and neck cancer: relative survival by age group in males (Belgium, 2004-2008) 31
figure 17 - Head and neck cancer: relative survival by age group in females (Belgium, 2004-2008) 31
figure 18 - Head and neck cancer (clinical stage IV): relative survival by substage in males (Belgium, 2004-2008) 31
figure 19 - Head and neck cancer (clinical stage IV): relative survival by substage in females (Belgium, 2004-2008) 31
figure 20 - Oesophageal cancer: relative survival by sex in Belgium (2004-2008) 37
figure 21 - Oesophageal cancer: relative survival by sex in the Flemish Region (1999-2008) 37
figure 22 - Oesophageal cancer: relative survival by age group in males (Belgium, 2004-2008) 37
figure 23 - Oesophageal cancer: relative survival by age group in females (Belgium, 2004-2008) 37
figure 24 - Oesophageal cancer: relative survival by morphology in males (Belgium, 2004-2008) 37
figure 25 - Oesophageal cancer: relative survival by morphology in females (Belgium, 2004-2008) 37
figure 26 - Stomach cancer: relative survival by sex in Belgium (2004-2008) 38
figure 27 - Stomach cancer: relative survival by sex in the Flemish Region (1999-2008) 38
figure 28 - Stomach cancer: relative survival by age group in males (Belgium, 2004-2008) 38
figure 29 - Stomach cancer: relative survival by age group in females (Belgium, 2004-2008) 38
lis
t o
f f
igu
re
sB
el
gia
n C
an
Ce
r r
eg
ist
ry
1 1

Ca
nC
er
su
rv
iva
l i
n b
el
giu
mb
el
gia
n C
an
Ce
r r
eg
ist
ry
1 2
figure 30 - Stomach cancer: relative survival by morphology in males (Belgium, 2004-2008) 40
figure 31 - Stomach cancer: relative survival by morphology in females (Belgium, 2004-2008) 40
figure 32 - Colon cancer: relative survival by sex in Belgium (2004-2008) 41
figure 33 - Colon cancer: relative survival by sex in the Flemish Region (1999-2008) 41
figure 34 - Colon cancer: relative survival by age group in males (Belgium, 2004-2008) 43
figure 35 - Colon cancer: relative survival by age group in females (Belgium, 2004-2008) 43
figure 36 - Colon cancer: relative survival by clinical stage in males (Belgium, 2004-2008) 43
figure 37 - Colon cancer: relative survival by clinical stage in females (Belgium, 2004-2008) 43
figure 38 - Colon cancer: 5-year relative survival by pathological stage in males (Belgium, 2004-2008) 43
figure 39 - Colon cancer: 5-year relative survival by pathological stage in females (Belgium, 2004-2008) 43
figure 40 - Rectal cancer: relative survival by sex in Belgium (2004-2008) 44
figure 41 - Rectal cancer: relative survival by sex in the Flemish Region (1999-2008) 44
figure 42 - Rectal cancer: relative survival by age group in males (Belgium, 2004-2008) 45
figure 43 - Rectal cancer: relative survival by age group in females (Belgium, 2004-2008) 45
figure 44 - Rectal cancer: relative survival by pathological stage in males (Belgium, 2004-2008) 45
figure 45 - Rectal cancer: relative survival by pathological stage in females (Belgium, 2004-2008) 45
figure 46 - Rectal cancer: relative survival by clinical stage in males (Belgium, 2004-2008) 45
figure 47 - Rectal cancer: relative survival by clinical stage in females (Belgium, 2004-2008) 45
figure 48 - Liver cancer: relative survival by sex in Belgium (2004-2008) 46
figure 49 - Liver cancer: relative survival by sex in the Flemish Region (1999-2008) 46
figure 50 - Liver cancer: relative survival by stage in males (Belgium, 2004-2008) 46
figure 51 - Liver cancer: relative survival by stage in females (Belgium, 2004-2008) 47
figure 52 - Liver cancer: relative survival by morphology in males (Belgium, 2004-2008) 47
figure 53 - Liver cancer: relative survival by morphology in females (Belgium, 2004-2008) 47
figure 54 - Cancer of the gallbladder and biliary tract: relative survival by sex in Belgium (2004-2008) 50
figure 55 - Cancer of the gallbladder and biliary tract: relative survival by sex in the Flemish Region (1999-2008) 50
figure 56 - Cancer of the gallbladder and biliary tract: relative survival by age group in males (Belgium, 2004-2008) 50
figure 57 - Cancer of the gallbladder and biliary tract: relative survival by age group in females (Belgium, 2004-2008) 50
figure 58 - Cancer of the gallbladder and biliary tract: relative survival by stage in males (Belgium, 2004-2008) 50
figure 59 - Cancer of the gallbladder and biliary tract: relative survival by stage in females (Belgium, 2004-2008) 50
figure 60 - Cancer of the gallbladder and biliary tract: relative survival by sublocalisation in males (Belgium, 2004-2008) 51
figure 61 - Cancer of the gallbladder and biliary tract: relative survival by sublocalisation in females (Belgium, 2004-2008) 51
figure 62 - Pancreatic cancer: relative survival by sex in Belgium (2004-2008) 53

figure 63 - Pancreatic cancer: relative survival by sex in the Flemish Region (1999-2008) 53
figure 64 - Pancreatic cancer: relative survival by stage in males (Belgium, 2004-2008) 53
figure 65 - Pancreatic cancer: relative survival by stage in females (Belgium, 2004-2008) 53
figure 66 - Lung cancer: relative survival by sex in Belgium (2004-2008) 57
figure 67 - Lung cancer: relative survival by sex in the Flemish Region (1999-2008) 57
figure 68 - Lung cancer: relative survival by age group in males (Belgium, 2004-2008) 57
figure 69 - Lung cancer: relative survival by age group in females (Belgium, 2004-2008) 57
figure 70 - Lung cancer: relative survival by stage in males (Belgium, 2004-2008) 57
figure 71 - Lung cancer: relative survival by stage in females (Belgium, 2004-2008) 57
figure 72 - Mesothelioma: relative survival by sex in Belgium (2004-2008) 59
figure 73 - Mesothelioma: relative survival by sex in the Flemish Region (1999-2008) 59
figure 74 - Mesothelioma: relative survival by age group in males (Belgium, 2004-2008) 59
figure 75 - Mesothelioma: relative survival by age group in females (Belgium, 2004-2008) 59
figure 76 - Mesothelioma: relative survival by morphology in males (Belgium, 2004-2008) 59
figure 77 - Mesothelioma: relative survival by morphology in females (Belgium, 2004-2008) 59
figure 78 - Malignant melanoma of skin: relative survival by sex in Belgium (2004-2008) 63
figure 79 - Malignant melanoma of skin: relative survival by sex in the Flemish Region (1999-2008) 63
figure 80 - Malignant melanoma of skin: 5-year relative survival by age group in males (Belgium, 2004-2008) 63
figure 81 - Malignant melanoma of skin: relative survival by age group in females (Belgium, 2004-2008) 63
figure 82 - Malignant melanoma of skin: relative survival by stage in males (Belgium, 2004-2008) 63
figure 83 - Malignant melanoma of skin: relative survival by stage in females (Belgium, 2004-2008) 63
figure 84 - Breast cancer: relative survival by sex in Belgium (2004-2008) 64
figure 85 - Breast cancer: relative survival by sex in the Flemish Region (1999-2008) 64
figure 86 - Breast cancer: relative survival by clinical stage in females (Belgium, 2004-2008) 64
figure 87 - Breast cancer: relative survival by pathological stage in females (Belgium, 2004-2008) 64
figure 88 - Cervical cancer (invasive): relative survival in Belgium (2004-2008) 69
figure 89 - Cervical cancer (invasive): relative survival in the Flemish Region (1999-2008) 69
figure 90 - Cervical cancer (invasive): relative survival by age group (Belgium, 2004-2008) 69
figure 91 - Cervical cancer (in situ and invasive): relative survival by stage (Belgium, 2004-2008) 69
figure 92 - Corpus uteri cancer: relative survival in Belgium (2004-2008) 71
figure 93 - Corpus uteri cancer: relative survival in the Flemish Region (1999-2008) 71
figure 94 - Corpus uteri cancer: relative survival by stage (Belgium, 2004-2008) 71
figure 95 - Corpus uteri cancer: relative survival by morphology (Belgium, 2004-2008) 72
lis
t o
f f
igu
re
sB
el
gia
n C
an
Ce
r r
eg
ist
ry
1 3

Ca
nC
er
su
rv
iva
l i
n b
el
giu
mb
el
gia
n C
an
Ce
r r
eg
ist
ry
1 4
figure 96 - Corpus uteri cancer: relative survival by morphology within carcinoma (Belgium, 2004-2008) 72
figure 97 - Ovarian cancer (invasive): relative survival in Belgium (2004-2008) 74
figure 98 - Ovarian cancer (invasive): relative survival in the Flemish Region (1999-2008) 74
figure 99 - Ovarian cancer (invasive): relative survival by age group (Belgium, 2004-2008) 74
figure 100 - Ovarian cancer (borderline and invasive): relative survival by stage (Belgium, 2004-2008) 74
figure 101 - Prostate cancer: relative survival in Belgium (2004-2008) 76
figure 102 - Prostate cancer: relative survival in the Flemish Region (1999-2008) 76
figure 103 - Prostate cancer: relative survival by stage (Belgium, 2004-2008) 76
figure 104 - Testicular cancer: relative survival in Belgium (2004-2008) 77
figure 105 - Testicular cancer: relative survival in the Flemish Region (1999-2008) 77
figure 106 - Testicular cancer: relative survival by stage (Belgium, 2004-2008) 77
figure 107 - Kidney cancer: relative survival by sex in Belgium (2004-2008) 79
figure 108 - Kidney cancer: relative survival by sex in the Flemish Region (1999-2008) 79
figure 109 - Kidney cancer: relative survival by age group in males (Belgium, 2004-2008) 79
figure 110 - Kidney cancer: relative survival by age group in females (Belgium, 2004-2008) 79
figure 111 - Kidney cancer: relative survival by stage in males (Belgium, 2004-2008) 80
figure 112 - Kidney cancer: relative survival by stage in females (Belgium, 2004-2008) 80
figure 113 - Bladder cancer (invasive): relative survival by sex in Belgium (2004-2008) 81
figure 114 - Bladder cancer (invasive): relative survival by sex in the Flemish Region (1999-2008) 81
figure 115 - Bladder cancer (invasive, pTis and pTa): relative survival by age group in males (Belgium, 2004-2008) 82
figure 116 - Bladder cancer (invasive, pTis and pTa): relative survival by age group in females (Belgium, 2004-2008) 82
figure 117 - Tumours of the central nervous system: relative survival by sex in Belgium (2004-2008) 85
figure 118 - Tumours of the central nervous system: relative survival by sex in the Flemish Region (1999-2008) 85
figure 119 - Tumours of the central nervous system, astrocytic tumours: relative survival by WHO grade in males (Belgium, 2004-2008) 85
figure 120 - Tumours of the central nervous system, astrocytic tumours: relative survival by WHO grade in females (Belgium, 2004-2008) 85
figure 121 - Thyroid cancer: relative survival by sex in Belgium (2004-2008) 88
figure 122 - Thyroid cancer: relative survival by sex in the Flemish Region (1999-2008) 88
figure 123 - Thyroid cancer: relative survival by age group in males (Belgium, 2004-2008) 88
figure 124 - Thyroid cancer: relative survival by age group in females (Belgium, 2004-2008) 88

1 i
nt
ro
du
Ct
ion
Be
lg
ian
Ca
nC
er
re
gis
tr
y
1 5
1 Introduction
1.1 ThE bElgiAn CAnCER REgiSTRy
New legislation initiatives since 2003
and the foundation of a new Belgian
Cancer Registry in 2005 by all Belgian
authorities involved in public health
have forced a breakthrough in cancer
registration in Belgium. The history of
the Belgian Cancer Registry has been
described in detail in the previous pub-
lication ‘Cancer Incidence in Belgium,
2004-2005’ [1].
A firm legal basis for cancer registra-
tion in Belgium is provided, particularly
by the Royal Decree on the onco-
logical care programs in 2003 and the
reimbursement of the multidisciplinary
oncological consultations (MOC-CMO),
and by the creation of the specific law
on the Cancer Registry in 2006 [2;3].
This legislation makes cancer registra-
tion compulsory for oncological care
programmes and pathological anat-
omy laboratories. The law authorises
the Belgian Cancer Registry to use the
national social security number (INSZ/
NISS) as a unique patient identifier.
The use of this unique number favours
linkage with other available medical
and/or administrative data. It should
be made clear that such a linkage not
only requires the authorisation of the
Privacy Commission but also implies
stringent measures and rules for pri-
vacy protection and confidentiality.
The authorities involved (Table 1)
contribute financially to ensure the
continuity of cancer registration. The
Belgian Cancer Registry also receives
financial support from the Founda-
tion against Cancer (Stichting Tegen
Kanker – Fondation Contre le Cancer),
taBle 1 - finanCial ContriButors to the Belgian CanCer registry
FOD Volksgezondheid, Veiligheid van de Voedselketen en Leefmilieu, Minister bevoegd voor Volksgezondheid
SPF Santé publique, Sécurité de la Chaîne alimentaire, Ministre de la Santé
Vlaams Agentschap Zorg en Gezondheid, Afdeling Informatie en Ondersteuning, Vlaams Minister van Welzijn, Volksgezondheid en Gezin
Communauté Française, Ministre de l’Enfance, de l’Aide à la Jeunesse et de la Santé
Gouvernement Wallon, Ministre de la Santé, de l’Action Sociale et de l’Egalité des Chances
Gemeenschappelijke Gemeenschapscommissie van Brussel-Hoofdstad
Commission Communautaire de Bruxelles-Capitale
RIZIV, Dienst geneeskundige verzorging
INAMI, Service des soins de santé
Minister der Deutschsprachigen Gemeinschaft für Ausbildung und Beschäftigung, Soziales und Tourismus
Stichting Tegen Kanker
Fondation Contre le Cancer
Vlaamse Liga tegen Kanker
Source: Belgian Cancer Registry
and the Flemish League against Cancer
(Vlaamse Liga tegen Kanker).
Since its foundation, the Belgian
Cancer Registry has been working
on the qualitative and quantitative
improvement of registration. Besides
completeness of registration, quality of
data appears to be a major element in
allowing the reportage of reliable data
on incidence, prevalence and survival.
As a result of these efforts, data on
5-year cancer incidence in Belgium and
10-year evolution of incidence of can-
cer in the Flemish Region were recently
published [4].

Ca
nC
er
su
rv
iva
l i
n b
el
giu
mb
el
gia
n C
an
Ce
r r
eg
ist
ry
1 6
1.2 popUlATion AnD REgion
Belgium (Figure 1) comprises an
area of 30,528 square kilometres.
On January 1 2008, Belgium had a
population of 10,666,866 includ-
ing 5,224,309 males and 5,442,557
females. The population is distributed
over three regions: the Flemish Region
(6,161,600), the Walloon Region
(3,456,775) and the Brussels-Capital
Region (1,048,491). Population density
is 456 inhabitants per square kilometre
for the Flemish Region, 205 for the
Walloon Region and 6,497 for the
Brussels-Capital Region.
The age structure of the Belgian popu-
lation is shown in Figure 2. Seventeen
per cent of the population is 65 years
of age or older and 4.7% is 80 years
of age or older.
Life expectancy at birth is 83.5 years
in females and 77.5 years in males.
Due to increasing life expectancy,
the Directorate-general Statistics and
Economic Information estimates a
threefold increase in the number of
persons aged 85 years and older by
2060 [6].
Flemish Region
Walloon Region
Brussels-Capital Region
figure 1 - Belgium
Source: Belgian Cancer Registry
FIGURE 2 - AGE STRUCTURE OF THE BELGIAN POPULATION (2008) [5]
95+ years
90- years
85- years
80- years
75- years
70- years
65- years
60- years
55- years
50- years
45- years
40- years
35- years
30- years
25- years
20- years
15- years
10- years
5- years
0- years
Source: Directorate-general Statistics and Economic Information
500 500
Thousands
400 400300 300200 200100 1000
MalesFemales

1 i
nt
ro
du
Ct
ion
Be
lg
ian
Ca
nC
er
re
gis
tr
y
1 7
1.3 DATA CollECTion
Notification and submission to the registry
This publication reports on the survival
of patients diagnosed between Janu-
ary 1 2004 and December 31 2008 in
Belgium. For the Flemish Region, 10
incidence years (1999-2008) are taken
into account for survival analyses.
For the registration of cancer diag-
noses, the data flow relies on all
information (notifications) from the
oncological care programs (clinical
network), and from all pathological
anatomy laboratories related to hospi-
tals (pathology network).
• Clinical network
Hospitals must register all new cancer
diagnoses, regardless of the fact that the
diagnosis is discussed during a multidis-
ciplinary oncological consultation. Each
tumour must be recorded by means of a
standard form including a confined set
of variables. To code tumour charac-
teristics, the International Classifica-
tion of Diseases for Oncology (ICD-O),
2nd edition [7] is applied to this data set.
Since the incidence year 2002, the
ICD-O, 3rd edition has been used [8]. The
stage of the tumour is defined according
to the TNM Classification of Malignant
Tumours, 5th edition (until 2002) [9] and
6th edition (from 2003 onwards) [10]1.
• Pathology network
The pathological anatomy laboratories
encode the received specimens follo-
wing classification rules approved by
the Consilium Pathologicum Belgicum.
Every (pre-)malignant diagnosis is
encoded and transferred to the Belgian
Cancer Registry annually, accompanied
by the protocols as foreseen by law.
After quality control, the specimen
classification is converted to a tumour
registration in ICD-O-3 at the registry.
Quality control and data linkage
Each tumour record is subjected to an
automated quality control in which
the format and the contents of each
field are checked. In addition, the
contents of the fields are checked for
inconsistencies against the other fields.
Relationships are checked between
localisation and gender, localisation
and histology, and age and tumour
characteristics. These checking proce-
dures are based on the IARC guidelines
[11]. In addition, a number of manual
interventions are carried out (e.g. all
liver tumours are manually checked).
Subsequently, the individual tumour
records from clinical sources and
pathological anatomy laboratories are
linked by means of the unique patient
identifier. If these tumour records
contain data on the same tumour,
the data from the various sources are
merged into a single, definitive tumour
record; at this stage a determination
is reached as to whether this concerns
a second (third, etc.) primary tumour.
The linkage of the data is largely an
automated process; however, in less
than 20% of the data links, manual
intervention is necessary. In more
complex cases, or in case of conflicting
information, the data source is con-
sulted to provide additional details.
Exclusion criteria
All invasive and in situ malignancies
are registered, with the exception of
basal cell carcinoma of the skin. Also,
borderline malignant tumours of the
ovary, non-invasive and borderline
malignant tumours of the bladder, bor-
derline malignant and benign tumours
of the central nervous system, pituitary
gland and craniopharyngeal duct are
registered.
Chronic myeloproliferative diseases
and myelodysplastic syndromes are
registered as from 2004, when they
were reclassified as malignant diseases
[12].
Quality of the cancer registry data
The quality of the cancer registry data
depends on different aspects defined
at international level [11;13]. Accord-
ingly, the quality of the Belgian Cancer
Registry was discussed in detail in the
previous publication, ‘Cancer Incidence
in Belgium, 2008’ [4].
1 For a more detailed description, please consult “Cancer Incidence in Belgium, 2008, Belgian Cancer Registry, Brussels 2011.”

Ca
nC
er
su
rv
iva
l i
n b
el
giu
mb
el
gia
n C
an
Ce
r r
eg
ist
ry
1 8
2.1 DATA SElECTion
General selection criteria
The survival analyses presented in
this monograph include data on all
primary malignant tumours (ICD-10
[14]: C00-C43, C45-C96) diagnosed
in Belgium between 2004 and 2008.
Non-melanoma skin cancers were
excluded from the analyses. Results of
survival analyses for cancer patients
diagnosed in the Flemish Region in the
years 1999-2008 are also reported.
The general selection flowchart
(Figure 3) describes the selection
procedure for Belgian data 2004-
2008. Selection for the Flemish Region
(1999-2008) was performed in the
same way. The exclusion criteria were:
• patients officially residing outside
Belgium
• cases with uncertain date of diag-
nosis
• cases without a unique national
number. The vital status was
retrieved from the Kruispuntbank
van de Sociale Zekerheid/Banque
Carrefour de la Sécurité Sociale
based on the patients’ unique social
security number (INSZ/NISS). Using
this active follow-up method, cancer
patients were followed-up until
31 July 2011.
• second and subsequent tumours. For
each person, only the first diag-
nosed cancer (known to the Belgian
Cancer Registry) was considered for
the analysis, consistent with other
2 Methodology
international cancer survival analyses
[15;16]
• cases with a date of diagnosis equal
to the date of death
• cases lost to follow-up at the date of
incidence
• childhood cancer patients (0-14 years)
These factors explain why the numbers
at risk included in the survival analyses
are lower than the crude incidence
numbers reported in a previous publi-
cation on cancer incidence in Belgium
[4].
figure 3 - general seleCtion flowChart
Source: Belgian Cancer Registry

2 m
et
ho
do
lo
gy
Be
lg
ian
Ca
nC
er
re
gis
tr
y
1 9
Additional criteria for particular tumour sites
• Malignant melanoma of the skin
Every case with a morphology code
referring to melanoma and a locali-
sation code referring to skin (C44)
or unknown localisation (C80.9)
according to ICD-O-3 is automatically
converted to the ICD-10 code C43,
corresponding to malignant melanoma
of the skin. However, a detailed review
of available pathology protocols at the
Belgian Cancer Registry revealed that
a considerable number of C80.9-cases
represent melanoma originating out-
side the skin. As these lesions are likely
to have other prognostic features than
primary skin melanomas, they were
excluded from the survival analyses (94
males and 75 females).
• Gastric and oesophageal cancers
For the survival analyses on gastric and
oesophageal cancers, cancers of the
gastro-oesophageal junction (ICD-10:
C16.0) were taken together with
oesophageal cancers (ICD-10: C15),
and thus excluded from the analyses
on gastric cancer (ICD-10: C16).
• Non-invasive tumours
Besides survival analyses for invasive
cancers, non-invasive lesions were also
investigated for ovary, bladder, breast
and cervix.
For ovarian cancer, borderline malig-
nant tumours were included in the
survival analyses by stage, except for
patients with any other diagnosis of
an invasive cancer. In the latter case,
only the invasive cancer diagnosis was
considered in the analyses. Where a
borderline ovarian cancer and an in
situ bladder cancer (but no invasive
cancer) were registered for the same
patient, only the first non-invasive
tumour was considered.
For bladder cancer, the first non-
invasive papillary carcinoma (pTa) or
in situ (pTis) cancer was included in
the survival analyses by stage except
for patients with any other diagnosis
of invasive cancer. In the latter case,
only the invasive cancer diagnosis was
considered in the analyses. The non-
invasive bladder cancers were repre-
sented as stage 0 cases. Where both a
pTa and pTis lesion were diagnosed in
the same patient, only the pTis lesion
was taken into account because of its
potential impact on survival. Where an
in situ bladder cancer and a borderline
ovarian cancer (but no invasive cancer)
were registered for the same patient,
only the first non-invasive tumour was
considered.
For cervical and breast cancer, the first
in situ cervical or breast cancer lesion
was taken into account for the survival
analyses by stage (stage 0). The in
situ cancers were only included in the
survival analyses if the patient had
not been diagnosed with any invasive
cancer, an in situ bladder cancer or a
borderline ovarian tumour.

Ca
nC
er
su
rv
iva
l i
n b
el
giu
mb
el
gia
n C
an
Ce
r r
eg
ist
ry
2 0
2.2 CAlCUlATion oF SURvivAl
CensoringPatients whose observation duration
was shorter than the maximum time for
which survival probability was calculated
were censored at the date of the last
information on vital status. Most of these
censored cases survived beyond the end
of the follow-up. A minority were lost
to follow-up at some point before the
end of the observation period (n=439;
0.19% of the total number of patients).
Observed survival
Observed survival was calculated with
the Kaplan-Meier method [17] using a
semi-complete analysis approach [18].
For calculation, the Lifetest Procedure
of SAS was used.
Different thresholds for the minimal
number of patients at risk at time
of diagnosis were used in other
population-based survival publications
[16;19;20]. It was decided to restrict
survival analyses in the current mono-
graph to groups of 35 or more patients
at the start of the observation period.
Median Survival
The median survival time is the point at
which half the subjects have died, and
half are still alive. Based on observed
survival, calculations for median survival
time in this publication were per-
formed for all tumour types by ICD-10
for patients diagnosed in Belgium
(2004-2008) and in the Flemish Region
(1999-2008). The results are expressed
in months and are presented in an
overview table in Appendix 1. For can-
cer sites with a 5-year observed survival
rate above 50%, median survival time
could not be calculated. As displayed in
the overview table, these tumour types
have a median survival time of more
than 5 years (or 60 months).
Relative Survival
Clinical studies mainly focus on death
due to a particular disease, expressed as
disease-specific survival. At the popula-
tion level however, it is very difficult to
establish the cause of death for each
individual patient. To overcome this
problem, the concept of relative survival
has been set up as a proxy for disease-
specific survival [21]. Relative survival
can be used as a measure of cancer
survival, excluding the effect arising from
different background mortalities. This is
calculated as the ratio of the observed
survival in a group of patients to the
expected survival in a comparable group
of individuals from the general popula-
tion. Relative survival is widely used for
comparisons between different popula-
tions and countries.
The expected survival is calculated from
life tables for an individual country. For
the current monograph, expected survival
calculations were based on sex-, age,
region- and calendar-year-specific Belgian
life tables (Source: Statistics Belgium
[22]), according to the Ederer II method
[23]. Relative survival rates were esti-
mated using a SAS code written by Paul
Dickman from the Karolinska Institute,
Stockholm, Sweden [24] using a semi-
complete analysis approach. In alignment
with the observed survival calculations, it
was decided to restrict survival analyses
to groups of 35 patients or more at the
start of the observation period. Standard
errors of mean survival estimates were
calculated with the Greenwood formula.
To obtain 95% confidence intervals (CI)
the data were logarithmically trans-
formed so that the lower bound of the CI
was always positive.
Relative survival rates close or equal
to 100% do not mean that patients
do not die, but that patients with this
cancer type have a similar risk of dying
than the general population, if strati-
fied by sex, age and calendar year.
Relative survival can exceed 100%
or can increase from one interval to
another, indicating that survival in the
group of cancer patients is higher than
survival in the matched group from the
general population. Both phenomena
can occur when information on death
is missed, or by chance in small-size
populations. However, they can also
occur if patients have a healthier life-
style or are more consistently treated
for concomitant diseases than the
reference population [25].
Age-standardisation
Age is a major determinant of cancer
survival, and in international compari-
sons it is necessary to take the differ-
ent age structures of the populations
compared into account. Five-year
relative survival estimates by sex (all ages
combined) were age-standardised using
the direct method and the International
Cancer Survival Standard (ICSS) age
distributions proposed by Corazziari et
al [26]. According to the age pattern of
incidence, the studied cancer types were
divided in three standard cancer popula-
tions with different age distribution. A
separate weight factor was attributed
to each of the five age categories within
each standard cancer population [26].
This age-adjustment was only performed
for the tumour types studied in detail in
the separate chapters.
Software
SAS package, Version 9.1 from SAS
Institute, Cary, NC, USA was used for
all the analyses.
2.3 pRESEnTATion oF RESUlTS
General results (chapter 3)In addition to the results for all
tumours taken together, this chap-
ter provides some summary tables
and figures on the obtained survival
results. Because all survival analyses
in this monograph start from 15 years
of age, a truncated age-standardised
rate (TWSR) is also reported in Figure
8 and Figure 9 (15-85+ years), show-
ing the TWSR in function of the
5-year relative survival.
Results per tumour site (chapters 4 to 13)
For the selected tumour sites, detailed
analyses are presented. Haematologi-
cal tumours, sarcoma and childhood
cancers were not analysed in detail as
these cancer types will be considered
in separate ongoing publications.
Each chapter starts with a brief
overview of the specific tumour type
concerning incidence, mortality and,
in some cases, trends in incidence or
mortality. The data mentioned in these
introductory paragraphs are derived
from a previous publication of the
Belgian Cancer Registry [4].
Alongside the general results (Belgium
2004-2008 and the Flemish Region
1999-2008) and the results by region
(2004-2008), different subgroup analy-
ses were performed on the Belgian
cohort (2004-2008). An overview of
the subgroup analyses that were car-
ried out is presented in Table 2.
For these chapters, observed survival
results are only presented in the gen-
eral results. All subgroup analyses per
tumour type were limited to relative
survival.
• General results
For each cancer site, tables with 1-, 3-
and 5-year observed and relative sur-
vival by sex are presented for Belgium
(2004-2008), in addition to charts for
the whole observation period.
Tables with 1-, 3-, 5- and 10-year
observed and relative survival by sex
are presented for the Flemish Region
(1999-2008), completed with charts
for the whole observation period.
Five-year age-standardised relative
survival is provided for Belgium (2004-
2008).
• Results by region
For each tumour, 5-year relative sur-
vival was calculated by sex and region
for the three Belgian regions (Brussels-
Capital Region, Flemish Region and
Walloon Region; 2004-2008).
• Analyses by age group
Relative survival analyses were per-
formed for different age classes
according to the age groups for which
incidence rates were calculated in a pre-
vious publication of the Belgian Cancer
Registry [4]. Minor differences compared
with the previously published age groups
are due to regrouping of age classes
where the number at risk is too low.
• Analyses by stage
Relative survival estimates by stage
were calculated according to the
TNM classification as defined by the
International Union Against Cancer
(5th edition for incidence years 1999-
2002 [9], 6th edition for incidence years
2003-2008 [10]). For most cancer
sites, presented analyses are based on
a combined stage, obtained from a
compilation of pathological (pTNM) and
clinical (cTNM) stage. If both pStage and
cStage are available, pStage is used for
the combined stage. An exception to
this rule is a case with clinical metastases
(cM=1): in this case, the combined stage
is IV. If either the pathological or the
clinical stage only is available, the com-
bined stage is derived from the available
stage. If both pStage and cStage are
absent, the combined stage is consid-
ered unknown (“X”). For some tumours
(e.g. colon and rectum), results are given
by cStage and/or pStage (Table 2).
Note that in the current monograph,
“stage” refers to combined stage, unless
specified otherwise.
Clinical TNM stage information is
overall quite low, but higher for sites
with little surgical treatment where it
is often not possible to determine the
pathological TNM (e.g. lung cancer).
Rather often, there is no clinical coun-
terpart reported for the pathological
TNM stage or vice versa, but together
they result in a combined TNM in about
77% of the cases (Table 3).
The Belgian Cancer Registry explicitly
choses to show results for stage X
cases, rather than redistributing them
among the known cases. Previous
studies on Belgian registration data
have, for instance, shown that stage X
cases proportionally more occur in older
patients [27].
For some tumour types, such as
sarcomas, TNM stage is not applicable
(“NA”). Unlike the cases with unknown
stage, these NA cases were not included
in survival analyses by stage, so the total
number of subjects may be higher than
the sum of the different stages.
• Analyses by morphology and
sublocalisation
For some cancer sites, survival rates
for different morphological groups are
provided. Most subanalyses by
2 m
et
ho
do
lo
gy
Be
lg
ian
Ca
nC
er
re
gis
tr
y
2 1

Ca
nC
er
su
rv
iva
l i
n b
el
giu
mb
el
gia
n C
an
Ce
r r
eg
ist
ry
2 2
taB
le 2
- o
ver
vie
w o
f th
e su
Bg
ro
up
an
aly
ses
By
tu
mo
ur
pr
ima
ry
sit
e
iCd
-10
ag
e g
rou
ps
stag
em
orp
ho
log
y*su
bo
calis
atio
n*
gra
de
rem
ark
on
sel
ecti
on
cri
teri
a
C00
-C14
, C30
-C32
H
ead
and
neck
15-4
9, 5
0-74
, 75+
cSta
geX
C15
-C16
.0
O
esop
hagu
s15
-64,
65+
Com
bine
d st
age
XO
esop
hagu
s: C
15.0
-C15
.9
Gas
tro-
oeso
phag
eal j
unct
ion:
C16
.0
C16
.1-C
16.9
Stom
ach
15-5
9, 6
0-74
, 75+
Com
bine
d st
age
X
C18
-C19
C
olon
15-4
9, 5
0-64
, 65+
cSta
ge, p
Stag
e
C20
Re
ctum
15-4
9, 5
0-64
, 65+
cSta
ge, p
Stag
e
C22
Li
ver
15-5
9, 6
0+C
ombi
ned
stag
eX
C23
-C24
G
allb
ladd
er a
nd b
iliar
y tr
act
15-5
9, 6
0+C
ombi
ned
stag
eX
Ana
lysi
s by
loca
lisat
ion:
add
ition
of
C22
.1 In
trah
epat
ic b
ile d
ucts
C25
Pa
ncre
as15
-59,
60-
74, 7
5+C
ombi
ned
stag
eX
C34
Lu
ng
15-4
9, 5
0-64
, 65+
Com
bine
d st
age
X
C43
M
alig
nant
mel
anom
a of
ski
n
15-3
4, 3
5-64
, 65+
Com
bine
d st
age
XC
43 e
xclu
ding
mel
anom
a of
unk
now
n lo
calis
atio
n (IC
D-O
-3: C
80.9
)
C45
Mes
othe
liom
a
15-6
4, 6
5+C
ombi
ned
stag
eX
C50
Br
east
15-4
9, 5
0-69
, 70+
cSta
ge, p
Stag
eA
naly
sis
by s
tage
: add
ition
of
in s
itu
tum
ours
C53
C
ervi
x15
-44,
45-
64, 6
5+C
ombi
ned
stag
eA
naly
sis
by s
tage
: add
ition
of
in s
itu
tum
ours
C54
C
orpu
s ut
eri
15-5
4, 5
5-69
, 70+
Com
bine
d st
age
XX
C56
O
vary
15
-44,
45-
69, 7
0+C
ombi
ned
stag
eX
+ b
orde
rline
tum
ours
C61
Pros
tate
15-5
9, 6
0-74
, 75+
Com
bine
d st
age
C62
Te
stis
15-4
9, 5
0+C
ombi
ned
stag
eX
C64
K
idne
y
15
-44,
45-
64, 6
5+C
ombi
ned
stag
e
C67
Bl
adde
r
15-5
9, 6
0-74
, 75+
Com
bine
d st
age
Ana
lysi
s by
sta
ge: a
dditi
on o
f no
n-in
vasi
ve b
ladd
er c
ance
r: p
apill
ary
(pTa
) an
d fla
t (p
Tis)
uro
thel
ial c
arci
nom
a
C71
-C72
C
entr
al n
ervo
us s
yste
m
15-2
4, 2
5-59
, 60+
XX
C73
Th
yroi
d15
-39,
40-
69, 7
0+C
ombi
ned
stag
eX
C00
-C43
, C45
-C96
All
inva
sive
tum
ours
15-4
9, 5
0-64
, 65+
*For
mor
e de
tails
on
whi
ch g
roup
s of
mor
phol
ogie
s or
sub
loca
lisat
ions
wer
e st
udie
d, s
ee A
ppen
dix
3.
Sour
ce: B
elgi
an C
ance
r Re
gist
ry

morphology were based on the histo-
logical groups defined by IARC [28]. In
other cases, clinical evidence of benefit
for a certain morphology led to the
exploration of survival probabilities
for the concerned morphology type
in comparison with other types (e.g.
gastro-intestinal stromal tumours or
GIST, in stomach cancer).
Similarly, results by sublocalisation
are presented for some tumours. An
example is malignant melanoma,
for which separate survival rates for
tumours originating from the head or
trunk versus those originating from the
arms or legs were calculated.
More detailed information on these
analyses is provided in appendix 3.
• Other subgroup analyses
For liver cancer, cases were divided
according to the type of diagnosis
(clinical versus pathological).
For endometrial carcinoma, survival
analyses by histological tumour grade
were performed [29].
Survival rates of astrocytomas of the
central nervous system were calculated
according to the WHO tumour grade [30].
• Appendices
Appendix 1
Results for all tumour sites by ICD-10
are reported for patients diagnosed in
Belgium (2004-2008) and in the Flem-
ish Region (1999-2008) for males and
females separately. The tables provide
the numbers at risk at the start of the
observation period, the median survival
time, and observed and relative survival
at 1, 3 and 5 years (10 years for the
Flemish Region) after diagnosis.
taBle 3 - availaBility of information on tumour stage (CliniCal, pathologiCal and ComBined), Belgium 2004-2008
iCd-10 primary site n at risk only stageable tumours
total ctnm ptnm Combined tnm stage
n % n % n %
C00-C14, C30-C32
Head and neck 10,927 9,441 6,299 66.7 3,117 33.0 7,071 74.9
C15-C16.0 Oesophagus 5,207 5,175 3,086 59.6 1,757 34.0 3,733 72.1
C16.1-C16.9 Stomach 4,706 4,468 1,673 37.4 2,144 48.0 2,936 65.7
C18-C19 Colon 24,367 24,338 7,364 30.3 19,394 79.7 20,863 85.7
C20 Rectum 10,255 10,222 5,698 55.7 6,873 67.2 8,673 84.8
C22 Liver 2,163 2,135 818 38.3 437 20.5 1,082 50.7
C23-C24 Gallbladder and biliary tract 1,496 1,326 448 33.8 675 50.9 926 69.8
C25 Pancreas 5,134 5,123 2,739 53.5 1,653 32.3 3,571 69.7
C34 Lung 31,317 31,109 20,415 65.6 6,562 21.1 22,049 70.9
C43 Malignant melanoma of skin 7,197 7,196 2,148 29.8 5,597 77.8 5,643 78.4
C45 Mesothelioma 1,111 1,029 459 44.6 104 10.1 493 47.9
C50 Breast 46,288 46,110 26,524 57.5 37,456 81.2 41,237 89.4
C53 Cervix uteri 3,065 3,052 1,064 34.9 1,516 49.7 2,042 66.9
C54 Corpus uteri 6,346 5,835 1,236 21.2 4,208 72.1 4,439 76.1
C56 Ovary 4,149 4,117 1,116 27.1 2,125 51.6 2,529 61.4
C61 Prostate 42,988 42,979 20,169 46.9 17,446 40.6 27,999 65.1
C62 Testis 1,356 1,317 773 58.7 1,100 83.5 1,137 86.3
C64 Kidney 5,855 5,799 2,465 42.5 4,272 73.7 4,840 83.5
C67 Bladder 8,981 8,951 2,886 32.2 6,977 77.9 7,462 83.4
C73 Thyroid 3,150 3,134 873 27.9 1,900 60.6 2,024 64.6
Source: Belgian Cancer Registry
Appendix 2
For the tumour types discussed in detail
(chapters 4 to 13), the numbers at risk
at the start of the observation period,
the number of patient deaths after 5
years of follow-up, the crude 1-, 3- and
5-year relative survival rates, and the
age-standardised 1-, 3- and 5-year rela-
tive survival rates, are presented. The
used standard cancer populations per
tumour type according to the method
described by Corazziari et al [26] are
also shown.
Appendix 3
Details on the subgroup analyses by
morphology (morphology code accord-
ing to ICD-O-3) or sublocalisation
(according to ICD-10) are provided for
the specific tumour types [8;14].
2 m
et
ho
do
lo
gy
Be
lg
ian
Ca
nC
er
re
gis
tr
y
2 3

Ca
nC
er
su
rv
iva
l i
n b
el
giu
mb
el
gia
n C
an
Ce
r r
eg
ist
ry
2 4
3 General survival results
taBle 4 - all tumours: oBserved and relative survival By sex in Belgium (2004-2008) and in the flemish region (1999-2008)
n at risk observed survival (%) relative survival (%) asrs*(%)
1 year 3 year 5 year 10 year 1 year 3 year 5 year 10 year 5 year
Belgium
Males 140,687 73.9 57.5 49.5 76.7 64.0 59.5 59.0
Females 120,721 81.1 68.1 60.7 83.2 72.7 67.8 65.7
Flemish Region
Males 164,738 72.7 56.2 48.2 34.6 75.6 62.8 58.2 52.3
Females 135,482 80.5 67.1 59.7 48.0 82.5 71.7 66.6 60.2
*ASRS: Age-standardised relative survival
3.1 All TUMoURS (iCD-10: C00-C43, C45-C96)
In 2008, 59,043 new invasive tumours
(excluding non-melanoma skin can-
cers, myeloproliferative and myelodys-
plastic syndromes) were registered in
Belgium, 54% in males and 46% in
females. The mean age at diagnosis
was 67 years in males and 65 years
in females. In the same year, 26,647
patients died from cancer (57% males,
43% females).
Looking at the incidence years 2004-
2008, 290,418 (males: 159,139 and
females: 131,279) new diagnoses of
cancer were registered in Belgium.
Survival for a first invasive tumour
occurring from the age of 15 years on
could be calculated for 261,408 cases
[31]. Five-year relative survival for all
tumours together diagnosed between
2004 and 2008 shows a poorer
outcome in males than in females
(59.5% versus 67.8%; Table 4, Figure
4). Data from the Flemish Region
(incidence 1999-2008) confirm this
gender difference at the longer term,
showing a 10-year relative survival
of 52.3% in males and 60.2% in
females (Table 4, Figure 5). This
general female survival advantage
reflects the fact that for most cancers,
females have a better prognosis than
males. In addition, males tend to be
affected by cancers with less favour-
able prognosis than those affecting
females [32;33].
Five-year relative survival rates are
similar for the three different Belgian
regions, resulting in 56.6% for males
in the Brussels-Capital Region, 60.8%
for the Flemish Region and 57.5% for
the Walloon Region. In females, these
rates are 66.7%, 68.0% and 67.8%,
respectively (Table 5).
In both males and females, survival is
inversely related to the age at diagno-
sis: the younger the patient, the better
the survival. In males, 5-year relative
survival is 67.6% in the age group
15-49 years compared with 57.4%
for patients of 65 years and older. This
age-dependent prognostic difference
is even more important in females,
where 5-year relative survival esti-
mates are 84.4% in the 15-49 years
age group, and only 57.3% in the
65+ years age group. The almost equal
prognosis for both sexes in the oldest
age group suggests that the female
survival benefit disappears at older
ages (Figure 6, Figure 7). A potential
explanation may be that sex-hormone
patterns have a role in women’s supe-
rior ability to cope with cancer [33].
Source: Belgian Cancer Registry

3 g
en
er
al
su
rv
iva
l r
es
ul
ts
Be
lg
ian
Ca
nC
er
re
gis
tr
y
2 5
taBle 5 - all tumours: relative survival By region and sex (2004-2008)
n at risk relative survival (%)
n % 1 year 3 year 5 year
Males
Brussels-Capital Region 10,483 7.5 74.6 61.0 56.6
Flemish Region 85,543 60.8 77.6 65.4 60.8
Walloon Region 44,661 31.7 75.4 62.0 57.5
Females
Brussels-Capital Region 11,173 9.3 81.7 71.3 66.7
Flemish Region 69,790 57.8 83.7 73.1 68.0
Walloon Region 39,758 32.9 82.6 72.5 67.8
Source: Belgian Cancer Registry
0 1 2 3 4 5
100
80
60
40
20
0
%
0 1 2 3 4 5 6 7 8 9 10
Survival time (years)
FIGURE 4 - ALL TUMOURS: 5-YEAR RELATIVE SURVIVAL BY SEX (BELGIUM, 2004-2008)
MalesFemales
MalesFemales
Source: Belgian Cancer Registry
Survival time (years)
FIGURE 5 - ALL TUMOURS: 10-YEAR RELATIVE SURVIVAL BY SEX (FLEMISH REGION, 1999-2008)
Source: Belgian Cancer Registry
0 1 2 3 4 5 0 1 2 3 4 5
100
80
60
40
20
0
%
Survival time (years)
FIGURE 6 - ALL TUMOURS: 5-YEAR RELATIVE SURVIVAL BY AGE GROUP IN MALES (BELGIUM, 2004-2008)
15-49 years50-64 years65+ years
15-49 years50-64 years65+ years
Source: Belgian Cancer Registry
Survival time (years)
FIGURE 7 - ALL TUMOURS: 5-YEAR RELATIVE SURVIVAL BY AGE GROUP IN FEMALES (BELGIUM 2004-2008)
Source: Belgian Cancer Registry

Ca
nC
er
su
rv
iva
l i
n b
el
giu
mb
el
gia
n C
an
Ce
r r
eg
ist
ry
2 6
3.2 SUMMARy oF RESUlTS
Figure 8 and Figure 9 compare
age-standardised incidence rates
(truncated world standardised rate
for patients from the age of 15 years)
for incidence year 2008, with 5-year
relative survival for incidence years
2004-2008 in Belgium. Only those
tumours for which detailed results are
provided (chapter 4 to 13) were taken
into account, resulting in 18 localisa-
tions in males and 19 in females.
In both males and females, the most
frequently diagnosed tumour (respec-
tively prostate and breast cancer) is
associated with a very good 5-year
relative survival.
Lung cancer, which is the 2nd most
common cancer in males and the
3rd most common cancer in females,
has a poor 5-year relative survival.
Cancers of the colon and rectum,
which represent the 3rd most fre-
quently occurring tumour in males
and the 2nd most frequently occurring
tumour in females, have an interme-
diate 5-year relative survival.
FIGURE 8 - 5-YEAR RELATIVE SURVIVAL (2004-2008) BY AGE-STANDARDISED INCIDENCE (2008) IN BELGIUM, MALES
0
0
10
20
30
40
50
60
70
80
90
100
20 40 60
TWSR* (n/100,000 person years)
5-ye
ar r
elat
ive
surv
ival
(%)
*TWSR: Truncated (15+ years) age-standardised incidence rate according to the world population**Central nervous system
80 100 120 140
Source: Belgian Cancer Registry
Lung
Mesothelioma
Pancreas
Gallbladder and biliary tract
Liver
CNS**
Stomach
Head and neck
Bladder
RectumColon
Kidney
Breast
Melanoma of skin
Thyroid
Testis Prostate
Oesophagus

Figure 10 and Figure 11 represent the
ten tumours with the highest and lowest
5-year relative survival rates in males and
females (Belgium, incidence years 2004-
2008). Survival rates for all tumour types
by ICD-10 were taken into account, as
well as myeloproliferative disease (MPD)
and myelodysplastic syndrome (MDS).
Testicular, prostate and thyroid cancer
are the three tumours with the best
prognosis in males. Thyroid cancer,
malignant melanoma of skin, and
breast cancer have the highest 5-year
relative-survival in females.
Mesothelioma and pancreatic cancer
have the lowest 5-year relative survival
rates in both sexes. Gallbladder is the
site with the 3rd worst prognosis in
males, while tumours of unknown
primary site have the 3rd lowest 5-year
relative survival in females.
Figure 12 and Figure 13 show the
5-year relative survival rates in males
and females respectively, with a 95%
confidence interval. Only those tumours
for which detailed results are provided
(chapter 4 to 13) were taken into
account, resulting in 18 localisations in
males and 19 in females. In addition to
these tumours, results on all tumours
together including MPD and MDS are
presented.
FIGURE 9 - 5-YEAR RELATIVE SURVIVAL (2004-2008) BY AGE-STANDARDISED INCIDENCE (2008) IN BELGIUM, FEMALES
0
0
10
20
30
40
50
60
70
80
90
20 40 60
TWSR* (n/100,000 person years)
80 100 120 140 160
*TWSR: Truncated (15+ years) age-standardised incidence rate according to the world population**Central nervous system Source: Belgian Cancer Registry
100
Mesothelioma
Pancreas
Gallbladder and biliary tract
Liver
CNS**
Lung
Stomach
Head and neck
Bladder
Ovary
Rectum
Cervix uteri
Corpus uteri
Colon
Kidney
Breast
Melanoma of skin
Thyroid
Oesophagus
5-ye
ar r
elat
ive
surv
ival
(%)
3 g
en
er
al
su
rv
iva
l r
es
ul
ts
Be
lg
ian
Ca
nC
er
re
gis
tr
y
2 7

Ca
nC
er
su
rv
iva
l i
n b
el
giu
mb
el
gia
n C
an
Ce
r r
eg
ist
ry
2 8
FIGURE 10 - TUMOURS WITH THE HIGHEST 5-YEAR RELATIVE SURVIVAL BY SEX (BELGIUM, 2004-2008)
100 80 60 40 20 0 20 40 60 80 100
MalesFemales
Source: Belgian Cancer Registry
5-year relative survival (%)
Testis
Prostate
Thyroid
Malignant melanoma of skin
Hodgkin’s disease
Kaposi’s sarcoma
Myeloproliferative disorders
Lymphoid leukaemia
Breast
Malignant immunoproliferative disease
Thyroid
Malignant melanoma of skin
Breast
Myeloproliferative disorders
Hodgkin’s disease
Corpus uteri
Lymphoid leukaemia
Eye and adnexa
Bone and articular cartilage
Kidney
FIGURE 11 - TUMOURS WITH THE LOWEST 5-YEAR RELATIVE SURVIVAL BY SEX (BELGIUM, 2004-2008)
50 40 30 20 10 0 10 20 30 40 50
MalesFemales
Source: Belgian Cancer Registry
5-year relative survival (%)
Mesothelioma
Pancreas
Gallbladder
Unknown primary site
Lung
Liver
Central nervous system
Oesophagus
Stomach
Myeloid leukaemia
Mesothelioma
Pancreas
Unknown primary site
Lung
Gallbladder
Liver
Oesophagus
Central nervous system
Vagina
Stomach

FIGURE 12 - 5-YEAR RELATIVE SURVIVAL POINT ESTIMATES AND 95% CONFIDENCE INTERVALS BY TUMOUR SITE IN MALES (BELGIUM 2004-2008)
Source: Belgian Cancer Registry
0 10 20 30 40 50 60 70 80 90 100
5-year relative survival (%)
Testis (C62)
Prostate (C61)
Thyroid (C73)
Malignant melanoma of skin (C43)
Breast (C50)
Kidney (C64)
Rectum (C20)
Colon (C18-C19)
Bladder (C67)
Head and neck (C00-C14, C30-C32)
Stomach (C16.1-9)
Oesophagus (C15-C16.0)
Central Nervous System (C71-C72)
Gallbladder and biliary tract (C23-C24)
Liver (C22)
Lung (C34)
Pancreas (C25)
Mesothelioma (C45)
All tumours (C00-C43, C45-C96, MPD, MDS)
FIGURE 13 - 5-YEAR RELATIVE SURVIVAL POINT ESTIMATES AND 95% CONFIDENCE INTERVALS BY TUMOUR SITE IN FEMALES (BELGIUM 2004-2008)
5-year relative survival (%)
0 10 20 30 40 50 60 70 80 90 100
Source: Belgian Cancer Registry
Thyroid (C73)
Malignant melanoma of skin (C43)
Breast (C50)
Corpus uteri (C54)
Kidney (C64)
Cervix uteri (C53)
Colon (C18-C19)
Rectum (C20)
Head and neck (C00-C14, C30-C32)
Bladder (C67)
Ovary (C56)
Stomach (C16.1-9)
Central Nervous System (C71-C72)
Oesophagus (C15-C16.0)
Liver (C22)
Lung (C34)
Gallbladder and biliary tract (C23-C24)
Pancreas (C25)
Mesothelioma (C45)
All tumours (C00-C43, C45-C96, MPD, MDS)
3 g
en
er
al
su
rv
iva
l r
es
ul
ts
Be
lg
ian
Ca
nC
er
re
gis
tr
y
2 9
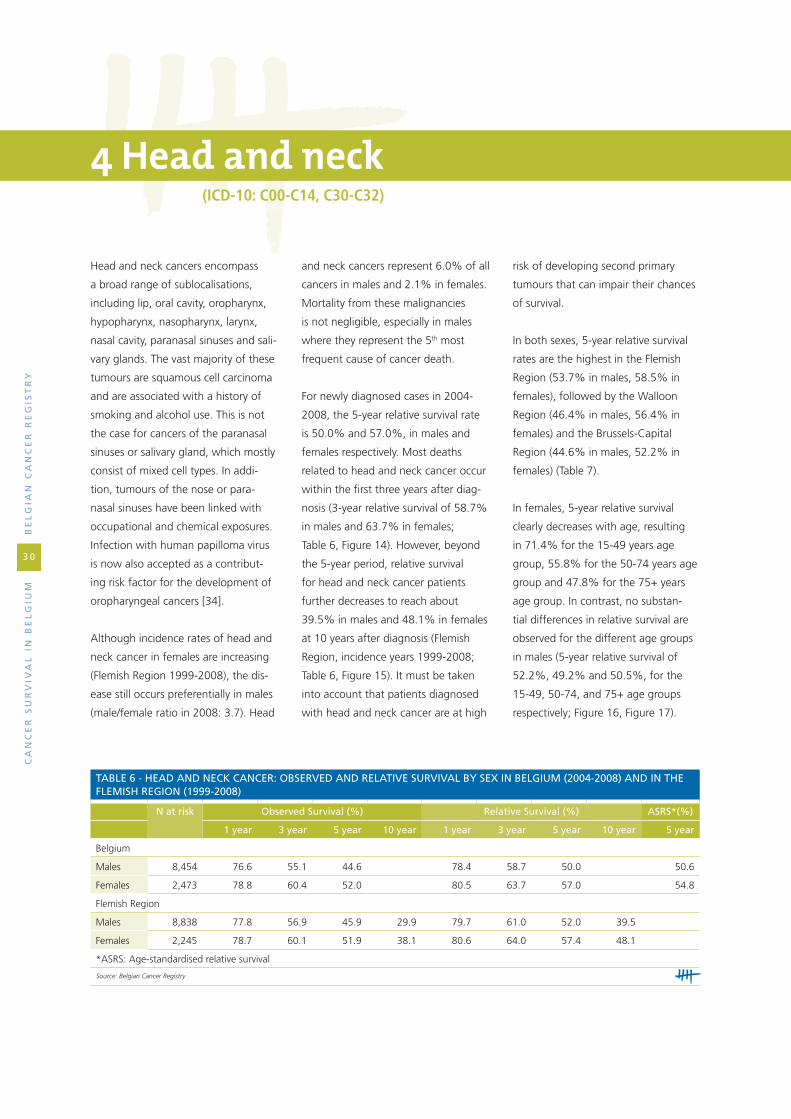
Ca
nC
er
su
rv
iva
l i
n b
el
giu
mb
el
gia
n C
an
Ce
r r
eg
ist
ry
3 0
4 Head and neck(iCD-10: C00-C14, C30-C32)
Head and neck cancers encompass
a broad range of sublocalisations,
including lip, oral cavity, oropharynx,
hypopharynx, nasopharynx, larynx,
nasal cavity, paranasal sinuses and sali-
vary glands. The vast majority of these
tumours are squamous cell carcinoma
and are associated with a history of
smoking and alcohol use. This is not
the case for cancers of the paranasal
sinuses or salivary gland, which mostly
consist of mixed cell types. In addi-
tion, tumours of the nose or para-
nasal sinuses have been linked with
occupational and chemical exposures.
Infection with human papilloma virus
is now also accepted as a contribut-
ing risk factor for the development of
oropharyngeal cancers [34].
Although incidence rates of head and
neck cancer in females are increasing
(Flemish Region 1999-2008), the dis-
ease still occurs preferentially in males
(male/female ratio in 2008: 3.7). Head
taBle 6 - head and neCk CanCer: oBserved and relative survival By sex in Belgium (2004-2008) and in the flemish region (1999-2008)
n at risk observed survival (%) relative survival (%) asrs*(%)
1 year 3 year 5 year 10 year 1 year 3 year 5 year 10 year 5 year
Belgium
Males 8,454 76.6 55.1 44.6 78.4 58.7 50.0 50.6
Females 2,473 78.8 60.4 52.0 80.5 63.7 57.0 54.8
Flemish Region
Males 8,838 77.8 56.9 45.9 29.9 79.7 61.0 52.0 39.5
Females 2,245 78.7 60.1 51.9 38.1 80.6 64.0 57.4 48.1
*ASRS: Age-standardised relative survival
Source: Belgian Cancer Registry
and neck cancers represent 6.0% of all
cancers in males and 2.1% in females.
Mortality from these malignancies
is not negligible, especially in males
where they represent the 5th most
frequent cause of cancer death.
For newly diagnosed cases in 2004-
2008, the 5-year relative survival rate
is 50.0% and 57.0%, in males and
females respectively. Most deaths
related to head and neck cancer occur
within the first three years after diag-
nosis (3-year relative survival of 58.7%
in males and 63.7% in females;
Table 6, Figure 14). However, beyond
the 5-year period, relative survival
for head and neck cancer patients
further decreases to reach about
39.5% in males and 48.1% in females
at 10 years after diagnosis (Flemish
Region, incidence years 1999-2008;
Table 6, Figure 15). It must be taken
into account that patients diagnosed
with head and neck cancer are at high
risk of developing second primary
tumours that can impair their chances
of survival.
In both sexes, 5-year relative survival
rates are the highest in the Flemish
Region (53.7% in males, 58.5% in
females), followed by the Walloon
Region (46.4% in males, 56.4% in
females) and the Brussels-Capital
Region (44.6% in males, 52.2% in
females) (Table 7).
In females, 5-year relative survival
clearly decreases with age, resulting
in 71.4% for the 15-49 years age
group, 55.8% for the 50-74 years age
group and 47.8% for the 75+ years
age group. In contrast, no substan-
tial differences in relative survival are
observed for the different age groups
in males (5-year relative survival of
52.2%, 49.2% and 50.5%, for the
15-49, 50-74, and 75+ age groups
respectively; Figure 16, Figure 17).
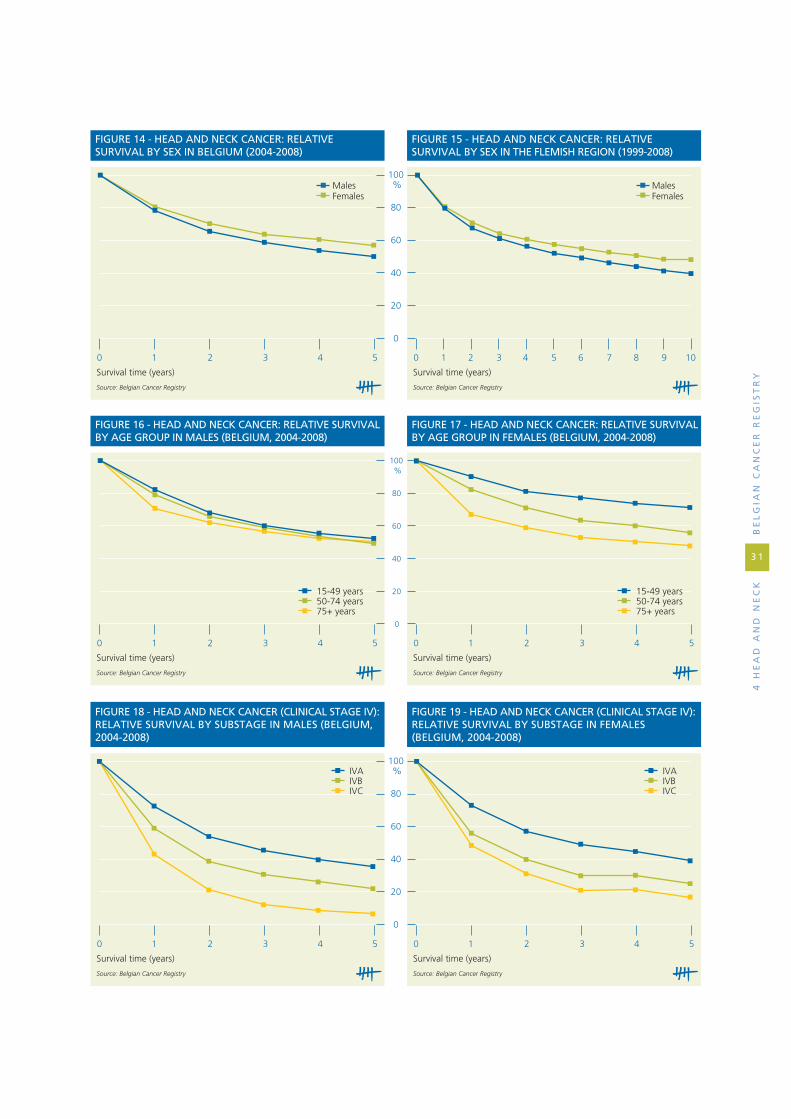
4 h
ea
d a
nd
ne
Ck
Be
lg
ian
Ca
nC
er
re
gis
tr
y
3 1
0 1 2 3 4 5
100
80
60
40
20
0
%
0 1 2 3 4 5 6 7 8 9 10
Survival time (years)
FIGURE 14 - HEAD AND NECK CANCER: RELATIVE SURVIVAL BY SEX IN BELGIUM (2004-2008)
MalesFemales
MalesFemales
Source: Belgian Cancer Registry
Survival time (years)
FIGURE 15 - HEAD AND NECK CANCER: RELATIVE SURVIVAL BY SEX IN THE FLEMISH REGION (1999-2008)
Source: Belgian Cancer Registry
0 1 2 3 4 5 0 1 2 3 4 5
100
80
60
40
20
0
%
Survival time (years)
FIGURE 16 - HEAD AND NECK CANCER: RELATIVE SURVIVAL BY AGE GROUP IN MALES (BELGIUM, 2004-2008)
15-49 years50-74 years75+ years
15-49 years50-74 years75+ years
Source: Belgian Cancer Registry
Survival time (years)
FIGURE 17 - HEAD AND NECK CANCER: RELATIVE SURVIVAL BY AGE GROUP IN FEMALES (BELGIUM, 2004-2008)
Source: Belgian Cancer Registry
0 1 2 3 4 5 0 1 2 3 4 5
100
80
60
40
20
0
%
Survival time (years)
FIGURE 18 - HEAD AND NECK CANCER (CLINICAL STAGE IV): RELATIVE SURVIVAL BY SUBSTAGE IN MALES (BELGIUM, 2004-2008)
IVAIVBIVC
IVAIVBIVC
Source: Belgian Cancer Registry
Survival time (years)
FIGURE 19 - HEAD AND NECK CANCER (CLINICAL STAGE IV): RELATIVE SURVIVAL BY SUBSTAGE IN FEMALES (BELGIUM, 2004-2008)
Source: Belgian Cancer Registry

Ca
nC
er
su
rv
iva
l i
n b
el
giu
mb
el
gia
n C
an
Ce
r r
eg
ist
ry
3 2
taBle 7 - head and neCk CanCer: relative survival By region and sex (Belgium, 2004-2008)
n at risk relative survival (%)
n % 1 year 3 year 5 year
Males
Brussels-Capital Region 775 9.2 75.5 53.3 44.6
Flemish Region 4,439 52.5 80.3 62.4 53.7
Walloon Region 3,240 38.3 76.5 55.0 46.4
Females
Brussels-Capital Region 259 10.5 77.4 59.9 52.2
Flemish Region 1,218 49.3 81.1 64.8 58.5
Walloon Region 996 40.3 80.7 63.5 56.4
Source: Belgian Cancer Registry
taBle 8 - head and neCk CanCer: relative survival By CliniCal stage and sex (Belgium, 2004-2008)
n at risk relative survival (%)
n % 1 year 3 year 5 year
Males
Stage I 916 12.5 98.1 90.6 82.4
Stage II 802 11.0 92.6 73.1 63.9
Stage III 905 12.4 84.2 63.1 53.5
Stage IV 2,343 32.1 68.1 40.5 31.0
Stage X 2,337 32.0 78.6 63.2 55.2
Females
Stage I 262 12.3 97.2 86.2 77.5
Stage II 249 11.7 86.4 69.3 63.6
Stage III 246 11.6 85.0 64.0 57.3
Stage IV 566 26.6 69.8 45.4 36.1
Stage X 805 37.8 82.7 71.6 67.4
Note: TNM stage was not applicable in 1,144 males and 342 females; 7 males and 3 females have a clinical stage 0. These data were excluded for the analysis.
Source: Belgian Cancer Registry
These results show that the survival
advantage in females when compared
with males decreases with age.
Clinical stage of the disease is
especially important to select initial
treatment and can also serve as a
prognostic factor for survival in head
and neck cancer when pTNM is not
available. Survival for small tumours
without lymph node invasion (cStage I)
is relatively good (82.4% in males
and 77.5% in females). The more
the disease is locally and/or regionally
extended, the poorer the prognosis
becomes (Table 8).
Head and neck cancer is a disease
characterised by locoregional exten-
sion rather than distant metastasis.
In contrast with other cancers, some
locally or regionally advanced diseases
are also categorised as stage IV (IVA
or B). Stage IV disease is not always
designated incurable, especially in the
absence of distant metastases (stage
IVC). Consequently, 5-year survival
rates for stage IV disease may be
somewhat higher than for other can-
cer types (31.0% in males and 36.1%
in females). More detailed analyses
by substage reveal that within stage
IV, survival rates range from 35.4%
and 38.9% in stage IVA to 6.3% and
16.6% in stage IVC, in males and
females respectively (Figure 18, Figure
19). Stage IV cancers represent by far
the most frequently diagnosed stage
of head and neck cancers (47.2% of
cases with known stage in males and
42.8% in females), and stage IVA is
the most common substage (78.6%
of stage IV in males and 84.3% in
females). With reference to the sex-
dependent differences in survival,
males have a somewhat better prog-
nosis for stage I and II head and neck
cancer, while females perform better
for stages III and IV.
Another important determinant for
survival is the sublocalisation in which
head and neck cancers originate
(Table 9). Of all head and neck cancer
sublocalisations, cancer of the lip has
the best prognosis, reaching a 5-year
relative survival of 86.6% in males and
99.6% in females.
Poorest survival is noted for cancers of
the hypopharynx, with a 5-year relative
survival of 25.6% in males and 34.7%
in females. These cancers are character-
ised by a late onset of symptoms and are
therefore often diagnosed in advanced
stages; stage III and IV cancers account
for 91.5% of cases with known stage in
males and 83.3% in females.

taBle 9 - head and neCk CanCer: relative survival By suBloCalisation and sex (Belgium, 2004-2008)
males females
n at risk relative survival (%) n at risk relative survival (%)
n 1 year 3 year 5 year n 1 year 3 year 5 year
Lip and oral cavity 2,217 78.2 59.4 51.5 920 80.6 65.5 60.2
Lip 224 96.7 94.1 86.6 81 98.4 93.0 99.6
Tongue 753 74.9 52.5 45.9 303 78.7 62.1 55.3
Gum 151 71.4 55.2 50.5 117 71.7 56.8 53.5
Floor of mouth 691 78.6 58.8 47.3 185 80.1 63.0 56.6
Hard palate and palate unspecified 96 76.8 56.7 50.2 72 90.8 79.1 77.7
Mouth, NOS 302 75.8 56.3 51.0 162 78.0 61.3 51.8
Pharynx 2,792 72.5 47.6 37.3 736 79.0 57.5 51.3
Oropharynx 1,752 74.2 50.8 40.9 548 79.9 60.2 53.5
Base of tongue 322 71.7 47.6 39.8 87 75.9 51.7 46.8
Soft palate and uvula 171 84.9 64.6 48.3 63 92.8 76.5 68.8
Tonsil 783 77.1 53.9 45.3 280 81.1 63.5 56.7
Oropharynx, other and unspecified 476 67.4 43.0 31.9 118 73.2 49.7 42.5
Nasopharynx 173 86.4 67.8 60.0 51 87.4 77.0 72.9
Hypopharynx 867 66.2 37.1 25.6 137 72.3 39.7 34.7
Pyriform sinus 591 68.8 38.7 26.3 78 77.8 35.6 30.6
Hypopharynx 276 60.7 33.6 23.9 59 65.1 45.2 40.0
Larynx 2,631 84.9 69.1 61.8 374 83.2 65.9 58.1
Glottis 1,438 93.2 82.2 76.2 152 92.2 84.2 81.4
Supraglottis 668 78.3 55.3 43.6 126 81.0 54.4 37.8
Nasal Cavity and Paranasal Sinuses 377 81.7 66.2 56.0 143 75.3 61.7 45.0
Nasal cavity and middle ear 102 88.3 75.8 64.0 67 83.9 71.4 53.4
Accesory sinuses 275 79.3 62.7 53.1 76 67.7 52.9 37.8
Salivary Glands 303 83.0 68.8 59.4 256 85.8 77.5 71.3
Parotid gland 225 82.9 69.0 59.6 183 85.4 75.8 69.9
Salivary glands, NOS 78 83.4 68.4 59.1 73 86.9 81.8 74.8
Lip, oral cavity and pharynx, NOS 134 57.0 33.8 26.2 44 67.4 41.3 30.2
Head and neck cancer 8,454 78.4 58.7 50.0 2,473 80.5 63.7 57.0
Source: Belgian Cancer Registry
Concerning laryngeal cancer, an
important distinction needs to be
made between glottic and supraglot-
tic cancer. Cancer of the vocal cords
(glottic cancer) usually causes hoarse-
ness and is therefore often recognised
in earlier stage (50.8% of cases with
known clinical stage are stage I). In
addition, the lymphatic network of the
vocal cords is very limited, preventing
the cancer from spreading to regional
lymph nodes. These factors contrib-
ute to the good prognosis of glottic
cancer, reaching a 5-year relative
survival of 76.2% in males and 81.4%
in females. In contrast to the glottis,
the supraglottic region is drained by
an abundant network of lymphatic
vessels; cancers originating from this
region often present with adenopathy
(78.5% of cases with known clinical
stage are stage III/IV), resulting in a
5-year relative survival rate of 43.6%
in males and 37.8% in females.
As the oropharynx is extremely rich
in lymphatics, cancers originating
from this region also often present
with affected lymph nodes. Of all
oropharyngeal cancers with known
4 h
ea
d a
nd
ne
Ck
Be
lg
ian
Ca
nC
er
re
gis
tr
y
3 3

Ca
nC
er
su
rv
iva
l i
n b
el
giu
mb
el
gia
n C
an
Ce
r r
eg
ist
ry
3 4
taBle 10 - oropharyngeal CanCer: relative survival By CliniCal stage and sex (Belgium, 2004-2008)
n at risk relative survival (%)
n % 1 year 3 year 5 year
Males
Stage I 56 4.0 90.4 77.7 64.2
Stage II 114 8.1 89.1 68.7 55.5
Stage III 227 16.2 84.9 61.3 51.0
Stage IV 643 45.9 71.3 45.9 37.9
Stage X 361 25.8 74.9 53.3 42.3
Females
Stage I 28 6.3 * * *
Stage II 48 10.8 86.8 67.0 69.2
Stage III 81 18.2 87.7 62.8 60.0
Stage IV 161 36.3 72.3 49.7 41.3
Stage X 126 28.4 82.9 71.2 63.1
Note: TNM Stage was not applicable in 349 males and 103 females; 2 males and 1 female have a clinical stage 0. These data were excluded for the analysis.
*Results not displayed due to less than 35 cases
Source: Belgian Cancer Registry
stage, stage III and IV disease are most
common (83.7% in males and 76.1%
in females). However, 5-year relative
survival remains relatively good rang-
ing from 64.2% in stage I to 37.9%
in stage IV in males (Table 10). Survival
rates for females are not mentioned
because of too low numbers at risk for
stage I.

5 d
ige
st
ive
tr
aC
tB
el
gia
n C
an
Ce
r r
eg
ist
ry
3 5
5.1 oESophAgUS (iCD-10: C15-C16.02)
Although the incidence of oesopha-
geal cancer is rather low, ranking 11th
in males and even lower in females
in 2008, its aggressive behaviour is
responsible for a substantial number
of cancer deaths. In Belgium, 3.4% of
all cancer deaths in males and 1.4%
in females are caused by oesophageal
cancer. This cancer type has been asso-
ciated with alcohol, smoking, obesity
and reflux disease. The mean age at
diagnosis is 66 years in males and
70 years in females. In the remainder
of this chapter, cancers originating
from the gastro-oesophageal junction
are included in the survival analyses
as they are considered to be similar
to cancers of the oesophagus from a
clinical point of view.
For the incidence years 2004-2008,
survival rapidly decreases after
diagnosis; almost half of patients die
within the first year (1-year relative
survival of 55.1% in males and 51.1%
in females). After one year, survival
continues to decrease to reach a
5-year relative survival rate of 22.8%
in males and 22.7% in females (Table
11, Figure 20). Data for the Flemish
Region (incidence years 1999-2008)
show a further decline until 10 years
after diagnosis, with a 10-year relative
survival of 17.3% in males and 18.8%
in females (Figure 21). Throughout the
follow-up period, only minor differ-
ences in survival are noticed between
both sexes.
Five-year relative survival rates in males
are 20.3% for the Brussels-Capital
Region3, 23.2% for the Flemish Region
and 22.6% for the Walloon Region.
Rates are similar in females: 18.8% for
the Brussels-Capital Region3, 24.5%
for the Flemish Region, and 20.9% for
the Walloon Region (Table 12).
The relative survival of oesophageal
cancer is inversely related to the age
of the patient. In both males and
females, the 5-year relative survival is
the poorest for patients of 65 years
and older (19.4% in males and 19.8%
5 Digestive tract
taBle 11 - oesophageal CanCer: oBserved and relative survival By sex in Belgium (2004-2008) and in the flemish region (1999-2008)
n at risk observed survival (%) relative survival (%) asrs*(%)
1 year 3 year 5 year 10 year 1 year 3 year 5 year 10 year 5 year
Belgium
Males 3,905 53.4 26.5 19.9 55.1 28.7 22.8 22.4
Females 1,302 49.3 26.1 19.8 51.1 28.3 22.7 24.6
Flemish Region
Males 4,333 51.9 26.0 19.6 12.7 53.7 28.2 22.4 17.3
Females 1,339 47.3 26.9 20.3 13.7 49.2 29.4 23.5 18.8
*ASRS: Age-standardised relative survival
Source: Belgian Cancer Registry
2 Gastro-oesophageal junction was selected based on ICD-10 C16.0. For more details, see methodology section. 3 The survival rates for the Brussels-Capital Region should be interpreted with caution due to the low numbers at risk in this region after some years of follow-up.

Ca
nC
er
su
rv
iva
l i
n b
el
giu
mb
el
gia
n C
an
Ce
r r
eg
ist
ry
3 6
in females), while younger patients
(15-64 years old) have a better prog-
nosis (5-year relative survival 26.2% in
males and 28.0% in females; Figure
22, Figure 23).
Survival rates decrease with a higher
stage at diagnosis. Five-year relative
survival rates vary between 67.5%
for stage I and 4.5% for stage IV in
males, and between 76.5% for stage
I and 4.9% for stage IV in females
(Table 13). In both males and females,
relative survival is much better for
stage I than for other stages, but only
a minority of patients are diagnosed
with this stage (16.3% of all cases
with known stage in males and
16.7% in females). The large propor-
tion of patients with advanced stages
(61.4% of cases with known stage are
stage III and IV in males and 55.0%
in females), may partially explain the
poor overall survival for oesophageal
cancer.
The histological subtype of oesopha-
geal cancer can also influence the
prognosis, in males more than in
females (Figure 24, Figure 25).
Adenocarcinoma in males have a
clear survival benefit over squamous
cell carcinoma (5-year relative survival
rates of 26.8% versus 16.1%). This
is not the case in females, where
similar survival rates are observed for
both histology groups (5-year relative
survival rate of 21.6% for adenocar-
cinoma and 22.5% for squamous cell
taBle 13 - oesophageal CanCer: relative survival By stage and sex (Belgium, 2004-2008)
n at risk relative survival (%)
n % 1 year 3 year 5 year
Males
Stage I 470 12.1 87.6 76.0 67.5
Stage II 640 16.5 70.9 42.3 34.8
Stage III 764 19.7 59.7 25.4 17.5
Stage IV 1,002 25.8 40.3 8.3 4.5
Stage X 1,010 26.0 41.0 20.3 16.0
Females
Stage I 143 11.1 89.0 76.7 76.5
Stage II 243 18.9 64.3 36.1 28.5
Stage III 239 18.5 56.7 30.1 19.0
Stage IV 232 18.0 38.4 8.7 4.9
Stage X 432 33.5 33.1 15.6 11.9
Note: TNM stage was not applicable in 19 males and 13 females (data excluded).
Source: Belgian Cancer Registry
taBle 12 - oesophageal CanCer: relative survival By region and sex (2004-2008)
n at risk relative survival (%)
n % 1 year 3 year 5 year
Males
Brussels-Capital Region 268 6.9 51.8 27.5 20.3
Flemish Region 2,318 59.4 56.2 29.6 23.2
Walloon Region 1,319 33.8 54.1 27.4 22.6
Females
Brussels-Capital Region 131 10.1 45.8 23.2 18.8
Flemish Region 713 54.8 51.5 30.8 24.5
Walloon Region 458 35.2 52.1 25.9 20.9
Source: Belgian Cancer Registry
carcinoma). The resulting histology-
dependent survival difference by sex
(advantage in females for squamous
cell carcinoma and in males for adeno-
carcinoma) has been studied in other
publications [35]. In both sexes, cases
with unknown or unspecified histology
have the lowest 5-year relative survival
rates (14.6% in males and 6.0% in
females).

0 1 2 3 4 5
100
80
60
40
20
0
%
0 1 2 3 4 5 6 7 8 9 10
Survival time (years)
FIGURE 20 - OESOPHAGEAL CANCER: RELATIVE SURVIVAL BY SEX IN BELGIUM (2004-2008)
MalesFemales
MalesFemales
Source: Belgian Cancer Registry
Survival time (years)
FIGURE 21 - OESOPHAGEAL CANCER: RELATIVE SURVIVAL BY SEX IN THE FLEMISH REGION (1999-2008)
Source: Belgian Cancer Registry
0 1 2 3 4 5 0 1 2 3 4 5
100
80
60
40
20
0
%
Survival time (years)
FIGURE 22 - OESOPHAGEAL CANCER: RELATIVE SURVIVAL BY AGE GROUP IN MALES (BELGIUM, 2004-2008)
15-64 years65+ years
15-64 years65+ years
Source: Belgian Cancer Registry
Survival time (years)
FIGURE 23 - OESOPHAGEAL CANCER: RELATIVE SURVIVAL BY AGE GROUP IN FEMALES (BELGIUM, 2004-2008)
Source: Belgian Cancer Registry
0 1 2 3 4 5 0 1 2 3 4 5
100
80
60
40
20
0
%
Survival time (years)
FIGURE 24 - OESOPHAGEAL CANCER: RELATIVE SURVIVAL BY MORPHOLOGY IN MALES (BELGIUM, 2004-2008)
Source: Belgian Cancer Registry
Survival time (years)
FIGURE 25 - OESOPHAGEAL CANCER: RELATIVE SURVIVAL BY MORPHOLOGY IN FEMALES (BELGIUM, 2004-2008)
Source: Belgian Cancer Registry
Adenocarcinoma Squamous cell carcinoma Other and unspecified histology
Adenocarcinoma Squamous cell carcinoma Other and unspecified histology
5 d
ige
st
ive
tr
aC
tB
el
gia
n C
an
Ce
r r
eg
ist
ry
3 7

Ca
nC
er
su
rv
iva
l i
n b
el
giu
mb
el
gia
n C
an
Ce
r r
eg
ist
ry
3 8
5.2 SToMACh (iCD-10: C16.1-9)
Stomach cancer is the 9th most fre-
quent tumour in males (2.5% of all
cancer diagnoses) and the 15th most
frequent in females (1.8%) (Belgium,
incidence year 2008). This disease has
a male predominance (male/female
ratio of 2.1), and mainly affects older
people; the mean age at diagnosis
is 70 years in males and 72 years
in females. Looking at mortality in
2008, stomach cancer is the 9th most
frequent cause of cancer death both
in males (3.2%) and females (2.6%).
In Belgium, a decreasing evolution
in both mortality and incidence of
stomach cancer is seen over the last
decade. The descending trend is more
pronounced for mortality than for
incidence, also suggesting an improve-
ment in therapeutic approaches to this
cancer type. Much higher incidence
rates for stomach cancer are noticed
in other world regions such as Eastern
Asia [36]. In the remainder of this
chapter, survival analyses are presented
for stomach cancer, excluding cancer
of the gastro-oesophageal junction
which is incorporated in the chapter
on oesophageal cancer.
About two-thirds of patients
diagnosed with stomach cancer die
within the first three years after
diagnosis, obtaining 3-year relative
survival rates of 35.4% in males and
38.8% in females (Belgium, 2004-
2008; Table 14, Figure 26). After this
three-year follow-up period, survival
declines slightly further, resulting in
a 5-year relative survival of 32.6%
and 34.8% (Belgium, 2004-2008),
and a 10-year relative survival of
24.7% and 30.9% (Flemish Region,
1999-2008) in males and females
respectively (Table 14, Figure 26,
Figure 27).
Survival rates for stomach cancer
are comparable between the three
Belgian regions, both in males and in
females (Table 15).
The survival rate is inversely related
to age, with the lowest 5-year rela-
tive survival rates in patients of 75
years and older (24.4% in males and
26.2% in females) and the highest in
the 15-59 years age group (42.2%
in males and 48.2% in females). The
survival rate of the 60-74 years age
0 1 2 3 4 5
100
80
60
40
20
0
%
0 1 2 3 4 5 6 7 8 9 10
FIGURE 26 - STOMACH CANCER: RELATIVE SURVIVAL BY SEX IN BELGIUM (2004-2008)
FIGURE 27 - STOMACH CANCER: RELATIVE SURVIVAL BY SEX IN THE FLEMISH REGION (1999-2008)
MalesFemales
MalesFemales
Survival time (years)
Source: Belgian Cancer Registry
Survival time (years)
Source: Belgian Cancer Registry
0 1 2 3 4 5 0 1 2 3 4 5
100
80
60
40
20
0
%
FIGURE 28 - STOMACH CANCER: RELATIVE SURVIVAL BY AGE GROUP IN MALES (BELGIUM, 2004-2008)
FIGURE 29 - STOMACH CANCER: RELATIVE SURVIVAL BY AGE GROUP IN FEMALES (BELGIUM, 2004-2008)
Survival time (years)
Source: Belgian Cancer Registry
Survival time (years)
Source: Belgian Cancer Registry
15-59 years60-74 years75+ years
15-59 years60-74 years75+ years

taBle 14 - stomaCh CanCer: oBserved and relative survival By sex in Belgium (2004-2008) and in the flemish region (1999-2008)
n at risk observed survival (%) relative survival (%) asrs*(%)
1 year 3 year 5 year 10 year 1 year 3 year 5 year 10 year 5 year
Belgium
Males 2,685 51.1 30.9 26.1 53.9 35.4 32.6 34.3
Females 2,021 51.7 34.2 28.4 54.4 38.8 34.8 38.3
Flemish Region
Males 3,512 48.9 28.7 23.4 15.1 51.8 33.3 29.8 24.7
Females 2,643 50.6 32.9 27.2 19.4 53.6 37.9 34.0 30.9
*ASRS: Age-standardised relative survival
Source: Belgian Cancer Registry
taBle 15 - stomaCh CanCer: relative survival By region and sex (2004-2008)
n at risk relative survival (%)
n % 1 year 3 year 5 year
Males
Brussels-Capital Region 242 9.0 54.5 35.3 32.8
Flemish Region 1,644 61.2 54.2 36.2 33.3
Walloon Region 799 29.8 53.2 33.7 31.0
Females
Brussels-Capital Region 159 7.9 51.8 39.6 34.4
Flemish Region 1,265 62.6 54.2 38.7 35.0
Walloon Region 597 29.5 55.4 38.8 34.5
Source: Belgian Cancer Registry
taBle 16 - stomaCh CanCer: relative survival By stage and sex (Belgium, 2004-2008)
n at risk relative survival (%)
n % 1 year 3 year 5 year
Males
Stage I 479 18.7 86.4 78.2 76.7
Stage II 271 10.6 86.1 64.2 54.6
Stage III 347 13.5 60.3 28.6 22.5
Stage IV 653 25.5 31.1 6.7 5.1
Stage X 811 31.7 33.0 19.0 17.6
Females
Stage I 362 19.0 84.2 76.5 72.2
Stage II 198 10.4 72.7 53.7 43.9
Stage III 216 11.3 57.9 25.3 20.0
Stage IV 410 21.5 29.2 6.4 3.2
Stage X 721 37.8 41.5 30.4 28.3
Note: TNM stage was not applicable in 124 males and 114 females (data excluded).
Source: Belgian Cancer Registry
group is situated in between (35.5%
in males and 40.3% in females). As
can be observed from these rates,
the female survival advantage is most
apparent in the youngest age group
(Figure 28, Figure 29).
Survival also highly depends on the
tumour stage; the less advanced the
stage, the better the survival rate. Five-
year relative survival rates decrease
from 76.7% for stage I to 22.5% for
stage III in males, and from 72.2%
for stage I to 20.0% for stage III in
females. A large proportion of patients
are diagnosed with disseminated
disease (stage IV: 37.3% of cases with
known stage in males and 34.6%
in females), for which the prognosis
is very poor with a 5-year relative
survival of 5.1% in males and 3.2% in
females. Males have a better outcome
than females for all cases with known
stage, indicating that the global
survival advantage for females can be
attributed to the cases with unknown
stage. The largest sex difference is
observed in stage II tumours, with a
survival advantage of 10% in males
compared with females (5-year relative
survival of 54.6% in males and 43.9%
in females; Table 16).
5 d
ige
st
ive
tr
aC
tB
el
gia
n C
an
Ce
r r
eg
ist
ry
3 9

Ca
nC
er
su
rv
iva
l i
n b
el
giu
mb
el
gia
n C
an
Ce
r r
eg
ist
ry
4 0
A minority of the tumours included
in these survival analyses concern
gastrointestinal stromal tumours, or
GIST (4.0% in males and 5.1% in
females), with a much better progno-
sis than the commonly diagnosed
adenocarcinoma (5-year relative
survival of 87.9% versus 30.1% in
males and 93.5% versus 28.8% in
females; Figure 30, Figure 31).
0 1 2 3 4 5 0 1 2 3 4 5
100
80
60
40
20
0
%
FIGURE 30 - STOMACH CANCER: RELATIVE SURVIVAL BY MORPHOLOGY IN MALES (BELGIUM, 2004-2008)
FIGURE 31 - STOMACH CANCER: RELATIVE SURVIVAL BY MORPHOLOGY IN FEMALES (BELGIUM, 2004-2008)
Gastrointestinal stromal tumourAdenocarcinoma
Gastrointestinal stromal tumourAdenocarcinoma
Survival time (years)
Source: Belgian Cancer Registry
Survival time (years)
Source: Belgian Cancer Registry

5.3 Colon AnD RECTUM (iCD-10: C18-C20)
Colorectal cancer is the 3rd most
frequent cancer in males and the 2nd
in females. Meanwhile, this disease
ranks as the 2nd most frequent cause
of death by cancer in males and the 3rd
in females (Belgium, 2008). Colorectal
cancer preferentially affects men (male/
female ratio: 1.56 in 2008), and occurs
most commonly in patients of 65 years
and older (69.5% in males and 72.9%
in females in 2008). Given the ageing
of the population, colorectal cancer is
expected to remain an important health
problem for our society in the upcom-
ing years. This is reinforced by the
increasing incidence rates over the last
10 years in the Flemish Region in both
males and females [37].
Cancer of the colon and rectum are
presented separately in this booklet.
COLON AND RECTOSIGMOID JUNCTION (ICD-10: C18-C19)
Cancers of the colon and rectosigmoid
junction account for 68.2% of all
colorectal cancers in males and 73.9%
in females (Belgium, 2008). For newly
diagnosed cancers in Belgium between
2004 and 2008, 5-year relative survival
rates are 62.3% in males and 64.6%
in females (Table 17, Figure 32), with
little difference between the regions
(Table 18). From about 3-4 years after
diagnosis, females have a small survival
advantage in comparison with males,
resulting in 10-year relative survival
rates (Flemish Region, 1999-2008) of
55.6% in males and 58.5% in females
(Table 17, Figure 33).
In both sexes, an age-dependent
survival gradient is noted, with the best
survival rates for patients of 15-49 years
(5-year relative survival: 71.0% in
males and 74.7% in females), and the
worst survival rates for patients of 65
years and older (5-year relative survival:
59.8% in males and 62.7% in females;
Figure 34, Figure 35). The latter age
group represents 70.9% of all patients
in males and 76.1% in females.
Staging proves to be a very important
prognostic factor for survival in colon
cancer, both regarding the clinical and
pathological stages, without major dif-
ferences between the sexes. For clinical
stage, 5-year relative survival rates range
from 91.8% and 91.3% in stage I to
11.9% and 12.9% in stage IV in males
and females respectively (Figure 36, Figure
37). For pathological stage, the 5-year
relative survival estimates are 91.2% and
96.2% in stage I and 19.1% and 19.8%
in stage IV, in males and females respec-
tively (Figure 38, Figure 39).
Pathological staging performs better in
separating survival results for stage III
versus the lower stages: the 5-year rela-
tive survival for clinical stage III is 70.3%
in males and 66.4% in females and for
pathological stage III 56.5% in males
and 58.1% in females. This finding
reflects the difficulty of distinguishing
lymph-node negative from lymph-node
positive disease in the pre-operative set-
ting. Accordingly, the higher proportion
of stage III cases according to patholog-
ical (34.4% of cases with known stage
in males and 34.6% in females) versus
clinical (16.8% of cases with known
stage in males and 18.5% in females)
stage may be due to an upstaging of
cases after pathological lymph node
examination.
In comparison with the clinical stage,
the pathological stage is much more
available in the database of the Belgian
Cancer Registry (30.1% of cases with
known clinical stage and 79.6% with
known pathological stage). This is
not surprising, given the difficulties
encountered in interpreting imaging for
clinical staging of a colon cancer (for
0 1 2 3 4 5
100
80
60
40
20
0
%
0 1 2 3 4 5 6 7 8 9 10
FIGURE 32 - COLON CANCER: RELATIVE SURVIVAL BY SEX IN BELGIUM (2004-2008)
FIGURE 33 - COLON CANCER: RELATIVE SURVIVAL BY SEX IN THE FLEMISH REGION (1999-2008)
MalesFemales
MalesFemales
Survival time (years)
Source: Belgian Cancer Registry
Survival time (years)
Source: Belgian Cancer Registry
5 d
ige
st
ive
tr
aC
tB
el
gia
n C
an
Ce
r r
eg
ist
ry
4 1
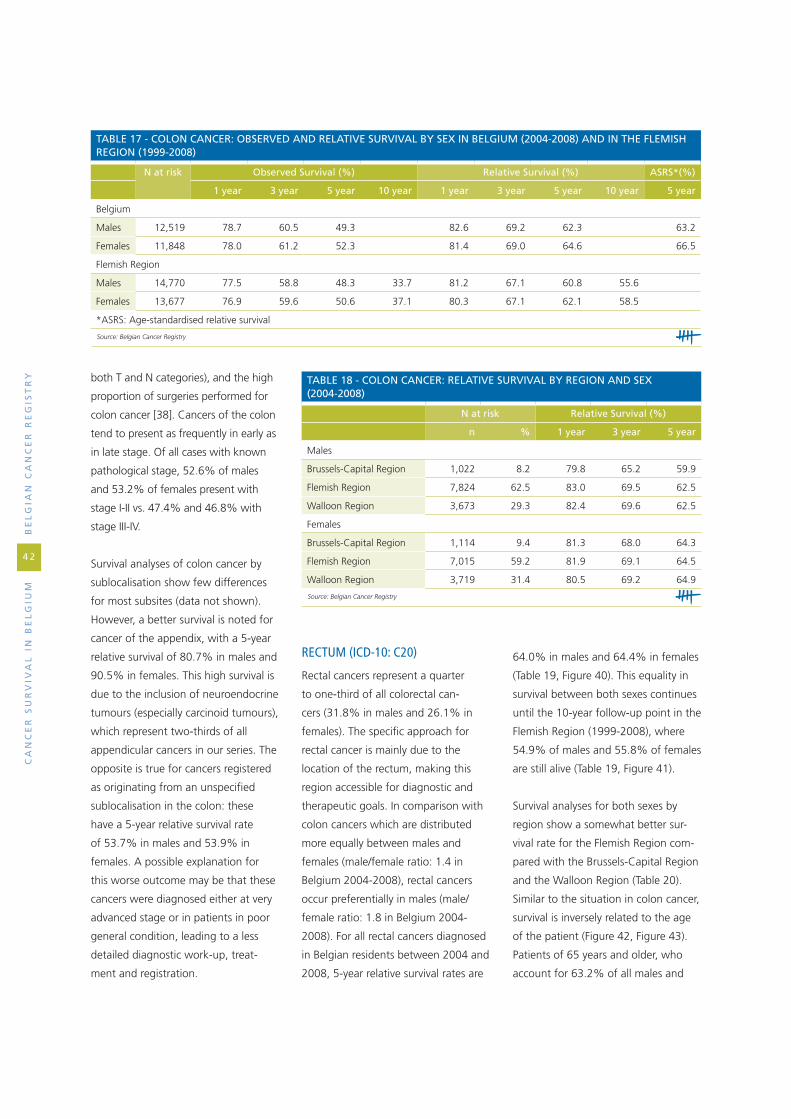
Ca
nC
er
su
rv
iva
l i
n b
el
giu
mb
el
gia
n C
an
Ce
r r
eg
ist
ry
4 2
both T and N categories), and the high
proportion of surgeries performed for
colon cancer [38]. Cancers of the colon
tend to present as frequently in early as
in late stage. Of all cases with known
pathological stage, 52.6% of males
and 53.2% of females present with
stage I-II vs. 47.4% and 46.8% with
stage III-IV.
Survival analyses of colon cancer by
sublocalisation show few differences
for most subsites (data not shown).
However, a better survival is noted for
cancer of the appendix, with a 5-year
relative survival of 80.7% in males and
90.5% in females. This high survival is
due to the inclusion of neuroendocrine
tumours (especially carcinoid tumours),
which represent two-thirds of all
appendicular cancers in our series. The
opposite is true for cancers registered
as originating from an unspecified
sublocalisation in the colon: these
have a 5-year relative survival rate
of 53.7% in males and 53.9% in
females. A possible explanation for
this worse outcome may be that these
cancers were diagnosed either at very
advanced stage or in patients in poor
general condition, leading to a less
detailed diagnostic work-up, treat-
ment and registration.
RECTUM (ICD-10: C20)
Rectal cancers represent a quarter
to one-third of all colorectal can-
cers (31.8% in males and 26.1% in
females). The specific approach for
rectal cancer is mainly due to the
location of the rectum, making this
region accessible for diagnostic and
therapeutic goals. In comparison with
colon cancers which are distributed
more equally between males and
females (male/female ratio: 1.4 in
Belgium 2004-2008), rectal cancers
occur preferentially in males (male/
female ratio: 1.8 in Belgium 2004-
2008). For all rectal cancers diagnosed
in Belgian residents between 2004 and
2008, 5-year relative survival rates are
64.0% in males and 64.4% in females
(Table 19, Figure 40). This equality in
survival between both sexes continues
until the 10-year follow-up point in the
Flemish Region (1999-2008), where
54.9% of males and 55.8% of females
are still alive (Table 19, Figure 41).
Survival analyses for both sexes by
region show a somewhat better sur-
vival rate for the Flemish Region com-
pared with the Brussels-Capital Region
and the Walloon Region (Table 20).
Similar to the situation in colon cancer,
survival is inversely related to the age
of the patient (Figure 42, Figure 43).
Patients of 65 years and older, who
account for 63.2% of all males and
taBle 17 - Colon CanCer: oBserved and relative survival By sex in Belgium (2004-2008) and in the flemish region (1999-2008)
n at risk observed survival (%) relative survival (%) asrs*(%)
1 year 3 year 5 year 10 year 1 year 3 year 5 year 10 year 5 year
Belgium
Males 12,519 78.7 60.5 49.3 82.6 69.2 62.3 63.2
Females 11,848 78.0 61.2 52.3 81.4 69.0 64.6 66.5
Flemish Region
Males 14,770 77.5 58.8 48.3 33.7 81.2 67.1 60.8 55.6
Females 13,677 76.9 59.6 50.6 37.1 80.3 67.1 62.1 58.5
*ASRS: Age-standardised relative survival
Source: Belgian Cancer Registry
taBle 18 - Colon CanCer: relative survival By region and sex (2004-2008)
n at risk relative survival (%)
n % 1 year 3 year 5 year
Males
Brussels-Capital Region 1,022 8.2 79.8 65.2 59.9
Flemish Region 7,824 62.5 83.0 69.5 62.5
Walloon Region 3,673 29.3 82.4 69.6 62.5
Females
Brussels-Capital Region 1,114 9.4 81.3 68.0 64.3
Flemish Region 7,015 59.2 81.9 69.1 64.5
Walloon Region 3,719 31.4 80.5 69.2 64.9
Source: Belgian Cancer Registry

0 1 2 3 4 5 0 1 2 3 4 5
100
80
60
40
20
0
%
Survival time (years)
FIGURE 34 - COLON CANCER: RELATIVE SURVIVAL BY AGE GROUP IN MALES (BELGIUM, 2004-2008)
Source: Belgian Cancer Registry
Survival time (years)
FIGURE 35 - COLON CANCER: RELATIVE SURVIVAL BY AGE GROUP IN FEMALES (BELGIUM, 2004-2008)
Source: Belgian Cancer Registry
15-49 years50-64 years65+ years
15-49 years50-64 years65+ years
0 1 2 3 4 5 0 1 2 3 4 5
100
80
60
40
20
0
%
Survival time (years)
Stage IStage IIStage IIIStage IVStage X
FIGURE 36 - COLON CANCER: RELATIVE SURVIVAL BY CLINICAL STAGE IN MALES (BELGIUM, 2004-2008)
Stage IStage IIStage IIIStage IVStage X
Source: Belgian Cancer Registry
Survival time (years)
FIGURE 37 - COLON CANCER: RELATIVE SURVIVAL BY CLINICAL STAGE IN FEMALES (BELGIUM, 2004-2008)
Source: Belgian Cancer Registry
0 1 2 3 4 5 0 1 2 3 4 5
100
80
60
40
20
0
%
Survival time (years)
Stage IStage IIStage IIIStage IVStage X
FIGURE 38 - COLON CANCER: 5-YEAR RELATIVE SURVIVAL BY PATHOLOGICAL STAGE IN MALES (BELGIUM, 2004-2008)
Stage IStage IIStage IIIStage IVStage X
Source: Belgian Cancer Registry
Survival time (years)
FIGURE 39 - COLON CANCER: 5-YEAR RELATIVE SURVIVAL BY PATHOLOGICAL STAGE IN FEMALES (BELGIUM, 2004-2008)
Source: Belgian Cancer Registry
5 d
ige
st
ive
tr
aC
tB
el
gia
n C
an
Ce
r r
eg
ist
ry
4 3

Ca
nC
er
su
rv
iva
l i
n b
el
giu
mb
el
gia
n C
an
Ce
r r
eg
ist
ry
4 4
67.5% of all females with rectal
cancer, achieve a survival of around
60.0% in both sexes.
Stage has an important influence on
survival. While the pathological stage
shows a clear gradient with poorer
prognosis for higher stages (Figure 44,
Figure 45), this effect is somewhat less
apparent in the analyses by clinical
stage, where clinical stage II has a poorer
outcome than clinical stage III: 73.8%
vs. 78.7% in males and 66.8% vs.
73.5% in females (Figure 46, Figure 47).
In common with colon cancer, this
observation shows that the pathological
stage is more accurate for estimating
prognosis than the clinical stage which is
initially used to guide treatment choice.
Indeed, the judgment on lymph-node
invasion enters as a diagnostic problem
typically for colorectal cancer [38;39].
On the other hand, results for survival
by pathological stage are also influenced
by the frequent practice of pre-operative
(neoadjuvant) therapy leading to down-
staging of the resected cancer. While
according to clinical stage, about 36.7%
of males and 40.5% of females with
known stage have stage I or II disease,
this proportion rises to 57.2% and
55.6% of pathological stage I or II dis-
ease in males and females respectively.
taBle 20 - reCtal CanCer: relative survival By region and sex (2004-2008)
n at risk relative survival (%)
n % 1 year 3 year 5 year
Males
Brussels-Capital Region 356 5.9 86.2 70.5 64.4
Flemish Region 3,924 65.5 86.9 73.9 66.0
Walloon Region 1,709 28.5 85.0 66.8 59.0
Females
Brussels-Capital Region 315 7.4 81.6 67.0 59.2
Flemish Region 2,603 61.0 87.4 73.8 66.0
Walloon Region 1,348 31.6 83.2 68.7 62.5
Source: Belgian Cancer Registry
taBle 19 - reCtal CanCer: oBserved and relative survival By sex in Belgium (2004-2008) and in the flemish region (1999-2008)
n at risk observed survival (%) relative survival (%) asrs*(%)
1 year 3 year 5 year 10 year 1 year 3 year 5 year 10 year 5 year
Belgium
Males 5,989 82.9 64.1 52.7 86.3 71.7 64.0 63.7
Females 4,266 82.7 65.3 54.9 85.6 71.7 64.4 66.2
Flemish Region
Males 7,537 82.8 64.1 52.8 36.6 86.2 71.8 63.9 54.9
Females 5,023 82.4 64.9 54.2 39.3 85.3 71.4 63.6 55.8
*ASRS: Age-standardised relative survival
Source: Belgian Cancer Registry
0 1 2 3 4 5
100
80
60
40
20
0
%
0 1 2 3 4 5 6 7 8 9 10
FIGURE 40 - RECTAL CANCER: RELATIVE SURVIVAL BY SEX IN BELGIUM (2004-2008)
FIGURE 41 - RECTAL CANCER: RELATIVE SURVIVAL BY SEX IN THE FLEMISH REGION (1999-2008)
MalesFemales
MalesFemales
Survival time (years)
Source: Belgian Cancer Registry
Survival time (years)
Source: Belgian Cancer Registry

0 1 2 3 4 5 0 1 2 3 4 5
100
80
60
40
20
0
%
Survival time (years)
FIGURE 42 - RECTAL CANCER: RELATIVE SURVIVAL BY AGE GROUP IN MALES (BELGIUM, 2004-2008)
15-49 years50-64 years65+ years
15-49 years50-64 years65+ years
Source: Belgian Cancer Registry
Survival time (years)
FIGURE 43 - RECTAL CANCER: RELATIVE SURVIVAL BY AGE GROUP IN FEMALES (BELGIUM, 2004-2008)
Source: Belgian Cancer Registry
0 1 2 3 4 5 0 1 2 3 4 5
100
80
60
40
20
0
%
Survival time (years)
Stage IStage IIStage IIIStage IVStage X
FIGURE 44 - RECTAL CANCER: RELATIVE SURVIVAL BY PATHOLOGICAL STAGE IN MALES (BELGIUM, 2004-2008)
Stage IStage IIStage IIIStage IVStage X
Source: Belgian Cancer Registry
Survival time (years)
FIGURE 45 - RECTAL CANCER: RELATIVE SURVIVAL BY PATHOLOGICAL STAGE IN FEMALES (BELGIUM, 2004-2008)
Source: Belgian Cancer Registry
0 1 2 3 4 5 0 1 2 3 4 5
100
80
60
40
20
0
%
Survival time (years)
Stage IStage IIStage IIIStage IVStage X
FIGURE 46 - RECTAL CANCER: RELATIVE SURVIVAL BY CLINICAL STAGE IN MALES (BELGIUM, 2004-2008)
Stage IStage IIStage IIIStage IVStage X
Source: Belgian Cancer Registry
Survival time (years)
FIGURE 47 - RECTAL CANCER: RELATIVE SURVIVAL BY CLINICAL STAGE IN FEMALES (BELGIUM, 2004-2008)
Source: Belgian Cancer Registry
5 d
ige
st
ive
tr
aC
tB
el
gia
n C
an
Ce
r r
eg
ist
ry
4 5

Ca
nC
er
su
rv
iva
l i
n b
el
giu
mb
el
gia
n C
an
Ce
r r
eg
ist
ry
4 6
5.4 livER (iCD-10: C22)
In Belgium, liver cancer is a rare
disease, occurring more frequently in
males than in females (male/female
ratio in 2008: 2.2), with a mean age
at diagnosis of 66 years in males and
68 years in females. In 2008, death
from liver cancer was the 10th most
frequent cause of death from cancer
in males, and the 8th in females.
However, as the liver is a frequent site
of metastasis, mortality statistics in
Belgium may partly suffer from over-
reporting on primary liver cancers that
are in fact metastasised diseases from
other primary locations.
General results by sex show no differ-
ence in survival between males and
females. The prognosis of liver cancer
is extremely poor. In newly diag-
nosed cases for the incidence years
2004-2008, survival rapidly decreases
after diagnosis; more than half of
the patients die within the first year,
reaching a 1-year relative survival
rate of 46.3% in males and 47.2% in
females. Afterwards, survival further
decreases to reach a 5-year rela-
tive survival rate of 20.7% in males
and 20.2% in females (Table 21,
Figure 48). The median observed
survival time is 290 days in males and
313 days in females. These survival
rates are rather high compared with
rates in other countries [40-42].
A different stage distribution pattern
might explain this phenomenon.
The 10-year relative survival analyses in
the Flemish Region (1999-2008) sug-
gest that even after five years, survival
rates of these patients further decrease
(Table 21, Figure 49). However, these
results should be interpreted with
caution due to the low number of
patients still alive five years after the
diagnosis. The results for the Flemish
Region suggest lower survival rates
for patients between 1999 and 2003
(data not shown) than for more recent
diagnoses (2004-2008). This may be
due to progression in diagnostic and
therapeutic approaches for this cancer
type.
For the period 2004-2008, survival
rates are approximately the same for
all three Belgian regions (Table 23)4.
Survival rates are inversely related
to age (Table 24). In both males and
females, patients of 60 years and
older have the poorest 5-year relative
survival (17.4% in males and 14.8%
in females). For younger patients
(15-59 years), relative survival is better
in females compared with males
0 1 2 3 4 5 0 1 2 3 4 5
100
80
60
40
20
0
%100
80
60
40
20
0
%
0 1 2 3 4 5 6 7 8 9 10
FIGURE 48 - LIVER CANCER: RELATIVE SURVIVAL BY SEX IN BELGIUM (2004-2008)
FIGURE 49 - LIVER CANCER: RELATIVE SURVIVAL BY SEX IN THE FLEMISH REGION (1999-2008)
FIGURE 50 - LIVER CANCER: RELATIVE SURVIVAL BY STAGE IN MALES (BELGIUM, 2004-2008)
Stage IStage IIStage IIIStage IVStage X
MalesFemales
MalesFemales
Survival time (years)
Source: Belgian Cancer Registry
Survival time (years)
Source: Belgian Cancer Registry
Survival time (years)
Source: Belgian Cancer Registry
4 The 5-year relative survival rates for the Brussels-Capital Region need to be interpreted with caution due to the low number of patients.

(5-year relative survival in males:
29.2%; in females: 37.7%).
As for other tumour types, stage is a
good prognostic indicator of survival.
While relative survival for stage I
disease is relatively good (5-year sur-
vival of 55.1% in males, 60.4% in
females), survival decreases rapidly
from stage II onwards and reaches a
5-year relative survival rate for stage
IV of 3.0% in males and 5.4% in
females (Figure 50, Figure 51)5. Most
liver cancers are diagnosed at an
advanced stage; stage III or IV disease
represent 61.3% of all cases with
known stage in males and 68.6% in
females. This repartition of cases in
more advanced stages partly explains
the poor prognosis of liver cancer.
The histological subtype of liver
cancer also influences survival (Figure
52, Figure 53). Within carcinoma
cases, cholangiocarcinoma have the
worst prognosis, independent of sex
(5-year relative survival rate of 12.5%
taBle 21 - liver CanCer: oBserved and relative survival By sex in Belgium (2004-2008) and in the flemish region (1999-2008)
n at risk observed survival (%) relative survival (%) asrs*(%)
1 year 3 year 5 year 10 year 1 year 3 year 5 year 10 year 5 year
Belgium
Males 1,479 45.0 25.7 18.2 46.3 27.7 20.7 19.4
Females 684 45.9 25.3 18.2 47.2 27.0 20.2 22.2
Flemish Region
Males 1,319 42.2 23.2 16.5 10.5 43.6 25.2 18.8 14.0
Females 795 39.5 21.1 14.2 8.3 41.0 22.8 16.2 10.2
*ASRS: Age-standardised relative survival
Source: Belgian Cancer Registry
0 1 2 3 4 5 0 1 2 3 4 5 0 1 2 3 4 5
100
80
60
40
20
0
%100
80
60
40
20
0
%
FIGURE 52 - LIVER CANCER: RELATIVE SURVIVAL BY MORPHOLOGY IN MALES (BELGIUM, 2004-2008)
FIGURE 53 - LIVER CANCER: RELATIVE SURVIVAL BY MORPHOLOGY IN FEMALES (BELGIUM, 2004-2008)
Cholangiocarcinoma Hepatocellular carcinoma Other and unspecified carcinoma
Cholangiocarcinoma Hepatocellular carcinoma Other and unspecified carcinoma
Survival time (years)
Source: Belgian Cancer Registry
Survival time (years)
Source: Belgian Cancer Registry
Survival time (years)
Source: Belgian Cancer Registry
FIGURE 51 - LIVER CANCER: RELATIVE SURVIVAL BY STAGE IN FEMALES (BELGIUM, 2004-2008)
Stage IStage IIStage IIIStage IVStage X
5 d
ige
st
ive
tr
aC
tB
el
gia
n C
an
Ce
r r
eg
ist
ry
4 7
5 The number of patients who survive more than one year is very low; the results must be interpreted with caution.

Ca
nC
er
su
rv
iva
l i
n b
el
giu
mb
el
gia
n C
an
Ce
r r
eg
ist
ry
4 8
in males and 14.1% in females),
while hepatocellular carcinoma have
a better relative survival in both
sexes: 22.7% of males and 24.5% of
females are alive 5 years after diagno-
sis. The hepatocellular carcinoma sub-
type is the most frequently occurring
carcinoma of the liver, representing
78.5% of all carcinoma cases in males
and 59.9% in females.
taBle 23 - liver CanCer: relative survival By region and sex (2004-2008)
n at risk relative survival (%)
n % 1 year 3 year 5 year
Males
Brussels-Capital Region 137 9.3 46.0 28.4 20.0
Flemish Region 765 51.7 46.4 27.5 20.5
Walloon Region 577 39.0 46.4 27.8 21.3
Females
Brussels-Capital Region 76 11.1 51.6 25.5 17.6
Flemish Region 394 57.6 45.9 26.5 20.1
Walloon Region 214 31.3 48.1 28.5 21.6
Source: Belgian Cancer Registry
taBle 24 - liver CanCer: relative survival By age group and sex (Belgium, 2004-2008)
n at risk relative survival (%)
n % 1 year 3 year 5 year
Males
15-59 years 394 26.6 56.4 37.1 29.2
60+ years 1,085 73.4 42.5 24.1 17.4
Females
15-59 years 152 22.2 65.3 46.8 37.7
60+ years 532 77.8 41.8 21.0 14.8
Source: Belgian Cancer Registry

5.5 gAllblADDER AnD biliARy TRACT (iCD-10: C23-C24)
Cancers of the gallbladder and the
biliary tract are uncommon. In 2008,
157 males and 185 females were
diagnosed with this cancer type, and
a mortality/incidence ratio of 0.45
in males and 0.48 in females was
recorded. The mean age at diagno-
sis is 70 years in males and 74 years
in females. While tumours of the
gallbladder are predominantly found
in females (male/female ratio 0.51),
tumours of the biliary tract are more
frequent in males (male/female ratio
1.75).
For newly diagnosed cases between
2004-2008, 1-year relative survival is
only 53.6% in males and 43.8% in
females. The 5-year relative survival is
22.5% in males and 19.5% in females
(Table 25, Figure 54). In contrast to
most cancers, males have a somewhat
better prognosis than females for this
cancer type. Looking at the 10-year
relative survival rates in the Flemish
Region (incidence years 1999-2008), it
appears that the survival rate remains
stable after 5 years, as only few
patients die from this cancer type at
later times after diagnosis (Table 25,
Figure 55).
Looking at the relative survival rates in
the three Belgian regions, the 5-year
relative survival is 25.0% in males
and 20.7% in females in the Flemish
Region, 21.9% in males and 16.2% in
females in the Brussels-Capital Region6
and 18.3% in males and 17.3% in
females in the Walloon Region (Table
26). These numbers show that the dif-
ference in the relative survival between
males and females is smaller in the
Walloon Region than in the other
regions.
Survival rates decrease somewhat with
the age of the patient; rates are higher
for patients in the 15-59 years group
than for patients of 60 years and
older, both in males and in females
(Figure 56, Figure 57). Although a
survival advantage in the younger
age group compared with the older
age group is apparent until four years
after diagnosis, it is less pronounced
after five years in both males and
females. The survival advantage in
males, described earlier, is noticed in
the eldest age group (5-year relative
survival of 21.7% vs. 18.6% in males
and females respectively), whereas in
younger patients, relative survival rates
are equal for both sexes (5-year rela-
tive survival of 26.0% in both males
and females).
As for other cancer types, survival also
depends on the stage of the disease.
Five-year relative survival decreases
with each stage in both males and
females (Figure 58, Figure 59). While
5-year relative survival of patients
diagnosed with a stage I disease is
relatively high (58.3% in males and
49.6% in females), relative survival
rapidly decreases from stage II onwards.
For patients diagnosed with stage IV,
almost all patients die within the first
three years, which results in a poorly
interpretable 5-year relative survival
rate. Results for stage III are somewhat
remarkable: on the one hand, this stage
is rare in comparison with the other
stages (10.1% of all cases with known
stage in males and 10.0% in females);
taBle 25 - CanCer of the gallBladder and Biliary traCt: oBserved and relative survival By sex in Belgium (2004-2008) and in the flemish region (1999-2008)
n at risk observed survival (%) relative survival (%) asrs*(%)
1 year 3 year 5 year 10 year 1 year 3 year 5 year 10 year 5 year
Belgium
Males 687 51.2 24.8 18.7 53.6 27.8 22.5 23.4
Females 809 42.0 21.3 16.5 43.8 23.6 19.5 22.8
Flemish Region
Males 708 51.6 26.1 20.9 16.8 54.0 29.2 25.0 25.0
Females 938 41.1 22.0 17.5 12.9 42.9 24.6 20.8 18.6
*ASRS: Age-standardised relative survival
Source: Belgian Cancer Registry
6 The results for the Brussels-Capital Region should be interpreted cautiously because of low numbers at risk for this region.
5 d
ige
st
ive
tr
aC
tB
el
gia
n C
an
Ce
r r
eg
ist
ry
4 9

Ca
nC
er
su
rv
iva
l i
n b
el
giu
mb
el
gia
n C
an
Ce
r r
eg
ist
ry
5 0
0 1 2 3 4 5
100
80
60
40
20
0
%
0 1 2 3 4 5 6 7 8 9 10
Survival time (years)
FIGURE 54 - CANCER OF THE GALLBLADDER AND BILIARY TRACT: RELATIVE SURVIVAL BY SEX IN BELGIUM (2004-2008)
MalesFemales
MalesFemales
Source: Belgian Cancer Registry
Survival time (years)
FIGURE 55 - CANCER OF THE GALLBLADDER AND BILIARY TRACT: RELATIVE SURVIVAL BY SEX IN THE FLEMISH REGION (1999-2008)
Source: Belgian Cancer Registry
0 1 2 3 4 5 0 1 2 3 4 5
100
80
60
40
20
0
%
Survival time (years)
FIGURE 56 - CANCER OF THE GALLBLADDER AND BILIARY TRACT: RELATIVE SURVIVAL BY AGE GROUP IN MALES (BELGIUM, 2004-2008)
15-59 years60+ years
15-59 years60+ years
Source: Belgian Cancer Registry
Survival time (years)
FIGURE 57 - CANCER OF THE GALLBLADDER AND BILIARY TRACT: RELATIVE SURVIVAL BY AGE GROUP IN FEMALES (BELGIUM, 2004-2008)
Source: Belgian Cancer Registry
0 1 2 3 4 5 0 1 2 3 4 5
100
80
60
40
20
0
%
Survival time (years)
Stage IStage IIStage IIIStage IVStage X
FIGURE 58 - CANCER OF THE GALLBLADDER AND BILIARY TRACT: RELATIVE SURVIVAL BY STAGE IN MALES (BELGIUM, 2004-2008)
Stage IStage IIStage IIIStage IVStage X
Source: Belgian Cancer Registry
Survival time (years)
FIGURE 59 - CANCER OF THE GALLBLADDER AND BILIARY TRACT: RELATIVE SURVIVAL BY STAGE IN FEMALES (BELGIUM, 2004-2008)
Source: Belgian Cancer Registry

and on the other hand, survival rates
for stage III are very close to those for
stage II disease, especially in males
(5-year relative survival rate is 24.6%
for stage III and 26.4% for stage II).
The recent changes in the TNM clas-
sification and the related debates on
these changes for this type of cancer
may be associated with these observa-
tions [43].
Survival analysis for cancer of the
gallbladder and the biliary tract by
sublocalisation shows higher 5-year
relative survival rates for cancers of
the ampulla of Vater (males: 39.4%,
females: 36.9%), compared with can-
cers of other sublocalisations where
5-year relative survival is only 20% or
less. For most sublocalisations, survival
rates are comparable between males
and females (Figure 60, Figure 61),
except for cancers of the extrahepatic
biliary tract, which have a 5-year rela-
tive survival of 18.2% in males and
only 7.4% in females. Knowing that
cancers of the extrahepatic biliary tract
represent approximately one-third
of all cancers of the gallbladder and
the biliary tract (37.8% in males and
30.3% in females), this finding may
contribute to understanding the worse
overall survival rate for cancers of the
gallbladder and the biliary tract in
females compared with males.
taBle 26 - CanCer of the gallBladder and Biliary traCt: relative survival By region and sex (2004-2008)
n at risk relative survival (%)
n % 1 year 3 year 5 year
Males
Brussels-Capital Region 52 7.6 45.1 22.6 21.9
Flemish Region 422 61.4 53.7 29.4 25.0
Walloon Region 213 31.0 55.5 25.8 18.3
Females
Brussels-Capital Region 61 7.5 40.7 21.4 16.2
Flemish Region 523 64.6 44.2 24.5 20.7
Walloon Region 225 27.8 43.5 22.0 17.3
Source: Belgian Cancer Registry
Survival time (years)
Source: Belgian Cancer Registry
Survival time (years)
Source: Belgian Cancer Registry
0 1 2 3 4 5 0 1 2 3 4 5
100
80
60
40
20
0
%Ampulla of Vater Extrahepatic bile ducts Gallbladder Intrahepatic bile ducts Biliary tract, NOS
Ampulla of Vater Extrahepatic bile ducts Gallbladder Intrahepatic bile ducts Biliary tract, NOS
FIGURE 60 - CANCER OF THE GALLBLADDER AND BILIARY TRACT: RELATIVE SURVIVAL BY SUBLOCALISA-TION IN MALES (BELGIUM, 2004-2008)
FIGURE 61 - CANCER OF THE GALLBLADDER AND BILIARY TRACT: RELATIVE SURVIVAL BY SUBLOCALISA-TION IN FEMALES (BELGIUM, 2004-2008)
5 d
ige
st
ive
tr
aC
tB
el
gia
n C
an
Ce
r r
eg
ist
ry
5 1

Ca
nC
er
su
rv
iva
l i
n b
el
giu
mb
el
gia
n C
an
Ce
r r
eg
ist
ry
5 2
5.6 pAnCREAS (iCD-10: C25)
Although pancreatic cancer is not a
very common disease, ranking 13th
in males and 10th in females, its fatal
character renders this cancer type
responsible for 5.0% of all cancer
deaths in males and 6.3% in females
(Belgium, 2008). The mortality/inci-
dence ratio is higher than 1 in both
males and females, which is most
probably due to an under-registration
of clinically diagnosed patients with
pancreatic cancer. The mean age at
diagnosis is 68 years in males and
70 years in females.
Relative survival (incidence years 2004-
2008) declines steeply after diagnosis
to reach a 1-year relative survival of
34.1% and 34.7%, and a 5-year
relative survival of 9.9% and 9.0%
in males and females respectively
(Table 27, Figure 62). Data for the
Flemish Region (1999-2008) show a
small further decrease after 5 years of
survival, obtaining 10-year relative sur-
taBle 28 - panCreatiC CanCer: relative survival By region and sex (2004-2008)
n at risk relative survival (%)
n % 1 year 3 year 5 year
Males
Brussels-Capital Region 219 8.3 34.1 10.6 7.8
Flemish Region 1,514 57.5 33.6 13.9 10.1
Walloon Region 901 34.2 34.9 13.8 10.1
Females
Brussels-Capital Region 216 8.6 30.6 7.9 6.7
Flemish Region 1,416 56.6 35.0 12.7 9.4
Walloon Region 868 34.7 35.2 11.3 8.9
Source: Belgian Cancer Registry
taBle 29 - panCreatiC CanCer: relative survival By age group and sex (Belgium, 2004-2008)
n at risk relative survival (%)
n % 1 year 3 year 5 year
Males
15-59 years 671 25.5 45.3 22.0 16.5
60-74 years 1,221 46.4 34.8 13.1 9.2
75+ years 742 28.2 22.0 5.8 4.0
Females
15-59 years 455 18.2 55.3 28.1 22.5
60-74 years 1,015 40.6 38.8 10.5 7.0
75+ years 1,030 41.2 20.6 5.3 4.6
Source: Belgian Cancer Registry
taBle 27 - panCreatiC CanCer: oBserved and relative survival By sex in Belgium (2004-2008) and in the flemish region (1999-2008)
n at risk observed survival (%) relative survival (%) asrs*(%)
1 year 3 year 5 year 10 year 1 year 3 year 5 year 10 year 5 year
Belgium
Males 2,634 32.9 12.6 8.7 34.1 13.6 9.9 10.1
Females 2,500 33.6 11.1 8.1 34.7 11.8 9.0 11.3
Flemish Region
Males 2,844 30.1 11.4 8.0 6.0 31.3 12.5 9.1 8.0
Females 2,756 29.8 10.6 7.7 5.5 30.9 11.5 8.7 7.4
*ASRS: Age-standardised relative survival
Source: Belgian Cancer Registry

vival rates of 8.0% in males and 7.4%
in females (Table 27, Figure 63). Rela-
tive survival is highly similar in males
and females at each time interval.
Five-year relative survival is very poor in
all Belgian regions, without substantial
inter-regional difference7 (Table 28).
Relative survival is inversely related to
the age of the patient, and is much
better for the age group 15-59 (males:
16.5%, females: 22.5%), than for
other age groups (60-74 years age
group: males: 9.2%, females: 7.0%;
75+ years age group: males: 4.0%,
females: 4.6%) (Table 29).
Survival is inversely related to stage
at diagnosis. Five-year relative survival
is highest for stage I (males: 39.5%,
females: 30.3%) and lowest for
stage IV (males: 2.9%, females: 2.6%).
Unfortunately, most of the patients
are diagnosed in the latter stage, i.e.
54.2% of known stages in males
and 49.6% in females (Figure 64,
Figure 65).
Significant differences in survival have
been described between tumours of
the exocrine components and tumours
of the endocrine components of the
pancreas, the latter having a better
prognosis but representing a minority
of the diagnoses [44;45]. Accordingly,
the present data result in a 5-year
0 1 2 3 4 5
100
80
60
40
20
0
%
0 1 2 3 4 5 6 7 8 9 10
FIGURE 62 - PANCREATIC CANCER: RELATIVE SURVIVAL BY SEX IN BELGIUM (2004-2008)
FIGURE 63 - PANCREATIC CANCER: RELATIVE SURVIVAL BY SEX IN THE FLEMISH REGION (1999-2008)
MalesFemales
MalesFemales
Survival time (years)
Source: Belgian Cancer Registry
Survival time (years)
Source: Belgian Cancer Registry
0 1 2 3 4 5 0 1 2 3 4 5
100
80
60
40
20
0
%
Stage IStage IIStage IIIStage IVStage X
FIGURE 64 - PANCREATIC CANCER: RELATIVE SURVIVAL BY STAGE IN MALES (BELGIUM, 2004-2008)
FIGURE 65 - PANCREATIC CANCER: RELATIVE SURVIVAL BY STAGE IN FEMALES (BELGIUM, 2004-2008)
Stage IStage IIStage IIIStage IVStage X
Survival time (years)
Source: Belgian Cancer Registry
Survival time (years)
Source: Belgian Cancer Registry
7 Survival rates in the Brussels-Capital Region should be interpreted with caution given the low number of patients at risk in this region after some years of follow-up
5 d
ige
st
ive
tr
aC
tB
el
gia
n C
an
Ce
r r
eg
ist
ry
5 3

Ca
nC
er
su
rv
iva
l i
n b
el
giu
mb
el
gia
n C
an
Ce
r r
eg
ist
ry
5 4
relative survival rate of 61.4% in males
and 66.4% in females for neuroendo-
crine tumours (representing less than
5% of the pancreatic cancers), com-
pared with 6.3% in males and 5.6%
in females for exocrine carcinoma
(Table 30). The inclusion of endocrine
tumours in the survival analyses in this
chapter may partly explain the higher
general survival rates in comparison
with other publications [32;46].
taBle 30 - panCreatiC CanCer: relative survival By morphology and sex (Belgium, 2004-2008)
n at risk relative survival (%)
n % 1 year 3 year 5 year
Males
Neuroendocrine tumour 125 4.7 82.6 72.4 61.4
Carcinoma 2,064 78.5 33.1 10.1 6.3
Unspecified carcinoma 440 16.7 24.2 13.0 11.8
Females
Neuroendocrine tumour 119 4.8 84.7 71.9 66.4
Carcinoma 1,879 75.2 35.6 8.8 5.6
Unspecified carcinoma 499 20.0 18.4 8.7 7.7
Note: 5 males and 3 females not included due to other morphology.
Source: Belgian Cancer Registry

6 r
es
pir
at
or
y t
ra
Ct
Be
lg
ian
Ca
nC
er
re
gis
tr
y
5 5
6.1 lUng (iCD-10: C34)
Lung cancer is the most common
cancer in the world, with about
1.6 million new cases diagnosed in
2008. Due to its high mortality rate, it
was also the most frequent cause of
death by cancer in the same year [47].
Tobacco smoking is well known as the
most important cause of lung cancer.
Over the last ten years, the incidence
rate for this disease is decreasing in
males, but is rising steeply in females.
In Belgium, this cancer is the 2nd most
frequent malignancy in males and the
3rd most frequent in females. As for
mortality, it is the leading cause of
cancer death in males and the second
in females.
For newly diagnosed cases in 2004-
2008 in Belgium, survival for lung
cancer steeply decreases after diagno-
sis: more than half of the patients die
within the first year, and after 3 years
the survival decreases again by half.
From the third year on, relative survival
declines more slowly, to reach a 5-year
relative survival of 14.6% in males and
19.5% in females. At all observed time
points, females have a better survival
than males (Table 31, Figure 66). For
the Flemish Region (incidence years
1999-2008), the 10-year relative sur-
vival shows that even after five years,
survival rates of these patients con-
tinue to decrease. Long-term survivors
of lung cancer are rare, with relative
survival rates of 13.2% in females and
9.5% in males after 10 years (Table 31,
Figure 67).
No difference in survival is marked
between the three Belgian regions in
males or in females (Table 32).
Survival rates are inversely related
to age. In both males and females,
patients of 65 years and older have the
poorest 5-year relative survival, reach-
ing 12.2% and 15.8%, respectively.
For the other age groups (15-49 years
and 50-64 years), the survival rate is
better for patients of 15-49 years, and
the difference is more pronounced
in females than in males. In all age
categories, females have a better prog-
nosis than males (Figure 68, Figure 69).
Additional analyses showed no gender
differences in the stage distribution
for the different age groups (data not
shown).
The stage of the disease is a very
important prognostic factor for survival
of lung cancer. The 5-year relative
survival rates range from 51.6% for
stage I to 2.3% for stage IV in males,
and from 65.5% to 4.9 % in females.
In both males and females, lung can-
cer presents most often in advanced
stages when curative treatment is no
6 Respiratory tract
taBle 31 - lung CanCer: oBserved and relative survival By sex in Belgium (2004-2008) and in the flemish region (1999-2008)
n at risk observed survival (%) relative survival (%) asrs*(%)
1 year 3 year 5 year 10 year 1 year 3 year 5 year 10 year 5 year
Belgium
Males 23,757 41.5 17.6 12.5 43.1 19.3 14.6 14.8
Females 7,560 47.3 23.9 18.0 48.2 25.0 19.5 19.2
Flemish Region
Males 28,010 39.8 16.7 11.9 6,6 41.3 18.5 14.0 9.5
Females 6,968 46.8 22.7 16.9 11.1 47.7 23.8 18.4 13.2
*ASRS: Age-standardised relative survival
Source: Belgian Cancer Registry

Ca
nC
er
su
rv
iva
l i
n b
el
giu
mb
el
gia
n C
an
Ce
r r
eg
ist
ry
5 6
longer possible. The high proportion
of stage III and particularly stage IV
disease (27.7% of cases with known
stage are stage III and 46.0% stage IV
in males; 24.7% stage III and 49.9%
stage IV in females), may partially
explain the poor survival rates (Figure
70, Figure 71).
Finally, the histological subtype of
lung cancer influences prognosis [48].
Small cell carcinoma have the worst
prognosis, independent of sex (5-year
relative survival of 4.6% in males and
8.7% in females). On the other hand,
squamous cell carcinoma and adeno-
carcinoma have the highest 5-year
relative survival rates in both sexes
(19.2% and 15.3% in males; 20.2%
and 21.8% in females). In males, a
small survival advantage for squamous
cell carcinoma is noted in comparison
with adenocarcinoma. In contrast,
adenocarcinoma show a better survival
than squamous cell carcinoma in
females (Table 33). The distribution
of morphology types differs between
sexes. While in males, adenocarci-
noma and squamous cell carcinoma
are the most frequent (about 30% of
cases with defined morphology each),
adenocarcinoma outnumbers all other
histological types in females (43.5% of
cases with defined morphology).
taBle 32 - lung CanCer: relative survival By region and sex (2004-2008)
n at risk relative survival (%)
n % 1 year 3 year 5 year
Males
Brussels-Capital Region 1,669 7.0 41.7 19.0 14.5
Flemish Region 14,087 59.3 42.6 19.2 14.5
Walloon Region 8,001 33.7 44.2 19.6 14.8
Females
Brussels-Capital Region 768 10.2 44.9 25.2 21.5
Flemish Region 4,036 53.4 49.6 24.5 19.0
Walloon Region 2,756 36.5 47.0 25.6 19.6
Source: Belgian Cancer Registry
taBle 33 - lung CanCer: relative survival By morphology and sex (Belgium, 2004-2008)
n at risk relative survival (%)
n % 1 year 3 year 5 year
Males
Squamous cell carcinoma 7,715 34.5 50.2 24.3 19.2
Adenocarcinoma 7,148 32.0 45.4 21.5 15.3
Small cell carcinoma 3,732 16.7 32.6 6.8 4.6
Large cell carcinoma 1,554 6.9 30.7 12.8 10.2
Other and unspecified histology 2,222 9.9 40.0 19.1 15.8
Females
Squamous cell carcinoma 1,205 16.9 46.8 25.8 20.2
Adenocarcinoma 3,286 46.1 52.8 28.8 21.8
Small cell carcinoma 1,372 19.3 40.4 11.9 8.7
Large cell carcinoma 440 6.2 38.3 17.8 13.7
Other and unspecified histology 818 11.5 51.7 31.8 28.3
Note: Morphology is undefined for 1,386 males and 439 females (excluded data).
Source: Belgian Cancer Registry

0 1 2 3 4 5
100
80
60
40
20
0
%
0 1 2 3 4 5 6 7 8 9 10
Survival time (years)
FIGURE 66 - LUNG CANCER: RELATIVE SURVIVAL BY SEX IN BELGIUM (2004-2008)
MalesFemales
MalesFemales
Source: Belgian Cancer Registry
Survival time (years)
FIGURE 67 - LUNG CANCER: RELATIVE SURVIVAL BY SEX IN THE FLEMISH REGION (1999-2008)
Source: Belgian Cancer Registry
0 1 2 3 4 5 0 1 2 3 4 5
100
80
60
40
20
0
%
Survival time (years)
FIGURE 68 - LUNG CANCER: RELATIVE SURVIVAL BY AGE GROUP IN MALES (BELGIUM, 2004-2008)
15-49 years50-64 years65+ years
15-49 years50-64 years65+ years
Source: Belgian Cancer Registry
Survival time (years)
FIGURE 69 - LUNG CANCER: RELATIVE SURVIVAL BY AGE GROUP IN FEMALES (BELGIUM, 2004-2008)
Source: Belgian Cancer Registry
0 1 2 3 4 5 0 1 2 3 4 5
100
80
60
40
20
0
%
Survival time (years)
Stage IStage IIStage IIIStage IVStage X
FIGURE 70 - LUNG CANCER: RELATIVE SURVIVAL BY STAGE IN MALES (BELGIUM, 2004-2008)
Stage IStage IIStage IIIStage IVStage X
Source: Belgian Cancer Registry
Survival time (years)
FIGURE 71 - LUNG CANCER: RELATIVE SURVIVAL BY STAGE IN FEMALES (BELGIUM, 2004-2008)
Source: Belgian Cancer Registry
6 r
es
pir
at
or
y t
ra
Ct
Be
lg
ian
Ca
nC
er
re
gis
tr
y
5 7

Ca
nC
er
su
rv
iva
l i
n b
el
giu
mb
el
gia
n C
an
Ce
r r
eg
ist
ry
5 8
6.2 MESoThElioMA (iCD-10: C45)
Mesothelioma is a rare cancer related
to asbestos exposure and most com-
monly originating from the pleura.
This disease accounts only for 0.6% of
cancers in males and 0.2% of cancers
in females, with a male/female ratio
of 5.3 (Belgium, 2008). The mean age
at diagnosis is 69 years in males and
71 years in females. A usual delay of
20-30 years exists between exposure
to asbestos and the diagnosis of meso-
thelioma. Considering the recent ban
on asbestos exposure, a deceleration
in the increasing incidence has been
observed in some countries. [49].
Most of the patients diagnosed with
this disease die rapidly, resulting in a
1-year relative survival of 46.3% in
males and 50.7% in females. Five-year
relative survival is very poor in both
sexes: 4.9% in males and 8.3% in
females (Table 34, Figure 72). Data for
the Flemish Region show almost no
long-term survivors of mesothelioma.
Throughout the whole follow-up
period, survival in females is slightly bet-
ter than in males (Table 34, Figure 73).
taBle 34 - mesothelioma: oBserved and relative survival By sex in Belgium (2004-2008) and in the flemish region (1999-2008)
n at risk observed survival (%) relative survival (%) asrs*(%)
1 year 3 year 5 year 10 year 1 year 3 year 5 year 10 year 5 year
Belgium
Males 913 44.5 10.3 4.1 46.3 11.2 4.9 5.8
Females 198 49.5 17.1 7.6 50.7 17.9 8.3 10.3
Flemish Region
Males 1,147 42.2 8.8 3.9 0.9 43.7 9.6 4.4 1.4
Females 229 44.5 14.0 6.4 0.0 45.6 14.6 6.8 6.8
*ASRS: Age-standardised relative survival
Source: Belgian Cancer Registry
Survival analyses by region reveal
no major differences between the
Flemish and the Walloon Region. Due
to the very few patients at risk in the
Brussels-Capital Region, survival rates
cannot be estimated accurately for this
area (Table 35).
Patients of 65 years and older have
a poorer outcome than younger
patients: while the younger age group
achieves 5-year relative survival rates of
7.0% in males and 13.0% in females,
these rates decrease to 3.7% in males
and 6.0% in females for the 65+ years
age group (Figure 74, Figure 75).
The extent of the disease at diagnosis
is another factor influencing survival.
Five-year relative survival in males
affected by mesothelioma is highest for
stage I (13.3%), and lowest for stage IV
(3.8%). Results in females are consid-
ered difficult to interpret due to the low
number of cases involved (Table 36).
Despite the lethal character of meso-
thelioma, small differences in survival
taBle 35 - mesothelioma: relative survival By region and sex (2004-2008)
n at risk relative survival (%)
n % 1 year 3 year 5 year
Males
Brussels-Capital Region 34 3.7 * * *
Flemish Region 630 69.0 46.8 10.6 4.8
Walloon Region 249 27.3 44.4 11.5 4.5
Females
Brussels-Capital Region 10 5.1 * * *
Flemish Region 136 68.7 49.6 14.5 7.3
Walloon Region 52 26.3 49.4 22.2 9.0
* Statistic not displayed due to less than 35 cases.
Source: Belgian Cancer Registry

0 1 2 3 4 5
100
80
60
40
20
0
%
0 1 2 3 4 5 6 7 8 9 10
Survival time (years)
FIGURE 72 - MESOTHELIOMA: RELATIVE SURVIVAL BY SEX IN BELGIUM (2004-2008)
MalesFemales
MalesFemales
Source: Belgian Cancer Registry
Survival time (years)
FIGURE 73 - MESOTHELIOMA: RELATIVE SURVIVAL BY SEX IN THE FLEMISH REGION (1999-2008)
Source: Belgian Cancer Registry
0 1 2 3 4 5 0 1 2 3 4 5
100
80
60
40
20
0
%
Survival time (years)
FIGURE 74 - MESOTHELIOMA: RELATIVE SURVIVAL BY AGE GROUP IN MALES (BELGIUM, 2004-2008)
15-64 years65+ years
15-64 years65+ years
Source: Belgian Cancer Registry
Survival time (years)
FIGURE 75 - MESOTHELIOMA: RELATIVE SURVIVAL BY AGE GROUP IN FEMALES (BELGIUM, 2004-2008)
Source: Belgian Cancer Registry
0 1 2 3 4 5 0 1 2 3 4 5
100
80
60
40
20
0
%
Survival time (years)
FIGURE 76 - MESOTHELIOMA: RELATIVE SURVIVAL BY MORPHOLOGY IN MALES (BELGIUM, 2004-2008)
EpithelioidOther
EpithelioidOther
Source: Belgian Cancer Registry
Survival time (years)
FIGURE 77 - MESOTHELIOMA: RELATIVE SURVIVAL BY MORPHOLOGY IN FEMALES (BELGIUM, 2004-2008)
Source: Belgian Cancer Registry
6 r
es
pir
at
or
y t
ra
Ct
Be
lg
ian
Ca
nC
er
re
gis
tr
y
5 9

Ca
nC
er
su
rv
iva
l i
n b
el
giu
mb
el
gia
n C
an
Ce
r r
eg
ist
ry
6 0
taBle 36 - mesothelioma: relative survival By stage and sex (Belgium, 2004-2008)
n at risk relative survival (%)
n % 1 year 3 year 5 year
Males
Stage I 76 8.9 72.0 19.5 13.3
Stage II 95 11.2 53.3 11.9 1.0
Stage III 117 13.7 54.6 14.2 8.8
Stage IV 133 15.6 43.7 8.2 3.8
Stage X 431 50.6 39.1 8.8 3.2
Females
Stage I 9 5.1 * * *
Stage II 22 12.4 * * *
Stage III 16 9.0 * * *
Stage IV 25 14.1 * * *
Stage X 105 59.3 48.1 15.4 5.1
Note: TNM Stage was not applicable in 61 males and 21 females (data excluded).
*Results not displayed due to less than 35 cases.
Source: Belgian Cancer Registry
have been reported depending on the
histological subtype. Survival estimates
in males diagnosed with an epithelioid
mesothelioma, representing 42.5%
of all male cases, are slightly better
than for the other subtypes (5-year
relative survival of 6.6% versus 3.6%;
Figure 76). In females, the survival
advantage for epithelioid mesothe-
lioma is less clearly demonstrated due
to the low numbers of patients after
2 years of follow-up (Figure 77).

7 m
al
ign
an
t m
el
an
om
a o
f s
kin
B
el
gia
n C
an
Ce
r r
eg
ist
ry
6 1
7 Malignant melanoma of skin
Ten per cent of all skin cancers are
malignant melanoma that arise from
pigmented cells. These cancers have
a more aggressive behaviour than
other skin cancers, but are curable
if diagnosed at an early stage. In
Belgium, malignant melanoma is the
10th most frequent cancer in males
and the 5th most frequent in females.
The incidence of malignant melanoma
increases worldwide, and this trend is
also observed in our country. The most
important explanation is the change
in sun-exposure habits. Other factors,
such as a growing public awareness
and, to a lesser extent, the set-up of
(non-systematic) screening measures
for this disease can also contribute to
the increase of incidence. Malignant
melanoma typically affects young
patients, with cases from 15-20 years
on in both sexes.
(iCD-10: C43)8
For newly diagnosed cases in 2004-
2008, the 5-year survival rates are
86.2% in males and 91.0% in
females (Table 37, Figure 78). For
the Flemish Region (incidence years
1999-2008), the 10-year survival rates
reach 76.4% in males and 85.7%
in females (Table 37, Figure 79).
This good prognosis for malignant
melanoma can partly be attributed
to its clinical presentation. Indeed,
malignant melanoma is rather easily
recognisable and therefore often
diagnosed at an early stage: 63.3%
of cancers with known stage are clas-
sified as stage I in males, and 73.3%
in females.
In males, the survival rates are 93.6%
in the Brussels-Capital Region, 84.1%
in the Flemish Region and 88.4% in
the Walloon Region. In females, these
rates are 89.1%, 90.9% and 91.5%
respectively (Table 38).
In males, survival rates for malignant
melanoma hardly differ between the
different age groups (15-34, 35-64,
65+ years; Figure 80). In contrast,
age is inversely related to survival for
women diagnosed with this disease.
Young females (15-34 years) affected
by malignant melanoma have about
97.3% chance of surviving 5 years
after diagnosis, while this is only
84.5% for patients of 65 years and
older (Figure 81).
Stage as determined by the patholo-
gist is the most important prognostic
factor for malignant melanoma. While
a stage I disease has a 5-year survival
rate of 99.0% in males and 99.8%
in females, the presence of lymph-
taBle 37 - malignant melanoma of skin: oBserved and relative survival By sex in Belgium (2004-2008) and in the flemish region (1999-2008)
n at risk observed survival (%) relative survival (%) asrs*(%)
1 year 3 year 5 year 10 year 1 year 3 year 5 year 10 year 5 year
Belgium
Males 2,826 94.2 82.8 76.0 96.6 89.2 86.2 86.0
Females 4,371 95.6 88.9 84.0 97.2 93.3 91.0 90.3
Flemish Region
Males 2,905 92.7 80.5 72.7 60.8 94.9 86.0 81.1 76.4
Females 4,513 95.2 88.2 82.7 73.6 96.7 92.3 89.2 85.7
*ASRS: Age-standardised relative survival
Source: Belgian Cancer Registry
8 Analyses for malignant melanoma of the skin were based on ICD-10 classification C43. Tumours with an unknown primary site (C80.9 according to ICD-O-3).

Ca
nC
er
su
rv
iva
l i
n b
el
giu
mb
el
gia
n C
an
Ce
r r
eg
ist
ry
6 2
node invasion (stage III) reduces these
percentages to 55.4% and 68.6%,
respectively (Table 39, Figure 82,
Figure 83).
In agreement with the scientific
literature [50], malignant melanoma
presenting on the arms or legs have
a slightly better prognosis than those
arising from the skin of head or trunk
(Table 40). Considering melanoma of
known point of origin, females present
more often with malignant melanoma
on the arms or legs (63.5% in females
and 37.0% in males), while males
develop malignant melanoma prefer-
entially on the head or trunk (36.5%
in females and 63.0% in males). This
difference could partly explain the dif-
ference in survival between males and
females.
taBle 38 - malignant melanoma of skin: relative survival By region and sex (Belgium, 2004-2008)
n at risk relative survival (%)
n % 1 year 3 year 5 year
Males
Brussels-Capital Region 259 9.2 95.6 90.9 93.6
Flemish Region 1,665 58.9 96.3 88.2 84.1
Walloon Region 902 31.9 97.6 90.7 88.4
Females
Brussels-Capital Region 371 8.5 98.5 92.7 89.1
Flemish Region 2,567 58.7 97.0 93.1 90.9
Walloon Region 1,433 32.8 97.1 93.9 91.5
Source: Belgian Cancer Registry
taBle 39 - malignant melanoma of skin: relative survival By stage and sex (Belgium, 2004-2008)
n at risk relative survival (%)
n % 1 year 3 year 5 year
Males
Stage I 1,412 50.0 100.4 99.9 99.0
Stage II 544 19.2 98.1 78.9 73.6
Stage III 182 6.4 84.5 62.5 55.4
Stage IV 94 3.3 56.6 24.1 19.2
Stage X 593 21.0 96.2 91.3 87.5
Females
Stage I 2,501 57.2 100.2 100.0 99.8
Stage II 632 14.5 95.3 82.7 75.3
Stage III 187 4.3 93.3 76.8 68.6
Stage IV 91 2.1 57.3 36.0 27.8
Stage X 960 22.0 95.0 90.9 88.1
Source: Belgian Cancer Registry
taBle 40 - malignant melanoma of skin: relative survival By suBloCalisation and sex (Belgium, 2004-2008)
n at risk relative survival (%)
n % 1 year 3 year 5 year
Males
Head and trunk 1,537 63.0 96.8 88.2 84.5
Arms and legs 901 37.0 98.2 91.3 88.2
Females
Head and trunk 1,369 36.5 96.7 91.4 87.9
Arms and legs 2,381 63.5 98.1 95.0 93.2
Note: in 388 males and 681 females, the localisation is defined as “overlapping lesion ofskin” or “not specified” (data excluded).
Source: Belgian Cancer Registry

0 1 2 3 4 5
100
80
60
40
20
0
%
0 1 2 3 4 5 6 7 8 9 10
Survival time (years)
FIGURE 78 - MALIGNANT MELANOMA OF SKIN: RELATIVE SURVIVAL BY SEX IN BELGIUM (2004-2008)
MalesFemales
MalesFemales
Source: Belgian Cancer Registry
Survival time (years)
FIGURE 79 - MALIGNANT MELANOMA OF SKIN: RELATIVE SURVIVAL BY SEX IN THE FLEMISH REGION (1999-2008)
Source: Belgian Cancer Registry
0 1 2 3 4 5 0 1 2 3 4 5
100
80
60
40
20
0
%
Survival time (years)
FIGURE 80 - MALIGNANT MELANOMA OF SKIN: 5-YEAR RELATIVE SURVIVAL BY AGE GROUP IN MALES (BELGIUM, 2004-2008)
15-34 years35-64 years65+ years
15-34 years35-64 years65+ years
Source: Belgian Cancer Registry
Survival time (years)
FIGURE 81 - MALIGNANT MELANOMA OF SKIN: RELATIVE SURVIVAL BY AGE GROUP IN FEMALES (BELGIUM, 2004-2008)
Source: Belgian Cancer Registry
0 1 2 3 4 5 0 1 2 3 4 5
100
80
60
40
20
0
%
Survival time (years)
Stage IStage IIStage IIIStage IVStage X
FIGURE 82 - MALIGNANT MELANOMA OF SKIN: RELATIVE SURVIVAL BY STAGE IN MALES (BELGIUM, 2004-2008)
Stage IStage IIStage IIIStage IVStage X
Source: Belgian Cancer Registry
Survival time (years)
FIGURE 83 - MALIGNANT MELANOMA OF SKIN: RELATIVE SURVIVAL BY STAGE IN FEMALES (BELGIUM, 2004-2008)
Source: Belgian Cancer Registry
7 m
al
ign
an
t m
el
an
om
a o
f s
kin
B
el
gia
n C
an
Ce
r r
eg
ist
ry
6 3

Ca
nC
er
su
rv
iva
l i
n b
el
giu
mb
el
gia
n C
an
Ce
r r
eg
ist
ry
6 4
8 Breast
Breast cancer is the most frequent can-
cer in females (35.3% of cancer cases),
occurring at a mean age of 62 years
(incidence year 2008, Belgium). It
is also the most important cause of
cancer death in females (20.2%). In
contrast, males develop breast cancer
only exceptionally (0.3% of all cancer
cases), and at higher ages (mean age
of 68 years). Death from breast cancer
in males is very uncommon (0.2% of
cancer deaths).
Breast cancer has a relatively good
prognosis, with 5-year relative survival
rates of 88.0% in females and 78.2%
in males (Belgium, 2004-2008;
Table 41, Figure 84). Typically for
breast cancer, which is known for
the occurrence of late relapses and
related deaths, survival further declines
at the long-term follow-up period,
reaching a 10-year relative survival of
78.9% in females and 61.9% in males
(Flemish Region, 1999-2008; Table 41,
Figure 85) [51]. Given the low number
of males diagnosed with breast cancer,
the remainder of this chapter is limited
to females.
Five-year relative survival rates for
breast cancer in females show no
difference between the three Belgian
regions (88.0% in the Brussels-Capital
Region, 87.6% in the Flemish Region
and 88.8% in the Walloon Region;
Table 42).
(iCD-10:C50)
0 1 2 3 4 5
100
80
60
40
20
0
%
0 1 2 3 4 5 6 7 8 9 10
FIGURE 84 - BREAST CANCER: RELATIVE SURVIVAL BY SEX IN BELGIUM (2004-2008)
FIGURE 85 - BREAST CANCER: RELATIVE SURVIVAL BY SEX IN THE FLEMISH REGION (1999-2008)
MalesFemales
MalesFemales
Survival time (years)
Source: Belgian Cancer Registry
Survival time (years)
Source: Belgian Cancer Registry
0 1 2 3 4 5 0 1 2 3 4 5
100
80
60
40
20
0
%
FIGURE 86 - BREAST CANCER: RELATIVE SURVIVAL BY CLINICAL STAGE IN FEMALES (BELGIUM, 2004-2008)
FIGURE 87 - BREAST CANCER: RELATIVE SURVIVAL BY PATHOLOGICAL STAGE IN FEMALES (BELGIUM, 2004-2008)
Survival time (years)
Source: Belgian Cancer Registry
Survival time (years)
Source: Belgian Cancer Registry
Stage IStage IIStage IIIStage IVStage X
Stage IStage IIStage IIIStage IVStage X

8 B
re
as
t B
el
gia
n C
an
Ce
r r
eg
ist
ry
6 5
Relative survival estimates for breast
cancer in females aged 70 years
or older are lower than in younger
females (5-year relative survival of
79.2% in the 70+ years age group
compared with 91.7% and 90.7% in
the 15-49 years and 50-69 years age
groups respectively; Table 43). The
poorer survival rate in the 70+ years
age group is partly explained by the
prevalence of more advanced stages
in these patients. In this age group,
20.7% of all cases with known stage
are stage III or IV, while this is only
the case for 13.0% in the younger
patients.
A considerable number of breast
lesions are discovered in a pre-invasive
phase and diagnosed as in situ breast
cancer (9.1% of all breast tumours).
These lesions do not have the potential
to disseminate to distant organs and
therefore do not impair the prognosis
of the patients concerned. Indeed,
females diagnosed with in situ breast
cancer have a 5-year relative survival
equal to that of females from general
population and for the same age,
(5-year relative survival in cStage 0 and
pStage 0: 100.0%).
Clinical stage for breast cancer allows
selection of the type of treatment
and mainly the surgical intervention,
which is often the initial treatment for
this disease. The extent of the disease
will most accurately be determined
by the pathological staging, which is
therefore a more reliable estimator of
prognosis. One should be aware that
part of the pathological staging data
consist of ypTNM stages (in the cases
in which classification is performed
during or after initial multimodality
therapy, pTNM category is identified by
a ‘y’ prefix) that may reflect downstag-
ing induced by pre-operative therapy.
Survival analyses by cStage show
5-year relative survival rates ranging
from 99.4% in stage I to 28.0% in
stage IV (Figure 86). Five-year relative
survival estimates based on patho-
logical staging are somewhat higher
and range from 99.9% in stage I to
32.3% in stage IV. The vast majority
of patients are diagnosed with pStage
I or II (85.0% of patients with known
stage) and have a 5-year relative sur-
vival above 90% (Figure 87).
Cases with unknown pathological
stage (stage X) have a lower 5-year
survival rate compared to patients
with unknown clinical stage (66.5%
for pathological stage X versus
90.7% for clinical stage X; Figure 86,
Figure 87).
taBle 41 - Breast CanCer: oBserved and relative survival in Belgium (2004-2008) and in the flemish region (1999-2008)
n at risk observed survival (%) relative survival (%) asrs*(%)
1 year 3 year 5 year 10 year 1 year 3 year 5 year 10 year 5 year
Belgium
Males 342 89.5 79.2 64.2 93.2 89.3 78.2 76.8
Females 45,946 95.4 87.5 80.3 97.1 92.4 88.0 85.5
Flemish Region
Males 443 89.4 74.7 62.7 42.4 93.1 84.1 76.2 61.9
Females 51,572 95.1 86.6 79.4 65.9 96.8 91.0 86.5 78.9
*ASRS: Age-standardised relative survival
Source: Belgian Cancer Registry

Ca
nC
er
su
rv
iva
l i
n b
el
giu
mb
el
gia
n C
an
Ce
r r
eg
ist
ry
6 6
Unknown pathological stage can
either reflect missing data at the
registration level, or females for
whom surgery is not considered to
be a treatment option. The decision
to avoid surgical intervention may
be taken for oncological reasons
(extended disease) or other medical
reasons, such as co-morbidity or age.
Indeed, the proportion of pathological
stage X (who can be considered for
the majority as non-surgical patients)
in the 70+ years age group is higher
than in patients aged 15-69 years
(26.6% versus 15.5% respectively).
taBle 42 - Breast CanCer: relative survival By region in females (2004-2008)
n at risk relative survival (%)
n % 1 year 3 year 5 year
Females
Brussels-Capital Region 4,290 9.3 97.1 92.1 88.0
Flemish Region 26,539 57.8 97.2 92.2 87.6
Walloon Region 15,117 32.9 97.1 92.7 88.8
Source: Belgian Cancer Registry
taBle 43 - Breast CanCer: relative survival By age group in females (Belgium, 2004-2008)
n at risk relative survival (%)
n % 1 year 3 year 5 year
Females
15-49 years 10,726 23.3 99.0 95.2 91.7
50-69 years 21,624 47.1 98.3 94.8 90.7
70+ years 13,596 29.6 93.8 85.6 79.2
Source: Belgian Cancer Registry
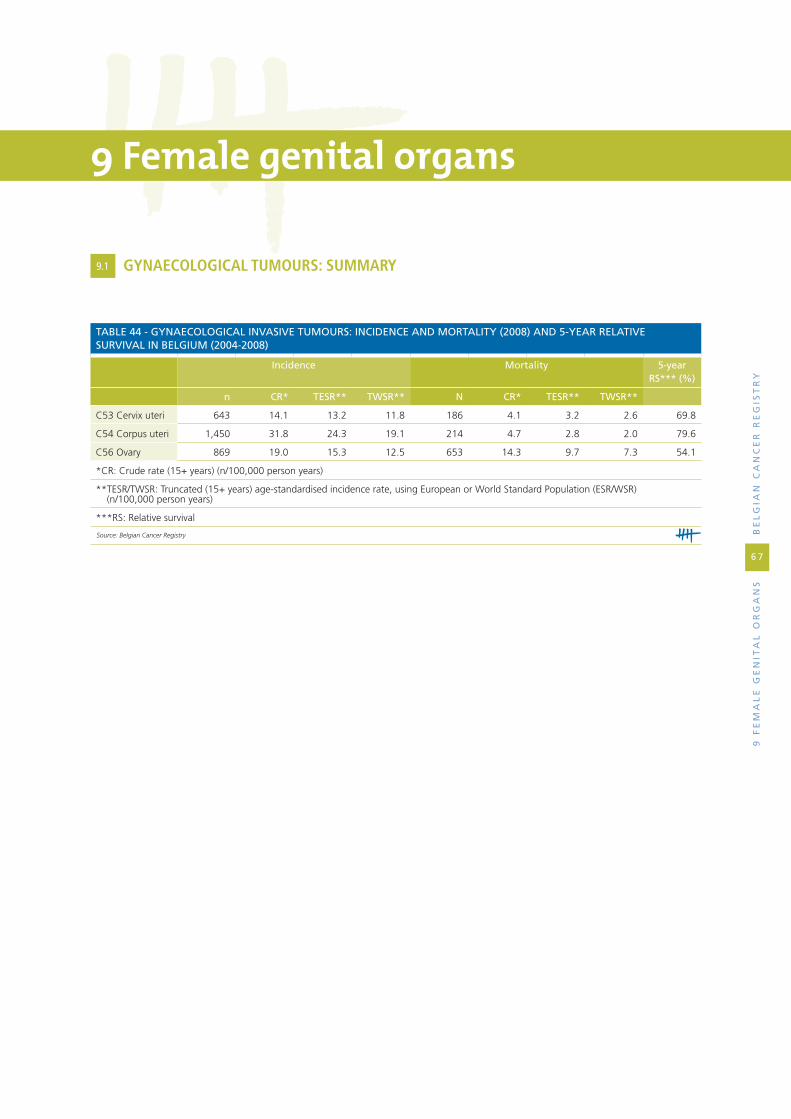
9 f
em
al
e g
en
ita
l o
rg
an
sB
el
gia
n C
an
Ce
r r
eg
ist
ry
6 7
9 Female genital organs
taBle 44 - gynaeCologiCal invasive tumours: inCidenCe and mortality (2008) and 5-year relative survival in Belgium (2004-2008)
incidence mortality 5-year rs*** (%)
n Cr* tesr** twsr** n Cr* tesr** twsr**
C53 Cervix uteri 643 14.1 13.2 11.8 186 4.1 3.2 2.6 69.8
C54 Corpus uteri 1,450 31.8 24.3 19.1 214 4.7 2.8 2.0 79.6
C56 Ovary 869 19.0 15.3 12.5 653 14.3 9.7 7.3 54.1
*CR: Crude rate (15+ years) (n/100,000 person years)
** TESR/TWSR: Truncated (15+ years) age-standardised incidence rate, using European or World Standard Population (ESR/WSR) (n/100,000 person years)
***RS: Relative survival
Source: Belgian Cancer Registry
9.1 gynAECologiCAl TUMoURS: SUMMARy
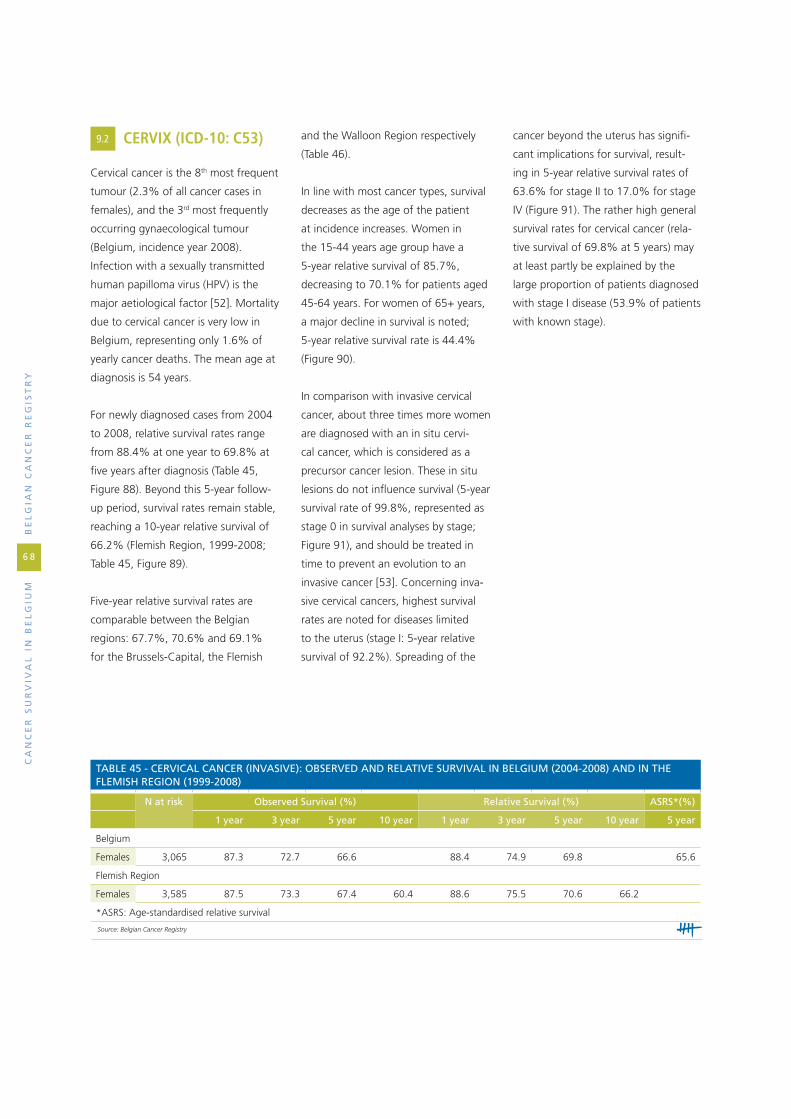
Ca
nC
er
su
rv
iva
l i
n b
el
giu
mb
el
gia
n C
an
Ce
r r
eg
ist
ry
6 8
9.2 CERvix (iCD-10: C53)
Cervical cancer is the 8th most frequent
tumour (2.3% of all cancer cases in
females), and the 3rd most frequently
occurring gynaecological tumour
(Belgium, incidence year 2008).
Infection with a sexually transmitted
human papilloma virus (HPV) is the
major aetiological factor [52]. Mortality
due to cervical cancer is very low in
Belgium, representing only 1.6% of
yearly cancer deaths. The mean age at
diagnosis is 54 years.
For newly diagnosed cases from 2004
to 2008, relative survival rates range
from 88.4% at one year to 69.8% at
five years after diagnosis (Table 45,
Figure 88). Beyond this 5-year follow-
up period, survival rates remain stable,
reaching a 10-year relative survival of
66.2% (Flemish Region, 1999-2008;
Table 45, Figure 89).
Five-year relative survival rates are
comparable between the Belgian
regions: 67.7%, 70.6% and 69.1%
for the Brussels-Capital, the Flemish
and the Walloon Region respectively
(Table 46).
In line with most cancer types, survival
decreases as the age of the patient
at incidence increases. Women in
the 15-44 years age group have a
5-year relative survival of 85.7%,
decreasing to 70.1% for patients aged
45-64 years. For women of 65+ years,
a major decline in survival is noted;
5-year relative survival rate is 44.4%
(Figure 90).
In comparison with invasive cervical
cancer, about three times more women
are diagnosed with an in situ cervi-
cal cancer, which is considered as a
precursor cancer lesion. These in situ
lesions do not influence survival (5-year
survival rate of 99.8%, represented as
stage 0 in survival analyses by stage;
Figure 91), and should be treated in
time to prevent an evolution to an
invasive cancer [53]. Concerning inva-
sive cervical cancers, highest survival
rates are noted for diseases limited
to the uterus (stage I: 5-year relative
survival of 92.2%). Spreading of the
cancer beyond the uterus has signifi-
cant implications for survival, result-
ing in 5-year relative survival rates of
63.6% for stage II to 17.0% for stage
IV (Figure 91). The rather high general
survival rates for cervical cancer (rela-
tive survival of 69.8% at 5 years) may
at least partly be explained by the
large proportion of patients diagnosed
with stage I disease (53.9% of patients
with known stage).
taBle 45 - CerviCal CanCer (invasive): oBserved and relative survival in Belgium (2004-2008) and in the flemish region (1999-2008)
n at risk observed survival (%) relative survival (%) asrs*(%)
1 year 3 year 5 year 10 year 1 year 3 year 5 year 10 year 5 year
Belgium
Females 3,065 87.3 72.7 66.6 88.4 74.9 69.8 65.6
Flemish Region
Females 3,585 87.5 73.3 67.4 60.4 88.6 75.5 70.6 66.2
*ASRS: Age-standardised relative survival
Source: Belgian Cancer Registry

0 1 2 3 4 5 0 1 2 3 4 5
100
80
60
40
20
0
%
Survival time (years)
FIGURE 90 - CERVICAL CANCER (INVASIVE): RELATIVE SURVIVAL BY AGE GROUP (BELGIUM, 2004-2008)
Source: Belgian Cancer Registry
Survival time (years)
FIGURE 91 - CERVICAL CANCER (IN SITU AND INVASIVE): RELATIVE SURVIVAL BY STAGE (BELGIUM, 2004-2008)
Source: Belgian Cancer Registry
Stage 0Stage IStage IIStage IIIStage IVStage X
15-44 years45-64 years65+ years
taBle 46 - CerviCal CanCer (invasive): relative survival By region (2004-2008)
n at risk relative survival (%)
n % 1 year 3 year 5 year
Females
Brussels-Capital Region 308 10.0 85.2 73.5 67.7
Flemish Region 1,796 58.6 88.8 75.8 70.6
Walloon Region 961 31.4 88.7 73.6 69.1
Source: Belgian Cancer Registry
0 1 2 3 4 5
100
80
60
40
20
0
%
0 1 2 3 4 5 6 7 8 9 10
Survival time (years)
FIGURE 88 - CERVICAL CANCER (INVASIVE): RELATIVE SURVIVAL IN BELGIUM (2004-2008)
Source: Belgian Cancer Registry
Survival time (years)
FIGURE 89 - CERVICAL CANCER (INVASIVE): RELATIVE SURVIVAL IN THE FLEMISH REGION (1999-2008)
Source: Belgian Cancer Registry
Females Females
9 f
em
al
e g
en
ita
l o
rg
an
sB
el
gia
n C
an
Ce
r r
eg
ist
ry
6 9

Ca
nC
er
su
rv
iva
l i
n b
el
giu
mb
el
gia
n C
an
Ce
r r
eg
ist
ry
7 0
9.3 CoRpUS UTERi (iCD-10: C54)
Corpus uteri cancer is the fourth most
frequent tumour in females and the
most frequent gynaecological cancer
(Belgium, incidence year 2008). Mean
age at diagnosis is 68 years. It is the
gynaecological cancer with the best
prognosis (Table 44).
For the incident cases 2004-2008 in
Belgium, the 1-year relative survival
rate is 92.6% and the 5-year rela-
tive survival rate is 79.6% (Table 47,
Figure 92). Beyond the 5-year period,
survival decreases less steeply to reach
76.6% at 10 years after diagnosis
(Flemish Region, incidence years 1999-
2008) (Table 47, Figure 93).
Relative survival rates are slightly
better in the Flemish and the Walloon
Region (5-year survival rate: 80.1%
and 79.5% respectively) than in the
Brussels-Capital Region (75.1%)
(Table 48)9.
In comparison with other tumour types,
the negative effect of age on survival is
rather limited. In females of 70+ years
taBle 47 - Corpus uteri CanCer: oBserved and relative survival in Belgium (2004-2008) and in the flemish region (1999-2008)
n at risk observed survival (%) relative survival (%) asrs*(%)
1 year 3 year 5 year 10 year 1 year 3 year 5 year 10 year 5 year
Belgium
Females 6,346 90.4 78.1 70.3 92.6 83.9 79.6 79.4
Flemish Region
Females 7,489 90.1 78.3 71.8 59.9 92.2 83.5 80.2 76.6
*ASRS: Age-standardised relative survival
Source: Belgian Cancer Registry
taBle 48 - Corpus uteri CanCer: relative survival By region (2004-2008)
n at risk relative survival (%)
n % 1 year 3 year 5 year
Females
Brussels-Capital Region 462 7.3 90.6 80.4 75.1
Flemish Region 3,912 61.6 93.1 84.2 80.1
Walloon Region 1,972 31.1 92.2 83.9 79.5
Source: Belgian Cancer Registry
taBle 49 - Corpus uteri CanCer: relative survival By age group (Belgium, 2004-2008)
n at risk relative survival (%)
n % 1 year 3 year 5 year
Females
15-54 years 717 11.3 96.3 90.8 87.8
55-69 years 2,679 42.2 95.4 88.0 83.9
70+ years 2,950 46.5 89.1 78.0 72.6
Source: Belgian Cancer Registry
taBle 50 - Corpus uteri CanCer: relative survival By histopathologiCal grade within CarCinoma (Belgium, 2004-2008)
n at risk relative survival (%)
n % 1 year 3 year 5 year
Females
Grade 1 2,005 41.5 99.5 97.4 95.3
Grade 2 1,695 35.1 95.2 87.9 82.3
Grade 3 1,129 23.4 84.3 64.1 56.6
Note: grade is unknown in 1,390 cases (excluded data).
Source: Belgian Cancer Registry
9 Survival rates in the Brussels-Capital Region should be interpreted with caution given the low number of patients at risk in this region after some years of follow-up.

of age, 5-year relative survival rate is
lower (72.6%) compared with patients
of 15-54 years (87.8%) and patients of
55-69 years (83.9%) (Table 49).
The extent of the disease is a strong
prognostic factor for survival in corpus
uteri cancer. The 5-year relative survival
rates range from 94.5% for stage I to
19.5% for stage IV. Within cases with
known stage, 72.6% of cases are stage
I, which could explain the relatively
good general prognosis at 5 years after
diagnosis for this cancer (Figure 94).
Besides disease stage, another
important determinant for survival is
the histological subtype. A distinction
needs to be made between carcinoma
and sarcoma of the corpus uteri [54].
Carcinomas represent almost 94.7%
of all corpus uteri cancers. They have a
clear survival advantage on sarcomas:
5-year relative survival rate is 80.7 %
in carcinomas whereas it reaches only
59.2% in sarcomas (Figure 95). Sar-
comas are more frequent in younger
patients (42.2% in 15-54 years,
26.3% in 55-69 years and 31.3% in
70+ years) while carcinomas occur
mostly in older patients (9.7% in
15-54 years, 43.2% in 55-69 years
and 47.2% in 70+ years). This age-
dependent distribution of morpho-
logical types may contribute to the
relatively small difference observed in
survival between younger and older
patients.
Besides the important distinction
between carcinoma and sarcoma,
two morphological entities may be
distinguished within the carcinoma
group: the endometrioid and the non-
endometrioid subtype [55].
The endometrioid subtype is the most
frequent (87.7% of all carcinoma
cases) and has a better prognosis
(5-year relative survival: 85.2%) than
the non-endometrioid subtype (5-year
relative survival: 49.4%; Figure 96).
Endometrioid carcinomas have a more
indolent behaviour than the non-
endometrioid subtype; for endometri-
oid carcinoma, 75.7% of patients with
known stage have stage I compared
with 45.4% for non-endometrioid can-
cer. Moreover, the non-endometrioid
carcinomas tend to occur at an older
age, representing 15% of all carci-
noma cases in patients of 70 years and
older versus 10.7% in 55-69 years and
8.7% in 15-54 years. The higher sur-
vival rates for patients with endometri-
oid uterine carcinoma may be partially
explained both by the younger age of
the patient and the lesser extent of the
disease at presentation.
Additional survival analyses for
carcinoma by tumour grade show
that relative survival decreases as
grade increases [56]. The best 5-year
relative survival is observed in grade 1
tumours (95.3%). The 5-year relative
survival decreases to 56.6% in grade 3
tumours (Table 50).
0 1 2 3 4 5 0 1 2 3 4 5
100
80
60
40
20
0
%100
80
60
40
20
0
%
0 1 2 3 4 5 6 7 8 9 10
Stage IStage IIStage IIIStage IVStage X
FIGURE 92 - CORPUS UTERI CANCER: RELATIVE SURVIVAL IN BELGIUM (2004-2008)
FIGURE 93 - CORPUS UTERI CANCER: RELATIVE SURVIVAL IN THE FLEMISH REGION (1999-2008)
FIGURE 94 - CORPUS UTERI CANCER: RELATIVE SURVIVAL BY STAGE (BELGIUM, 2004-2008)
Females Females
Survival time (years)
Source: Belgian Cancer Registry
Survival time (years)
Source: Belgian Cancer Registry
Survival time (years)
Source: Belgian Cancer Registry
9 f
em
al
e g
en
ita
l o
rg
an
sB
el
gia
n C
an
Ce
r r
eg
ist
ry
7 1

Ca
nC
er
su
rv
iva
l i
n b
el
giu
mb
el
gia
n C
an
Ce
r r
eg
ist
ry
7 2
0 1 2 3 4 5 0 1 2 3 4 5
100
80
60
40
20
0
%
Survival time (years)
FIGURE 95 - CORPUS UTERI CANCER: RELATIVE SURVIVAL BY MORPHOLOGY (BELGIUM, 2004-2008)
CarcinomaSarcoma
EndometrioidNon-endometrioid
Source: Belgian Cancer Registry
Survival time (years)
FIGURE 96 - CORPUS UTERI CANCER: RELATIVE SURVIVAL BY MORPHOLOGY WITHIN CARCINOMA (BELGIUM, 2004-2008)
Source: Belgian Cancer Registry

9.4 ovARy (iCD10: C56)
Ovarian cancer is the 7th most
frequent tumour in females (3.2%
of all cancer diagnoses in Belgium
in 2008) and the 2nd most frequent
gynaecological tumour. This cancer is
the 5th most frequent cause of cancer
death in 2008 (5.7%). The mean age
at diagnosis is 65 years.
For the newly diagnosed cases in
2004-2008, more than half of the
patients has deceased from ovarian
cancer at five years after diagnosis
(5-year relative survival: 44.4%)
(Table 51, Figure 97). This survival rate
further decreases to a 10-year relative
survival of 35.2% (incidence years
1999-2008, Flemish Region; Table 51,
Figure 98).
Five-year relative survival is 46.9% in
the Brussels-Capital Region, 43.5% in
the Flemish Region and 45.5% in the
Walloon Region (Table 52).
Survival from ovarian cancer is
strongly related to the age of the
patient at time of diagnosis: the older
the patient, the worse the 5-year
relative survival (15-44 years: 71.0%,
45-69 years: 52.7%, 70+ years:
28.0%; Figure 99).
Another important factor in patient’s
prognosis is the behaviour of the
tumour. Around 15% of all ovarian
cancers (17.8% in our data) are of
low malignant potential and are
called “borderline malignant”. These
tumours were classified as malignant
(/3) in the second ICD-O edition [7]
but are considered as borderline
malignant (/1) in the third ICD-O
edition [8]. Five-year relative survival
is very high (98.8%) for patients diag-
nosed with a borderline malignant
tumour (Figure 100).
For the invasive ovarian cancers,
survival is highly dependent on the
stage of the disease. Five-year rela-
tive survival is 91.0% for patients
diagnosed with stage I, but decreases
to 19.1% for patients diagnosed with
taBle 51 - ovarian CanCer (invasive): oBserved and relative survival in Belgium (2004-2008) and in the flemish region (1999-2008)
n at risk observed survival (%) relative survival (%) asrs*(%)
1 year 3 year 5 year 10 year 1 year 3 year 5 year 10 year 5 year
Belgium
Females 4,149 76.3 53.5 40.6 78.1 56.5 44.4 42.6
Flemish Region
Females 5,344 76.1 52.8 41.1 29.7 77.8 55.6 44.6 35.2
*ASRS: Age-standardised relative survival
Source: Belgian Cancer Registry
stage IV (Figure 100). Due to the late
occurrence of symptoms and the
aggressive biology of most ovarian
cancer subtypes, it is difficult to diag-
nose this cancer at an early and more
curable stage. As a consequence,
65.4% of all invasive ovarian cancers
with known stage are classified as
stage III or IV. This high proportion of
advanced stages contributes to the
rather low overall survival.
Most ovarian cancers can be clas-
sified as carcinoma (91.9%) with a
5-year relative survival rate of 44.4%.
A much better prognosis is observed
for sex-cord and germ cell tumours
(5-year relative survival of 76.3% and
89.0% respectively) which represent
1.0% and 1.6% of all morphology
types, respectively (Table 53) [57].
taBle 52 - ovarian CanCer (invasive): relative survival By region (2004-2008)
n at risk relative survival (%)
n % 1 year 3 year 5 year
Females
Brussels-Capital Region 331 8.0 77.8 53.2 46.9
Flemish Region 2,529 61.0 77.9 55.8 43.5
Walloon Region 1,289 31.1 78.3 58.7 45.5
Source: Belgian Cancer Registry 9 f
em
al
e g
en
ita
l o
rg
an
sB
el
gia
n C
an
Ce
r r
eg
ist
ry
7 3

Ca
nC
er
su
rv
iva
l i
n b
el
giu
mb
el
gia
n C
an
Ce
r r
eg
ist
ry
7 4
taBle 53 - ovarian CanCer (invasive): relative survival By morphology (Belgium, 2004-2008)
n at risk relative survival (%)
n % 1 year 3 year 5 year
Females
Carcinoma 3,814 91.9 79.4 57.3 44.4
Sex cord-stromal tumour 42 1.0 94.3 79.4 76.3
Germ cell tumour 67 1.6 94.4 90.6 89.0
Other specified malignant neoplasm* 108 2.6 60.6 31.1 26.9
Unspecified malignant neoplasm 118 2.8 32.0 23.1 20.4
*include 31 Müllerian mixed tumours and 49 carcinosarcoma
Source: Belgian Cancer Registry
0 1 2 3 4 5
100
80
60
40
20
0
%
0 1 2 3 4 5 6 7 8 9 10
Survival time (years)
FIGURE 97 - OVARIAN CANCER (INVASIVE): RELATIVE SURVIVAL IN BELGIUM (2004-2008)
Females Females
Source: Belgian Cancer Registry
Survival time (years)
FIGURE 98 - OVARIAN CANCER (INVASIVE): RELATIVE SURVIVAL IN THE FLEMISH REGION (1999-2008)
Source: Belgian Cancer Registry
0 1 2 3 4 5 0 1 2 3 4 5
100
80
60
40
20
0
%
Survival time (years)
BorderlineInvasive - Stage IInvasive - Stage IIInvasive - Stage IIIInvasive - Stage IVInvasive - Stage X
FIGURE 99 - OVARIAN CANCER (INVASIVE): RELATIVE SURVIVAL BY AGE GROUP (BELGIUM, 2004-2008)
15-44 years45-69 years70+ years
Source: Belgian Cancer Registry
Survival time (years)
FIGURE 100 - OVARIAN CANCER (BORDERLINE AND INVASIVE): RELATIVE SURVIVAL BY STAGE (BELGIUM, 2004-2008)
Source: Belgian Cancer Registry

10
ma
le
ge
nit
al
or
ga
ns
Be
lg
ian
Ca
nC
er
re
gis
tr
y
7 5
10 Male genital organs
10.1 pRoSTATE (iCD-10: C61)
Prostate cancer is the most frequent
tumour in males (27% of newly
diagnosed cases of cancer in 2008 in
Belgium). This cancer is generally con-
sidered non-aggressive and the mortal-
ity/incidence ratio for this disease is
rather low (0.2). Never theless, prostate
cancer is the 3rd most frequent cause of
cancer death in males (9.3% in 2008)
because of the frequent occurrence.
Age is one of the most important risk
factors associated with prostate cancer;
the mean age at diagnosis is 69 years.
In the first years following the introduc-
tion of Prostate-Specific Antigen (PSA)
testing, incidence rates did increase inter-
nationally as well as in Belgium (Flemish
Region, 1999-2005). Although this effect
has recently attenuated, prostate cancers
are still predominantly discovered after
PSA screening. Accordingly, the risk of
being diagnosed with a prostate cancer
in younger patients (aged less than 75
years) increased.
Prostate cancer is associated with high
survival rates. International literature
mentions a possible side-effect of
PSA-testing on survival. Detection of
asymptomatic and probably non-
lethal tumours tends to inflate the
denominator in survival estimates, with
numerous males having an excellent
prognosis [58;59]. This theory might
be illustrated by the decline of the
mortality rate for prostate cancer
between 1999 and 2008 (Flemish
Region). Moreover, an earlier detection
of the lesion can improve survival, as
an advanced stage is associated with a
poorer prognosis (see below).
For the incident cases from 2004 to
2008, the 5-year observed survival rate
is 77.6% and the 5-year relative survival
rate is 95.3% (Table 54, Figure 101).
For the Flemish Region (incidence years
1999-2008), the 10-year observed
and relative survival rates are 55.8%
and 89.2% respectively (Table 54,
Figure 102). This important difference
between observed and relative survival
reflects the fact that males with pros-
tate cancer often die from other causes.
Survival rates for the three different
Belgian regions were 91.7% in the
Brussels-Capital Region, 95.3% in the
Flemish Region, and 95.7% in the
Walloon Region (Table 55).
The effect of age on survival is
observed in patients of 75+ years who
have a poorer five-year survival rate
(89.0%) than younger patients. Below
75 years, survival does not seem to
depend on age (5-year relative survival
of 96.4% in 15-59 years and 96.1% in
60-74 years; Table 56).
The extent of the disease influences
survival of prostate cancer patients.
Stage I tumours are rare, since every
prostate cancer that is pathologically
staged is at minimum a stage II tumour
due to the TNM classification rules
[10]. Most tumours with known stage
are classified as stage II or III (86.9%,
of which more than three quarters are
taBle 54 - prostate CanCer: oBserved and relative survival in Belgium (2004-2008) and in the flemish region (1999-2008)
n at risk observed survival (%) relative survival (%) asrs*(%)
1 year 3 year 5 year 10 year 1 year 3 year 5 year 10 year 5 year
Belgium
Males 42,988 95.1 86.0 77.6 98.9 96.8 95.3 93.0
Flemish Region
Males 51,554 93.9 84.0 75.4 55.8 97.8 94.9 93.0 89.2
*ASRS: Age-standardised relative survival
Source: Belgian Cancer Registry

Ca
nC
er
su
rv
iva
l i
n b
el
giu
mb
el
gia
n C
an
Ce
r r
eg
ist
ry
7 6
taBle 55 - prostate CanCer: relative survival By region (2004-2008)
n at risk relative survival (%)
n % 1 year 3 year 5 year
Males
Brussels-Capital Region 2,723 6.3 98.1 94.1 91.7
Flemish Region 27,450 63.9 99.0 96.9 95.3
Walloon Region 12,815 29.8 98.6 96.9 95.7
Source: Belgian Cancer Registry
taBle 56 - prostate CanCer: relative survival By age group (Belgium, 2004-2008)
n at risk relative survival (%)
n % 1 year 3 year 5 year
Males
15-59 years 7,165 16.7 99.4 98.0 96.4
60-74 years 23,052 53.6 99.9 98.2 96.1
75+ years 12,771 29.7 96.6 92.2 89.0
Source: Belgian Cancer Registry
stage II) and have a very good progno-
sis, with a 5-year relative survival close
or equal to 100% (stage II: 103.7%;
stage III: 98.4%). Stage IV tumours
have a much poorer prognosis after 5
years of follow-up, with a 5-year rela-
tive survival of 53.2% (Figure 103).
Additional analyses were performed
to evaluate the influence of age on
the survival by stage. For stage I and
II, all age groups have a 5-year relative
survival rate of around 100%. In stage
III, a difference is noticed between
15-74 years and 75+ years (5-year
relative survival of almost 100% and
89.4%, respectively). Stage IV is, as
expected, associated with the worst
prognosis in all age groups, and a
decreasing 5-year survival rate with
age (15-59 years: 63.6%; 60-74 years:
58.6%; 75+ years: 40.4%).
0 1 2 3 4 5 0 1 2 3 4 5
100
80
60
40
20
0
%100
80
60
40
20
0
%
0 1 2 3 4 5 6 7 8 9 10
Stage I / Stage IIStage IIIStage IVStage X
FIGURE 101 - PROSTATE CANCER: RELATIVE SURVIVAL IN BELGIUM (2004-2008)
FIGURE 102 - PROSTATE CANCER: RELATIVE SURVIVAL IN THE FLEMISH REGION (1999-2008)
FIGURE 103 - PROSTATE CANCER: RELATIVE SURVIVAL BY STAGE (BELGIUM, 2004-2008)
Males Males
Survival time (years)
Source: Belgian Cancer Registry
Survival time (years)
Source: Belgian Cancer Registry
Survival time (years)
Source: Belgian Cancer Registry

10.2 TESTiS (iCD-10: C62)
Testicular cancer is a rare disease that
particularly affects younger patients:
the incidence rate in males of 50 years
and older is 7 times lower compared
with the 15-49 age group (Belgium,
2008). Cryptorchidism has been
identified as one of the risk factors
for the development of testicular
cancer. This cancer has a very good
prognosis and is therefore an uncom-
mon cause of cancer death in males
(0.1% of all cancer deaths). Indeed,
testicular cancer is known as one of
the most curable malignant neoplasms
[60-62]. In 2008, 318 new cases and
16 deaths were registered in Belgium.
For unknown reasons, the incidence
of testicular cancer is globally rising
[63;64]. This phenomenon is also
observed in Belgium, with a substantial
yearly increase in incidence in the
Flemish Region between 1999 and
2008.
For newly diagnosed cancers in 2004-
2008, 5-year relative survival is 96.2%
(Table 57). No more patients are lost
after this follow-up period: 10-year
relative survival in patients diagnosed
between 1999 and 2008 (Flemish
Region) is 96.3% (Table 57, Figure 105).
No marked differences in survival are
observed between the Belgian regions
(Table 58).
A somewhat better survival rate is
observed in patients between 15 and
49 years compared with males of
50 years and older, with 5-year relative
survival of 96.5% for 15-49 years and
93.1% for 50+ years (Table 59).
The extent of the disease at diagnosis
helps to estimate survival chances.
Stage I is the most frequent stage at
diagnosis (84.0% of cases with known
stage), and is associated with a 5-year
relative survival of 98.7%. The poorest
prognosis is, as expected, associated
with stage III tumours (5-year rela-
tive survival of 77.2%). According to
the TNM classification rules, stage IV
does not exist in testicular cancer [10]
(Figure 106).
Histological subtypes are also associ-
ated with variations in survival rates.
Germ-cell carcinoma comprise almost
all cases of testicular carcinoma
(97.1%). These are divided into two
groups: seminoma and non-seminoma.
Seminoma have a better prognosis
than non-seminoma and other or
unspecified histology, with 5-year
0 1 2 3 4 5 0 1 2 3 4 5
100
80
60
40
20
0
%100
80
60
40
20
0
%
0 1 2 3 4 5 6 7 8 9 10
Stage IStage IIStage IIIStage X
FIGURE 104 - TESTICULAR CANCER: RELATIVE SURVIVAL IN BELGIUM (2004-2008)
FIGURE 105 - TESTICULAR CANCER: RELATIVE SURVIVAL IN THE FLEMISH REGION (1999-2008)
FIGURE 106 - TESTICULAR CANCER: RELATIVE SURVIVAL BY STAGE (BELGIUM, 2004-2008)
Males Males
Survival time (years)
Source: Belgian Cancer Registry
Survival time (years)
Source: Belgian Cancer Registry
Survival time (years)
Source: Belgian Cancer Registry
10
ma
le
ge
nit
al
or
ga
ns
Be
lg
ian
Ca
nC
er
re
gis
tr
y
7 7

Ca
nC
er
su
rv
iva
l i
n b
el
giu
mb
el
gia
n C
an
Ce
r r
eg
ist
ry
7 8
taBle 57 - testiCular CanCer: oBserved and relative survival in Belgium (2004-2008) and in the flemish region (1999-2008)
n at risk observed survival (%) relative survival (%) asrs*(%)
1 year 3 year 5 year 10 year 1 year 3 year 5 year 10 year 5 year
Belgium
Males 1,356 97.9 96.0 94.8 98.2 96.8 96.2 94.2
Flemish Region
Males 1,315 97.5 95.8 94.8 93.3 97.8 96.6 96.2 96.3
*ASRS: Age-standardised relative survival
Source: Belgian Cancer Registry
taBle 58 - testiCular CanCer: relative survival By region (2004-2008)
n at risk relative survival (%)
n % 1 year 3 year 5 year
Males
Brussels-Capital Region 110 8.1 99.4 97.3 95.5
Flemish Region 732 54.0 98.5 97.5 97.0
Walloon Region 514 37.9 97.7 95.8 95.5
Source: Belgian Cancer Registry
taBle 59 - testiCular CanCer: relative survival By age group (Belgium, 2004-2008)
n at risk relative survival (%)
n % 1 year 3 year 5 year
Males
15-49 years 1,220 90.0 98.8 97.4 96.5
50+ years 136 10.0 93.0 91.4 93.1
Source: Belgian Cancer Registry
taBle 60 - testiCular CanCer: relative survival By morphology (Belgium, 2004-2008)
n at risk relative survival (%)
n % 1 year 3 year 5 year
Males
Non-seminoma 590 43.5 98.6 96.1 94.2
Seminoma 727 53.6 98.4 98.0 98.4
Other and unspecified 39 2.9 89.8 84.4 84.4
Source: Belgian Cancer Registry
relative survival rates of 98.4%, 94.2%
and 84.4% respectively (Table 60).
Non-seminoma have a clinically more
aggressive behaviour, as reflected by a
different stage distribution compared
with seminoma. Of all cases with
known stage, stage I represents 78.6%
in non-seminoma and 88.3% in
seminoma. In contrast, stage III cases
are more frequent in non-seminoma
(12.8% versus 3.0% in seminoma).

11
ur
ina
ry
tr
aC
tB
el
gia
n C
an
Ce
r r
eg
ist
ry
7 9
11 Urinary tract
11.1 kiDnEy (iCD-10: C64)
Data on incidence of kidney cancer in
Belgium for the incidence year 2008
show that this type of cancer is the
7th most frequent tumour in males
(2.9% of cancer diagnoses) and the
14th most frequent tumour in females
(2.0%). Renal cancer has a male pre-
dominance and is diagnosed at a mean
age of 64 years in males and 66 years in
females. Mortality from this cancer type
is limited, representing the 12th most
frequent cause of cancer death in males,
and the 13th most frequent cause of
cancer death in females.
Data for the Flemish Region show an
increase in incidence combined with a
decrease in mortality of kidney cancer
over the last decade (incidence years
1999-2008). These trends mainly reflect
an earlier diagnosis of renal cancer
lesions, as is confirmed by the large
significant increase in stage I tumours
[65;66].
For the incidence years 2004-2008, kid-
ney cancer in Belgium reaches a 5-year
relative survival rate of 71% in both
males and females (Table 61, Figure
107). Long-term survival data for the
Flemish Region (incidence years 1999-
2008) show a 10-year relative survival
rate of 60.6% in males and 60.5% in
females (Table 61, Figure 108). Through-
out the whole length of the observation
period, hardly any difference in survival
between males and females is observed.
0 1 2 3 4 5
100
80
60
40
20
0
%
0 1 2 3 4 5 6 7 8 9 10
FIGURE 107 - KIDNEY CANCER: RELATIVE SURVIVAL BY SEX IN BELGIUM (2004-2008)
FIGURE 108 - KIDNEY CANCER: RELATIVE SURVIVAL BY SEX IN THE FLEMISH REGION (1999-2008)
MalesFemales
MalesFemales
Survival time (years)
Source: Belgian Cancer Registry
Survival time (years)
Source: Belgian Cancer Registry
0 1 2 3 4 5 0 1 2 3 4 5
100
80
60
40
20
0
%
FIGURE 109 - KIDNEY CANCER: RELATIVE SURVIVAL BY AGE GROUP IN MALES (BELGIUM, 2004-2008)
FIGURE 110 - KIDNEY CANCER: RELATIVE SURVIVAL BY AGE GROUP IN FEMALES (BELGIUM, 2004-2008)
Survival time (years)
Source: Belgian Cancer Registry
Survival time (years)
Source: Belgian Cancer Registry
15-44 years45-64 years65+ years
15-44 years45-64 years65+ years

Ca
nC
er
su
rv
iva
l i
n b
el
giu
mb
el
gia
n C
an
Ce
r r
eg
ist
ry
8 0
taBle 62 - kidney CanCer: relative survival By region and sex (2004-2008)
n at risk relative survival (%)
n % 1 year 3 year 5 year
Males
Brussels-Capital Region 247 6.9 85.2 78.9 75.5
Flemish Region 2,216 61.6 82.5 73.1 69.5
Walloon Region 1,132 31.5 85.9 77.0 73.1
Females
Brussels-Capital Region 134 5.9 84.9 76.7 68.1
Flemish Region 1,449 64.1 83.8 75.4 69.3
Walloon Region 677 30.0 86.9 77.6 74.2
Source: Belgian Cancer Registry
Small differences in 5-year relative
survival are observed between the
three Belgian regions. In males, survival
rates are higher in the Brussels-Capital
(75.5%) and in the Walloon Region
(73.1%) in comparison to the Flem-
ish Region (69.5%). In females, 5-year
relative survival is higher in the Walloon
Region (74.2%) than in the Brussels-
Capital (68.1%) and the Flemish Region
(69.3%) (Table 62).
Survival is inversely related to the age of
the patient. The best outcome is noticed
for the youngest age group (5-year
relative survival of 79.6% in males and
86.9% in females) followed by the 45-64
years age group (74.4% in males and
76.9% in females) and the 65+ years
age group (67.0% in males and 65.4%
in females; Figure 109, Figure 110).
Five-year relative survival for kidney can-
cer is highly dependent on the extent of
the disease, ranging from 94.5% (stage
I) to 17.7% (stage IV) in males, and from
91.2% (stage I) to 15.0% (stage IV) in
females. More than half of the patients
is diagnosed with stage I or II (60.1%
of cases with known stage in males and
63.6% in females) and have a 5-year
relative survival rate of more than 80%
(Figure 111, Figure 112).
taBle 61 - kidney CanCer: oBserved and relative survival By sex in Belgium (2004-2008) and in the flemish region (1999-2008)
n at risk observed survival (%) relative survival (%) asrs*(%)
1 year 3 year 5 year 10 year 1 year 3 year 5 year 10 year 5 year
Belgium
Males 3,595 81.3 68.8 61.5 83.7 74.7 71.0 69.5
Females 2,260 82.8 71.1 62.4 84.8 76.2 70.7 70.4
Flemish Region
Males 4,156 79.5 65.8 58.2 43.6 82.0 71.7 67.4 60.6
Females 2,726 80.2 68.0 60.2 45.8 82.2 73.1 68.3 60.5
*ASRS: Age-standardised relative survival
Source: Belgian Cancer Registry
0 1 2 3 4 5 0 1 2 3 4 5
100
80
60
40
20
0
%
Stage IStage IIStage IIIStage IVStage X
FIGURE 111 - KIDNEY CANCER: RELATIVE SURVIVAL BY STAGE IN MALES (BELGIUM, 2004-2008)
FIGURE 112 - KIDNEY CANCER: RELATIVE SURVIVAL BY STAGE IN FEMALES (BELGIUM, 2004-2008)
Stage IStage IIStage IIIStage IVStage X
Survival time (years)
Source: Belgian Cancer Registry
Survival time (years)
Source: Belgian Cancer Registry

11.2 blADDER (iCD-10: C67)
Invasive bladder cancer is the 5th most
frequent cancer in males (5.2% of
all cancers in 2008), but is much less
frequent in females, leading to a male/
female ratio of 4.7. In terms of cancer
deaths, this disease is responsible for
the sixth-highest mortality rate in males
(4.7/100,000 person years) and the 12th
most frequent cancer death in females
(1.2/100,000 person years). The mean
age at diagnosis is 73 years in males and
74 years in females (Belgium, 2008).
Invasive bladder cancer has a rather
aggressive behaviour, yielding 5-year
relative survival rates of 56.6% in males
and 49.2% in females (Belgium, 2004-
2008; Table 63, Figure 113). Thereafter,
relative survival decreases to 49.6%
in males and 44.6% in females after
10 years (Flemish Region, incidence
years 1999-2008; Table 63, Figure 114).
While bladder cancer presents more
often in males, females are diagnosed
at more advanced stages and have a
poorer outcome [32]. Remarkably, this
survival disadvantage is independent of
stage. Several hypotheses have been
put forward to explain the gender
difference in bladder cancer survival,
ranging from genetic to anatomical,
hormonal and societal reasons [67].
For example, metastatic spread and
lymphatic flow may be obstructed
by higher pressure within the male
bladder due to the presence of the
prostate gland and a stronger detru-
sor muscle [68]. On the other hand,
hematuria in females may be less likely
to be regarded as an alarm symptom
warranting further clinical investigations
compared with males [69].
Looking at the different Belgian
regions, 5-year relative survival in
males is 51.9% in the Brussels-Capital
Region, 58.6% in the Flemish Region,
and 54.1% in the Walloon Region.
In females, these survival rates are
41.9%, 51.4%, and 46.5% in the
three regions respectively (Table 64).
Five-year relative survival for invasive
bladder cancer is lowest in patients of
75 years and older (45.9% in males
and 41.5% in females), and highest
in patients of 15-59 years (67.2% in
males and 59.2% in females). The
5-year relative survival rates of the
taBle 63 - Bladder CanCer (invasive): oBserved and relative survival By sex in Belgium (2004-2008) and in the flemish region (1999-2008)
n at risk observed survival (%) relative survival (%) asrs*(%)
1 year 3 year 5 year 10 year 1 year 3 year 5 year 10 year 5 year
Belgium
Males 7,087 76.7 54.9 44.0 80.9 63.7 56.6 59.0
Females 1,894 67.4 47.8 39.1 70.8 54.5 49.2 52.8
Flemish Region
Males 8,324 77.9 56.5 45.9 29.7 82.1 65.5 58.8 49.6
Females 2,238 68.9 49.9 41.8 27.2 72.4 57.2 52.6 44.6
*ASRS: Age-standardised relative survival
Source: Belgian Cancer Registry
0 1 2 3 4 5
100
80
60
40
20
0
%
0 1 2 3 4 5 6 7 8 9 10
FIGURE 113 - BLADDER CANCER (INVASIVE): RELATIVE SURVIVAL BY SEX IN BELGIUM (2004-2008)
FIGURE 114 - BLADDER CANCER (INVASIVE): RELATIVE SURVIVAL BY SEX IN THE FLEMISH REGION (1999-2008)
MalesFemales
MalesFemales
Survival time (years)
Source: Belgian Cancer Registry
Survival time (years)
Source: Belgian Cancer Registry
11
ur
ina
ry
tr
aC
tB
el
gia
n C
an
Ce
r r
eg
ist
ry
8 1

Ca
nC
er
su
rv
iva
l i
n b
el
giu
mb
el
gia
n C
an
Ce
r r
eg
ist
ry
8 2
taBle 64 - Bladder CanCer (invasive): relative survival By region and sex (2004-2008)
n at risk relative survival (%)
n % 1 year 3 year 5 year
Males
Brussels-Capital Region 570 8.0 79.8 59.1 51.9
Flemish Region 4,235 59.8 82.4 65.1 58.6
Walloon Region 2,282 32.2 78.3 62.3 54.1
Females
Brussels-Capital Region 166 8.8 67.4 47.8 41.9
Flemish Region 1,158 61.1 72.1 56.1 51.4
Walloon Region 570 30.1 69.0 53.2 46.5
Source: Belgian Cancer Registry
taBle 65 - Bladder CanCer (invasive): relative survival By age group and sex (Belgium, 2004-2008)
n at risk relative survival (%)
n % 1 year 3 year 5 year
Males
15-59 years 1,037 14.6 89.7 73.9 67.2
60-74 years 2,901 40.9 85.7 68.7 61.1
75+ years 3,149 44.4 72.9 54.3 45.9
Females
15-59 years 229 12.1 82.8 64.6 59.2
60-74 years 614 32.4 78.9 63.4 56.5
75+ years 1,051 55.5 62.9 46.2 41.5
Source: Belgian Cancer Registry
middle age group (60-74 years) lies in
between (61.1% in males and 56.5%
in females). Most invasive bladder can-
cers are diagnosed in patients of 75
years of age or more: 44.4% in males
and 55.5% in females (Table 65).
Two non-invasive bladder cancer types
also exist: papillary (pTa) and flat (pTis)
urothelial carcinoma. While pTa lesions
hardly influence prognosis (stage 0a:
5-year relative survival of 97.5% in
males and 99.8% in females), pTis
lesions are associated with a more
aggressive behaviour, especially in
males (stage 0is: 5-year relative survival
of 90.0% in males and 98.0% in
females). Contrary to the observations
for invasive bladder cancer, survival
rates for the non-invasive lesions
are higher in females than in males
(Figure 115, Figure 116). pTis lesions
represent 1.8% of all bladder cancers
(invasive and non-invasive) in males
and 1.4% in females (Belgium, 2004-
2008). Papillary pTa lesions are much
more frequent, covering 34.7% of
all bladder cancer cases in males and
36.1% in females.
Once the cancer is invasive, survival
rates are considerably lower, ranging
from 77.9% to 20.2% in males and
from 74.1% to 12.2% in females,
for stage I to stage IV respectively
(Figure 115, Figure 116).
Note that misclassification in the blad-
der cancer data involving separation
of in situ/non-invasive and superficially
invasive carcinomas, as well as papil-
lary and flat lesions, must be taken
into account. This phenomenon is
shared amongst cancer registries and
hampers international comparisons of
data on bladder cancer incidence and
survival.
0 1 2 3 4 5 0 1 2 3 4 5
100
80
60
40
20
0
%
Stage 0aStage 0isStage IStage IIStage IIIStage IVStage X
FIGURE 115 - BLADDER CANCER (INVASIVE, pTis AND pTa): RELATIVE SURVIVAL BY AGE GROUP IN MALES (BELGIUM, 2004-2008)
FIGURE 116 - BLADDER CANCER (INVASIVE, pTis AND pTa): RELATIVE SURVIVAL BY AGE GROUP IN FEMALES (BELGIUM, 2004-2008)
Stage 0aStage 0isStage IStage IIStage IIIStage IVStage X
Survival time (years)
Source: Belgian Cancer Registry
Survival time (years)
Source: Belgian Cancer Registry

12 Central Nervous System
Tumours of the central nervous system
(CNS) are rare both in males (2008:
1.4% of all cancer diagnoses in
Belgium) and females (2008: 1.2%).
The mean age at diagnosis is 56 years
in males and 54 in females. Despite its
infrequent occurrence, tumours of the
CNS are the 11th most frequent cause
of death in both males (2.4%) and
females (2.3%). Tumours arising from
the central nervous system may have
a different behaviour, ranging from
benign to malignant. Only malignant
tumours are considered in the present
booklet.
Survival of CNS tumours rapidly
decreases after diagnosis: 1-year rela-
tive survival is only 51.1% in males
and 52.6% in females. About half of
the one-year survivors are still alive
at the 5-year follow-up point: 5-year
relative survival rates are 22.7% in
males and 25.8% in females (Belgium,
2004-2008; Table 66, Figure 117).
Long-term survivors of this disease are
(iCD-10: C71-C72)
taBle 66 - tumours of the Central nervous system: oBserved and relative survival By sex in Belgium (2004-2008) and in the flemish region (1999-2008)
n at risk observed survival (%) relative survival (%) asrs*(%)
1 year 3 year 5 year 10 year 1 year 3 year 5 year 10 year 5 year
Belgium
Males 1,922 50.0 27.8 21.4 51.1 28.9 22.7 25.0
Females 1,403 51.9 30.0 25.0 52.6 30.6 25.8 28.5
Flemish Region
Males 2,312 49.0 25.5 20.9 14.7 50.0 26.4 22.0 16.0
Females 1,718 48.8 27.6 23.6 17.9 49.5 28.3 24.6 19.2
*ASRS: Age-standardised relative survival
Source: Belgian Cancer Registry
taBle 67 - tumours of the Central nervous system: relative survival By region and sex (2004-2008)
n at risk relative survival (%)
n % 1 year 3 year 5 year
Males
Brussels-Capital Region 130 6.8 53.6 37.1 26.2
Flemish Region 1,199 62.4 51.0 27.3 21.7
Walloon Region 593 30.9 50.7 30.5 24.1
Females
Brussels-Capital Region 118 8.4 53.2 29.1 25.4
Flemish Region 832 59.3 53.1 30.2 25.3
Walloon Region 453 32.3 51.6 31.8 27.1
Source: Belgian Cancer Registry
taBle 68 - tumours of the Central nervous system: relative survival By age group and sex (Belgium, 2004-2008)
n at risk relative survival (%)
n % 1 year 3 year 5 year
Males
15-24 years 81 4.2 87.6 73.7 65.9
25-59 years 905 47.1 67.0 41.0 33.6
60+ years 936 48.7 31.8 12.7 7.6
Females
15-24 years 55 3.9 90.9 77.7 71.5
25-59 years 617 44.0 73.9 48.9 42.2
60+ years 731 52.1 31.3 11.0 8.0
Source: Belgian Cancer Registry
12
Ce
nt
ra
l n
er
vo
us
sy
st
em
B
el
gia
n C
an
Ce
r r
eg
ist
ry
8 3

Ca
nC
er
su
rv
iva
l i
n b
el
giu
mb
el
gia
n C
an
Ce
r r
eg
ist
ry
8 4
relatively rare resulting in 10-year rela-
tive survival rates of 16.0% in males
and 19.2% in females (Flemish Region,
1999-2008; Table 66, Figure 118). The
slightly better prognosis in females
in comparison with males becomes
apparent after one year of follow-up.
Survival rates are comparable between
the three Belgian regions, in both
males and females (Table 67).
The age of the patients at time of
diagnosis appears to be an important
prognostic factor. Highest 5-year
relative survival estimates are noted
in patients aged 15-24 years (males:
65.9%, females: 71.5%) who repre-
sent less than 5% of all cases. Patients
between 25-59 years of age have an
intermediate 5-year relative survival
of 33.6% in males and 42.2% in
females. Tumours of the CNS diag-
nosed in patients of 60 years and older
have a very poor prognosis (5-year
relative survival of 7.6% in males and
8.0% in females; Table 68).
Astrocytic tumours have a much worse
prognosis than the other histological
subtypes: 5-year relative survival for
astrocytic tumours is 12.3% in males
and 16.2% in females compared with
59.1% in males and 57.5% in females
for the other subtypes (Table 69).
These tumours are by large the most
frequently occurring CNS tumours
(around 75%). However, even within
the astrocytic tumours, a prognostic
distinction can be made according
to the WHO tumour grade [30;70]9.
Astrocytic tumours with WHO grade
II have 5-year relative survival rates
of 52.8% in males and 55.8% in
females. WHO grade III tumours do
worse, with 5-year relative survival
rates of 20.9% in males and 28.9%
in females. The largest group of astro-
cytic tumours are grade IV (glioblas-
toma, 79.3% of astrocytic tumours in
males, 75.1% in females), and have
very poor 5-year survival rates of 4.7%
in males and 6.2% in females (Figure
119, Figure 120).
9 Astrocytic tumours with WHO grade I are classified as benign and are not discussed in this booklet.
taBle 69 - tumours of the Central nervous system: relative survival By morphology and sex (Belgium, 2004-2008)
n at risk relative survival (%)
n % 1 year 3 year 5 year
Males
Astrocytic tumour 1,460 79.9 43.6 17.8 12.3
Oligodendroglial tumour and mixed glioma 224 12.3 82.8 68.6 57.7
Ependymal tumour 61 3.3 88.0 88.9 80.3
Glioma, other 63 3.4 64.6 47.4 48.2
Medulloblastoma 12 0.7 * * *
Embryonal tumour, other 7 0.4 * * *
Females
Astrocytic tumour 1,049 79.2 45.3 20.5 16.2
Oligodendroglial tumour and mixed glioma 165 12.5 84.7 64.8 53.8
Ependymal tumour 53 4.0 81.8 73.5 71.9
Glioma, other 41 3.1 57.2 55.5 56.1
Medulloblastoma 10 0.8 * * *
Embryonal tumour, other 7 0.5 * * *
Note: 138 males and 137 females with other or undefined morphology (excluded data).
* Results not displayed due to less than 35 cases.
Source: Belgian Cancer Registry

0 1 2 3 4 5
100
80
60
40
20
0
%
0 1 2 3 4 5 6 7 8 9 10
Survival time (years)
FIGURE 117 - TUMOURS OF THE CENTRAL NERVOUS SYSTEM: RELATIVE SURVIVAL BY SEX IN BELGIUM (2004-2008)
MalesFemales
MalesFemales
Source: Belgian Cancer Registry
Survival time (years)
FIGURE 118 - TUMOURS OF THE CENTRAL NERVOUS SYSTEM: RELATIVE SURVIVAL BY SEX IN THE FLEMISH REGION (1999-2008)
Source: Belgian Cancer Registry
0 1 2 3 4 5 0 1 2 3 4 5
100
80
60
40
20
0
%
Survival time (years)
FIGURE 119 - TUMOURS OF THE CENTRAL NERVOUS SYSTEM, ASTROCYTIC TUMOURS: RELATIVE SURVIVAL BY WHO GRADE IN MALES (BELGIUM, 2004-2008)
WHO II WHO III WHO IV
WHO II WHO III WHO IV
Source: Belgian Cancer Registry
Survival time (years)
FIGURE 120 - TUMOURS OF THE CENTRAL NERVOUS SYSTEM, ASTROCYTIC TUMOURS: RELATIVE SURVIVAL BY WHO GRADE IN FEMALES (BELGIUM, 2004-2008)
Source: Belgian Cancer Registry
12
Ce
nt
ra
l n
er
vo
us
sy
st
em
B
el
gia
n C
an
Ce
r r
eg
ist
ry
8 5

Ca
nC
er
su
rv
iva
l i
n b
el
giu
mb
el
gia
n C
an
Ce
r r
eg
ist
ry
8 6
Thyroid cancer is an uncommon cancer
in males (0.6% of all cancer cases
in Belgium 2008) but ranks 13th in
females (2.0% in Belgium 2008). The
mortality rates for this cancer type are
very low, representing 0.2% and 0.4%
of cancer deaths in males and females
respectively. Thyroid cancer is known
as a cancer with one of the highest
survival rates, confirmed by its mortal-
ity/incidence ratio of 0.1 [71].
Over recent decades, an increase in inci-
dence rates has been observed world-
wide, while mortality seems to remain
stable or even appears to decrease
[72]. In Belgium (2004-2008) and
over a longer period in Flemish Region
(1999-2008), a rise in incidence and
a decrease in mortality in both sexes
are noted. A partial explanation of the
increasing incidence may be the use of
more intensive and sensitive diagnostic/
therapeutic procedures, as suggested
by literature [73]. However, this intensi-
13 Thyroid(iCD-10: C73)
fication of clinical practice cannot fully
explain the observed increase [74;75].
In Belgium (incidence 2004-2008),
females have a better survival rate
than males, with a 5-year relative
survival of 89.3% in males and 94.1%
in females (Table 70, Figure 121). After
10 years of follow-up (Flemish Region,
1999-2008), this sex discrepancy is
even more evident, with a relative
survival of 71.8% in males and 84.6%
in females (Table 70, Figure 122).
For the period 2004-2008, the Flemish
Region shows a poorer survival rate
than the two other Belgian regions,
in both sexes (Table 71). This is partly
due to a difference in the distribution
of morphological types which show
different prognosis (see below). There
is a higher proportion of papillary
carcinoma with good prognosis in
the Brussels-Capital (73.1% in males,
83.9% in females) and Walloon Region
(73.5% in males, 84.3% in females)
as compared with the Flemish Region
(53.6% in males, 66.6% in females).
In both sexes, survival for thyroid
cancer decreases with age. Patients
of 70 years and older have the
lowest survival rates (5-year relative
survival: 58.8% in males and 72.9%
in females), compared with the other
age groups for whom higher survival
rates are observed (Figure 123, Figure
124). This can at least partly be
explained by a higher proportion of
stage IV tumours in 70+ years patients
(32.6% compared with 7.7% in
40-69 years and 1.6% in 15-39 years),
and a higher proportion of stage I
tumours in younger patients (66.4% in
15-39 years and 34.3% in 40-69 years
compared with 16.6% in 70+ years).
Early stage tumours (stage I and II) are
characterized by an extremely good
outcome, since 5-year relative survival
taBle 70 - thyroid CanCer: oBserved and relative survival By sex in Belgium (2004-2008) and in the flemish region (1999-2008)
n at risk observed survival (%) relative survival (%) asrs*(%)
1 year 3 year 5 year 10 year 1 year 3 year 5 year 10 year 5 year
Belgium
Males 798 92.1 87.7 83.5 93.5 91.3 89.3 85.2
Females 2,352 95.0 92.9 90.6 95.8 94.9 94.1 90.3
Flemish Region
Males 590 86.1 80.1 75.7 60.4 87.6 83.9 81.4 71.8
Females 1,624 90.6 87.0 84.1 77.1 91.6 89.2 87.7 84.6
*ASRS: Age-standardised relative survival
Source: Belgian Cancer Registry
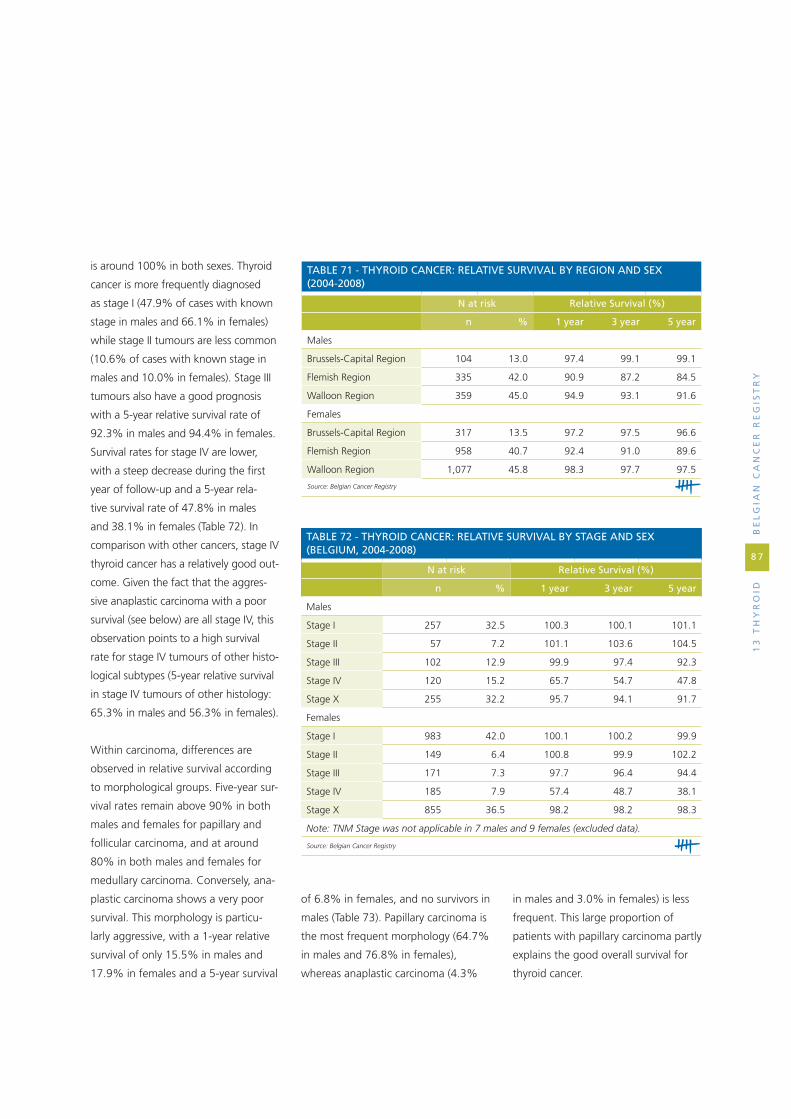
13
th
yr
oid
B
el
gia
n C
an
Ce
r r
eg
ist
ry
8 7
is around 100% in both sexes. Thyroid
cancer is more frequently diagnosed
as stage I (47.9% of cases with known
stage in males and 66.1% in females)
while stage II tumours are less common
(10.6% of cases with known stage in
males and 10.0% in females). Stage III
tumours also have a good prognosis
with a 5-year relative survival rate of
92.3% in males and 94.4% in females.
Survival rates for stage IV are lower,
with a steep decrease during the first
year of follow-up and a 5-year rela-
tive survival rate of 47.8% in males
and 38.1% in females (Table 72). In
comparison with other cancers, stage IV
thyroid cancer has a relatively good out-
come. Given the fact that the aggres-
sive anaplastic carcinoma with a poor
survival (see below) are all stage IV, this
observation points to a high survival
rate for stage IV tumours of other histo-
logical subtypes (5-year relative survival
in stage IV tumours of other histology:
65.3% in males and 56.3% in females).
Within carcinoma, differences are
observed in relative survival according
to morphological groups. Five-year sur-
vival rates remain above 90% in both
males and females for papillary and
follicular carcinoma, and at around
80% in both males and females for
medullary carcinoma. Conversely, ana-
plastic carcinoma shows a very poor
survival. This morphology is particu-
larly aggressive, with a 1-year relative
survival of only 15.5% in males and
17.9% in females and a 5-year survival
taBle 71 - thyroid CanCer: relative survival By region and sex (2004-2008)
n at risk relative survival (%)
n % 1 year 3 year 5 year
Males
Brussels-Capital Region 104 13.0 97.4 99.1 99.1
Flemish Region 335 42.0 90.9 87.2 84.5
Walloon Region 359 45.0 94.9 93.1 91.6
Females
Brussels-Capital Region 317 13.5 97.2 97.5 96.6
Flemish Region 958 40.7 92.4 91.0 89.6
Walloon Region 1,077 45.8 98.3 97.7 97.5
Source: Belgian Cancer Registry
taBle 72 - thyroid CanCer: relative survival By stage and sex (Belgium, 2004-2008)
n at risk relative survival (%)
n % 1 year 3 year 5 year
Males
Stage I 257 32.5 100.3 100.1 101.1
Stage II 57 7.2 101.1 103.6 104.5
Stage III 102 12.9 99.9 97.4 92.3
Stage IV 120 15.2 65.7 54.7 47.8
Stage X 255 32.2 95.7 94.1 91.7
Females
Stage I 983 42.0 100.1 100.2 99.9
Stage II 149 6.4 100.8 99.9 102.2
Stage III 171 7.3 97.7 96.4 94.4
Stage IV 185 7.9 57.4 48.7 38.1
Stage X 855 36.5 98.2 98.2 98.3
Note: TNM Stage was not applicable in 7 males and 9 females (excluded data).
Source: Belgian Cancer Registry
of 6.8% in females, and no survivors in
males (Table 73). Papillary carcinoma is
the most frequent morphology (64.7%
in males and 76.8% in females),
whereas anaplastic carcinoma (4.3%
in males and 3.0% in females) is less
frequent. This large proportion of
patients with papillary carcinoma partly
explains the good overall survival for
thyroid cancer.
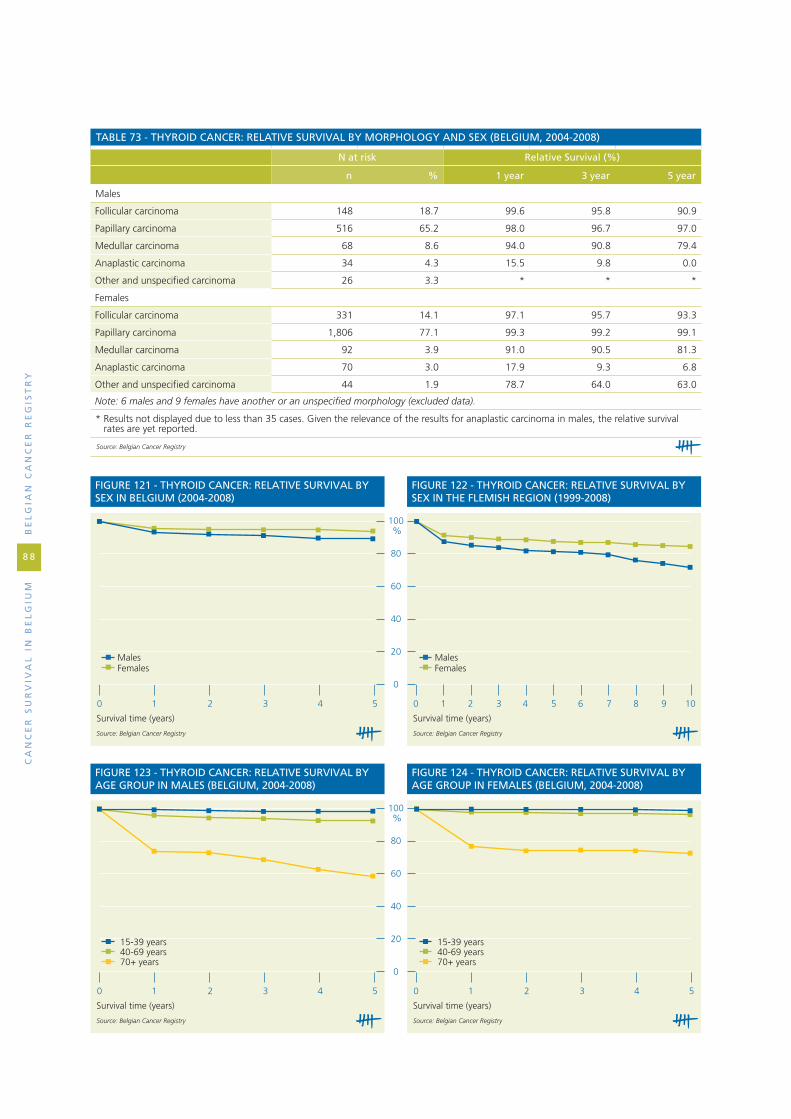
Ca
nC
er
su
rv
iva
l i
n b
el
giu
mb
el
gia
n C
an
Ce
r r
eg
ist
ry
8 8
taBle 73 - thyroid CanCer: relative survival By morphology and sex (Belgium, 2004-2008)
n at risk relative survival (%)
n % 1 year 3 year 5 year
Males
Follicular carcinoma 148 18.7 99.6 95.8 90.9
Papillary carcinoma 516 65.2 98.0 96.7 97.0
Medullar carcinoma 68 8.6 94.0 90.8 79.4
Anaplastic carcinoma 34 4.3 15.5 9.8 0.0
Other and unspecified carcinoma 26 3.3 * * *
Females
Follicular carcinoma 331 14.1 97.1 95.7 93.3
Papillary carcinoma 1,806 77.1 99.3 99.2 99.1
Medullar carcinoma 92 3.9 91.0 90.5 81.3
Anaplastic carcinoma 70 3.0 17.9 9.3 6.8
Other and unspecified carcinoma 44 1.9 78.7 64.0 63.0
Note: 6 males and 9 females have another or an unspecified morphology (excluded data).
* Results not displayed due to less than 35 cases. Given the relevance of the results for anaplastic carcinoma in males, the relative survival rates are yet reported.
Source: Belgian Cancer Registry
0 1 2 3 4 5 0 1 2 3 4 5
100
80
60
40
20
0
%
Survival time (years)
FIGURE 123 - THYROID CANCER: RELATIVE SURVIVAL BY AGE GROUP IN MALES (BELGIUM, 2004-2008)
15-39 years40-69 years70+ years
15-39 years40-69 years70+ years
Source: Belgian Cancer Registry
Survival time (years)
FIGURE 124 - THYROID CANCER: RELATIVE SURVIVAL BY AGE GROUP IN FEMALES (BELGIUM, 2004-2008)
Source: Belgian Cancer Registry
0 1 2 3 4 5
100
80
60
40
20
0
%
0 1 2 3 4 5 6 7 8 9 10
Survival time (years)
FIGURE 121 - THYROID CANCER: RELATIVE SURVIVAL BY SEX IN BELGIUM (2004-2008)
MalesFemales
MalesFemales
Source: Belgian Cancer Registry
Survival time (years)
FIGURE 122 - THYROID CANCER: RELATIVE SURVIVAL BY SEX IN THE FLEMISH REGION (1999-2008)
Source: Belgian Cancer Registry

ap
pe
nd
iCe
sB
el
gia
n C
an
Ce
r r
eg
ist
ry
8 9
taB
le 7
4 -
ov
erv
iew
By
iCd
-10:
oB
ser
ved
an
d r
ela
tiv
e su
rv
iva
l in
ma
les,
Bel
giu
m (
2004
-200
8)
iCd
-10
Can
cer
med
ian
ob
serv
ed
surv
ival
(m
onth
s)
ob
serv
ed s
urv
ival
(%
)r
elat
ive
surv
ival
(%
)
n%
1 ye
ar2
year
3 ye
ar4
year
5 ye
ar1
year
2 ye
ar3
year
4 ye
ar5
year
C00
Lip
22
40.
16>
6092
.987
.183
.075
.369
.796
.794
.594
.189
.686
.6
C01
Base
of
tong
ue
32
20.
2328
70.5
52.8
45.4
37.6
36.2
71.7
54.6
47.6
40.2
39.8
C02
Tong
ue
75
30.
5336
73.5
57.8
49.9
46.0
41.9
74.9
60.0
52.5
49.4
45.9
C03
Gum
15
10.
1142
69.5
56.3
51.7
49.4
45.2
71.4
59.0
55.2
54.0
50.5
C04
Floo
r of
mou
th
69
10.
4845
77.4
63.8
56.5
48.3
44.1
78.6
65.7
58.8
50.9
47.3
C05
Pala
te
26
70.
1950
80.5
68.4
58.5
52.5
44.6
82.0
71.1
61.8
56.5
48.9
C06
Mou
th, N
OS
30
20.
2143
73.8
59.9
52.6
48.3
45.4
75.8
63.1
56.3
52.9
51.0
C07
Paro
tid g
land
225
0.16
5579
.668
.461
.753
.849
.482
.974
.069
.062
.759
.6
C08
Saliv
ary
glan
ds, N
OS
78
0.05
>60
80.8
71.8
62.7
55.0
50.2
83.4
76.2
68.4
61.5
59.1
C09
Tons
il
78
30.
5539
75.7
59.7
51.5
45.8
41.9
77.1
61.8
53.9
48.9
45.3
C10
Oro
phar
ynx
47
60.
3322
66.3
48.2
41.4
35.3
29.6
67.4
49.7
43.0
37.5
31.9
C11
Nas
opha
rynx
17
30.
12>
6085
.069
.965
.260
.356
.686
.472
.167
.863
.360
.0
C12
Pyrif
orm
sin
us
59
10.
4122
67.7
47.5
37.0
28.2
24.3
68.8
49.1
38.7
30.1
26.3
C13
Hyp
opha
rynx
27
60.
1917
59.6
40.7
32.2
27.6
22.6
60.7
42.1
33.6
29.1
23.9
C14
Lip,
ora
l cav
ity a
nd p
hary
nx,
NO
S
134
0.09
1556
.040
.332
.025
.124
.157
.041
.933
.826
.926
.2
C15
Oes
opha
gus
2,
854
2.00
1352
.634
.426
.822
.920
.154
.236
.428
.925
.322
.9
C16
Stom
ach
3,73
62.
6213
52.4
37.3
29.4
26.0
24.2
55.0
40.7
33.3
30.6
29.6
C17
Smal
l int
estin
e
422
0.30
>60
77.7
69.0
63.4
58.4
53.2
80.3
73.3
69.3
66.1
62.0
C18
Col
on
11,6
578.
1758
78.5
68.0
60.3
54.1
49.2
82.3
74.6
69.0
65.0
62.2
C19
Rect
osig
moi
d ju
nctio
n
86
20.
60>
6082
.571
.063
.857
.151
.386
.177
.172
.267
.763
.9
C20
Rect
um
5,
989
4.20
>60
82.9
72.2
64.1
58.0
52.7
86.3
78.0
71.7
67.5
64.0
C21
Anu
s an
d an
al c
anal
224
0.16
>60
79.5
68.8
60.1
55.2
51.2
82.6
73.9
66.8
63.8
62.1
Appe
ndic
esA
ppEn
Dix
1 –
ovE
RviE
w b
y iC
D-1
0: o
bSER
vED
An
D R
ElAT
ivE
SURv
ivA
l

Ca
nC
er
su
rv
iva
l i
n b
el
giu
mb
el
gia
n C
an
Ce
r r
eg
ist
ry
9 0
C22
Live
r an
d in
trah
epat
ic b
ile d
ucts
1,47
91.
049
45.0
32.6
25.7
21.7
18.2
46.3
34.4
27.7
24.0
20.7
C23
Gal
lbla
dder
13
00.
097
39.2
22.3
16.9
15.0
10.0
41.3
24.6
19.4
17.8
13.4
C24
Bilia
ry t
ract
, NO
S
55
70.
3914
54.0
34.1
26.6
22.2
20.6
56.4
36.9
29.7
25.7
24.6
C25
Panc
reas
2,63
41.
857
32.9
17.4
12.6
10.1
8.7
34.1
18.6
13.6
11.1
9.9
C26
Oth
er il
l-defi
ned
dige
stiv
e or
gans
47
0.03
427
.714
.98.
58.
58.
529
.016
.19.
49.
69.
7
C30
Nas
al c
avity
and
mid
dle
ear
10
20.
07>
6085
.373
.568
.659
.454
.088
.378
.675
.867
.564
.0
C31
Acc
esso
ry s
inus
es
275
0.19
5577
.067
.958
.052
.146
.279
.371
.762
.757
.853
.1
C32
Lary
nx
2,
631
1.84
>60
82.6
71.1
63.9
58.8
53.8
84.9
74.9
69.1
65.5
61.8
C33
Trac
hea
370.
035
27.0
16.2
13.5
8.1
5.4
28.1
17.3
14.7
9.0
6.2
C34
Bron
chus
and
lung
23,7
5716
.66
941
.524
.117
.614
.412
.543
.125
.819
.316
.214
.6
C37
Thym
us
74
0.05
>60
82.4
66.2
62.1
57.9
56.3
84.3
69.5
66.9
64.0
64.0
C38
Hea
rt, m
edia
stin
um a
nd p
leur
a
490.
0322
63.3
49.0
49.0
46.8
42.5
64.6
51.1
52.1
50.8
48.3
C39
Resp
irato
ry s
yste
m a
nd in
tra-
thor
acic
org
ans,
NO
S1
0.00
**
**
**
**
**
*
C4
0B
on
e an
d a
rtic
ula
r ca
rtila
ge
of
limb
s
139
0.10
>60
89.9
79.9
74.0
70.5
69.4
90.9
81.3
75.7
72.9
72.4
C41
Bone
and
art
icul
ar c
artil
age,
N
OS
14
80.
10>
6083
.870
.962
.758
.057
.085
.373
.465
.961
.962
.0
C43
Mal
igna
nt m
elan
oma
of s
kin*
* 2,
826
1.98
>60
94.2
87.7
82.8
79.1
76.0
96.6
92.2
89.2
87.4
86.2
C45
Mes
othe
liom
a
91
30.
6410
44.5
21.1
10.3
6.1
4.1
46.3
22.7
11.2
6.9
4.9
C46
Kap
osi's
sar
com
a
11
30.
08>
6087
.683
.279
.677
.274
.189
.586
.784
.583
.681
.9
C47
,C49
Soft
tis
sues
761
0.53
4483
.373
.767
.162
.859
.986
.278
.773
.871
.470
.4
C48
Retr
oper
itone
um a
nd p
erito
-ne
um99
0.07
4172
.759
.653
.546
.943
.674
.962
.857
.451
.648
.9
C50
Brea
st
34
20.
24>
6089
.584
.879
.270
.864
.293
.291
.989
.383
.278
.2
C60
Peni
s
30
00.
21>
6082
.771
.765
.360
.251
.986
.378
.173
.971
.064
.0
C61
Pros
tate
42,9
8830
.14
>60
95.1
90.4
86.0
81.7
77.6
98.9
97.7
96.8
95.9
95.3
C62
Test
is
1,
356
0.95
>60
97.9
96.5
96.0
95.2
94.8
98.2
97.0
96.8
96.3
96.2
C63
Mal
e ge
nita
l org
ans,
NO
S
47
0.03
>60
87.2
85.1
80.9
78.2
70.4
90.0
90.1
87.8
87.2
81.0
C64
Kid
ney
3,59
52.
52>
6081
.374
.468
.864
.961
.583
.778
.874
.772
.771
.0
C65
Rena
l pel
vis
389
0.27
2868
.954
.243
.038
.634
.471
.959
.249
.146
.143
.0
C66
Ure
ter
285
0.20
3778
.661
.851
.443
.839
.482
.367
.558
.351
.948
.7
taB
le 7
4 -
ov
erv
iew
By
iCd
-10:
oB
ser
ved
an
d r
ela
tiv
e su
rv
iva
l in
ma
les,
Bel
giu
m (
2004
-200
8)
iCd
-10
Can
cer
med
ian
ob
serv
ed
surv
ival
(m
onth
s)
ob
serv
ed s
urv
ival
(%
)r
elat
ive
surv
ival
(%
)
n
%1
year
2 ye
ar3
year
4 ye
ar5
year
1 ye
ar2
year
3 ye
ar4
year
5 ye
ar
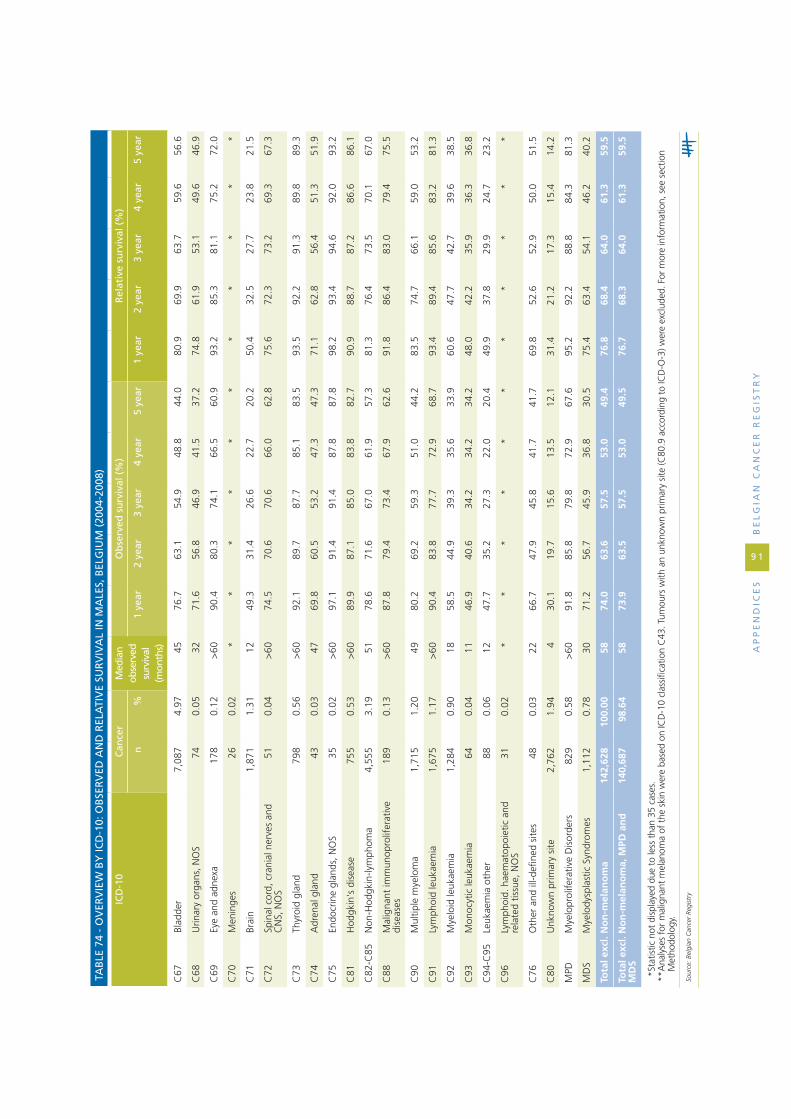
C67
Blad
der
7,08
74.
9745
76.7
63.1
54.9
48.8
44.0
80.9
69.9
63.7
59.6
56.6
C68
Urin
ary
orga
ns, N
OS
74
0.05
3271
.656
.846
.941
.537
.274
.861
.953
.149
.646
.9
C69
Eye
and
adne
xa
17
80.
12>
6090
.480
.374
.166
.560
.993
.285
.381
.175
.272
.0
C70
Men
inge
s
260.
02*
**
**
**
**
**
C71
Brai
n
1,
871
1.31
1249
.331
.426
.622
.720
.250
.432
.527
.723
.821
.5
C72
Spin
al c
ord,
cra
nial
ner
ves
and
CN
S, N
OS
51
0.04
>60
74.5
70.6
70.6
66.0
62.8
75.6
72.3
73.2
69.3
67.3
C73
Thyr
oid
glan
d
79
80.
56>
6092
.189
.787
.785
.183
.593
.592
.291
.389
.889
.3
C74
Adr
enal
gla
nd
43
0.03
4769
.860
.553
.247
.347
.371
.162
.856
.451
.351
.9
C75
Endo
crin
e gl
ands
, NO
S
35
0.02
>60
97.1
91.4
91.4
87.8
87.8
98.2
93.4
94.6
92.0
93.2
C81
Hod
gkin
's d
isea
se
75
50.
53>
6089
.987
.185
.083
.882
.790
.988
.787
.286
.686
.1
C82
-C85
Non
-Hod
gkin
-lym
phom
a4,
555
3.19
5178
.671
.667
.061
.957
.381
.376
.473
.570
.167
.0
C88
Mal
igna
nt im
mun
opro
lifer
ativ
e di
seas
es
18
90.
13>
6087
.879
.473
.467
.962
.691
.886
.483
.079
.475
.5
C90
Mul
tiple
mye
lom
a
1,
715
1.20
4980
.269
.259
.351
.044
.283
.574
.766
.159
.053
.2
C91
Lym
phoi
d le
ukae
mia
1,67
51.
17>
6090
.483
.877
.772
.968
.793
.489
.485
.683
.281
.3
C92
Mye
loid
leuk
aem
ia
1,
284
0.90
1858
.544
.939
.335
.633
.960
.647
.742
.739
.638
.5
C93
Mon
ocyt
ic le
ukae
mia
640.
0411
46.9
40.6
34.2
34.2
34.2
48.0
42.2
35.9
36.3
36.8
C94
-C95
Leuk
aem
ia o
ther
880.
0612
47.7
35.2
27.3
22.0
20.4
49.9
37.8
29.9
24.7
23.2
C96
Lym
phoi
d. h
aem
atop
oiet
ic a
nd
rela
ted
tissu
e, N
OS
310.
02*
**
**
**
**
**
C76
Oth
er a
nd il
l-defi
ned
site
s
48
0.03
2266
.747
.945
.841
.741
.769
.852
.652
.950
.051
.5
C80
Unk
now
n pr
imar
y si
te
2,76
21.
944
30.1
19.7
15.6
13.5
12.1
31.4
21.2
17.3
15.4
14.2
MPD
Mye
lopr
olife
rativ
e D
isor
ders
829
0.58
>60
91.8
85.8
79.8
72.9
67.6
95.2
92.2
88.8
84.3
81.3
MD
SM
yelo
dysp
last
ic S
yndr
omes
1,
112
0.78
3071
.256
.745
.936
.830
.575
.463
.454
.146
.240
.2
Tota
l exc
l. N
on
-mel
ano
ma
142,
628
100.
0058
74.0
63.6
57.5
53.0
49.4
76.8
68.4
64.0
61.3
59.5
Tota
l exc
l. N
on
-mel
ano
ma,
MPD
an
d
MD
S14
0,68
798
.64
5873
.963
.557
.553
.049
.576
.768
.364
.061
.359
.5
*St
atis
tic n
ot d
ispl
ayed
due
to
less
tha
n 35
cas
es.
** A
naly
ses
for
mal
igna
nt m
elan
oma
of t
he s
kin
wer
e ba
sed
on IC
D-1
0 cl
assi
ficat
ion
C43
. Tum
ours
with
an
unkn
own
prim
ary
site
(C80
.9 a
ccor
ding
to
ICD
-O-3
) wer
e ex
clud
ed. F
or m
ore
info
rmat
ion,
see
sec
tion
Met
hodo
logy
.
Sour
ce: B
elgi
an C
ance
r Re
gist
ry
taB
le 7
4 -
ov
erv
iew
By
iCd
-10:
oB
ser
ved
an
d r
ela
tiv
e su
rv
iva
l in
ma
les,
Bel
giu
m (
2004
-200
8)
iCd
-10
Can
cer
med
ian
ob
serv
ed
surv
ival
(m
onth
s)
ob
serv
ed s
urv
ival
(%
)r
elat
ive
surv
ival
(%
)
n
%1
year
2 ye
ar3
year
4 ye
ar5
year
1 ye
ar2
year
3 ye
ar4
year
5 ye
ar
ap
pe
nd
iCe
sB
el
gia
n C
an
Ce
r r
eg
ist
ry
9 1

Ca
nC
er
su
rv
iva
l i
n b
el
giu
mb
el
gia
n C
an
Ce
r r
eg
ist
ry
9 2
taB
le 7
5 -
ov
erv
iew
By
iCd
-10:
oB
ser
ved
an
d r
ela
tiv
e su
rv
iva
l in
fem
ale
s, B
elg
ium
(20
04-2
008)
iCd
-10
Can
cer
med
ian
ob
serv
ed
surv
ival
(m
onth
s)
ob
serv
ed s
urv
ival
(%
)r
elat
ive
surv
ival
(%
)
n%
1 ye
ar2
year
3 ye
ar4
year
5 ye
ar1
year
2 ye
ar3
year
4 ye
ar5
year
C00
Lip
81
0.07
>60
93.8
90.1
80.1
78.6
77.0
98.4
99.8
93.0
96.1
99.6
C01
Base
of
tong
ue
87
0.07
3674
.760
.949
.949
.945
.175
.962
.551
.752
.346
.8
C02
Tong
ue
30
30.
25>
6076
.966
.758
.953
.951
.178
.769
.462
.157
.655
.3
C03
Gum
11
70.
1051
69.2
59.8
52.9
51.8
47.7
71.7
63.1
56.8
57.0
53.5
C04
Floo
r of
mou
th
18
50.
15>
6078
.969
.261
.056
.353
.580
.171
.063
.058
.856
.6
C05
Pala
te
13
50.
11>
6090
.479
.374
.771
.068
.991
.781
.777
.875
.173
.5
C06
Mou
th, N
OS
16
20.
1352
75.3
61.1
56.1
51.7
44.3
78.0
65.0
61.3
58.3
51.8
C07
Paro
tid g
land
183
0.15
>60
83.1
74.9
71.0
66.9
62.5
85.4
78.5
75.8
73.2
69.9
C08
Saliv
ary
glan
ds, N
OS
73
0.06
>60
84.9
82.2
76.7
72.2
66.9
86.9
85.8
81.8
78.9
74.8
C09
Tons
il
28
00.
23>
6080
.068
.661
.357
.752
.981
.170
.363
.560
.556
.7
C10
Oro
phar
ynx
11
80.
1035
72.0
57.6
48.0
44.9
40.5
73.2
59.2
49.7
46.8
42.5
C11
Nas
opha
rynx
51
0.04
>60
86.3
82.4
74.3
69.5
69.5
87.4
84.5
77.0
72.3
72.9
C12
Pyrif
orm
sin
us
78
0.06
2176
.946
.234
.430
.728
.877
.847
.235
.632
.630
.6
C13
Hyp
opha
rynx
59
0.05
2264
.449
.243
.941
.937
.765
.150
.145
.243
.340
.0
C14
Lip,
ora
l cav
ity a
nd p
hary
nx,
NO
S44
0.04
2065
.945
.538
.633
.628
.067
.447
.441
.337
.030
.2
C15
Oes
opha
gus
1,
026
0.84
1147
.932
.126
.823
.020
.249
.734
.229
.125
.623
.4
C16
Stom
ach
2,29
71.
8813
52.0
39.4
33.0
29.8
27.2
54.6
43.0
37.2
34.9
33.0
C17
Smal
l int
estin
e
407
0.33
>60
72.7
64.6
60.4
55.7
52.9
75.0
68.1
65.1
61.5
59.9
C18
Col
on
11,1
519.
11>
6077
.867
.861
.155
.952
.181
.373
.769
.066
.164
.5
C19
Rect
osig
moi
d ju
nctio
n
69
70.
57>
6080
.672
.063
.359
.155
.483
.677
.370
.268
.066
.3
C20
Rect
um
4,
266
3.48
>60
82.7
72.6
65.3
59.8
54.9
85.6
77.5
71.7
67.9
64.4
C21
Anu
s an
d an
al c
anal
355
0.29
>60
81.4
71.2
65.7
58.8
55.9
84.3
76.0
71.9
66.0
64.4
C22
Live
r an
d in
trah
epat
ic b
ile d
ucts
684
0.56
1045
.932
.025
.321
.818
.247
.233
.627
.023
.620
.2
C23
Gal
lbla
dder
29
90.
248
38.1
25.1
20.3
18.6
16.4
39.8
27.1
22.8
21.7
20.1
C24
Bilia
ry t
ract
, NO
S
51
00.
4210
44.3
27.5
21.9
18.6
16.5
46.1
29.5
24.1
21.0
19.2
C25
Panc
reas
2,50
02.
047
33.6
16.6
11.1
9.0
8.1
34.7
17.5
11.8
9.8
9.0
C26
Oth
er il
l-defi
ned
dige
stiv
e or
gans
460.
045
39.1
17.4
15.2
12.7
12.7
41.1
18.7
16.9
14.6
15.4
C30
Nas
al c
avity
and
mid
dle
ear
67
0.05
5482
.174
.666
.953
.948
.683
.978
.171
.458
.153
.4

C31
Acc
esso
ry s
inus
es
76
0.06
3065
.454
.749
.242
.532
.867
.757
.752
.946
.837
.8
C32
Lary
nx
37
40.
31>
6081
.870
.663
.058
.553
.783
.272
.865
.962
.258
.1
C33
Trac
hea
170.
01*
**
**
**
**
**
C34
Bron
chus
and
lung
7,56
06.
1711
47.3
31.0
23.9
20.4
18.0
48.2
32.1
25.0
21.6
19.5
C37
Thym
us
56
0.05
>60
91.1
80.4
64.1
64.1
64.1
93.0
83.6
68.1
69.4
70.7
C38
Hea
rt, m
edia
stin
um a
nd p
leur
a
280.
02*
**
**
**
**
**
C39
Resp
irato
ry s
yste
m a
nd
intr
atho
raci
c or
gans
, NO
S0
0.00
**
**
**
**
**
*
C40
Bone
and
art
icul
ar c
artil
age
of li
mbs
125
0.10
>60
92.8
89.6
86.4
84.4
80.6
93.6
91.1
88.4
87.1
83.9
C41
Bone
and
art
icul
ar c
artil
age,
N
OS
14
30.
12>
6086
.774
.166
.456
.455
.587
.876
.068
.959
.759
.4
C43
Mal
igna
nt m
elan
oma
of
skin
**4,
371
3.57
>60
95.6
91.7
88.9
86.0
84.0
97.2
94.8
93.3
91.7
91.0
C45
Mes
othe
liom
a
19
80.
1612
49.5
24.7
17.1
10.1
7.6
50.7
25.9
17.9
10.9
8.3
C46
Kap
osi's
sar
com
a
38
0.03
>60
84.2
78.9
76.3
69.4
60.9
87.8
85.7
86.2
81.3
73.6
C47
,C49
Soft
tis
sues
647
0.53
4478
.869
.764
.461
.258
.481
.073
.469
.267
.265
.5
C48
Retr
oper
itone
um a
nd
perit
oneu
m
18
70.
1539
77.5
61.5
50.6
44.9
43.2
79.1
63.8
53.3
48.5
47.2
C50
Brea
st
45
,946
37.5
2>
6095
.491
.587
.583
.980
.397
.194
.892
.490
.288
.0
C51
Vul
va
778
0.64
5979
.867
.360
.654
.549
.783
.373
.168
.163
.560
.2
C52
Vagi
na
20
00.
1619
62.5
44.0
37.0
32.4
29.1
65.2
47.1
40.4
36.2
33.4
C53
Cer
vix
uter
i
3,
065
2.50
>60
87.3
77.6
72.7
69.3
66.6
88.4
79.4
74.9
71.9
69.8
C54
Cor
pus
uter
i
6,
346
5.18
>60
90.4
83.4
78.1
73.7
70.3
92.6
87.5
83.9
81.2
79.6
C55
Ute
rus
157
0.13
>60
75.8
66.2
63.7
60.3
59.5
78.2
70.0
68.4
65.9
66.1
C56
Ova
ry
4,14
93.
3941
76.3
63.3
53.5
46.2
40.6
78.1
65.9
56.5
49.6
44.4
C57
Fem
ale
geni
tal o
rgan
s, N
OS
15
00.
1251
80.0
65.3
55.7
50.8
45.5
82.0
68.3
59.1
54.7
50.0
C58
Plac
enta
140.
01*
**
**
**
**
**
C64
Kid
ney
2,26
01.
85>
6082
.876
.371
.166
.962
.484
.880
.076
.273
.670
.7
C65
Rena
l pel
vis
307
0.25
2871
.052
.845
.239
.035
.673
.656
.649
.944
.942
.5
C66
Ure
ter
131
0.11
3775
.660
.351
.742
.935
.578
.765
.257
.849
.944
.3
taB
le 7
5 -
ov
erv
iew
By
iCd
-10:
oB
ser
ved
an
d r
ela
tiv
e su
rv
iva
l in
fem
ale
s, B
elg
ium
(20
04-2
008)
iCd
-10
Can
cer
med
ian
ob
serv
ed
surv
ival
(m
onth
s)
ob
serv
ed s
urv
ival
(%
)r
elat
ive
surv
ival
(%
)
n%
1 ye
ar2
year
3 ye
ar4
year
5 ye
ar1
year
2 ye
ar3
year
4 ye
ar5
year
ap
pe
nd
iCe
sB
el
gia
n C
an
Ce
r r
eg
ist
ry
9 3

Ca
nC
er
su
rv
iva
l i
n b
el
giu
mb
el
gia
n C
an
Ce
r r
eg
ist
ry
9 4
C67
Blad
der
1,89
41.
5532
67.4
55.0
47.8
42.9
39.1
70.8
60.3
54.5
51.2
49.2
C68
Urin
ary
orga
ns, N
OS
22
0.02
**
**
**
**
**
*
C69
Eye
and
adne
xa
17
00.
14>
6091
.284
.777
.671
.063
.693
.388
.883
.278
.271
.4
C70
Men
inge
s
570.
05>
6084
.275
.473
.767
.465
.086
.178
.978
.273
.172
.0
C71
Brai
n
1,
361
1.11
1251
.135
.028
.625
.223
.851
.835
.729
.225
.824
.6
C72
Spin
al c
ord,
cra
nial
ner
ves
and
CN
S, N
OS
42
0.03
>60
78.6
76.2
73.8
71.2
62.8
79.0
76.8
74.6
71.8
63.3
C73
Thyr
oid
glan
d
2,
352
1.92
>60
95.0
93.8
92.9
92.1
90.6
95.8
95.2
94.9
94.8
94.1
C74
Adr
enal
gla
nd
65
0.05
6081
.567
.759
.954
.147
.782
.869
.561
.956
.751
.8
C75
Endo
crin
e gl
ands
, NO
S
24
0.02
**
**
**
**
**
*
C81
Hod
gkin
's d
isea
se
54
90.
45>
6090
.288
.085
.283
.782
.590
.989
.286
.885
.785
.0
C82
-C85
Non
-Hod
gkin
-lym
phom
a4,
031
3.29
5178
.572
.068
.164
.060
.680
.976
.073
.671
.068
.9
C88
Mal
igna
nt im
mun
opro
lifer
ativ
e di
seas
es
11
90.
10>
6090
.885
.780
.574
.867
.194
.191
.789
.285
.679
.5
C90
Mul
tiple
mye
lom
a
1,
513
1.24
5279
.770
.460
.852
.645
.282
.174
.465
.858
.651
.8
C91
Lym
phoi
d le
ukae
mia
1,12
60.
92>
6088
.081
.876
.171
.967
.090
.586
.482
.680
.376
.7
C92
Mye
loid
leuk
aem
ia
1,
099
0.90
1958
.846
.842
.539
.337
.260
.649
.145
.242
.440
.6
C93
Mon
ocyt
ic le
ukae
mia
520.
0415
59.6
40.4
25.6
21.9
21.9
60.6
41.5
25.6
21.2
21.2
C94
-C95
Leuk
aem
ia o
ther
610.
0523
55.7
47.5
40.9
37.0
34.6
58.1
50.4
44.3
40.8
35.9
C96
Lym
phoi
d, h
aem
atop
oiet
ic a
nd
rela
ted
tissu
e, N
OS
340.
03*
**
**
**
**
**
C76
Oth
er a
nd il
l-defi
ned
site
s
41
0.03
945
.337
.735
.230
.230
.248
.042
.241
.437
.139
.1
C80
Unk
now
n pr
imar
y si
te
2,
450
2.00
429
.521
.017
.315
.213
.730
.722
.518
.817
.115
.7
MPD
Mye
lopr
olife
rativ
e D
isor
ders
86
20.
70>
6092
.988
.383
.078
.374
.495
.793
.690
.588
.186
.4
MD
SM
yelo
dysp
last
ic S
yndr
omes
88
10.
7240
74.8
64.5
52.8
44.9
37.4
78.3
70.4
60.0
53.2
46.5
Tota
l exc
l. n
on
-mel
ano
ma
122,
464
100.
00>
6081
.273
.368
.164
.060
.683
.276
.872
.870
.067
.8
Tota
l exc
l. n
on
-mel
ano
ma,
MPD
an
d
MD
S12
0,72
198
.58
>60
81.1
73.3
68.1
64.1
60.7
83.2
76.8
72.7
70.0
67.8
*St
atis
tic n
ot d
ispl
ayed
due
to
less
tha
n 35
cas
es.
** A
naly
ses
for
mal
igna
nt m
elan
oma
of t
he s
kin
wer
e ba
sed
on IC
D-1
0 cl
assi
ficat
ion
C43
. Tum
ours
with
an
unkn
own
prim
ary
site
(C80
.9 a
ccor
ding
to
ICD
-O-3
) wer
e ex
clud
ed. F
or m
ore
info
rmat
ion,
see
se
ctio
n M
etho
dolo
gy.
Sour
ce: B
elgi
an C
ance
r Re
gist
ry
taB
le 7
5 -
ov
erv
iew
By
iCd
-10:
oB
ser
ved
an
d r
ela
tiv
e su
rv
iva
l in
fem
ale
s, B
elg
ium
(20
04-2
008)
iCd
-10
Can
cer
med
ian
ob
serv
ed
surv
ival
(m
onth
s)
ob
serv
ed s
urv
ival
(%
)r
elat
ive
surv
ival
(%
)
n%
1 ye
ar2
year
3 ye
ar4
year
5 ye
ar1
year
2 ye
ar3
year
4 ye
ar5
year

taB
le 7
6 -
ov
erv
iew
By
iCd
-10:
oB
ser
ved
an
d r
ela
tiv
e su
rv
iva
l in
ma
les,
fle
mis
h r
egio
n (
1999
-200
8)
iCd
-10
Can
cer
med
ian
o
bse
rved
su
rviv
al
(mo
nth
s)
ob
serv
ed s
urv
ival
rel
ativ
e su
rviv
al
n%
1 ye
ar3
year
5 ye
ar10
yea
r1
year
3 ye
ar5
year
10 y
ear
10y
95%
Ci
C00
Lip
36
20.
22>
6091
.480
.168
.245
.296
.393
.187
.977
.2[6
5.5-
88.5
]
C01
Base
of
tong
ue
30
70.
1831
70.7
46.4
39.5
22.7
72.0
49.1
43.8
29.4
[21.
9-37
.6]
C02
Tong
ue
72
60.
4441
74.1
52.1
41.7
27.0
75.5
55.0
45.9
33.6
[28.
5-38
.8]
C03
Gum
92
0.06
3169
.648
.946
.334
.671
.452
.051
.443
.8[2
8.2-
59.9
]
C04
Floo
r of
mou
th
71
40.
4347
79.6
56.8
44.7
23.5
80.8
59.3
48.0
27.5
[22.
6-32
.7]
C05
Pala
te
23
10.
1450
81.4
59.2
45.7
25.2
83.0
62.7
50.4
30.4
[21.
6-40
.1]
C06
Mou
th, N
OS
37
40.
2244
72.7
53.7
44.0
30.9
74.3
56.8
48.3
38.4
[31.
6-45
.5]
C07
Paro
tid g
land
267
0.16
5380
.962
.147
.040
.084
.269
.456
.354
.3[4
5.6-
62.9
]
C08
Saliv
ary
glan
ds, N
OS
91
0.05
>60
79.1
63.7
53.2
35.9
81.7
70.1
63.5
53.8
[36.
8-71
.0]
C09
Tons
il
73
70.
4436
75.4
49.9
39.6
24.9
76.9
52.3
42.9
30.1
[25.
2-35
.3]
C10
Oro
phar
ynx
36
20.
2222
63.3
38.0
27.2
12.1
64.4
39.8
29.8
15.9
[10.
1-23
.1]
C11
Nas
opha
rynx
15
60.
0959
80.8
58.9
49.3
36.1
82.3
61.7
53.0
41.2
[31.
1-51
.4]
C12
Pyrif
orm
sin
us
48
80.
2924
69.4
37.7
26.5
11.7
70.5
39.5
28.6
14.0
[10.
0-18
.8]
C13
Hyp
opha
rynx
29
00.
1717
59.9
31.7
23.6
15.3
60.8
33.1
25.3
18.1
[12.
4-24
.7]
C14
Lip,
ora
l cav
ity a
nd p
hary
nx,
NO
S
132
0.08
1657
.634
.830
.618
.258
.937
.033
.723
.6[1
4.7-
34.1
]
C15
Oes
opha
gus
3,
253
1.95
1351
.026
.420
.213
.552
.728
.622
.917
.9[1
5.9-
19.9
]
C16
Stom
ach
4,59
22.
7612
50.2
27.7
22.0
14.0
52.9
31.8
27.6
22.5
[20.
5-24
.6]
C17
Smal
l int
estin
e
480
0.29
>60
73.7
60.5
51.8
39.6
76.3
66.2
60.1
55.3
[47.
6-62
.9]
C18
Col
on
13,4
818.
1055
77.1
58.4
48.1
33.6
80.8
66.8
60.7
55.6
[53.
9-57
.4]
C19
Rect
osig
moi
d ju
nctio
n
1,28
90.
77>
6082
.062
.950
.334
.685
.571
.162
.456
.0[5
0.8-
61.2
]
C20
Rect
um
7,
537
4.53
>60
82.8
64.1
52.8
36.6
86.2
71.8
63.9
54.9
[52.
7-57
.0]
C21
Anu
s an
d an
al c
anal
234
0.14
>60
78.6
61.9
52.7
44.6
81.5
68.4
62.6
63.6
[52.
9-73
.9]
C22
Live
r an
d in
trah
epat
ic b
ile
duct
s
1,31
90.
798
42.2
23.2
16.5
10.5
43.6
25.2
18.8
14.0
[11.
1-17
.3]
C23
Gal
lbla
dder
15
30.
097
34.0
14.4
11.8
9.1
35.9
16.7
15.2
16.5
[8.6
-27.
7]
C24
Bilia
ry t
ract
, NO
S
55
50.
3316
56.4
29.3
23.4
18.8
58.9
32.6
27.7
27.2
[21.
5-33
.5]
C25
Panc
reas
2,84
41.
716
30.1
11.4
8.0
6.0
31.3
12.5
9.1
8.0
[6.6
-9.4
]
C26
Oth
er il
l-defi
ned
dige
stiv
e or
gans
40
0.02
540
.017
.514
.611
.742
.019
.417
.215
.2[5
.2-3
0.9]
ap
pe
nd
iCe
sB
el
gia
n C
an
Ce
r r
eg
ist
ry
9 5

Ca
nC
er
su
rv
iva
l i
n b
el
giu
mb
el
gia
n C
an
Ce
r r
eg
ist
ry
9 6
C30
Nas
al c
avity
and
mid
dle
ear
11
10.
07>
6082
.968
.552
.535
.986
.477
.064
.554
.6[3
6.5-
73.0
]
C31
Acc
esso
ry s
inus
es
36
80.
2258
78.2
59.6
48.7
31.9
80.2
64.0
54.9
41.2
[33.
4-49
.2]
C32
Lary
nx
3,
030
1.82
>60
83.5
65.7
54.0
37.3
85.9
71.3
62.3
51.2
[48.
2-54
.2]
C33
Trac
hea
500.
036
34.0
22.0
20.0
10.5
35.1
23.8
23.0
17.0
[6.3
-33.
5]
C34
Bron
chus
and
lung
28,0
1016
.83
939
.816
.711
.96.
641
.318
.514
.09.
5[8
.9-1
0.0]
C37
Thym
us
71
0.04
>60
83.1
63.4
56.2
49.0
85.1
68.6
64.1
66.0
[46.
4-83
.7]
C38
Hea
rt, m
edia
stin
um a
nd p
leur
a
790.
0510
45.6
30.4
25.2
25.2
47.0
32.8
29.0
30.0
[19.
1-42
.1]
C39
Resp
irato
ry s
yste
m a
nd
intr
atho
raci
c or
gans
, NO
S3
0.00
**
**
**
**
**
C40
Bone
and
art
icul
ar c
artil
age
of li
mbs
171
0.10
>60
88.3
70.7
66.2
60.4
89.3
72.8
69.7
67.1
[57.
9-75
.3]
C41
Bone
and
art
icul
ar c
artil
age,
N
OS
20
20.
12>
6080
.258
.952
.139
.081
.561
.656
.145
.5[3
6.2-
54.7
]
C43
Mal
igna
nt m
elan
oma
of s
kin*
* 2,
905
1.75
>60
92.7
80.5
72.7
60.8
94.9
86.0
81.1
76.4
[73.
4-79
.2]
C45
Mes
othe
liom
a
1,
147
0.69
1042
.28.
83.
90.
943
.79.
64.
41.
4[0
.4-3
.5]
C46
Kap
osi's
sar
com
a
88
0.05
>60
79.5
76.1
68.9
59.2
82.1
83.5
81.3
91.9
[70.
3-10
9.5]
C47
,C49
Soft
tis
sues
897
0.54
>60
81.9
67.5
60.0
49.3
84.6
73.9
69.9
67.4
[61.
9-72
.8]
C48
Retr
oper
itone
um a
nd p
erito
-ne
um
12
40.
0727
63.7
44.3
37.5
23.4
65.6
47.4
42.2
29.7
[18.
6-42
.5]
C50
Brea
st
44
30.
27>
6089
.474
.762
.742
.493
.184
.176
.261
.9[5
3.2-
70.4
]
C60
Peni
s
32
90.
20>
6082
.766
.854
.538
.386
.776
.768
.962
.8[5
2.0-
73.5
]
C61
Pros
tate
51,5
5430
.98
>60
93.9
84.0
75.4
55.8
97.8
94.9
93.0
89.2
[88.
3-90
.2]
C62
Test
is
1,
315
0.79
>60
97.5
95.8
94.8
93.3
97.8
96.6
96.2
96.3
[94.
5-97
.7]
C63
Mal
e ge
nita
l org
ans,
NO
S
46
0.03
>60
89.1
78.3
66.4
58.1
92.5
85.7
76.2
85.3
[58.
5-10
6.6]
C64
Kid
ney
4,15
62.
50>
6079
.565
.858
.243
.582
.071
.767
.460
.6[5
7.9-
63.3
]
C65
Rena
l pel
vis
489
0.29
2668
.343
.735
.222
.271
.349
.843
.835
.0[2
8.1-
42.4
]
C66
Ure
ter
320
0.19
4279
.455
.241
.823
.583
.062
.952
.537
.9[2
8.2-
48.5
]
C67
Blad
der
8,32
45.
0050
77.9
56.5
45.9
29.7
82.1
65.5
58.8
49.6
[47.
5-51
.7]
C68
Urin
ary
orga
ns, N
OS
71
0.04
2970
.446
.336
.420
.073
.753
.145
.934
.0[1
8.2-
53.4
]
C69
Eye
and
adne
xa
24
40.
15>
6089
.870
.059
.344
.592
.677
.370
.261
.7[5
0.8-
72.2
]
C70
Men
inge
s
380.
02>
6078
.963
.252
.539
.481
.569
.059
.652
.3[2
0.8-
83.3
]
taB
le 7
6 -
ov
erv
iew
By
iCd
-10:
oB
ser
ved
an
d r
ela
tiv
e su
rv
iva
l in
ma
les,
fle
mis
h r
egio
n (
1999
-200
8)
iCd
-10
Can
cer
med
ian
o
bse
rved
su
rviv
al
(mo
nth
s)
ob
serv
ed s
urv
ival
rel
ativ
e su
rviv
al
n%
1 ye
ar3
year
5 ye
ar10
yea
r1
year
3 ye
ar5
year
10 y
ear
10y
95%
Ci

C71
Brai
n
2,
258
1.36
1148
.024
.219
.713
.449
.025
.120
.714
.5[1
2.7-
16.4
]
C72
Spin
al c
ord,
cra
nial
ner
ves
and
CN
S, N
OS
54
0.03
>60
88.9
77.7
71.0
71.0
89.8
79.9
74.9
78.6
[62.
5-90
.1]
C73
Thyr
oid
glan
d
59
00.
35>
6086
.180
.175
.560
.487
.683
.981
.471
.8[6
5.0-
78.0
]
C74
Adr
enal
gla
nd
61
0.04
3262
.349
.137
.928
.363
.651
.941
.433
.6[1
9.2-
49.4
]
C75
Endo
crin
e gl
ands
, NO
S
48
0.03
>60
93.8
89.6
79.5
75.6
94.9
92.9
84.9
86.7
[67.
6-98
.8]
C81
Hod
gkin
's d
isea
se
76
70.
46>
6089
.884
.681
.772
.390
.886
.885
.278
.6[7
3.9-
82.7
]
C82
-C85
Non
-Hod
gkin
-lym
phom
a4,
975
2.99
>60
77.1
64.5
55.0
40.9
79.8
70.7
63.9
54.6
[52.
2-57
.0]
C88
Mal
igna
nt im
mun
opro
lifer
ativ
e di
seas
es
20
30.
12>
6087
.772
.461
.938
.691
.882
.375
.456
.0[4
1.4-
70.5
]
C90
Mul
tiple
mye
lom
a
2,
064
1.24
4678
.256
.540
.920
.481
.562
.948
.929
.4[2
5.9-
33.1
]
C91
Lym
phoi
d le
ukae
mia
2,23
11.
34>
6087
.374
.664
.543
.790
.482
.576
.562
.7[5
8.7-
66.7
]
C92
Mye
loid
leuk
aem
ia
1,
506
0.90
1655
.235
.730
.324
.457
.338
.834
.530
.5[2
7.3-
33.7
]
C93
Mon
ocyt
ic le
ukae
mia
630.
0412
50.8
36.5
34.5
30.6
52.0
38.0
37.0
36.6
[22.
3-51
.9]
C94
-C95
Leuk
aem
ia o
ther
159
0.10
1452
.237
.123
.015
.254
.642
.028
.021
.3[1
3.6-
30.7
]
C96
Lym
phoi
d, h
aem
atop
oiet
ic a
nd
rela
ted
tissu
e, N
OS
420.
03>
6085
.773
.764
.957
.186
.976
.668
.460
.7[4
1.0-
76.6
]
C76
Oth
er a
nd il
l-defi
ned
site
s
97
0.06
2060
.843
.338
.125
.062
.947
.644
.634
.0[2
1.4-
48.1
]
C80
Unk
now
n pr
imar
y si
te
3,
776
2.27
428
.814
.811
.68.
430
.116
.513
.811
.5[1
0.2-
13.0
]
MPD
Mye
lopr
olife
rativ
e D
isor
ders
766
0.46
>60
93.1
80.1
70.6
53.6
96.5
89.0
84.4
77.0
[69.
5-84
.1]
MD
SM
yelo
dysp
last
ic S
yndr
omes
93
20.
5633
73.5
47.8
32.1
16.2
77.7
56.1
41.8
26.1
[18.
2-35
.2]
Tota
l exc
l. n
on
-mel
ano
ma
166,
436
100.
0054
72.8
56.2
48.2
34.6
75.7
62.8
58.2
52.3
[51.
8-52
.7]
Tota
l exc
l. n
on
-mel
ano
ma,
MPD
an
d
MD
S16
4,73
898
.98
5472
.756
.248
.234
.675
.662
.858
.252
.3[5
1.8-
52.7
]
*S
tatis
tic n
ot d
ispl
ayed
due
to
less
tha
n 35
cas
es.
** A
naly
ses
for
mal
igna
nt m
elan
oma
of t
he s
kin
wer
e ba
sed
on IC
D-1
0 cl
assi
ficat
ion
C43
. Tum
ours
with
an
unkn
own
prim
ary
site
(C80
.9 a
ccor
ding
to
ICD
-O-3
) wer
e ex
clud
ed. F
or m
ore
info
rmat
ion,
se
e se
ctio
n M
etho
dolo
gy.
Sour
ce: B
elgi
an C
ance
r Re
gist
ry
taB
le 7
6 -
ov
erv
iew
By
iCd
-10:
oB
ser
ved
an
d r
ela
tiv
e su
rv
iva
l in
ma
les,
fle
mis
h r
egio
n (
1999
-200
8)
iCd
-10
Can
cer
med
ian
o
bse
rved
su
rviv
al
(mo
nth
s)
ob
serv
ed s
urv
ival
rel
ativ
e su
rviv
al
n%
1 ye
ar3
year
5 ye
ar10
yea
r1
year
3 ye
ar5
year
10 y
ear
10y
95%
Ci
ap
pe
nd
iCe
sB
el
gia
n C
an
Ce
r r
eg
ist
ry
9 7

Ca
nC
er
su
rv
iva
l i
n b
el
giu
mb
el
gia
n C
an
Ce
r r
eg
ist
ry
9 8
taB
le 7
7 -
ov
erv
iew
By
iCd
-10:
oB
ser
ved
an
d r
ela
tiv
e su
rv
iva
l in
fem
ale
s, f
lem
ish
reg
ion
(19
99-2
008)
iCd
-10
Can
cer
med
ian
o
bse
rved
su
rviv
al
(mo
nth
s)
ob
serv
ed s
urv
ival
(%
)r
elat
ive
surv
ival
(%
)
n%
1 ye
ar3
year
5 ye
ar10
yea
r1
year
3 ye
ar5
year
10 y
ear
10y
95%
Ci
C00
Lip
10
80.
08>
6094
.476
.870
.658
.399
.990
.693
.210
0.0
[89.
5-13
1.3]
C01
Base
of
tong
ue
73
0.05
5275
.357
.446
.430
.977
.159
.949
.336
.4[2
0.5-
53.2
]
C02
Tong
ue
30
10.
22>
6075
.059
.351
.940
.076
.963
.557
.650
.4[4
1.8-
58.9
]
C03
Gum
87
0.06
4969
.052
.848
.818
.272
.058
.557
.928
.4[1
1.2-
50.7
]
C04
Floo
r of
mou
th
18
80.
1440
76.6
53.1
45.8
31.1
77.9
55.5
48.7
35.7
[26.
3-45
.5]
C05
Pala
te
12
30.
09>
6086
.266
.658
.735
.887
.669
.663
.140
.9[2
7.1-
54.9
]
C06
Mou
th, N
OS
17
30.
1355
75.7
57.7
45.5
33.4
78.4
63.0
52.8
45.0
[33.
6-56
.8]
C07
Paro
tid g
land
186
0.14
>60
81.2
67.2
62.7
53.8
83.7
71.8
69.5
67.5
[56.
4-77
.5]
C08
Saliv
ary
glan
ds, N
OS
81
0.06
>60
88.9
76.5
67.1
55.8
90.9
81.4
74.1
67.4
[51.
0-81
.4]
C09
Tons
il
20
20.
15>
6080
.262
.253
.339
.081
.364
.756
.945
.6[3
5.8-
55.3
]
C10
Oro
phar
ynx
63
0.05
5973
.050
.847
.834
.073
.952
.250
.838
.8[2
3.0-
55.2
]
C11
Nas
opha
rynx
48
0.04
>60
83.3
66.5
64.3
40.6
84.3
69.0
67.4
47.0
[26.
9-65
.7]
C12
Pyrif
orm
sin
us
63
0.05
1868
.333
.127
.810
.769
.234
.530
.012
.0[3
.2-2
7.8]
C13
Hyp
opha
rynx
43
0.03
3462
.846
.534
.719
.063
.648
.137
.123
.6[9
.6-4
2.1]
C14
Lip,
ora
l cav
ity a
nd p
hary
nx,
NO
S
210.
02*
**
**
**
**
*
C15
Oes
opha
gus
1,
010
0.74
1146
.628
.021
.214
.348
.530
.724
.519
.2[1
5.8-
22.9
]
C16
Stom
ach
2,97
22.
1712
50.5
31.9
26.2
18.6
53.4
36.5
32.5
29.4
[26.
8-32
.1]
C17
Smal
l int
estin
e
423
0.31
>60
74.7
60.9
54.5
36.6
76.9
65.5
61.2
46.1
[37.
7-54
.5]
C18
Col
on
12,7
029.
27>
6076
.659
.250
.437
.079
.966
.862
.058
.7[5
7.0-
60.4
]
C19
Rect
osig
moi
d ju
nctio
n
97
50.
71>
6081
.863
.653
.138
.684
.970
.563
.356
.9[5
1.5-
62.2
]
C20
Rect
um
5,
023
3.67
>60
82.4
64.9
54.2
39.3
85.3
71.4
63.6
55.8
[53.
3-58
.3]
C21
Anu
s an
d an
al c
anal
314
0.23
>60
79.3
63.0
56.0
40.2
82.4
69.1
64.5
52.1
[42.
7-61
.2]
C22
Live
r an
d in
trah
epat
ic b
ile
duct
s
795
0.58
739
.521
.114
.28.
341
.022
.816
.210
.2[7
.2-1
3.8]
C23
Gal
lbla
dder
40
40.
297
37.1
18.7
15.2
11.1
38.8
21.3
18.7
16.6
[11.
5-22
.6]
C24
Bilia
ry t
ract
, NO
S
53
40.
3910
44.2
24.6
19.1
14.3
46.1
27.1
22.3
20.0
[15.
2-25
.4]
C25
Panc
reas
2,75
62.
016
29.8
10.6
7.7
5.5
30.9
11.5
8.7
7.4
[6.0
-8.9
]
C26
Oth
er il
l-defi
ned
dige
stiv
e or
gans
38
0.03
439
.523
.723
.719
.741
.125
.727
.327
.1[1
1.7-
47.1
]

C30
Nas
al c
avity
and
mid
dle
ear
57
0.04
5473
.761
.446
.175
.365
.150
.633
.7[9
.6-6
3.3]
C31
Acc
esso
ry s
inus
es
84
0.06
4173
.852
.140
.128
.275
.855
.043
.734
.0[2
0.1-
49.2
]
C32
Lary
nx
34
40.
25>
6082
.863
.053
.040
.684
.366
.257
.649
.9[4
2.1-
57.6
]
C33
Trac
hea
190.
01*
**
**
**
**
*
C34
Bron
chus
and
lung
6,96
85.
0911
46.8
22.7
16.9
11.1
47.7
23.8
18.4
13.2
[12.
1-14
.4]
C37
Thym
us
62
0.05
>60
88.7
67.7
65.8
51.7
90.1
71.0
70.9
60.6
[42.
6-76
.2]
C38
Hea
rt, m
edia
stin
um a
nd p
leur
a
340.
02*
**
**
**
**
*
C39
Resp
irato
ry s
yste
m a
nd
intr
atho
raci
c or
gans
, NO
S2
0.00
**
**
**
**
**
C40
Bone
and
art
icul
ar c
artil
age
of li
mbs
159
0.12
>60
90.6
83.0
76.4
69.7
91.3
84.7
79.2
74.7
[64.
0-83
.3]
C41
Bone
and
art
icul
ar c
artil
age,
N
OS
17
10.
12>
6084
.868
.461
.350
.885
.970
.864
.655
.6[4
5.2-
65.1
]
C43
Mal
igna
nt m
elan
oma
of
skin
**4,
513
3.29
>60
95.2
88.2
82.7
73.6
96.7
92.3
89.2
85.7
[83.
7-87
.6]
C45
Mes
othe
liom
a
22
90.
1711
44.5
14.0
6.4
6.4
45.6
14.6
6.8
6.8
[3.8
-11.
1]
C46
Kap
osi's
sar
com
a
27
0.02
**
**
**
**
**
C47
,C49
Soft
tis
sues
775
0.57
6481
.768
.060
.951
.483
.973
.168
.364
.3[5
9.1-
69.4
]
C48
Retr
oper
itone
um a
nd
perit
oneu
m
19
90.
1539
72.4
50.6
43.1
31.4
73.8
52.9
46.5
37.0
[27.
9-46
.5]
C50
Brea
st
51
,572
37.6
5>
6095
.186
.679
.465
.996
.891
.086
.578
.9[7
8.3-
79.5
]
C51
Vul
va
818
0.60
>60
81.4
62.8
51.2
38.7
84.9
70.5
61.6
55.5
[49.
3-61
.5]
C52
Vagi
na
21
40.
1622
63.6
43.0
36.9
29.3
66.2
47.4
42.9
39.9
[30.
9-49
.4]
C53
Cer
vix
uter
i
3,
585
2.62
>60
87.5
73.3
67.4
60.4
88.6
75.5
70.6
66.2
[64.
2-68
.2]
C54
Cor
pus
uter
i
7,
489
5.47
>60
90.1
78.3
71.8
59.9
92.2
83.5
80.2
76.6
[74.
8-78
.4]
C55
Ute
rus
270
0.20
>60
77.4
60.7
56.9
51.0
79.7
65.3
63.5
63.5
[55.
2-71
.2]
C56
Ova
ry
5,34
43.
9040
76.1
52.8
41.1
29.7
77.8
55.6
44.6
35.2
[33.
5-36
.9]
C57
Fem
ale
geni
tal o
rgan
s, N
OS
14
30.
10>
6078
.358
.751
.436
.780
.261
.755
.643
.0[3
0.6-
55.4
]
C58
Plac
enta
200.
01*
**
**
**
**
*
C64
Kid
ney
2,72
61.
99>
6080
.268
.060
.245
.882
.273
.168
.360
.5[5
7.3-
63.7
]
C65
Rena
l pel
vis
324
0.24
2367
.341
.030
.116
.269
.745
.636
.826
.0[1
7.4-
36.2
]
taB
le 7
7 -
ov
erv
iew
By
iCd
-10:
oB
ser
ved
an
d r
ela
tiv
e su
rv
iva
l in
fem
ale
s, f
lem
ish
reg
ion
(19
99-2
008)
iCd
-10
Can
cer
med
ian
o
bse
rved
su
rviv
al
(mo
nth
s)
ob
serv
ed s
urv
ival
(%
)r
elat
ive
surv
ival
(%
)
n%
1 ye
ar3
year
5 ye
ar10
yea
r1
year
3 ye
ar5
year
10 y
ear
10y
95%
Ci
ap
pe
nd
iCe
sB
el
gia
n C
an
Ce
r r
eg
ist
ry
9 9

Ca
nC
er
su
rv
iva
l i
n b
el
giu
mb
el
gia
n C
an
Ce
r r
eg
ist
ry
1 0 0
C66
Ure
ter
183
0.13
3667
.250
.739
.325
.069
.856
.046
.434
.2[2
4.7-
44.5
]
C67
Blad
der
2,23
81.
6336
68.9
49.9
41.8
27.2
72.4
57.2
52.6
44.6
[40.
8-48
.5]
C68
Urin
ary
orga
ns, N
OS
25
0.02
**
**
**
**
**
C69
Eye
and
adne
xa
21
20.
15>
6090
.675
.963
.536
.192
.982
.072
.446
.9[3
5.6-
58.3
]
C70
Men
inge
s
850.
06>
6085
.978
.868
.554
.487
.683
.774
.863
.1[4
8.9-
75.5
]
C71
Brai
n
1,
681
1.23
1148
.026
.422
.416
.648
.727
.123
.317
.8[1
5.6-
20.0
]
C72
Spin
al c
ord,
cra
nial
ner
ves
and
CN
S, N
OS
37
0.03
>60
86.5
83.8
81.0
81.0
87.0
84.9
82.6
86.9
[68.
5-97
.3]
C73
Thyr
oid
glan
d
1,
624
1.19
>60
90.6
87.0
84.1
77.1
91.6
89.2
87.7
84.6
[81.
4-87
.4]
C74
Adr
enal
gla
nd
76
0.06
4675
.057
.947
.143
.076
.059
.749
.948
.5[3
5.0-
61.3
]
C75
Endo
crin
e gl
ands
, NO
S
29
0.02
**
**
**
**
**
C81
Hod
gkin
's d
isea
se
62
00.
45>
6091
.987
.484
.879
.092
.689
.087
.283
.3[7
9.0-
86.9
]
C82
-C85
Non
-Hod
gkin
-lym
phom
a4,
280
3.12
>60
76.7
64.7
57.7
44.5
79.0
69.9
65.3
57.1
[54.
7-59
.6]
C88
Mal
igna
nt im
mun
opro
lifer
ativ
e di
seas
es
11
80.
09>
6090
.782
.167
.143
.394
.692
.781
.864
.1[4
2.0-
84.6
]
C90
Mul
tiple
mye
lom
a
1,
833
1.34
4878
.557
.941
.822
.980
.962
.948
.330
.3[2
6.9-
33.9
]
C91
Lym
phoi
d le
ukae
mia
1,46
61.
07>
6086
.374
.565
.144
.889
.081
.274
.859
.2[5
4.5-
63.8
]
C92
Mye
loid
leuk
aem
ia
1,
258
0.92
1555
.237
.532
.225
.557
.040
.135
.429
.6[2
6.3-
33.0
]
C93
Mon
ocyt
ic le
ukae
mia
570.
0416
61.4
30.9
28.6
28.6
62.2
31.2
28.7
29.3
[17.
3-42
.5]
C94
-C95
Leuk
aem
ia o
ther
136
0.10
1149
.338
.232
.523
.151
.742
.337
.830
.6[2
0.8-
41.5
]
C96
Lym
phoi
d, h
aem
atop
oiet
ic a
nd
rela
ted
tissu
e, N
OS
360.
03>
6088
.980
.668
.168
.190
.183
.873
.174
.0[5
3.8-
88.1
]
C76
Oth
er a
nd il
l-defi
ned
site
s
10
10.
0737
63.4
50.5
41.6
32.1
67.2
60.1
55.4
55.5
[40.
0-71
.5]
C80
Unk
now
n pr
imar
y si
te
3,
372
2.46
534
.822
.618
.514
.936
.324
.721
.319
.1[1
7.5-
20.8
]
MPD
Mye
lopr
olife
rativ
e D
isor
ders
78
40.
57>
6092
.083
.475
.453
.094
.690
.386
.876
.0[6
5.7-
85.4
]
MD
SM
yelo
dysp
last
ic S
yndr
omes
72
90.
5341
75.0
53.8
39.3
19.3
78.5
61.0
48.7
34.6
[23.
7-46
.8]
Tota
l exc
l. n
on
-mel
ano
ma
136,
995
100.
00>
6080
.567
.159
.748
.082
.671
.766
.760
.2[5
9.8-
60.6
]
Tota
l exc
l. n
on
-mel
ano
ma,
MPD
an
d
MD
S13
5,48
298
.90
>60
80.5
67.1
59.7
48.0
82.5
71.7
66.6
60.2
[59.
8-60
.6]
*St
atis
tic n
ot d
ispl
ayed
due
to
less
tha
n 35
cas
es.
** A
naly
ses
for
mal
igna
nt m
elan
oma
of t
he s
kin
wer
e ba
sed
on IC
D-1
0 cl
assi
ficat
ion
C43
. Tum
ours
with
an
unkn
own
prim
ary
site
(C80
.9 a
ccor
ding
to
ICD
-O-3
) wer
e ex
clud
ed. F
or m
ore
info
rmat
ion,
se
e se
ctio
n M
etho
dolo
gy.
Sour
ce: B
elgi
an C
ance
r Re
gist
ry
taB
le 7
7 -
ov
erv
iew
By
iCd
-10:
oB
ser
ved
an
d r
ela
tiv
e su
rv
iva
l in
fem
ale
s, f
lem
ish
reg
ion
(19
99-2
008)
iCd
-10
Can
cer
med
ian
o
bse
rved
su
rviv
al
(mo
nth
s)
ob
serv
ed s
urv
ival
(%
)r
elat
ive
surv
ival
(%
)
n%
1 ye
ar3
year
5 ye
ar10
yea
r1
year
3 ye
ar5
year
10 y
ear
10y
95%
Ci

App
EnD
ix 2
– o
vERv
iEw
by
TUM
oU
R g
RoU
p A
nA
lySE
D: n
UM
bER
oF
DEA
ThS,
CR
UD
E A
nD
Ag
E-ST
An
DARD
iSED
5-y
EAR
RElA
TivE
SU
Rviv
Al,
bEl
giU
M (2
004-
2008
)
Sour
ce: B
elgi
an C
ance
r Re
gist
ry
taB
le 7
8 -
ov
erv
iew
By
tu
mo
ur
gr
ou
p st
ud
ied
: ag
e-st
an
da
rd
ised
rel
ati
ve
sur
viv
al
in m
ale
s, B
elg
ium
(20
04-2
008)
iCd
-10
n a
t ri
sk
dea
ths
Cru
de
5-ye
ar r
elat
ive
surv
ival
(%
)a
ge-
stan
dar
dis
ed 5
-yea
r
rela
tive
su
rviv
al (
%)
nn
rat
e95
%C
ir
ate
95%
Ci
C00
-C14
, C30
-C32
Hea
d an
d ne
ck
8,45
44,
436
50.0
[48.
7-51
.3]
50.6
[48.
9-52
.3]
C15
-C16
.0O
esop
hagu
s 3,
905
3,05
422
.8[2
1.3-
24.4
]22
.4[2
0.9-
24.1
]
C16
.1-C
16.9
Stom
ach
2,68
51,
953
32.6
[30.
4-34
.7]
34.3
[32.
2-36
.5]
C18
-C19
Col
on12
,519
5,93
462
.3[6
1.1-
63.5
]63
.2[6
2.0-
64.3
]
C20
Rect
um
5,98
92,
624
64.0
[62.
4-65
.7]
63.7
[62.
1-65
.4]
C22
Live
r1,
479
1,17
020
.7[1
8.3-
23.3
]19
.4[1
7.2-
22.0
]
C23
-C24
Gal
lbla
dder
and
bili
ary
trac
t 68
754
722
.5[1
8.9-
26.4
]23
.4[1
9.8-
27.7
]
C25
Panc
reas
2,
634
2,37
89.
9[8
.6-1
1.2]
10.1
[8.8
-11.
5]
C34
Lung
23
,757
20,4
6714
.6[1
4.0-
15.1
]14
.8[1
4.3-
15.4
]
C43
*M
alig
nant
mel
anom
a of
ski
n*2,
826
618
86.2
[84.
2-88
.1]
86.0
[84.
0-87
.9]
C45
Mes
othe
liom
a 91
386
04.
9[3
.4-6
.8]
5.8
[3.9
-8.6
]
C50
Brea
st
342
108
78.2
[70.
8-84
.8]
76.8
[70.
3-83
.9]
C61
Pros
tate
42,9
888,
633
95.3
[94.
7-95
.8]
93.0
[92.
4-93
.6]
C62
Test
is
1,35
666
96.2
[94.
8-97
.4]
94.2
[88.
9-99
.8]
C64
Kid
ney
3,59
51,
307
71.0
[69.
1-73
.0]
69.5
[67.
3-71
.7]
C67
Blad
der
7,08
73,
753
56.6
[55.
0-58
.2]
59.0
[57.
4-60
.6]
C71
-C72
Cen
tral
Ner
vous
Sys
tem
1,
922
1,47
822
.7[2
0.7-
24.8
]25
.0[2
3.1-
27.0
]
C73
Thyr
oid
798
123
89.3
[86.
2-92
.0]
85.2
[81.
4-89
.1]
C00
-C43
, C45
-C96
, MPD
, MD
SA
ll tu
mou
rs
142,
628
68,8
7659
.5[5
9.1-
59.8
]59
.0[5
8.7-
59.4
]
* Ana
lyse
s fo
r m
alig
nant
mel
anom
a of
the
ski
n w
ere
base
d on
ICD
-10
clas
sific
atio
n C
43. T
umou
rs w
ith a
n un
know
n pr
imar
y si
te (C
80.9
acc
ordi
ng t
o IC
D-O
-3) w
ere
excl
uded
. Fo
r m
ore
info
rmat
ion,
see
sec
tion
Met
hodo
logy
.
ap
pe
nd
iCe
sB
el
gia
n C
an
Ce
r r
eg
ist
ry
1 0 1

Ca
nC
er
su
rv
iva
l i
n b
el
giu
mb
el
gia
n C
an
Ce
r r
eg
ist
ry
1 0 2So
urce
: Bel
gian
Can
cer
Regi
stry
taB
le 7
9 -
ov
erv
iew
By
tu
mo
ur
gr
ou
p st
ud
ied
: ag
e-st
an
da
rd
ised
rel
ati
ve
sur
viv
al
in f
ema
les,
Bel
giu
m (
2004
-200
8)
iCd
-10
n a
t ri
sk
dea
ths
Cru
de
5-ye
ar r
elat
ive
s
urv
ival
(%
)a
ge-
stan
dar
dis
ed 5
-yea
r
rela
tive
su
rviv
al (
%)
nn
rat
e95
%C
ir
ate
95%
Ci
C00
-C14
, C30
-C32
Hea
d an
d ne
ck
2,47
31,
124
57.0
[54.
6-59
.2]
54.8
[52.
3-57
.5]
C15
-C16
.0O
esop
hagu
s 1,
302
1,02
022
.7[2
0.1-
25.4
]24
.6[2
1.8-
27.7
]
C16
.1-C
16.9
Stom
ach
2,02
11,
414
34.8
[32.
3-37
.4]
38.3
[35.
7-41
.1]
C18
-C19
Col
on11
,848
5,35
764
.6[6
3.5-
65.8
]66
.5[6
5.3-
67.6
]
C20
Rect
um
4,26
61,
787
64.4
[62.
5-66
.3]
66.2
[64.
5-68
.1]
C22
Live
r68
454
220
.2[1
6.8-
23.9
]22
.2[1
8.8-
26.1
]
C23
-C24
Gal
lbla
dder
and
bili
ary
trac
t 80
966
419
.5[1
6.4-
22.8
]22
.8[1
9.3-
27.0
]
C25
Panc
reas
2,
500
2,27
49.
0[7
.8-1
0.3]
11.3
[9.8
-12.
9]
C34
Lung
7,
560
6,06
319
.5[1
8.5-
20.5
]19
.2[1
8.2-
20.3
]
C43
*M
alig
nant
mel
anom
a of
ski
n*4,
371
637
91.0
[89.
7-92
.2]
90.3
[89.
0-91
.6]
C45
Mes
othe
liom
a 19
817
88.
3[4
.4-1
3.7]
10.3
[5.9
-17.
9]
C50
Brea
st
45,9
468,
079
88.0
[87.
6-88
.5]
85.5
[85.
0-86
.1]
C53
Cer
vix
uter
i 3,
065
971
69.8
[67.
9-71
.6]
65.6
[63.
7-67
.6]
C54
Cor
pus
uter
i 6,
346
1,74
579
.6[7
8.2-
80.9
]79
.4[7
8.1-
80.8
]
C56
Ova
ry
4,14
92,
325
44.4
[42.
6-46
.2]
42.6
[40.
9-44
.3]
C64
Kid
ney
2,26
079
170
.7[6
8.3-
73.1
]70
.4[6
8.1-
72.8
]
C67
Blad
der
1,89
41,
103
49.2
[46.
2-52
.1]
52.8
[49.
8-56
.0]
C71
-C72
Cen
tral
Ner
vous
Sys
tem
1,
403
1,03
325
.8[2
3.4-
28.3
]28
.5[2
6.3-
30.9
]
C73
Thyr
oid
2,35
220
294
.1[9
2.7-
95.3
]90
.3[8
8.3-
92.3
]
C00
-C43
, C45
-C96
, MPD
, MD
SA
ll tu
mou
rs
122,
464
45,5
9367
.8[6
7.5-
68.1
]65
.7[6
5.4-
66.1
]
* Ana
lyse
s fo
r m
alig
nant
mel
anom
a of
the
ski
n w
ere
base
d on
ICD
-10
clas
sific
atio
n C
43. T
umou
rs w
ith a
n un
know
n pr
imar
y si
te (C
80.9
acc
ordi
ng t
o IC
D-O
-3) w
ere
excl
uded
. For
mor
e in
form
atio
n,
see
sect
ion
Met
hodo
logy
.

AppEnDix 3: DETAilS on AnAlySES by SUbloCAliSATion AnD MoRphology
analyses By loCalisation and suBloCalisation
C00-C14, C30-C32 head and neck
• Localisations
Lip and oral cavity C00, C02-C04, C05.0, C05.8, C05.9, C06
Pharynx C01.9, C05.1, C05.2, C09.0-C13.9
Larynx C32.0-C32.9
Nasal Cavity and paranasal sinuses C30.0-C31.9
Salivary glands C07.0-C08.9
Lip, oral cavity and pharynx, NOS C14.0-C14.9
• Sublocalisations
Lip and oral cavity
Lip C00
Tongue C02
Gum C03
Floor of mouth C04
Hard palate and palate unspecified C05.0, C05.8, C05.9
Mouth, NOS C06
Pharynx
Oropharynx C01, C05.1, C05.2, C09, C10
Base of tongue C01
Soft palate and uvula C05.1, C05.2
Tonsil C09
Oropharynx, other and unspecified C10
Nasopharynx C11
Hypopharynx C12, C13
Pyriform sinus C12
Hypopharynx C13
Larynx
Glottis C32.0
Supraglottis C32.1
Larynx other and unspecified C32.2, C32.3, C32.9
Nasal Cavity and Paranasal Sinuses
Nasal cavity and middle ear C30
Accesory sinuses C31
Salivary Glands
Parotid gland C07
Salivary glands, NOS C08
Lip, oral cavity and pharynx, NOS
C23-C24 gallbladder and biliary tract (+ C22.1)
Intrahepatic bile ducts C22.1
Gallbladder C23.9
Extrahepatic bile ducts C24.0
Ampulla of Vater C24.1
Biliary tract, NOS C24.9
C43 malignant melanoma of skin
Head and trunk C43.0-C43.5
Arms and legs C43.6-C43.7
ap
pe
nd
iCe
sB
el
gia
n C
an
Ce
r r
eg
ist
ry
1 0 3

Ca
nC
er
su
rv
iva
l i
n b
el
giu
mb
el
gia
n C
an
Ce
r r
eg
ist
ry
1 0 4
analyses By morphology
C16.1-C16.9 stomach
Adenocarcinoma 8140-8141, 8143-8145, 8190-8231, 8260-8263, 8310, 8401, 8480-8490, 8550-8551, 8570-8574, 8576
Gastrointestinal stromal tumour 8936
C15-C16.0 oesophagus
Squamous cell carcinoma 8050-8078, 8083-8084
Adenocarcinoma 8140-8141, 8143-8145, 8190-8231, 8260-8263, 8310, 8401, 8480-8490, 8550-8551, 8570-8574, 8576
Other and unspecified histology 8036-8049, 8079-8082, 8085-8139, 8142, 8146-8189, 8232-8259, 8264-8309, 8311-8400, 8402-8479, 8491-8549, 8552-8569, 8575, 8010-8035
C22 liver
Cholangiocarcinoma 8050, 8140-8141, 8160-8161, 8260, 8440, 8480-8500, 8570-8572
Hepatocellular carcinoma 8170-8176
Other and unspecified carcinoma 8036-8049, 8051-8139, 8142-8159, 8162-8169, 8177-8259, 8261-8439, 8441-8479, 8501-8569, 8573-8576, 8010-8035
C25 pancreas
Neuroendocrine tumour 8150-8159, 8240-8249
Carcinoma 8036-8149, 8160-8239, 8250-8576
Unspecified carcinoma 8000-8005, 8010-8035
C34 lung
Squamous cell carcinoma 8050-8078, 8083-8084
Adenocarcinoma 8140, 8211, 8230-8231, 8250-8260, 8323, 8480-8490, 8550-8551, 8570-8574, 8576
Small cell carcinoma 8041-8045, 8246
Large cell carcinoma 8010-8012, 8014-8031, 8035, 8310
Other and unspecified histology 8013, 8032-8034, 8036-8040, 8046-8049, 8079-8082, 8085-8139, 8141-8210, 8212-8229, 8232-8245, 8247-8249, 8261-8309, 8311-8322, 8324-8479, 8491-8549, 8552-8569, 8575
C45 mesothelioma
Epithelioid 9052
Other 9050, 9051, 9053-9055
C54 Corpus uteri
Carcinoma Endometrioid 8140-8141, 8261-8263, 8380-8384, 8430, 8480-8482, 8570-8574, 8510-8559
Carcinoma Non-Endometrioid 8036-8139, 8142-8260, 8264-8379, 8385-8429, 8431-8473, 8490-8509, 8560-8569, 8576, 8980-8981
Sarcoma 8800-8811, 8830, 8840-8979, 8982-8991, 9040-9044, 9120-9133, 9150, 9540-9581
C62 testis
Non-seminoma 9065-9102
Seminoma 9060-9064
Other and unspecified histology 8000-8005, 8006-9059, 9103-9999
C71-72 Central nervous system
Astrocytic tumours 9384, 9400-9421, 9424, 9440-9442
Oligodendroglial tumours and mixed gliomas 9382, 9450-9451
Ependymal tumours 9383, 9391-9394
Glioma, other 9380-9381, 9423, 9430, 9444, 9460
Medulloblastoma 9470-9472, 9474
Embryonal tumours, other 9473, 9490, 9500-9504, 9508

• Astrocytic tumours – WHO grade II-IV
WHO grade II 9400, 9410, 9411, 9420, 9424
WHO grade III 9401
WHO grade IV 9440-9442
C73 thyroid gland
Follicular carcinoma 8290, 8330-8335
Papillary carcinoma 8050, 8260, 8340-8344, 8350, 8450-8460
Medullar carcinoma 8345, 8510-8513
Anaplastic carcinoma 8020-8035
Other and unspecified carcinoma 8016-8019, 8036-8049, 8051-8259, 8261-8289, 8291-8329, 8336-8339, 8346-8349, 8351-8449, 8461-8509, 8514-8576, 8010-8015
ap
pe
nd
iCe
sB
el
gia
n C
an
Ce
r r
eg
ist
ry
1 0 5

Ca
nC
er
su
rv
iva
l i
n b
el
giu
mb
el
gia
n C
an
Ce
r r
eg
ist
ry
1 0 6
Reference list
1 Cancer Incidence in Belgium, 2004-2005, Belgian Cancer Registry. Brussels, 2008.
2 Koninklijk Besluit houdende vaststelling van de normen waaraan het zorgprogramma voor oncologische basiszorg en
het zorgprogramma voor oncologie moeten voldoen om te worden erkend. Belgisch Staatsblad, 21 maart 2003. Arrêté
Royal: Fixe les normes auxquelles les programmes de soins de base en oncologie et les programmes de soin en oncologie
doivent répondre pour être agréés. Moniteur Belge, 21 mars 2003.
3 Wet houdende diverse bepalingen betreffende gezondheid van 13 december 2006, artikel 39. Belgisch Staatsblad,
22 december 2006. Loi portant dispositions diverses en matière de santé du 13 décembre 2006, article 39. Moniteur
Belge, 22 décembre 2006.
4 Cancer Incidence in Belgium, 2008, Belgian Cancer Registry. Brussels, 2011.
5 Directorate-general Statistics Belgium and Economic Information, Federal Public Service Economy, SMEs, Self-employed
and Energy (http://www.statbel.fgov.be/). 2012. Accessed on May 23 2012.
6 Federaal Planbureau en Algemene Directie Statistiek, Bevolkingsvooruitzichten 2010-2060. Bureau fédéral du Plan et
Direction générale Statistique, Perspectives de population 2010-2060. 2011.
7 Percy C et al. International Classification of Diseases for Oncology (ICD-O-2), second edition. Geneva, WHO, 1990.
8 Fritz a et al. International Classification of Diseases for Oncology (ICD-O-3), third edition. Geneva, WHO, 2000.
9 Sobin LH, Wittekind CH. (eds) TNM Classification of Malignant Tumours, International Union Against Cancer 5th edition
(UICC). New York, Wiley-liss, 1997.
10 Sobin LH, Wittekind CH. TNM Classification of Malignant Tumours, International Union Against Cancer 6th edition
(UICC). New York, Wiley-liss, 2002.
11 Parkin DM, Chen VW, Ferlay J et al. Comparability and quality control in cancer registration. IARC technical report
No. 19. Lyon, International Agency for Research on Cancer, 1994.
12 Tefferi A, Vardiman JW. Classification and diagnosis of myeloproliferative neoplasms: the 2008 World Health
Organization criteria and point-of-care diagnostic algorithms. Leukemia 2008;22:14-22.
13 Jensen OM, Parkin DM, MacLennan R et al. Cancer registration: principles and methods. IARC Scientific Publications
No. 95. Lyon, 1991.
14 Fritz A, Percy C, Jack A et al. International Classification of Diseases, Tenth Revision. Geneva, WHO, 1992.
15 De Angelis R., Francisci S., Baili P. et al. The EUROCARE-4 database on cancer survival in Europe: data standardisation,
quality control and methods of statistical analysis. Eur J Cancer 2009;45:909-930.
16 Ries LAG, Horner M-J, Young JL. Chapter 1 - Introduction. In: Ries LAG, Young JL, Keel GE, Eisner MP, Lin YD, Horner
M-J, (eds): SEER Survival Monograph: Cancer Survival Among Adult: U.S. SEER PRogram, 1988-2001, Patient and Tumor
Characteristics. National Cancer Institute, SEER Program, NIH Pub. No. 07-6215, Bethesda MD, 2007.
17 Kaplan EL, Meier P. Nonparametric Estimation from Incomplete Observations. J Amer Statist Assn 1958;457-481.
18 Swaminathan R, Brenner H. Chapter 2: Statistical Methods for Cancer Survival Analysis. In: Sankaranarayanan R, Swaminathan
R, Lucas E, (eds): Cancer Survival in Africa, Asia, the Caribbean and Central America. IARC Scientific Publication, 2011, vol 2.

re
fe
re
nC
e l
ist
Be
lg
ian
Ca
nC
er
re
gis
tr
y
1 0 7
19 Engholm G, Gislum M, Bray F et al. Trends in the survival of patients diagnosed with cancer in the Nordic countries
1964-2003 followed up to the end of 2006. Material and methods. Acta Oncol 2010;49:545-560.
20 Examining relative survival at small area level for colorectal cancer and lung cancer in Wales. Welsh Cancer Intelligence
and Surveillance Unit, 2010 (poster presentation at the United Kingdom Association of Cancer Registries Meeting,
Birmingham, June 15 2010).
21 Estève J, Benhamou E, Raymond L. Statistical Methods in Cancer Research, Vol. IV, Descriptive Epidemiology
(IARC Scientific Publications No. 128). Lyon, 1994.
22 Statistics Belgium, life tables for the years 1999-2008 (http://statbel.fgov.be/fr/modules/publications/statistiques/
population/table_de_mortalite_overview.jsp). Accessed on May 23 2012.
23 Ederer F, Heise H. Instructions to IBM 650 programmers in processing survival computations. National Cancer Institute,
Methodological Note No. 10, Bethesda MD, 1959.
24 Dickman PW, Sloggett A, Hills M et al. Regression models for relative survival. Statistics in Medicine 2004;51-64.
25 Howlader N, Ries LA, Mariotto AB et al. Improved estimates of cancer-specific survival rates from population-based data.
J Natl Cancer Inst 2010;102:1584-1598.
26 Corazziari I, Quinn M, Capocaccia R. Standard cancer patient population for age standardising survival ratios.
Eur J Cancer 2004;40:2307-2316.
27 Van Hoof E. (2012) Evaluatie van de impact van de implementatie van Het Kankerplan 2008-2010, Kankercentrum,
Wetenschappelijk Instituut Volksgezondheid.
28 Egevad L, Heanue M, Berney D et al. Chapter 4: Histological groups. In: Curado MP, Edwards B, Shin HR, Storm H, Ferlay J,
Heanue M, Boyle P, (eds): Cancer Incidence in Five Continents Vol. IX. Lyon, IARC Scientific Publication No. 160, 2007.
29 Benedet JL, Bender H, Jones H, III et al. FIGO staging classifications and clinical practice guidelines in the management of
gynecologic cancers. FIGO Committee on Gynecologic Oncology. Int J Gynaecol Obstet 2000;70:209-262.
30 Louis DN, Ohgaki H, Wiestler OD et al. The 2007 WHO classification of tumours of the central nervous system.
Acta Neuropathol 2007;114:97-109.
31 Verdecchia A, Baili P, Quaglia A et al. Patient survival for all cancers combined as indicator of cancer control in Europe.
Eur J Public Health 2008;18:527-532.
32 Sant M, Allemani C, Santaquilani M et al. EUROCARE-4. Survival of cancer patients diagnosed in 1995-1999.
Results and commentary. Eur J Cancer 2009;45:931-991.
33 Micheli A, Ciampichini R, Oberaigner W et al. The advantage of women in cancer survival: an analysis of EUROCARE-4
data. Eur J Cancer 2009;45:1017-1027.
34 Gillison ML, Koch WM, Capone RB et al. Evidence for a causal association between human papillomavirus and a subset
of head and neck cancers. J Natl Cancer Inst 2000;92:709-720.
35 Bohanes P, Yang D, Chhibar RS et al. Influence of sex on the survival of patients with esophageal cancer. J Clin Oncol
2012;30:2265-2272.
36 Globocan: http://globocan.iarc.fr/. Accessed on May 23rd, 2012.
37 Haggar FA, Boushey RP. Colorectal cancer epidemiology: incidence, mortality, survival, and risk factors. Clin Colon Rectal
Surg 2009;22:191-197.
38 Gollub MJ, Schwartz LH, Akhurst T. Update on colorectal cancer imaging. Radiol Clin North Am 2007;45:85-118.

Ca
nC
er
su
rv
iva
l i
n b
el
giu
mb
el
gia
n C
an
Ce
r r
eg
ist
ry
1 0 8
39 Lahaye MJ, Engelen SM, Nelemans PJ et al. Imaging for predicting the risk factors--the circumferential resection margin
and nodal disease--of local recurrence in rectal cancer: a meta-analysis. Semin Ultrasound CT MR 2005;26:259-268.
40 Cancer Research UK. Liver cancer - Survival statistics 2009
(http://info.cancerresearchuk.org/cancerstats/types/liver/survival). Accessed on May 23 2012.
41 Integraal Kankercentrum Nederland. Cijfers over kanker
(http://www.cijfersoverkanker.nl/selecties/Dataset_1/img4f54a82e02a16). Accessed on May 23 2012.
42 Key C, Meisner ALW. Chapter 6: Cancers of the Liver and Biliary Tract. In: Ries LAG, Young JL, Keel GE, Eisner MP, Lin YD,
Horner M-J, (eds): SEER Survival Monograph: Cancer Survival Among Adult: U.S. SEER Program, 1988-2001, Patient and
Tumor Characteristics. National Cancer Institute, SEER Program, NIH Pub. No. 07-6215, Bethesda MD, 2007.
43 Fong Y, Wagman L, Gonen M et al. Evidence-based gallbladder cancer staging: changing cancer staging by analysis of
data from the National Cancer Database. Ann Surg 2006;243:767-771.
44 Alsina M, Marcos-Gragera R, Capdevila J et al. Neuroendocrine tumors: a population-based study of incidence and
survival in Girona Province, 1994-2004. Cancer Epidemiol 2011;35:e49-e54.
45 Martin RC, Kooby DA, Weber SM et al. Analysis of 6,747 pancreatic neuroendocrine tumors for a proposed staging
system. J Gastrointest Surg 2011;15:175-183.
46 Key C. Chapter 7: Cancer of the pancreas. In: Ries LAG, Young JL, Keel GE, Eisner MP, Lin YD, Horner M-J, (eds): SEER
Survival Monograph: Cancer Survival Among Adult: U.S. SEER PRogram, 1988-2001, Patient and Tumor Characteristics.
National Cancer Institute, SEER Program, NIH Pub. No. 07-6215, Bethesda MD, 2007.
47 Lung Cancer Incidence and Mortality Worldwide in 2008 - Summary, Cancer Fact Sheet, Globocan
(http://globocan.iarc.fr/factsheets/cancers/lung.asp). Accessed on May 23 2012.
48 Crino L, Weder W, van MJ et al. Early stage and locally advanced (non-metastatic) non-small-cell lung cancer: ESMO
Clinical Practice Guidelines for diagnosis, treatment and follow-up. Ann Oncol 2010;21 Suppl 5:v103-v115.
49 Montanaro F, Bray F, Gennaro V et al. Pleural mesothelioma incidence in Europe: evidence of some deceleration in the
increasing trends. Cancer Causes Control 2003;14:791-803.
50 Balch CM, Soong SJ, Gershenwald JE et al. Prognostic factors analysis of 17,600 melanoma patients: validation of the
American Joint Committee on Cancer melanoma staging system. J Clin Oncol 2001;19:3622-3634.
51 Brenner H, Francisci S, De AR et al. Long-term survival expectations of cancer patients in Europe in 2000-2002.
Eur J Cancer 2009;45:1028-1041.
52 Bosch FX, Lorincz A, Munoz N et al. The causal relation between human papillomavirus and cervical cancer. J Clin Pathol
2002;55:244-265.
53 Cancer Prevention: Cervix Cancer Screening. IARC Handbook of Cancer Prevention Volume 10, 2005.
54 D’Angelo E, Prat J. Uterine sarcomas: a review. Gynecol Oncol 2010;116:131-139.
55 Arafa M, Somja J, Dehan P et al. Current concepts in the pathology and epigenetics of endometrial carcinoma.
Pathology 2010;42:613-617.
56 Uharcek P. Prognostic factors in endometrial carcinoma. J Obstet Gynaecol Res 2008;34:776-783.
57 Tavassoli FA, Devilee P (eds). World Health Organization Classification of Tumours. Pathology & Genetics. Tumours of the
Breast and Female Genital Organs. Lyon, IARC Press, 2003.
58 Hamilton A, Gloeckler Ries LA. Chapter 22: Cancer of the Prostate. In: Ries LAG, Young JL, Keel GE, Eisner MP, Lin YD,

Horner M-J, (eds): SEER Survival Monograph. Cancer Survival Among Adults: U.S. SEER Program, 1988-2001, Patient
and Tumor Characteristics. National Cancer Institute, SEER Program, NIH Pub. No. 07-6215, Bethesda, MD, 2007.
59 Holmberg L, Robinson D, Sandin F et al. A comparison of prostate cancer survival in England, Norway and Sweden:
a population-based study. Cancer Epidemiol 2012;36:e7-12.
60 Biggs ML, Schwartz SM. Chapter 21: Cancer of the Testis. In: Ries LAG, Young JL, Keel GE, Eisner MP, Lin YD, Horner
M-J, (eds): SEER Survival Monograph. Cancer Survival Among Adults: U.S. SEER Program, 1988-2001, Patient and Tumor
Characteristics. National Cancer Institute, SEER Program, NIH Pub. No. 07-6215, Bethesda, MD, 2007.
61 Verhoeven RH, Coebergh JW, Kiemeney LA et al. Testicular cancer: trends in mortality are well explained by changes in
treatment and survival in the southern Netherlands since 1970. Eur J Cancer 2007;43:2553-2558.
62 Sant M, Aareleid T, Artioli ME et al. Ten-year survival and risk of relapse for testicular cancer: a EUROCARE high
resolution study. Eur J Cancer 2007;43:585-592.
63 Brown LM, Pottern LM, Hoover RN et al. Testicular cancer in the United States: trends in incidence and mortality.
Int J Epidemiol 1986;15:164-170.
64 Bergstrom R, Adami HO, Mohner M et al. Increase in testicular cancer incidence in six European countries: a birth cohort
phenomenon. J Natl Cancer Inst 1996;88:727-733.
65 Chow WH, Dong LM, Devesa SS. Epidemiology and risk factors for kidney cancer. Nat Rev Urol 2010;7:245-257.
66 van de Schans SA, Aben KK, Mulders PF et al. Modest improvement in 20 years of kidney cancer care in the Netherlands.
Eur J Cancer 2012; 48:1822-1830.
67 Fajkovic H, Halpern JA, Cha EK et al. Impact of gender on bladder cancer incidence, staging, and prognosis.
World J Urol 2011;29:457-463.
68 Mungan NA, Aben KK, Schoenberg MP et al. Gender differences in stage-adjusted bladder cancer survival.
Urology 2000;55:876-880.
69 Johnson EK, Daignault S, Zhang Y et al. Patterns of hematuria referral to urologists: does a gender disparity exist?
Urology 2008;72:498-502.
70 Kleihues P, Cavenee WK, (eds). World Health Organization Classification of Tumours. Pathology & Genetics.
Tumours of the Nervous System. Lyon, IARC Press, 2003.
71 Colonna M, Grande E, Jonasson JG et al. Variation in relative survival of thyroid cancers in Europe: results from the
analysis on 21 countries over the period 1983-1994 (EUROCARE-3 study). Eur J Cancer 2006;42:2598-2608.
72 Kilfoy BA, Zheng T, Holford TR et al. International patterns and trends in thyroid cancer incidence, 1973-2002.
Cancer Causes Control 2009;20:525-531.
73 Grodski S, Brown T, Sidhu S et al. Increasing incidence of thyroid cancer is due to increased pathologic detection.
Surgery 2008;144:1038-1043.
74 Ward EM, Jemal A, Chen A. Increasing incidence of thyroid cancer: is diagnostic scrutiny the sole explanation?
Future Oncol 2010;6:185-188.
75 Francart J, Van den Bruel A, Decallonne B et al. Regional differences in thyroid cancer incidence in Belgium: role of
diagnostic and therapeutic strategies for thyroid disease. Brussels, Belgian Health Care Knowledge Center (KCE), 2012.
re
fe
re
nC
e l
ist
Be
lg
ian
Ca
nC
er
re
gis
tr
y
1 0 9


koningsstraat 215 / rue royale 215
1210 Brussel / Bruxelles
www.kankerregister.org
www.registreducancer.org


