

Capital management, capital allocation and the demand for insurance and reinsurance Denis Kessler CEO & Chairman - SCOR RVS conference Monte Carlo, 11 September 2012

2
Capital management, capital allocation and the demand for insurance and reinsurance
Theme Speaker Regulatory developments and adequacy of the capacity offered on the market and the demand for insurance and reinsurance
Richard Ward CEO of Lloyd's
How can (re)insurers best raise capital? Is the industry doing enough to make it relevant for investors?
Mike Mc Gavick CEO of XL Group
The impact of Solvency II on S&P's capital models, ratings and processes, and its wider implications on the credit rating agency business
Dominic Crawley Global Head of Financial Services Ratings Standard & Poor's
Managing the capital of a (re)insurance group today: internal, regulatory and rating agency models and their impact on business decisions
Michel Liès CEO of Swiss Re
3
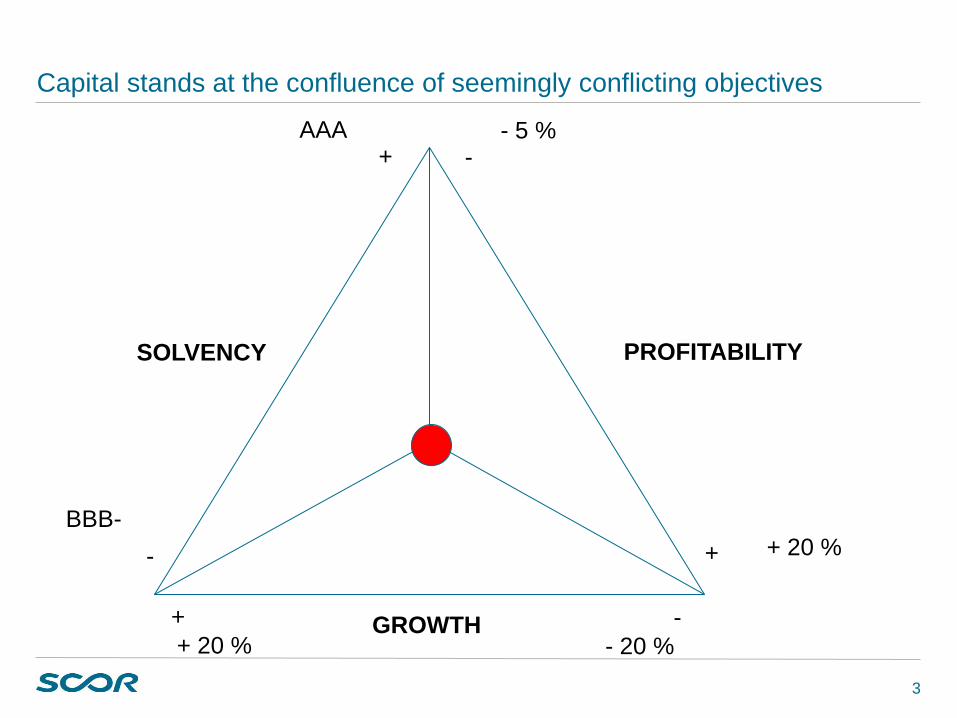
Capital stands at the confluence of seemingly conflicting objectives
GROWTH
SOLVENCY PROFITABILITY
+ -
-
-
+
+
AAA
BBB-
- 5 %
+ 20 %
- 20 % + 20 %

4
Managing the capital of a (re)insurance company is all about optimizing under constraints
Capital management and allocation must meet a series of constraints that can be
expressed in terms of “risk tolerances”
A few examples of risk tolerances: Probability of shareholders’ equity being wiped out must be < X Probability of regulatory capital (i.e. SCR under Solvency 2) being dented must be
< X Limits per extreme scenario, per LOB and per individual risk:
• Amount of losses for each extreme scenario must be < X% of the total available capital
• 95% xtVaR for each LOB must be < X % of the total available capital • Maximum loss for each single risk must be < X million euros
At first glance, managing capital may appear to only consist in minimizing capital
(or maximizing risks) while respecting the risk tolerances
But capital optimization can create value by increasing expected returns for a given level of risk
5
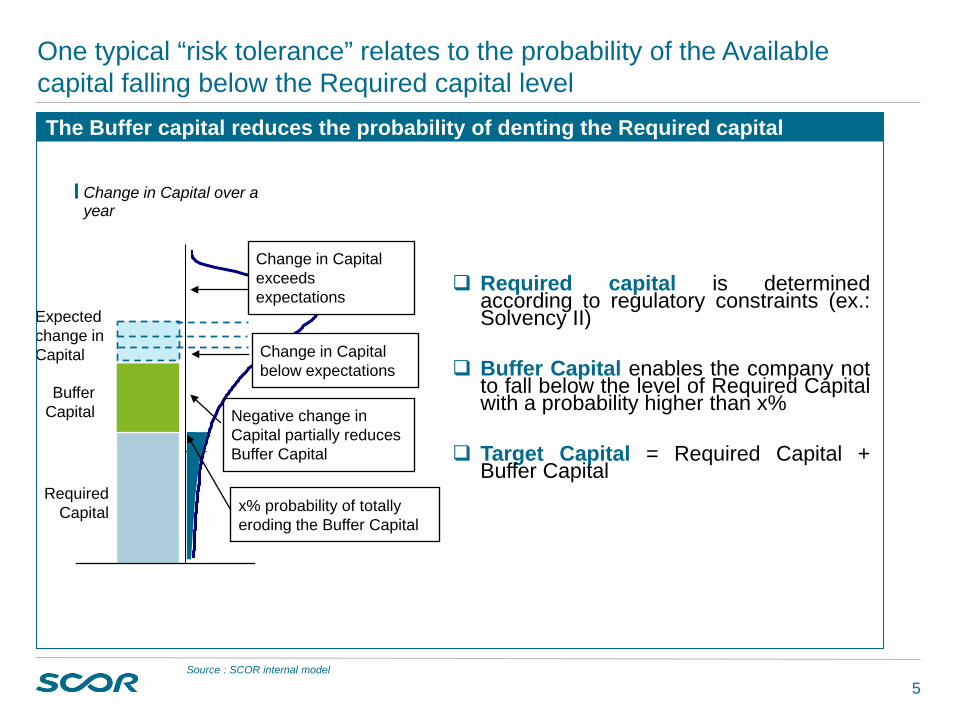
One typical “risk tolerance” relates to the probability of the Available capital falling below the Required capital level The Buffer capital reduces the probability of denting the Required capital
Expected change in Capital
Buffer Capital
Required Capital
Change in Capital below expectations
Negative change in Capital partially reduces Buffer Capital
x% probability of totally eroding the Buffer Capital
Change in Capital exceeds expectations
Required capital is determined
according to regulatory constraints (ex.: Solvency II)
Buffer Capital enables the company not to fall below the level of Required Capital with a probability higher than x%
Target Capital = Required Capital + Buffer Capital
Change in Capital over a year
Source : SCOR internal model

6
Another typical “risk tolerance” relates to the impact of extreme scenarios on the available capital
1 in 200
1 in 200
1 in 200
1 in 200
1 in 200
1 in 200
1 in 200
1 in 200
Extreme scenarios can generate considerable losses Probability
in years
P&C
Major fraud in largest C&S exposure U.S. wind
U.S. / Caribbean
EU wind
Japan earthquake
Life
+
P&C
Wave of terrorist attacks
Life
Longevity
Extreme global pandemic2)
A (re)insurer would typically decide that the amount of losses for each extreme scenario must be < X% of the total available capital
Source : SCOR internal model

7
Risk tolerances are subjective
8
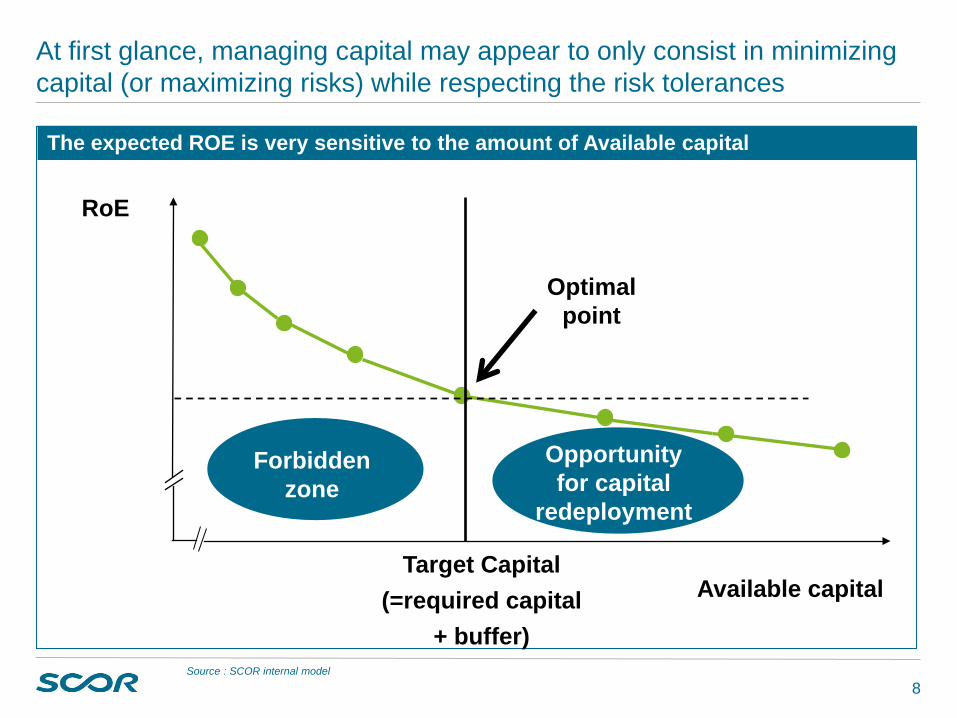
Optimal point
RoE
Available capital
At first glance, managing capital may appear to only consist in minimizing capital (or maximizing risks) while respecting the risk tolerances
The expected ROE is very sensitive to the amount of Available capital
Forbidden zone
Opportunity for capital
redeployment
Target Capital (=required capital
+ buffer) Source : SCOR internal model

9
But capital optimization can create value (1)
Full integration of capital needs in pricing and business decisions (including asset allocation)
Special attention paid to capital-intensive LOBs Recourse to reinsurance, retrocession and ILS to minimize capital needs Diversification by region and by LOBs (notable Life and Non-Life):
One way of optimizing capital is to reduce capital needs
Stylized representation of the expected technical return and volatility of the portfolio of a multi-line reinsurer as a function of the relative weights of P&C and Life business
10
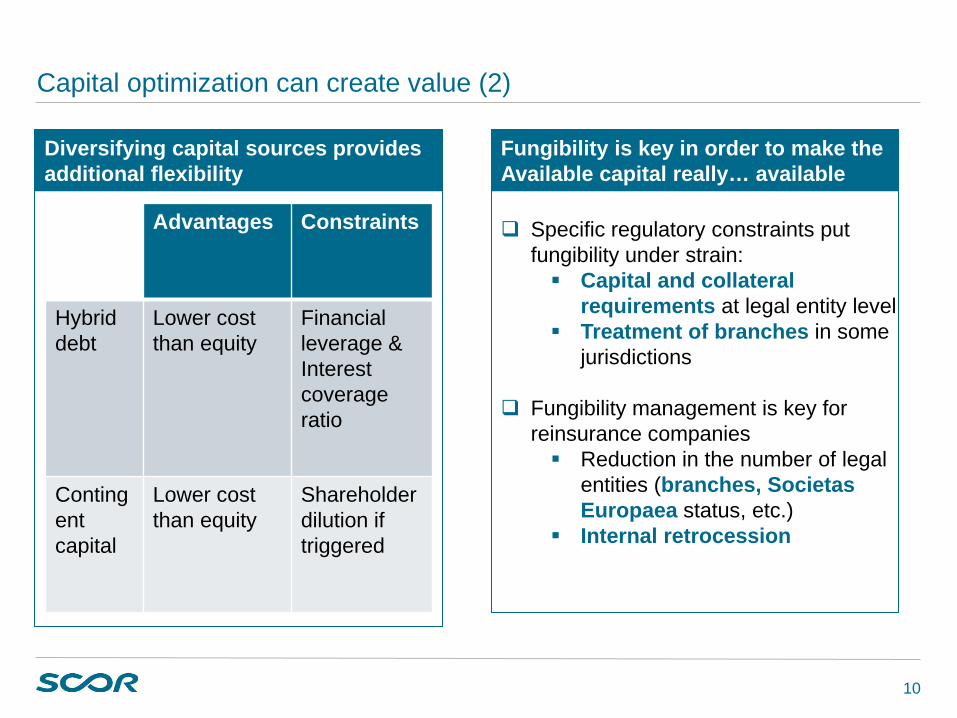
Capital optimization can create value (2)
Diversifying capital sources provides additional flexibility
Specific regulatory constraints put
fungibility under strain: Capital and collateral
requirements at legal entity level Treatment of branches in some
jurisdictions
Fungibility management is key for reinsurance companies Reduction in the number of legal
entities (branches, Societas Europaea status, etc.)
Internal retrocession
Fungibility is key in order to make the Available capital really… available
Advantages Constraints
Hybrid debt
Lower cost than equity
Financial leverage & Interest coverage ratio
Contingent capital
Lower cost than equity
Shareholder dilution if triggered
11
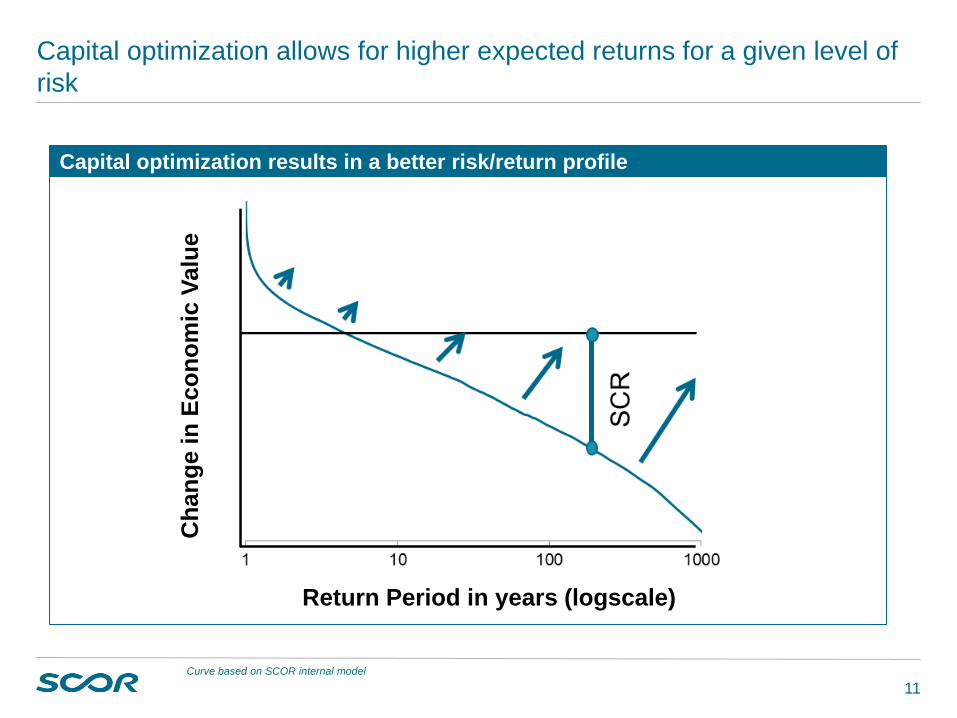
Capital optimization allows for higher expected returns for a given level of risk
Capital optimization results in a better risk/return profile C
hang
e in
Eco
nom
ic V
alue
Return Period in years (logscale)
Curve based on SCOR internal model

12
The new way to wealth for (re)insurers…

13
By the way, what do you call “capital”? (1)
Regulators, Rating Agencies, Auditors and Analysts all have different definitions of “Capital” Auditors focus on IFRS equity. Analysts sometimes use IFRS tangible equity Regulators (under Solvency II) and Rating agencies are adjusting IFRS balance sheets to
obtain “Economic Capital” under their own definitions
IFRS Solvency I Solvency II (Internal Model) S&P model AM Best (BCAR)
Available Capital
Required Capital
Available Capital Required Capital Available
Capital Required Capital Available Capital Required
Capital
Cat Risk
Charge No Cat charge
Capital Charge based on
1 in 200Y net PML
Capital Charge based on
1 in 250Y net PML
reduction in surplus of max (100-year wind; net PML, a 250-year earthquake net PML,
recent large loss)
Life Future Profit
VOBA / DAC
No credit to VOBA/DAC
nor VIF 100% of VIF
50% of PVFP (incl. cost of
capital) 50% of VIF
Risk Margin NA
Deduction of Life and P&C risk margin
NA NA
Diversification
No diversification
Internal Model: • Complex
dependencies modelling (copulas)
Standard Formula: Covariance formula
Covariance formula
50% haircut applied
Covariance formula
Examples of different approaches to Capital according to different solvency frameworks

14
By the way, what do you call “capital”? (2)
"When I use a word," Humpty Dumpty said, in rather a scornful tone, "it means just what I choose it to mean—neither more nor less." "The question is," said Alice, "whether you can make words mean so many different things." "The question is," said Humpty Dumpty, "which is to be master - that's all."

15
Convergence is badly needed
… in order to reduce the
administrative burden and costs generated by conflicting definitions
… in order to reduce the economic
inefficiency generated by duplicative constraints that make economic optimization difficult
Giving a bigger role to internal
models (notably rating agency models) would be a way of achieving this
Ultimate goal: to align external reporting and compliance metrics with the metrics that management uses daily to make decisions
Solvency II and S&P – the first kiss may be some time…

16
Appendices
17
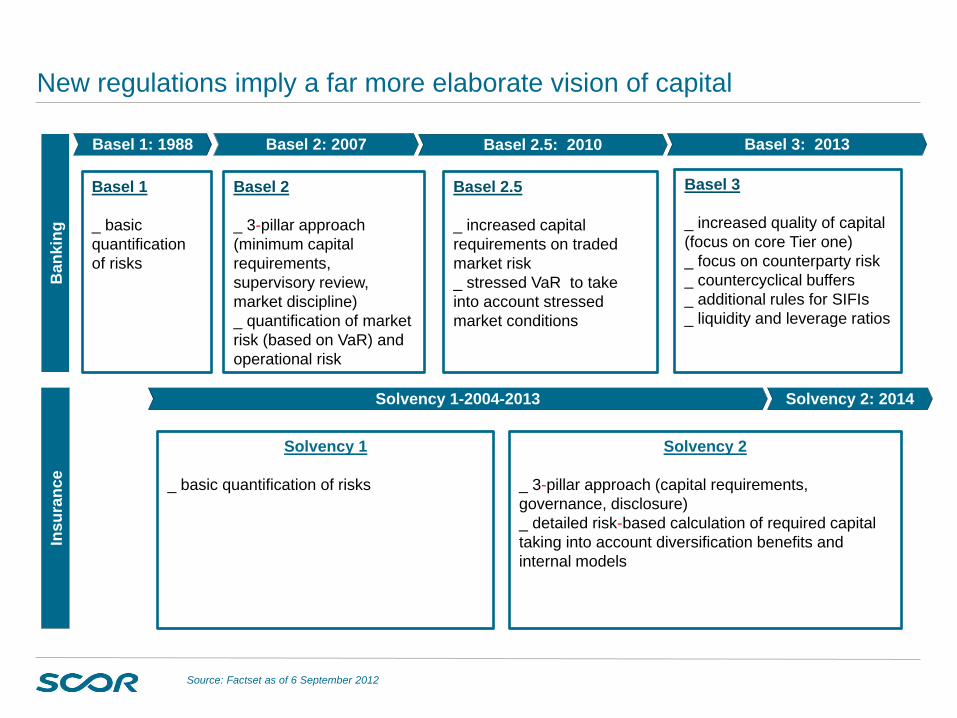
New regulations imply a far more elaborate vision of capital
Source: Factset as of 6 September 2012
Insu
ranc
e B
anki
ng
Basel 2: 2007 Basel 2.5: 2010 Basel 3: 2013
Basel 2 _ 3-pillar approach (minimum capital requirements, supervisory review, market discipline) _ quantification of market risk (based on VaR) and operational risk
Basel 2.5 _ increased capital requirements on traded market risk _ stressed VaR to take into account stressed market conditions
Basel 3 _ increased quality of capital (focus on core Tier one) _ focus on counterparty risk _ countercyclical buffers _ additional rules for SIFIs _ liquidity and leverage ratios
Basel 1: 1988
Solvency 2: 2014 Solvency 1-2004-2013
Solvency 2 _ 3-pillar approach (capital requirements, governance, disclosure) _ detailed risk-based calculation of required capital taking into account diversification benefits and internal models
Solvency 1 _ basic quantification of risks
Basel 1 _ basic quantification of risks
18
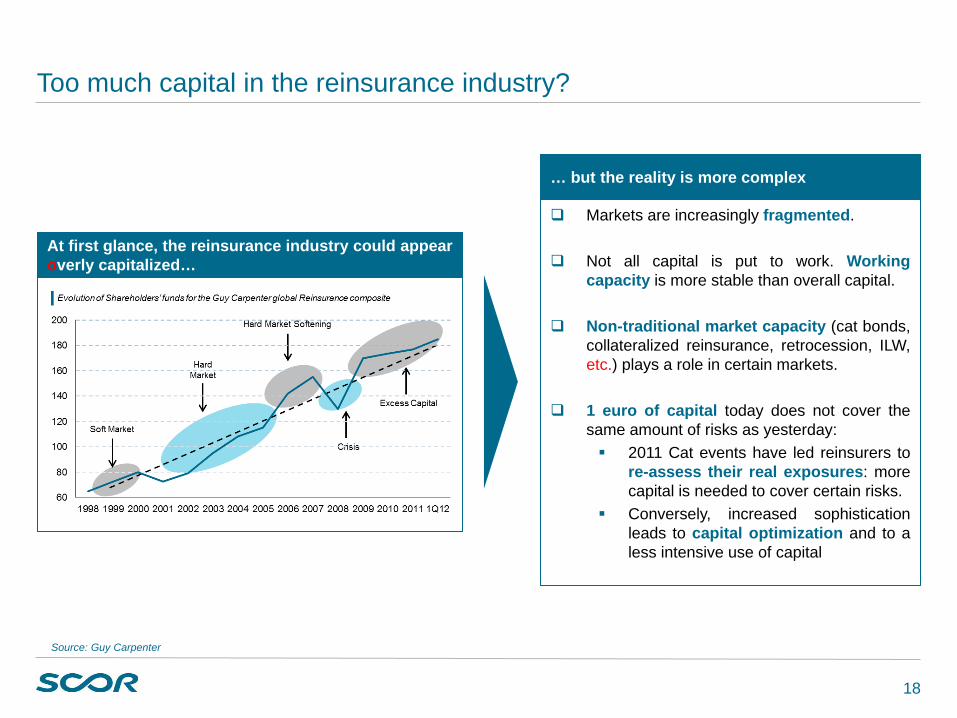
Too much capital in the reinsurance industry?
Source: Guy Carpenter
Markets are increasingly fragmented.
Not all capital is put to work. Working capacity is more stable than overall capital.
Non-traditional market capacity (cat bonds, collateralized reinsurance, retrocession, ILW, etc.) plays a role in certain markets.
1 euro of capital today does not cover the same amount of risks as yesterday: 2011 Cat events have led reinsurers to
re-assess their real exposures: more capital is needed to cover certain risks.
Conversely, increased sophistication leads to capital optimization and to a less intensive use of capital
At first glance, the reinsurance industry could appear overly capitalized…
… but the reality is more complex

19
Sell-side analysts reckon that the industry is underpriced by the markets
Does the amount of capital in the reinsurance industry allow adequate returns for shareholders?
0
0,2
0,4
0,6
0,8
1
1,2
1,4
1,6
Lanc
ashi
re
His
cox
Am
lin
Chu
bb C
orp
WR
Ber
kley
Cor
p R
enai
ssan
ceR
e
Arc
h C
apita
l M
arke
l Zu
rich
R
SA
H
anno
ver R
e G
ener
ali
Bea
zley
Tr
avel
ers
H
CC
A
CE
V
alid
us
Cat
lin
Map
fre
Mun
ich
Re
Allia
nz
Eve
rest
Re
AW
AC
A
xis
Cap
ital
Alte
rra
Cap
ital
Nov
ae
Mon
tpel
ier R
e
Avi
va
Mai
den
P
latin
um
Par
tner
Re
S
CO
R
Sw
iss
Re
A
spen
Fl
agst
one
Re
XL
End
uran
ce
The
Han
over
A
XA
Arg
o
Am
eric
an
Har
tford
On average, (re)insurers trade below book value
Average 0.91
Source: Factset as of 6 September 2012
Average recommendation from sell-side analysts BUY 70%
HOLD 30%
SELL 0%


