


0 5 10
Carbohydrate
Lipid
Protein
Kcals

Calculated from the
heat released by the
total combustion of
food in a calorimeter.
Can be expressed
as kcal or joules (1
kcal=4.13 kJ).


Amino acids started in first week of life and advanced slowly in increments.
Lipid infusions started in first week of life and advanced incrementally.
Amino acids and lipids frequently delayed or interrupted.

Low APGAR scores. Umbilical catheters. Apnea and Bradycardia. Mechanical ventilation. CPAP. Vasoactive drugs. TPN is available.

28-29wk
26-27wk
24-25wk
Ehrenkranz et al Pediatrics 1999
Reference
fetus

Calorie intake and cumulative deficit over the first 10
days: 50 British NICUs
Grover A et al. JPEN J Parenter Enteral Nutr 2008;32:140-144
Copyright © by The American Society for Parenteral and Enteral Nutrition

Grover A et al. JPEN J Parenter Enteral Nutr 2008;32:140-144
Copyright © by The American Society for Parenteral and Enteral Nutrition
Protein intake and cumulative deficit over the
first 10 days: 50 British NICUs

Weeks Wt (g) Water (%) Protein
(%)
Lipid (%) Energy
(kcal)
24 690 86.6 8.8 0.1 19.5
26 880 86.8 9.2 1.5 123.6
28 1160 84.6 9.6 5 326.2
40 3450 74.0 12 15.3 3152.4
2 months 5450 71.4 11.4 25 9866
Ziegler, E. Growth, 1976

1. Metabolic and thus nutritional requirements in the
infant do not stop with birth.
2. Preterm infants have insufficient nutrient stores to
support metabolic needs for very long.
3. The metabolic and nutrient requirements of the
newborn are equal to or greater than those of the
fetus of the same gestational age.
4.Intravenous feeding is always indicated when
normal metabolic and nutritional needs in newborn
infants are not met by normal enteral feeding.

As Total energy intake during the first 7 days of life increased in critically ill infants, the Odds Ratio of such adverse outcomes as NEC, late onset sepsis, BPD and NDI decreased by approximately 2% for each 1kcal/kg/d of total energy intake.
Ehrenkranz, R. et al. Pediatric Research Vol 69.No.6, 2011

25 wk
term

Retrospective study of 124 ELBW infants at 18 months CA
Stephens, B.E. Pediat. 2009;123:1337-1341.
0 1 2 360
70
80
90
100
First week AA intake
(g/(kg.d))
MD
I at
18 m
on
ths
30 40 50 60 70 80 9060
70
80
90
100
First week energy intake
(kcal/(kg.d)
MD
I at
18 m
on
ths
+10 +4.6
+1
+8.2

Cohort study, 600 infants with birth weight 501 to 1000g MDI < 70(P<0.01)
12.0 15.6 17.8 21.20
10
20
30
40
Weight gain quartiles (g/(kg.d))
%
PDI < 70(P<0.001)
12.0 15.6 17.8 21.20
10
20
30
40
Weight gain quartiles (g/(kg.d))
%
Cerebral palsy(P<0.01)
12.0 15.6 17.8 21.20
5
10
15
20
25
Weight gain quartiles (g/(kg.d))
%
Neurodevelopmental impairment(P<0.001)
12 15.6 17.8 21.20
10
20
30
40
50
60
Weight gain quartiles (g/(kg.d))
%
Ehrenkranz, R.A. Pediat. 2006;117:1253-1261.

120 CAL/KG/D FOR GROWTH IF FED
ENTERALLY. IF ON TPN, POSITIVE NITROGEN BALANCE
CAN BE ATTAINED WITH 60 CAL/KG/D WITH
ABOUT 2.5 G/KG/D OF PROTEIN.
MINIMAL CALORIC INTAKE FOR WEIGHT GAIN
IS ABOUT 80 CAL/KG/D IF ON TPN.


Standard approach, used/recommended by most:
6-8 mg/min/kg beginning at birth,
increasing to 10-14 mg/min/kg for full IVN (~60-
80 Kcal/kg/day),
done sort of reflexively, without considering
the degree of illness or other pathophysiology
in the infant.
Unfortunately, this all too often leads to
HYPERGLYCEMIA
Why?


Maximum Oxidation of Glucose is about 12 mg/kg/min.
Infusion rates of glucose greater than 12 mg/kg/min may exceed capacity for infants with lung disease to eliminate CO2..

Carbon dioxide production almost doubled from 4.7 to 7.9 mL/kg/min
when the glucose intake from 10 to 24 g/kg/day Van Aerde, 2003

Why hyperglycemia?
Persistent glucose production (gluconeogenesis and
glycogenolysis), despite high rates of glucose infusion and
insulin production.
Chacko S, Sunehag A. Arch Dis Child Fetal Neonatal Ed 2010;95:F413-F418
Copyright © BMJ Publishing Group Ltd & Royal College of Paediatrics and Child Health. All rights reserved.
■ Plasma glucose
concentration
▲Rate of glucogenesis
Total glucose infusion rate, mg/kg/min

0 1 2 3 4 5
0
1
2
3
4
5
6
7
8
9
10
11
O2 content (mmol/L)
Ln
No
rep
inep
hri
ne
(pg
/ml)
0 1 2 3 4 5
0
10
20
30
O2 Content (mmol/L)
Co
rtis
ol
(ng
/ml) Rozance, et al., 2008
Hypoxia- Increased
ischemia catecholamines
Increased glycogenolysis
Decreased insulin secretion
Decreased insulin action
Increased protein breakdown
Hypoxia- Increased
ischemia cortisol
Increased gluconeogenesis
Increased protein breakdown
Decreased insulin secretion
and insulin action.
Furthermore, in sicker infants, increased counter-
regulatory hormones
that produce glycogenolysis and gluconeogenesis
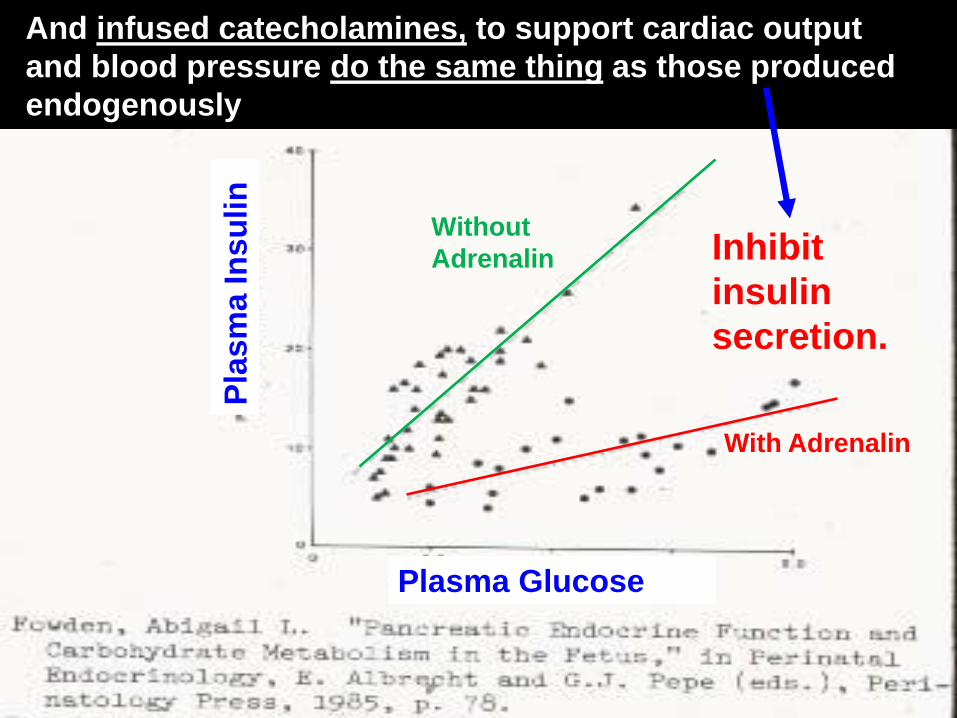
Without
Adrenalin
With Adrenalin
Pla
sm
a In
su
lin
Plasma Glucose
And infused catecholamines, to support cardiac output
and blood pressure do the same thing as those produced
endogenously
Inhibit
insulin
secretion.

Established adverse effects--- ↑ energy expenditure (glucose-to-fat synthesis is
energy expensive)
▪ ↑ oxygen consumption (and hypoxia)
▪ ↑ carbon dioxide production (and tachypnea)
▪ ↑ Fat deposition in excess of lean mass
▪ ↑ Fatty infiltration of heart and liver

Benefits of tight Insulin-glucose control?
(noted primarily in adults)
1. Reduced morbidity and mortality
2. Improved metabolic status (improved EE)
3. Improved cardiovascular status (CO)
4. Improved systemic and regional DO2
5. Improved immunity, reduced infection, better
wound healing, improved nitrogen balance.
But—highly controversial !
Subsequent trials (42 hospitals, 4 countries)
failed to demonstrate benefits from tight glucose
control and actually demonstrated significant excess
mortality using the tight glucose range vs. the
conventional range.

Insulin infusion
vs. reduced glucose infusion
to treat hyperglycemia
in 500-750 g infants
. No difference in all age/weight groups on :
Death, Sepsis, ROP, NEC, ICH, CLD,
NICU days, or Growth.
Perhaps safer, therefore, to just lower the
glucose infusion rate.
Bottino, Cowett , Sinclair, Cochrane Library, 2009, only one study to review—
Meetze, et al. Biology of the Neonate 1998;74:214-21

Done because studies in adults suggested that tight control of hyperglycemia in adults decreased mortality.
International Randomized trial: 0.06 U per Kg insulin per hour versus standard neonatal care.
Early Insulin group had lower glucose levels. Intention to treat insulin group showed
higher mortality at 28 days. Beardsall K. Early insulin therapy in very-low-birth-weight infants. N Engl J Med. 2008 Oct 30;359(18):1873-84. doi: 10.1056/NEJMoa0803725.

Paulsrud JR


CHAIN LENGTH
-Short-chain fatty acids (6 carbons)
-Medium-chain fatty acids (8-12 carbons)
-Long-chain fatty acids (14carbons)
NUMBER OF DOUBLE BONDS
-Saturated fatty acids (none)
-Monounsaturated fatty acids (1)
-Polyunsaturated fatty acids (2 or more)

Number of Number of Carbons Double Bonds 18:19 Position of First Double Bond From Noncarboxyl ( or n-) Terminus

18: 2 6


Linoleic Acid-C18:2-6: 2-series Prostaglandins (PGE2).
Linolenic Acid-C18:3-3:DHA, EPA and 2-series prostaglandins (PGE3)--less inflammatory and strongly inhibit platelet aggregation.

Haggarty P. EJCN 55:1563,2004

Trienes: Derived from
Non Essentials (C18:1n9)
Palmitic Oleic Eicosatrienoic
Tetraenes: Derived from
Essentials (C18:2n6, C18: 3n3)
Desaturase enzymes prefer the Essentials, but if essentials are not present,
Desaturases will act on the non-essentials and increase the ratio.
If Triene/Tetraene is > 0.2, this
Is considered EFA deficiency.

Biochemical EFA Deficiency
in Prematures: Holman Index
Linoleic acid intake (g/kg/d) 1 0 0.02 0 0.2 3 0 0.20 0.80 1.0 7 0 0.50 1.1 1.7
Triene:Tetraene Ratio > 0.2
1 1 (5%) 0 0 0 3 3 (15%) 1 (3%) 0 0 7 16 (80%) 4 (13%) 0 0
Birth weight 1.35 kg, gestational age 31 wk; IV Lipid + = 1 - 3 g/kg/d Gutcher, AJCN 1991; 54:1024
NO IV Lipid NO IV Lipid IV Lipid + NO IV Lipid RDS + RDS + RDS + NO RDS NO Feed Feed + NO Feed Feed +

Hans DM, et al.
Pediatrics. 2009 Jan;123(1):51-
7.2007-3644.
Nutritional practices in the
neonatal intensive care unit:
analysis of a 2006 neonatal
nutrition survey.

In utero lipid supply is approximately 2.5-3.0 grams/kg/d
Essential Fatty Acid (EFA) status in early infancy is low and is rapidly exacerbated with lipid free nutrition.
Long Chain Polyunstaturated Fatty Acid (LCPUFA) derivatives from EFAs are important in brain and retinal development.
Prevention of catabolism and protein sparing.

Biochemical EFA Deficiency in
Prematures: Holman Index
Linoleic acid intake (g/kg/d)
1 0 0.02 0 0.2 3 0 0.20 0.80 1.0 7 0 0.50 1.1 1.7
Triene: Tetraene Ratio > 0.2
1 1 (5%) 0 0 0 3 3 (15%) 1 (3%) 0 0 7 16 (80%) 4 (13%) 0 0
Birth weight 1.35 kg, gestational age 31 wk; IV Lipid + = 1 - 3 g/kg/d
Gutcher, AJCN 1991; 54:1024
NO IV Lipid NO IV Lipid IV Lipid + NO IV Lipid RDS + RDS + RDS + NO RDS NO Feed Feed + NO Feed Feed +

Hyperbilirubinemia Sepsis PPHN Lung Disease Liver Disease Thrombocytopenia ?

Endogenous lipid stores are about 20 g in a 1000g ELBW infant at birth.
How long will this last?

Need total of 80 Kcal/Kg/d for growth Glucose:
8mg/kg/min~39 Kcal
Amino Acids:
3 gm/Kg/d=12 Kcal
Lipids:
Still need ~30 Kcal for 80 total
30 kcal X cc/2.2 KcalX0.2 gm/cc=2.7gm/d


ASAP—As Soon As Possible. No studies
that show problems starting at 3.0 gm/kg/d.
USUALLY NOT MORE THAN 3.0 GM/KG/D NEED PROVIDED.
HYPERLIPIDEMIA TOUGH TO MONITOR PROLONGED INFUSIONS USUALLY
SAFE (<0.2 GM/KG/HR).

Different norms are recommended by different authors (e.g. 100-150, <200 mg/dl, etc.)
Is this efficacious and /or realistic?


Even if mothers are receiving fish oil or omega 3 supplements, ELBW babies do not receive much milk because of lack of enteral feedings.

Lapillone, Neonatology 2010; 98:397-403

This baby would have a DHA deficit of 661 mg/kg by 28 days after birth.

C. Martin, J Peds. 2011;159:743-9

Fish oil emulsion vs. historical controls:
improved (shorter time to) reversal of cholestasis.

Intralipid Omegaven SMOF-lipid Lipoplus
Oil soybean Fish 100% Soy 30 Soy 40%
100% Olive 25% Coconut 50%
Coconut 30% Fish 10%
Fish 15%
Linoleic 44 – 62 0.1 - 0.7 22 24.5
Linolenic 4 – 11 0.2 2 3.5
Palmitic 7 – 14 0.25 - 1.0 10 6
Oleic 19 – 30 0.6 - 1.3 31 8
DHA 0 1.4 - 3.1 2 2.5
Alpha-
Tocopherol 38 mg/dL 150-296 mg/dL ? ?
Phytosterols 348 mg/L 0 ? ?
Kasmi E, et al. Phytosterols promote liver injury and Kupffer cell activation in
parenteral nutrition-associated liver disease. Sci Transl Med 2013;5:206.


What day do you start? How much do you start with?


The ability to provide the essential amino acids required for tissue maintenance.
• Egg albumin=100%
• Milk=85%
• whole wheat bread=30%


Amino Acids
Protein turnover rate is high in the fetus, requiring large amino acid uptake rates.
Fetal animal growth data, when scaled to human fetal growth rate,
predict fetal amino acid requirements = 3.6-4.8 g//kg/day
Factorial Method (Ziegler)—
predict human fetal amino acid requirements = 4 g/kg/day
Fetal AA delivery rates
24 - 28 weeks 3.75 - 4.0 g/kg/d
28 - 32 weeks 3.5 g/kg/d
>32 weeks 3.2 g/kg/d
Term 2.8 – 3.0 g/kg/d
Meier, Peterson, Kennaugh,
Battaglia, et al.

Preterm nutrition - actual recommendation • Very low birth weight (VLBW) preterms have a different nutrient distribution • Preterms with lower birth weight, need more proteins
Protein Requirement (g/100 kcal) in Relation to birth weight
4
3,5
3
2,5
2
1,5
1
0,5
0
10-20% of Preterms
3.6 - 4.1 g/100 kcal (ESPGHAN)
500-700 g 700-900 g 900-1200 g
80-90% of Preterms
3.2 - 3.6 g/100 kcal (ESPGHAN)
1200-1500 g 1500-1800 g
Ziegler EE, Carlson SJ, 2009

Denne, SC. Seminars in Perinatology Volume 31, Issue 2, April 2007

Above 80 non-protein kcal/kg/d, there is no further
increase in protein gain for an increase in energy intake
(protein gain is primarily dependent on protein intake!).

Many NICUs delay TPN amino acids, then begin at 0.5 g/kg/d and advance slowly.
Using this approach, may infants do not attain the intrauterine accretion (3.5-4.0 g/kg/d) until they are 7-14 days of age.
This leads to a significant early protein deficit.

Thureen,et al. Peds Research, 2003

Low amino acids
High amino acids
Thureen, Peds. Rsch. , 2003
Glucose, mmol/L
(mg/dL)
6.2 ± 0.7 (113 ± 13) 6.9 ± 0.8 (125 ± 14)
Insulin, pmol/L
(µU/mL)
75 ± 13 (10.5 ± 1.9) 139 ± 23 (19.3 ± 3.1)*
Values expressed as mean ± SEM.
* Significant difference between groups, p < 0.05.

Delayed TPN
K+
Low Leucine, arginine Other amino acids
Insulin
Glucose

Serum BUN
1
1
0.0
10.0
20.0
30.0
40.0
1
AA Intake
BU
N m
g/d
l
1 g/kg/d
3 g/kg/d
p=0.232
Thureen,et al.
Peds Research, 2003

Blanco CL, et al.
Journal of Pediatrics
2011;158:543-548.
Uremia—why? Thureen et al.
3 g/kg/d
Trophamine
highest BUN
mean plasma
Total AA
concentrations.
Standard vs. Early-High AA infusions using
Aminosyn PF during first week of life in <1000 g,
>24 wks GA infants.
Very high AA
concentrations—
Why?
But--there have been exceptions---

VAL LEU ILEU THR PHE MET LYS HIS0
100
200
300
400 ELBW, 3 g/kg/d AA
Cetin et al, Fetal 2nd Trimester
Cetin et al, Fetal 3rd Trimester
Essential Amino Acids
Am
ino
Ac
id C
on
ce
ntr
ati
on
(u
mo
l/L
)
Even at high
amino acid
infusion rates,
current IV Amino
Acid solutions
may not produce
normal (fetal)
concentrations
of all essential
amino acids,
which “will” limit
growth.
(Thureen and Hay)
Individual Amino Acids – even at 3 g/kg/d
there still is room for improvement!

R. A. Ehrenkranz et al. Longitudinal growth of hospitalized very low birth weight infants. Pediatrics 104 (2 Pt 1):280-289, 1999.

Early nutrition in premature babies can be
safe and efficacious and may prevent significant morbidity.
Many of the dogmas that have prevented
rapid incorporation of early nutrition have
either been disproved, not based on fact or
weak. Begin IV infusions of protein (3-4
grams/kg/d) and lipid (3grams/kg/day) right after birth to prevent protein and energy insufficiency and to keep the baby within normal limits on the growth curve.


