

Confidential. © 2021 IHS Markit®. All rights reserved.
2 August 2021
Paola Perez-Peña, Principal Research Analyst, [email protected]
Edurne Zoco, Executive Director, [email protected]
Global Clean Energy Technology
Carbon Removal Potential: An overview
Workshop

Confidential. © 2021 IHS Markit®. All rights reserved.
Carbon sequestration solutions are classified in two main groups: nature-
based solutions and technology-based solutions
Engineered Carbon Removal Workshop | August 2021
2
Carbon sequestration solutions
Technology-based solutions Nature-based solutions
Afforestation and reforestation
Soil carbon sequestration
Biochar
Enhanced weathering and ocean
alkalinization
Ocean fertilization
Direct air capture (DAC)
Bioenergy with carbon
capture and storage (BECCS)
Carbon capture, utilization and
storage (CCUS)
• Carbon capture and storage
(CCS)
• Carbon capture and utilization
(CCU)
© 2021 IHS Markit.
Source: IHS Markit
Carbon removal: Is a group of nature-base
and technology-base solutions that remove
and sequester carbon dioxide (CO2) from the
atmosphere.

Confidential. © 2021 IHS Markit®. All rights reserved.
Engineered Carbon Removal Workshop | August 2021
3
• CCUS focuses on reducing CO2 emission from new
and existing fossil fuel-based power and industrial
plants.
• CCUS could address up to 54% of global
emissions if deployed in sectors such as power
generation/heat, industrial processes, and
transformation sectors (refining). However, owing
to competition with other technologies, CCUS is
expected to address between 4% and 20% of
emissions.
While CCUS removes CO2 emissions from fossil fuel–based power and
industrial plants, carbon removal solutions balance emissions in atmosphere

Confidential. © 2021 IHS Markit®. All rights reserved.
Overview of the current market
Engineered Carbon Removal Workshop | August 2021
4
Confidential. © 2021 IHS Markit®. All rights reserved.
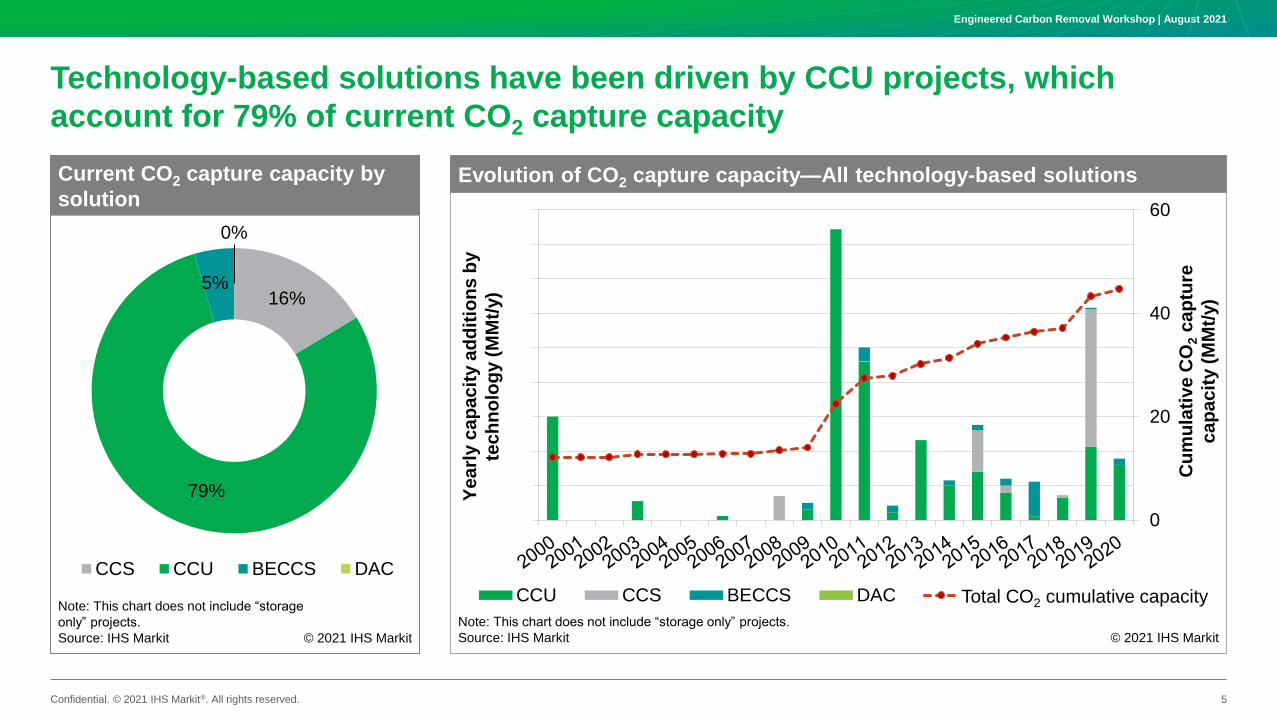
Technology-based solutions have been driven by CCU projects, which
account for 79% of current CO2 capture capacity
16%
79%
5%
0%
CCS CCU BECCS DAC
Current CO2 capture capacity by
solution
© 2021 IHS Markit
Note: This chart does not include “storage
only” projects.
Source: IHS Markit
0
20
40
60
0
1
2
3
4
5
6
7
8
9
CCU CCS BECCS DAC Total CO2 cumlative capacity
Evolution of CO2 capture capacity—All technology-based solutions
Note: This chart does not include “storage only” projects.
Source: IHS Markit © 2021 IHS Markit
Ye
arl
y c
ap
ac
ity a
dd
itio
ns
by
tec
hn
olo
gy (
MM
t/y)
Cu
mu
lati
ve
CO
2c
ap
ture
ca
pa
cit
y (
MM
t/y)
Total CO2 cumulative capacity
Engineered Carbon Removal Workshop | August 2021
5

Confidential. © 2021 IHS Markit®. All rights reserved.
Most of the current CCUS* capacity is in the Americas, with the US accounting
for more than 50% of the capacity, mainly from natural gas processing
Engineered Carbon Removal Workshop | August 2021
6
* CCUS includes CCS and CCU projects.
Note: AE = United Arab Emirates; AU = Australia; BR = Brazil; CA = Canada; CN = mainland China; NO = Norway; US = United States.

Confidential. © 2021 IHS Markit®. All rights reserved.
BECCS and DAC solutions are still in the demonstration phase, current
operating capacity accounts for only 5% of total CO2 capture capacity
Engineered Carbon Removal Workshop | August 2021
7
0
2
4
6
8
10
12
14
16
18
20
0
1
2
3
4
5
North America Europe Asia Total CO2 cumlative capacity
DAC projects additions by year
Note: Two projects on 2010 and 2018 from Global Thermostat are not operating. The innovation center from Carbon Engineering is not considered in
this chart.
Source: IHS Markit, IEA, company website © 2021 IHS Markit
Nu
mb
er
of
pro
jects
Cu
mu
lati
ve C
O2
cap
ture
cap
acit
y (
tho
usan
d
metr
ic t
on
s p
er
year)
Total CO2 cumulative capacity
0
1
2
3
0
1
2
3
4
North America Europe Asia Total CO2 cumlative capacity
Bioenergy with CCU/CCS operating projects by year
Note: *All project during 2019 were pilots.
Source: IHS Markit, IEA, NETL CCUS Database, MIT Carbon Capture and Storage Project Database © 2021 IHS Markit
Nu
mb
er
of
pro
jects
Cu
mu
lati
ve C
O2
Cap
ture
Cap
acit
y
(MM
t/yr)
Total CO2 cumulative capacity

Confidential. © 2021 IHS Markit®. All rights reserved.
Carbon sequestration potential
Engineered Carbon Removal Workshop | August 2021
8

Confidential. © 2021 IHS Markit®. All rights reserved.
Consensus on the need for carbon sequestration is increasing
0%
5%
10%
15%
20%
25%
0 1 2 3 4 5 6 7 8 9
CCUS BECCS and other carbon removal Current capacity
Carbon sequestration share to meet net-zero targets—Scenarios
© 2021 IHS Markit
CO
2em
issio
ns a
bate
men
t (%
)
CO2 capture capacity by 2050 (billion metric tons per year)
Note: IHS Markit Accelerated Carbon Capture and Storage numbers includes both CCUS and BECCS.
*These scenarios estimate net zero will be reached beyond 2050.
Source: IHS Markit, IRENA, IEA, IPCC, BP, Shell
Engineered Carbon Removal Workshop | August 2021
9
CCUS
Bioenergy
IRENA -1.5 S
IRENA -1.5 S
Shell’s Sky
Scenario*
Shell’s Sky
Scenario*
IEA SDS*
IPCC 1.5
(low-overshoot)
0 2 4 6 8 10
IPCC 1.5
IRENA - 1.5 S
CCUS
CCUS capacity expected by 2050 per scenario
© 2021 IHS Markit
CO2 capture capacity by 2050 (billion metric tons per year)
Source: IHS Markit, IRENA, IPCC
52xCurrent capacity
190xCurrent capacityOptimistic
scenario
Conservative
scenario
BP Net-Zero Scenario
BP Net-Zero
Scenario
IPCC 1.5
(low-overshoot)
Various energy scenarios define different paths to meet net-zero targets; however, all of them concur with the need for carbon sequestration solutions
to reduce emissions, and therefore the significant increase of CCUS projects required in the next 30 years.
Between 4% and 20% of CO2 abatement could come from carbon sequestration solutions by 2050
IHS Markit*
Accelerated Carbon
Capture and Storage
(44 MMt/y)
IEA SDS*
Confidential. © 2021 IHS Markit®. All rights reserved.
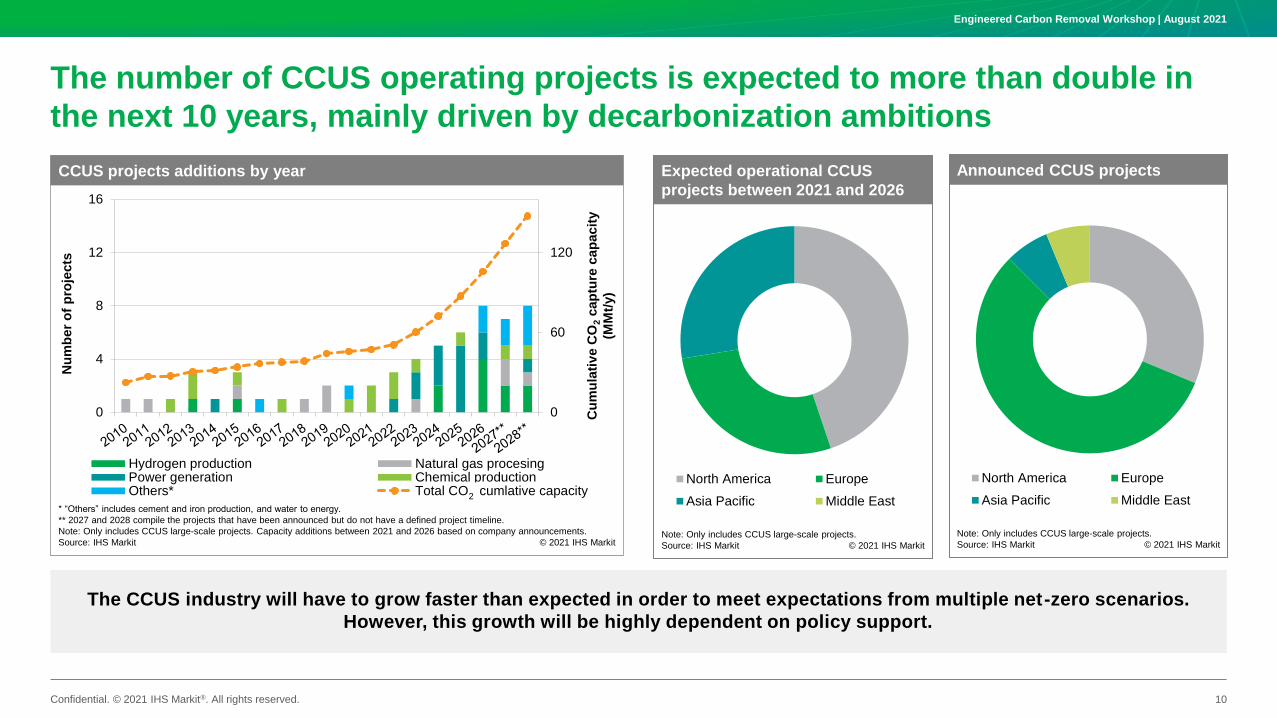
The number of CCUS operating projects is expected to more than double in
the next 10 years, mainly driven by decarbonization ambitions
North America Europe
Asia Pacific Middle East
Expected operational CCUS
projects between 2021 and 2026
© 2021 IHS Markit
Note: Only includes CCUS large-scale projects.
Source: IHS Markit
Engineered Carbon Removal Workshop | August 2021
10
0
60
120
0
4
8
12
16
Hydrogen production Natural gas procesingPower generation Chemical productionOthers* Total CO2 cumlative capacity
CCUS projects additions by year
* “Others” includes cement and iron production, and water to energy.
** 2027 and 2028 compile the projects that have been announced but do not have a defined project timeline.
Note: Only includes CCUS large-scale projects. Capacity additions between 2021 and 2026 based on company announcements.
Source: IHS Markit © 2021 IHS Markit
Nu
mb
er
of
pro
jects
Cu
mu
lati
ve C
O2
cap
ture
cap
acit
y
(MM
t/y)
North America Europe
Asia Pacific Middle East
Announced CCUS projects
© 2021 IHS Markit
Note: Only includes CCUS large-scale projects.
Source: IHS Markit
Total CO2 cumulative capacity
The CCUS industry will have to grow faster than expected in order to meet expectations from multiple net-zero scenarios.
However, this growth will be highly dependent on policy support.
2

Confidential. © 2021 IHS Markit®. All rights reserved.
BECCS and DAC solutions have a small project pipeline, therefore capacity
increase will be limited in the next five years
Engineered Carbon Removal Workshop | August 2021
11
0
1
2
3
4
5
6
7
8
9
0
1
2
3
4
North America Europe Asia Total CO2 cumlative capacity
Bioenergy with CCUS/CCS projects additions by year
*All project during 2019 were pilots. **2027 compiles the projects that have been announced but do not have a defined project timeline
Note: (1) Projects after 2020 are announced projects, timeline of these projects could change. (2) Projects in 2011 capture CO2 from two different
sources, one of them being bioenergy so only part of the carbon captured is associated to BECCS.
Source: IHS Markit, IEA, NETL CCUS Database, MIT Carbon Capture and Storage Project Database © 2021 IHS Markit
Nu
mb
er
of
pro
jects
Cu
mu
lati
ve C
O2
cap
ture
cap
acit
y (
MM
t/y)
0
2
4
6
8
10
12
14
16
18
20
0
1
2
3
4
5
North America Europe Asia Total CO2 cumlative capacity
DAC projects additions by year
Note: (1)Two projects on 2010 and 2018 from Global Thermostat are not operating. The innovation center from Carbon Engineering is not considered in
this chart. (2) 2024 project is contingent on several factors and timeline of this project could change.
Source: IHS Markit, IEA, company website © 2021 IHS Markit
Nu
mb
er
of
pro
jects
Cu
mu
lati
ve C
O2
cap
ture
cap
acit
y
(th
ou
san
d m
etr
ic t
on
s p
er
year)
Orca project—
4 Kt/y—
Climeworks
Commercial plant
1 MMt/y—Carbon
engineering
Total CO2 cumulative capacity Total CO2 cumulative capacity

Confidential. © 2021 IHS Markit®. All rights reserved.
Carbon capture costs are highly project specificMost of the Current policies in place are not enough to incentivize large-scale development of CCS,
however LCFS could be the exception
Engineered Carbon Removal Workshop | August 2021
12
0
50
100
150
200
250
300
350
CCUS highCO2
concentration
CCUS lowCO2
concentration
DACCS BECCS Canada Europe South Korea United States California California
Carbon sequestration solution cost comparison versus selected current emissions scheme pricing (2020 $ per metric ton of CO2)
Note: (*) BECCS costs based on biomass-power generation and BECCS applied to industrial processes. BECCSS capture from bioethanol or biomass gasification is not considered in the cost estimation.
OBPS: Output-Based Pricing System; ETS: Emissions Trading Systems; KETS: Korea Emissions Trading Scheme; CCS: California Allowance; LCFS: Low-Carbon Fuel Standard
Source: IHS Markit, IPCC, NETL, National Petroleum Council, Carbon Engineering, Climeworks © 2021 IHS Markit
20
20
$ p
er
me
tric
to
n o
f C
O2
CCUS high
CO2
concentration
CCUS low
CO2
concentration
Carbon sequestration solutions Emissions trading Tax/credit
OBPS ETS KETS
45Q
(non-EOR)
LCFS
45QCCA
45Q
Up to 600
++

IHS Markit Customer Care
Asia and the Pacific Rim
Japan: +81 3 6262 1887
Asia Pacific: +604 291 3600
Europe, Middle East, and Africa: +44 1344 328 300
Americas: +1 800 447 2273
Disclaimer
The information contained in this presentation is confidential. Any unauthorized use, disclosure, reproduction, or dissemination, in full or in part, in any media or by any means, without the prior written permission of IHS Markit or any of its affiliates ("IHS Markit") is strictly
prohibited. IHS Markit owns all IHS Markit logos and trade names contained in this presentation that are subject to license. Opinions, statements, estimates, and projections in this presentation (including other media) are solely those of the individual author(s) at the time of
writing and do not necessarily reflect the opinions of IHS Markit. Neither IHS Markit nor the author(s) has any obligation to update this presentation in the event that any content, opinion, statement, estimate, or projection (collectively, "information") changes or subsequently
becomes inaccurate. IHS Markit makes no warranty, expressed or implied, as to the accuracy, completeness, or timeliness of any information in this presentation, and shall not in any way be liable to any recipient for any inaccuracies or omissions. Without limiting the
foregoing, IHS Markit shall have no liability whatsoever to any recipient, whether in contract, in tort (including negligence), under warranty, under statute or otherwise, in respect of any loss or damage suffered by any recipient as a result of or in connection with any
information provided, or any course of action determined, by it or any third party, whether or not based on any information provided. The inclusion of a link to an external website by IHS Markit should not be understood to be an endorsement of that website or the site's
owners (or their products/services). IHS Markit is not responsible for either the content or output of external websites. Copyright © 2021, IHS Markit®. All rights reserved and all intellectual property rights are retained by IHS Markit.


