
8/3/2019 Ccny Senate Guide -- Newsday Criteria Version -- With Maps
http://slidepdf.com/reader/full/ccny-senate-guide-newsday-criteria-version-with-maps 1/77
COMMON CAUSE REFORM MAPS – STATE SENATE REDISTRICTING PLAN P a g e | 1

8/3/2019 Ccny Senate Guide -- Newsday Criteria Version -- With Maps
http://slidepdf.com/reader/full/ccny-senate-guide-newsday-criteria-version-with-maps 2/77
COMMON CAUSE REFORM MAPS – STATE SENATE REDISTRICTING PLAN P a g e | 2

8/3/2019 Ccny Senate Guide -- Newsday Criteria Version -- With Maps
http://slidepdf.com/reader/full/ccny-senate-guide-newsday-criteria-version-with-maps 3/77
COMMON CAUSE REFORM MAPS – STATE SENATE REDISTRICTING PLAN P a g e | 3
SUFFOLK COUNTY
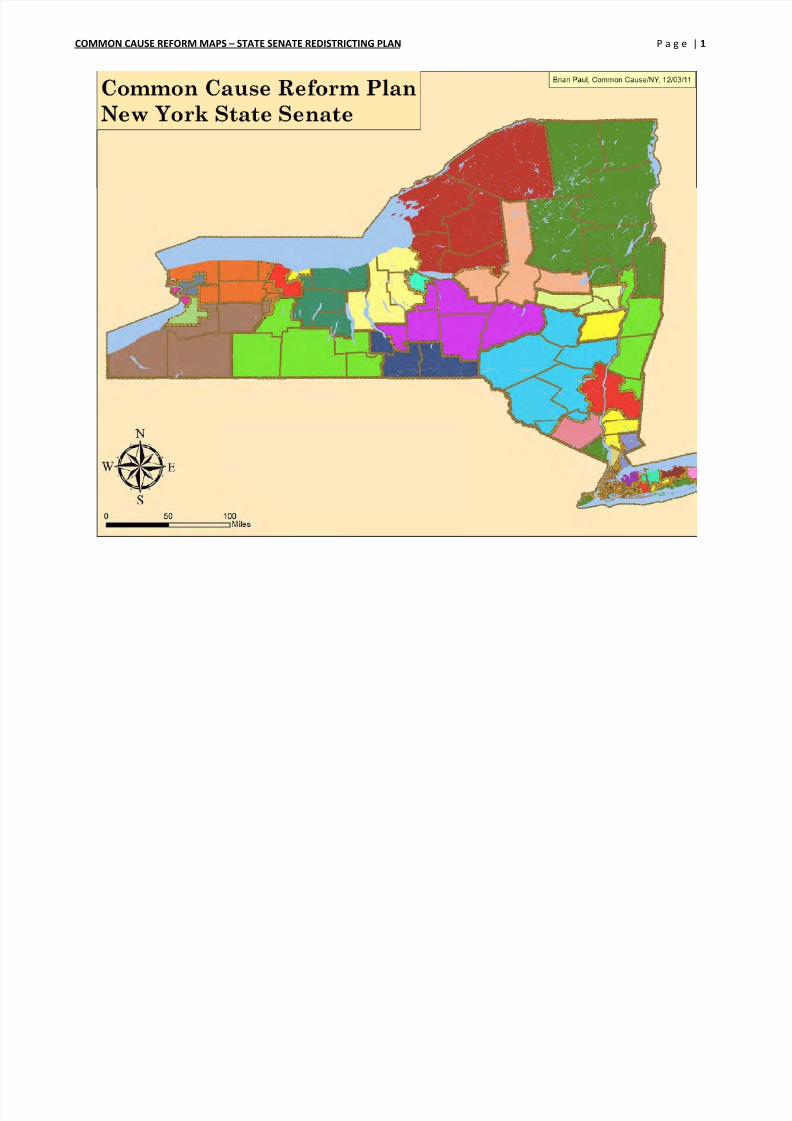
Common Cause Reform Map description and explanation
- Overall, the CC Reform Senate Plan in Suffolk seeks to keep distinct communities of interest together and closely follows town, village,
and school district lines whenever possible.
- North Shore and South Shore districts are kept separate. There is a clear contrast between the North Shore towns of Huntington and
Smithtown, where most households make over $75,000 and many over $125,000, and most of Babylon and Islip where the population is
more middle and working-class, and much more ethnically/racially diverse. Babylon-Islip also has lower rates of homeownership,
education, and more blue-collar and service-sector workers than the North Shore. In addition, communities in the region identify
according to North Shore vs. South Shore.
CC Reform SD 1 occupies the eastern half
of Suffolk County, including eastern
Brookhaven, Riverhead, and theHamptons and North Fork. East Suffolk is
a community of interest in that it is much
more rural and dependent on agriculture
and tourism compared to the rest of
suburban Long Island. CC Reform SD 1
follows village lines and keeps the
Mastic-Shirley area – a distinct localsocial and economic unit -- together in a
single district.

8/3/2019 Ccny Senate Guide -- Newsday Criteria Version -- With Maps
http://slidepdf.com/reader/full/ccny-senate-guide-newsday-criteria-version-with-maps 4/77
COMMON CAUSE REFORM MAPS – STATE SENATE REDISTRICTING PLAN P a g e | 4
CC Reform SD 2 is a
north shore district
encompassing
northwest
Brookhaven (thePort Jefferson area)
and the entire town
of Smithtown. The
district closely
follows village and
town lines.
8/3/2019 Ccny Senate Guide -- Newsday Criteria Version -- With Maps
http://slidepdf.com/reader/full/ccny-senate-guide-newsday-criteria-version-with-maps 5/77
COMMON CAUSE REFORM MAPS – STATE SENATE REDISTRICTING PLAN P a g e | 5
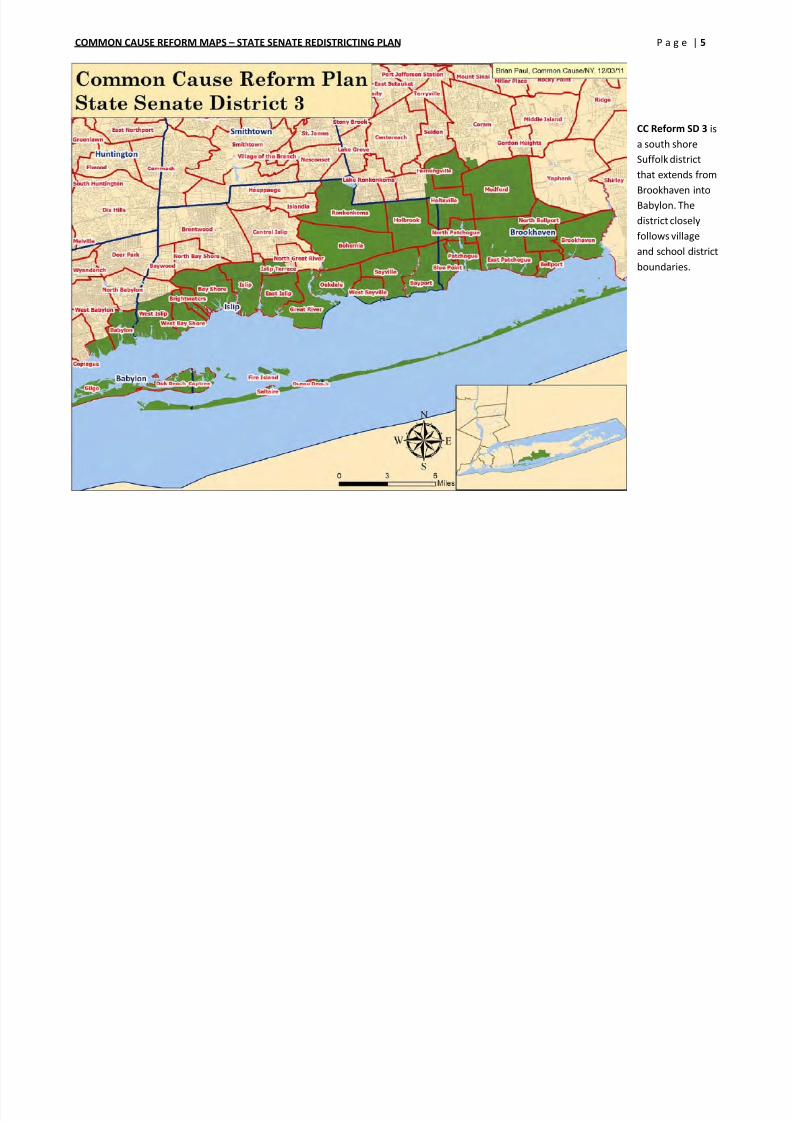
CC Reform SD 3 is
a south shore
Suffolk district
that extends from
Brookhaven into
Babylon. The
district closely
follows village
and school district
boundaries.
8/3/2019 Ccny Senate Guide -- Newsday Criteria Version -- With Maps
http://slidepdf.com/reader/full/ccny-senate-guide-newsday-criteria-version-with-maps 6/77
COMMON CAUSE REFORM MAPS – STATE SENATE REDISTRICTING PLAN P a g e | 6
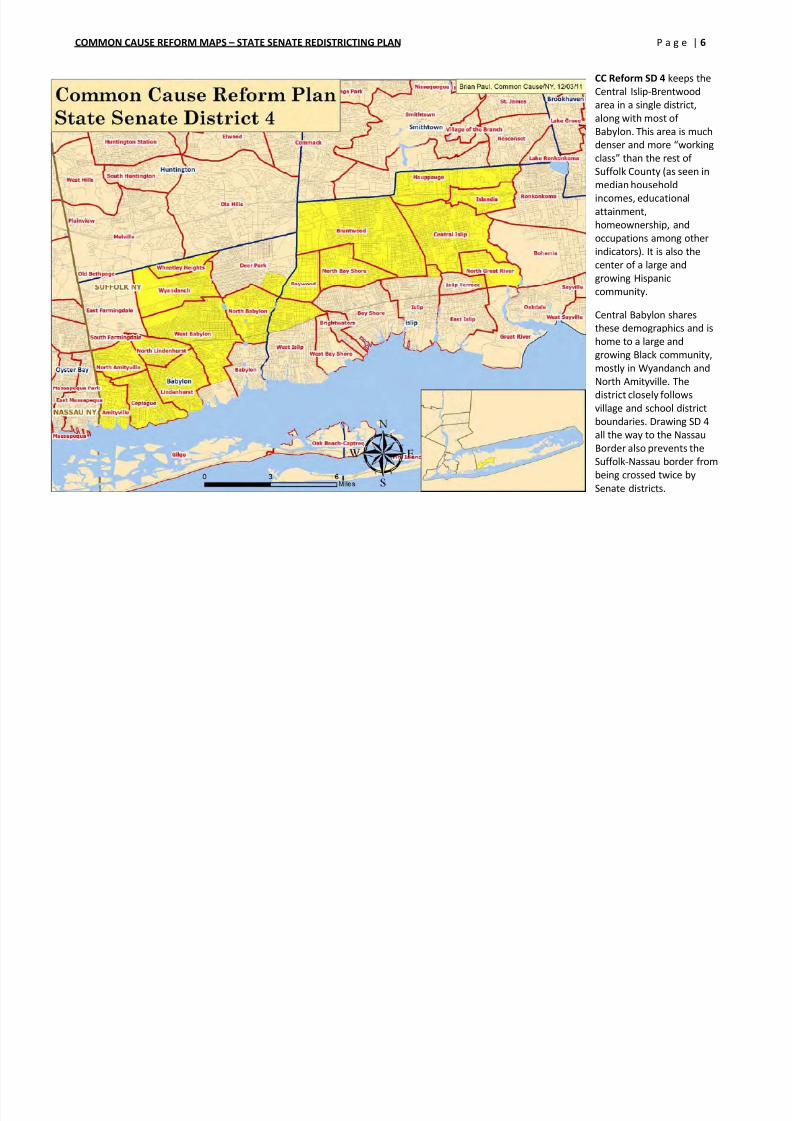
CC Reform SD 4 keeps the
Central Islip-Brentwood
area in a single district,along with most of
Babylon. This area is much
denser and more “working
class” than the rest of
Suffolk County (as seen in
median household
incomes, educational
attainment,homeownership, and
occupations among other
indicators). It is also the
center of a large and
growing Hispanic
community.
Central Babylon shares
these demographics and is
home to a large and
growing Black community,
mostly in Wyandanch and
North Amityville. The
district closely follows
village and school district
boundaries. Drawing SD 4
all the way to the Nassau
Border also prevents the
Suffolk-Nassau border from
being crossed twice by
Senate districts.

8/3/2019 Ccny Senate Guide -- Newsday Criteria Version -- With Maps
http://slidepdf.com/reader/full/ccny-senate-guide-newsday-criteria-version-with-maps 7/77
COMMON CAUSE REFORM MAPS – STATE SENATE REDISTRICTING PLAN P a g e | 7
CC Reform SD 5 is a
north shore district
that straddles the
Nassau-Suffolk
border and includes
the entire town of
Huntington within a
single district. The
district extends into
Babylon to balance
populations to
prevent the crossing
of the Nassau-Suffolk
border by a second
district. Within Oyster
Bay, village lines are
followed as closely as
possible.

8/3/2019 Ccny Senate Guide -- Newsday Criteria Version -- With Maps
http://slidepdf.com/reader/full/ccny-senate-guide-newsday-criteria-version-with-maps 8/77
COMMON CAUSE REFORM MAPS – STATE SENATE REDISTRICTING PLAN P a g e | 8
Major Demographic Changes:
- While the non-Hispanic white voting-age population of Suffolk fell by 0.7% since the year 2000, the non-Hispanic black voting age
population grew by 18.4% and the Hispanic population by 67.7%. Asians account for only 3.4% of Suffolk’s population but are alsoincreasing at a rapid pace. A detailed analysis of the demographics of Suffolk, including illustrative maps and a discussion of some of the
assumptions and factors shaping the districts drawn in the Common Cause Reform Map can be found on Common Cause/NY’s
redistricting blog, Mapping Democracy.
DIST POP VAP NH White VAP NH Black VAP NH Asian VAP Hispanic VAP
1 314,799 242,482 78.7% 5.4% 1.7% 12.8%
2 314,849 239,314 84.1% 2.4% 5.3% 7.2%3 314,439 240,192 80.8% 4.0% 2.5% 11.5%
4 315,408 237,243 48.2% 15.8% 2.7% 31.6%
5 314,525 237,101 79.1% 3.7% 7.4% 8.7%
- CC Reform SD 4 creates a nearly majority-minority coalition district at 31.6% Hispanic VAP and 15.8% NH Black VAP.
o These populations are currently split between SDs 3 (Zeldin-R), 4 (Johnson-R), and 8 (Fuschillo-R) in a political gerrymander.
Incumbent(s) no longer in current district:
- Kenneth Lavalle (1-R), Lee Zeldin (3-R), John Flanagan (2-R)
New districts with no incumbents within borders:
- CC Reform SD 3 (South Shore Suffolk)
Political Outlook: ( percentages represent an average of state senate and state assembly voting in 2010). - Current SD 1 2010 Result: 56.5% StateLeg R, CC Reform SD 1 2010 Result: 56.3% StateLeg R
- Current SD 2 2010 Result: 65.0% StateLeg R, CC Reform SD 2 2010 Result: 63.5% StateLeg R
- Current SD 3 2010 Result: 54.6% StateLeg R, CC Reform SD 3 2010 Result: 61.9% StateLeg R
- Current SD 4 2010 Result: 60.2% StateLeg R, CC Reform SD 4 2010 Result: 54.5% StateLeg D
- Current SD 5 2010 Result: 60.5% StateLeg R, CC Reform SD 5 2010 Result: 59.6% StateLeg R

8/3/2019 Ccny Senate Guide -- Newsday Criteria Version -- With Maps
http://slidepdf.com/reader/full/ccny-senate-guide-newsday-criteria-version-with-maps 9/77
COMMON CAUSE REFORM MAPS – STATE SENATE REDISTRICTING PLAN P a g e | 9
NASSAU COUNTY
Common Cause Reform Map description and explanation
- Overall, the CC Reform Senate Plan in Nassau seeks to keep communities of interest together and closely follows town, village, and
school district lines whenever possible. North shore and south shore districts are kept separate, and distinct areas like the Five Towns
and Central Hempstead are kept together.
CC Reform SD 6 unites the
demographically distinct
area of Central Hempstead
into a single district. This
area is characterized by
higher density, lowermiddle to middle class
incomes, a workforce
concentrated in the “blue
collar” and service sectors,
and increasing minority and
immigrant populations.
8/3/2019 Ccny Senate Guide -- Newsday Criteria Version -- With Maps
http://slidepdf.com/reader/full/ccny-senate-guide-newsday-criteria-version-with-maps 10/77
COMMON CAUSE REFORM MAPS – STATE SENATE REDISTRICTING PLAN P a g e | 10
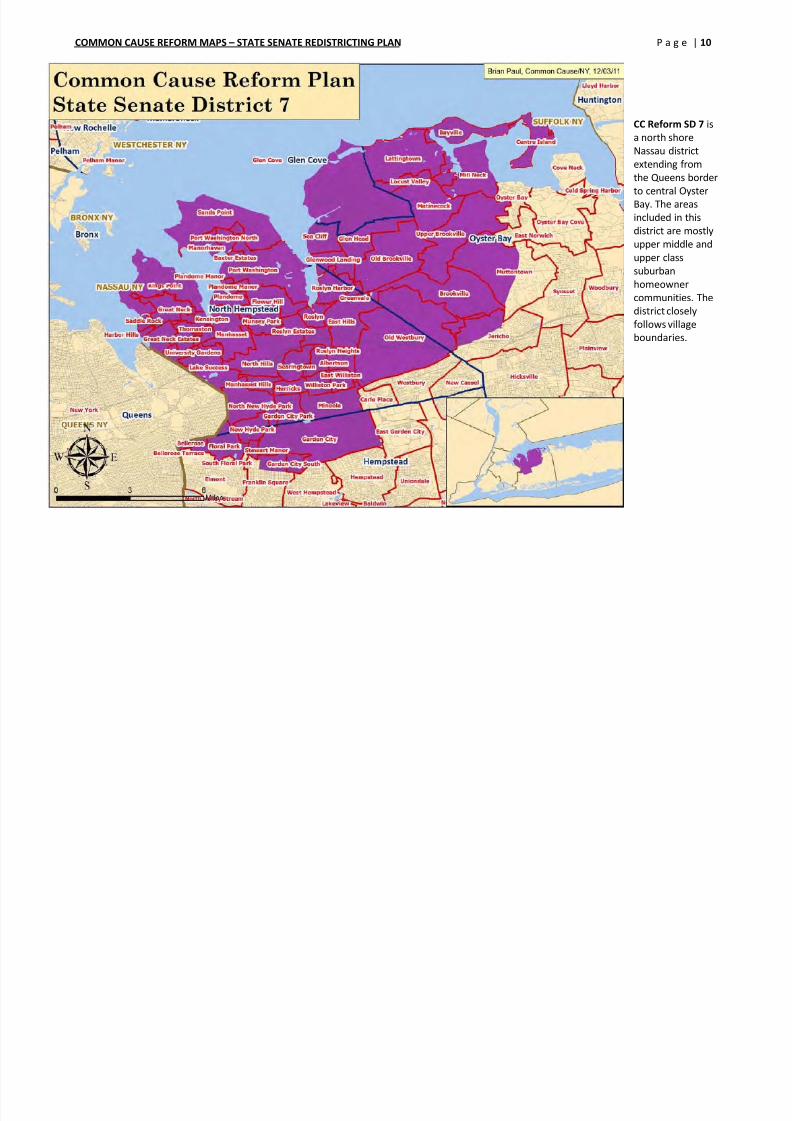
CC Reform SD 7 is
a north shore
Nassau district
extending from
the Queens border
to central Oyster
Bay. The areas
included in thisdistrict are mostly
upper middle and
upper class
suburban
homeowner
communities. The
district closely
follows villageboundaries.
8/3/2019 Ccny Senate Guide -- Newsday Criteria Version -- With Maps
http://slidepdf.com/reader/full/ccny-senate-guide-newsday-criteria-version-with-maps 11/77
COMMON CAUSE REFORM MAPS – STATE SENATE REDISTRICTING PLAN P a g e | 11
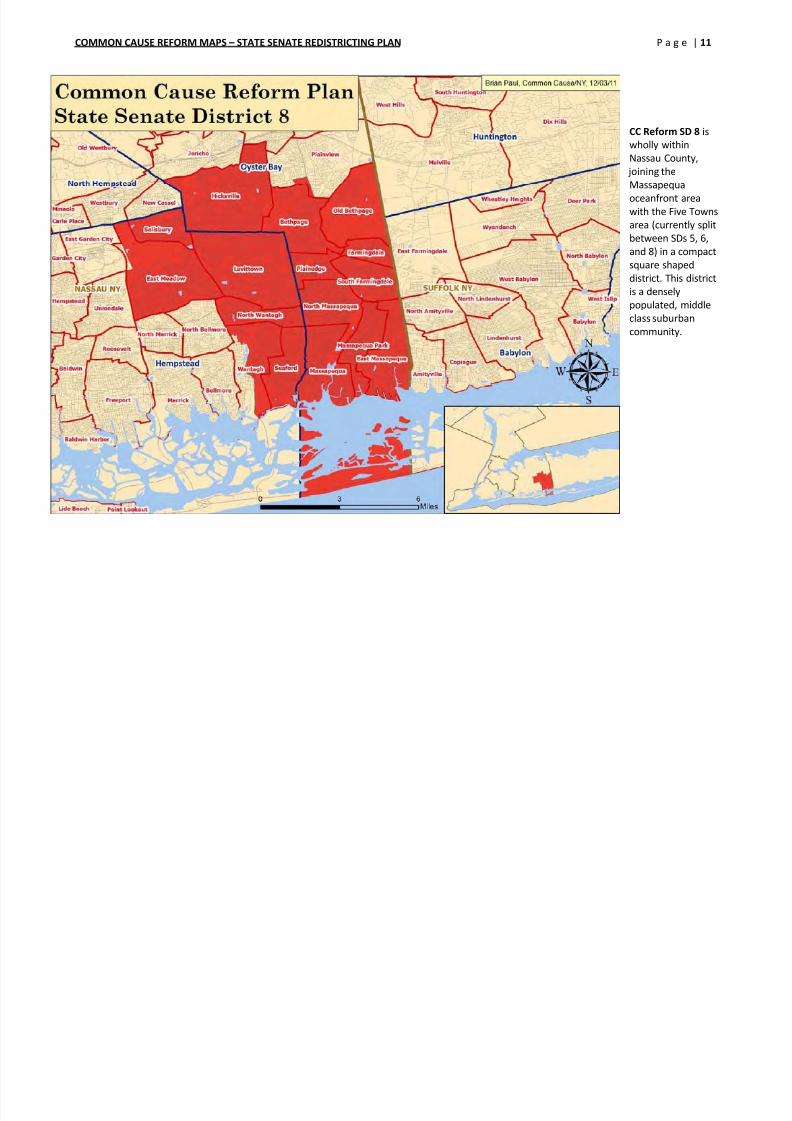
CC Reform SD 8 is
wholly within
Nassau County,
joining the
Massapequa
oceanfront area
with the Five Townsarea (currently split
between SDs 5, 6,
and 8) in a compact
square shaped
district. This district
is a densely
populated, middle
class suburbancommunity.
8/3/2019 Ccny Senate Guide -- Newsday Criteria Version -- With Maps
http://slidepdf.com/reader/full/ccny-senate-guide-newsday-criteria-version-with-maps 12/77
COMMON CAUSE REFORM MAPS – STATE SENATE REDISTRICTING PLAN P a g e | 12
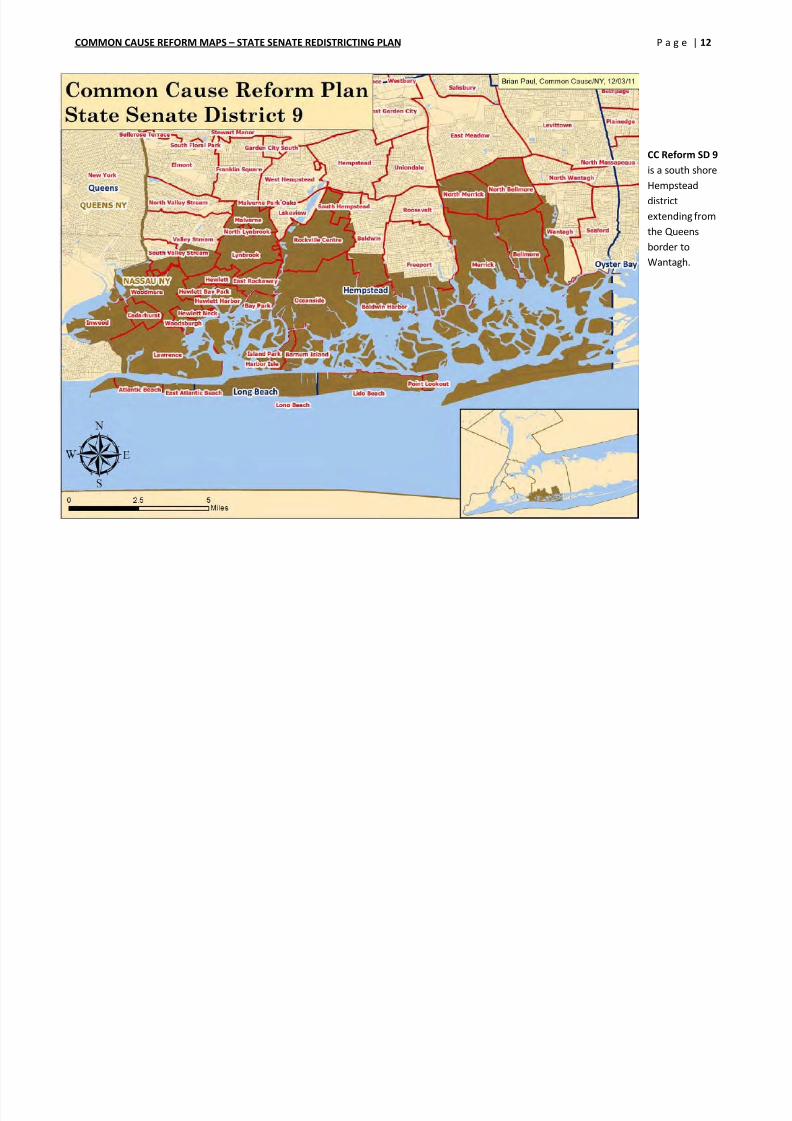
CC Reform SD 9
is a south shore
Hempstead
district
extending fromthe Queens
border to
Wantagh.

8/3/2019 Ccny Senate Guide -- Newsday Criteria Version -- With Maps
http://slidepdf.com/reader/full/ccny-senate-guide-newsday-criteria-version-with-maps 13/77
COMMON CAUSE REFORM MAPS – STATE SENATE REDISTRICTING PLAN P a g e | 13
Major Demographic Changes:
- Overall in Nassau, the non-Hispanic white voting-age population declined by 9% since 2000, but within the Central Hempstead area it
declined by more than 22%. Nassau’s voting age population is now nearly 24% black and Hispanic, up from 18% ten years ago. Thisminority population is concentrated in a geographically compact area that also shares many other demographic commonalities. A more
detailed discussion of Nassau’s demographics can be found by clicking here.
DIST POP VAP NH White VAP NH Black VAP NH Asian VAP Hispanic VAP
6 315,063 239,863 30.0% 34.4% 5.4% 27.9%
7 314,760 241,815 74.5% 2.5% 12.0% 9.5%
8 314,243 243,306 81.5% 2.1% 6.9% 8.5%
9 314,796 242,316 80.6% 4.6% 3.5% 10.3%
- CC Reform SD 6 creates a new majority-minority coalition district at 34.4% NH Black VAP and 26.9% Hispanic VAP.
o These populations are currently split amongst four different districts (SD 6-Hannon-R, SD 7-Martins-R, SD 8-Fuschillo-R, SD 9-Skelos-
R) in a notorious partisan gerrymander designed to “crack” Democratic-leaning minority communities.
Incumbent(s) no longer in current district:
- Kemp Hannon (6-R), Charles Fuschillo Jr (8-R)
New districts with no incumbents within borders:
- CC Reform SD 6 (Central Hempstead), CC Reform SD 8 (Five Towns-Massapequa)
Political Outlook: ( percentages represent an average of state senate and state assembly voting in 2010).
- Current SD 6 2010 Result: 55.9% StateLeg R, CC Reform SD 6 2010 Result: 65.5% StateLeg D
- Current SD 7 2010 Result: 52.1% StateLeg D, CC Reform SD 7 2010 Result: 55.6% StateLeg R
- Current SD 8 2010 Result: 59.3% StateLeg R, CC Reform SD 8 2010 Result: 68.7% StateLeg R
- Current SD 9 2010 Result: 59.2% StateLeg R, CC Reform SD 9 2010 Result: 63.0% StateLeg R
8/3/2019 Ccny Senate Guide -- Newsday Criteria Version -- With Maps
http://slidepdf.com/reader/full/ccny-senate-guide-newsday-criteria-version-with-maps 14/77
COMMON CAUSE REFORM MAPS – STATE SENATE REDISTRICTING PLAN P a g e | 14

8/3/2019 Ccny Senate Guide -- Newsday Criteria Version -- With Maps
http://slidepdf.com/reader/full/ccny-senate-guide-newsday-criteria-version-with-maps 15/77
COMMON CAUSE REFORM MAPS – STATE SENATE REDISTRICTING PLAN P a g e | 15
8/3/2019 Ccny Senate Guide -- Newsday Criteria Version -- With Maps
http://slidepdf.com/reader/full/ccny-senate-guide-newsday-criteria-version-with-maps 16/77
COMMON CAUSE REFORM MAPS – STATE SENATE REDISTRICTING PLAN P a g e | 16
QUEENS
Common Cause Reform Map description and explanation
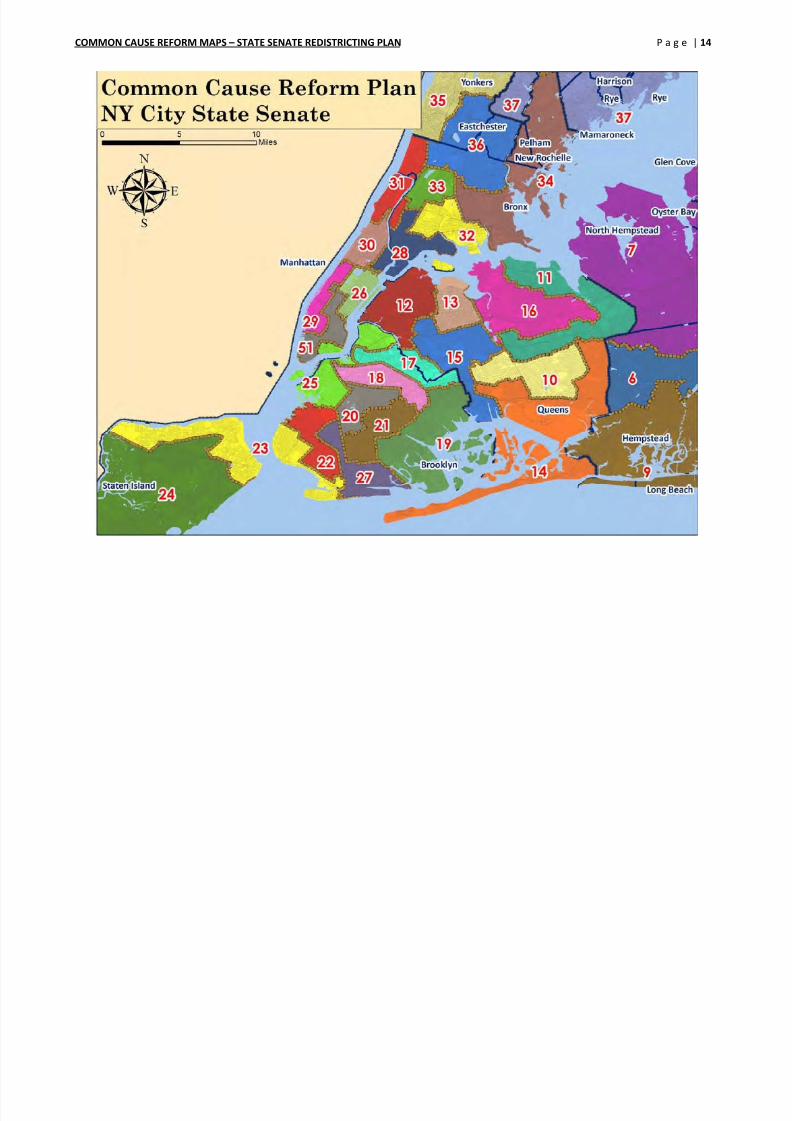
- The population of New York City and Southern Westchester (two districts cross the Bronx-Westchester line) relative to the rest of the
state supports placing 29 districts in New York City-Southern Westchester.
o During the last redistricting cycle, Senate Republicans chose to only draw 28 districts within New York City-Southern
Westchester, with 7 districts in Queens overpopulated at almost +4% and 21 districts in the rest overpopulated at +1.6%.
Drawing 28 districts in New York City-Southern Westchester instead of 29 is a clear political gerrymander to avoid an additional
likely Democratic seat upstate.
The flip side of NYC’s districts being overpopulated is that Upstate districts are under-populated. In the last redistricting
cycle, Senate Republicans drew 25 districts Upstate at a mean deviation of -2.82%.
• Drawing a plan on good-government criteria, which better adheres to the principle of “one person, one vote,”
24 districts should be drawn in Upstate at a mean deviation of +0.51%.
- If the appropriate 29 districts are drawn in New York City-Southern Westchester, the populations of the districts are much closer to the
statewide average at -0.65%. The Brooklyn-Queens border must be crossed by a senate district to achieve uniform population size acrossall five boroughs.
- Drawn with an incumbent-blind process, the Common Cause Reform senate districts in Queens keep distinct neighborhoods whole and
reflect the rapidly changing demographics of the “borough of immigrants.” At LATFOR’s public hearing in Queens, local residents from
numerous communities testified that they wanted their neighborhoods to remain intact in the new maps, pointing out how the division
of neighborhoods reduces civic engagement and political accountability.
8/3/2019 Ccny Senate Guide -- Newsday Criteria Version -- With Maps
http://slidepdf.com/reader/full/ccny-senate-guide-newsday-criteria-version-with-maps 17/77
COMMON CAUSE REFORM MAPS – STATE SENATE REDISTRICTING PLAN P a g e | 17
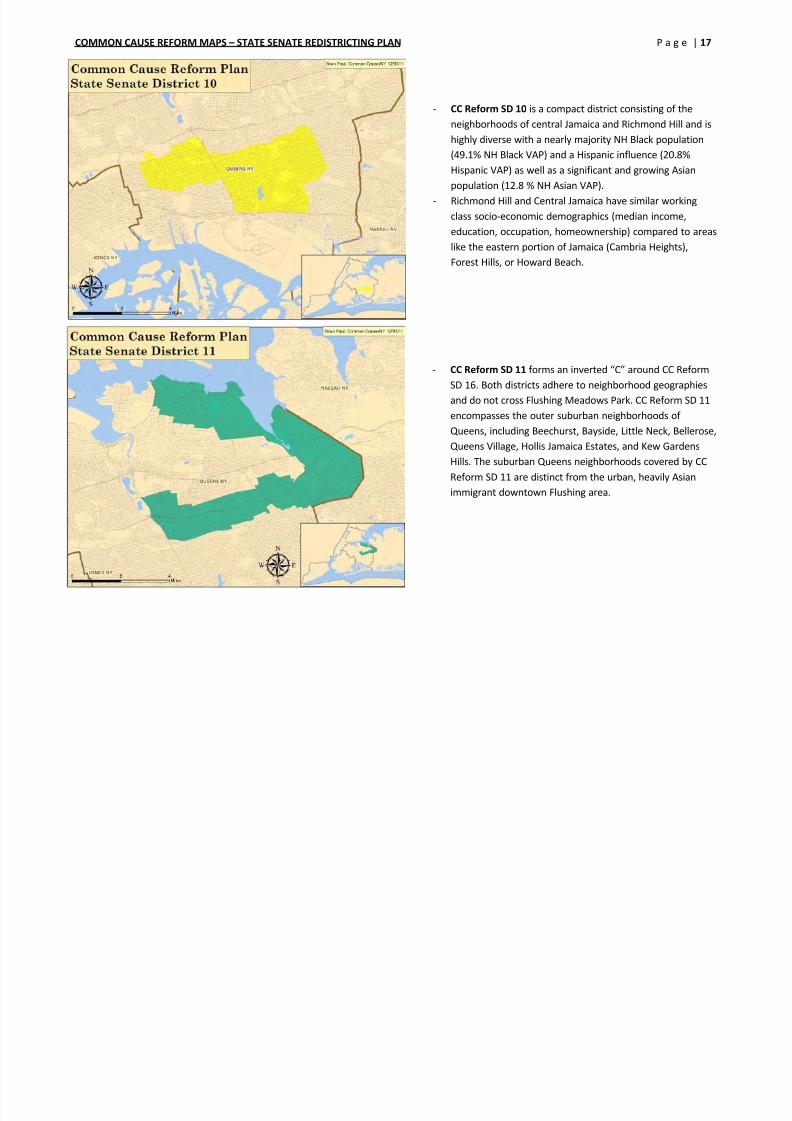
- CC Reform SD 10 is a compact district consisting of theneighborhoods of central Jamaica and Richmond Hill and is
highly diverse with a nearly majority NH Black population
(49.1% NH Black VAP) and a Hispanic influence (20.8%
Hispanic VAP) as well as a significant and growing Asian
population (12.8 % NH Asian VAP).
- Richmond Hill and Central Jamaica have similar working
class socio-economic demographics (median income,education, occupation, homeownership) compared to areas
like the eastern portion of Jamaica (Cambria Heights),
Forest Hills, or Howard Beach.
- CC Reform SD 11 forms an inverted “C” around CC Reform
SD 16. Both districts adhere to neighborhood geographies
and do not cross Flushing Meadows Park. CC Reform SD 11
encompasses the outer suburban neighborhoods of
Queens, including Beechurst, Bayside, Little Neck, Bellerose,Queens Village, Hollis Jamaica Estates, and Kew Gardens
Hills. The suburban Queens neighborhoods covered by CC
Reform SD 11 are distinct from the urban, heavily Asian
immigrant downtown Flushing area.
8/3/2019 Ccny Senate Guide -- Newsday Criteria Version -- With Maps
http://slidepdf.com/reader/full/ccny-senate-guide-newsday-criteria-version-with-maps 18/77
COMMON CAUSE REFORM MAPS – STATE SENATE REDISTRICTING PLAN P a g e | 18
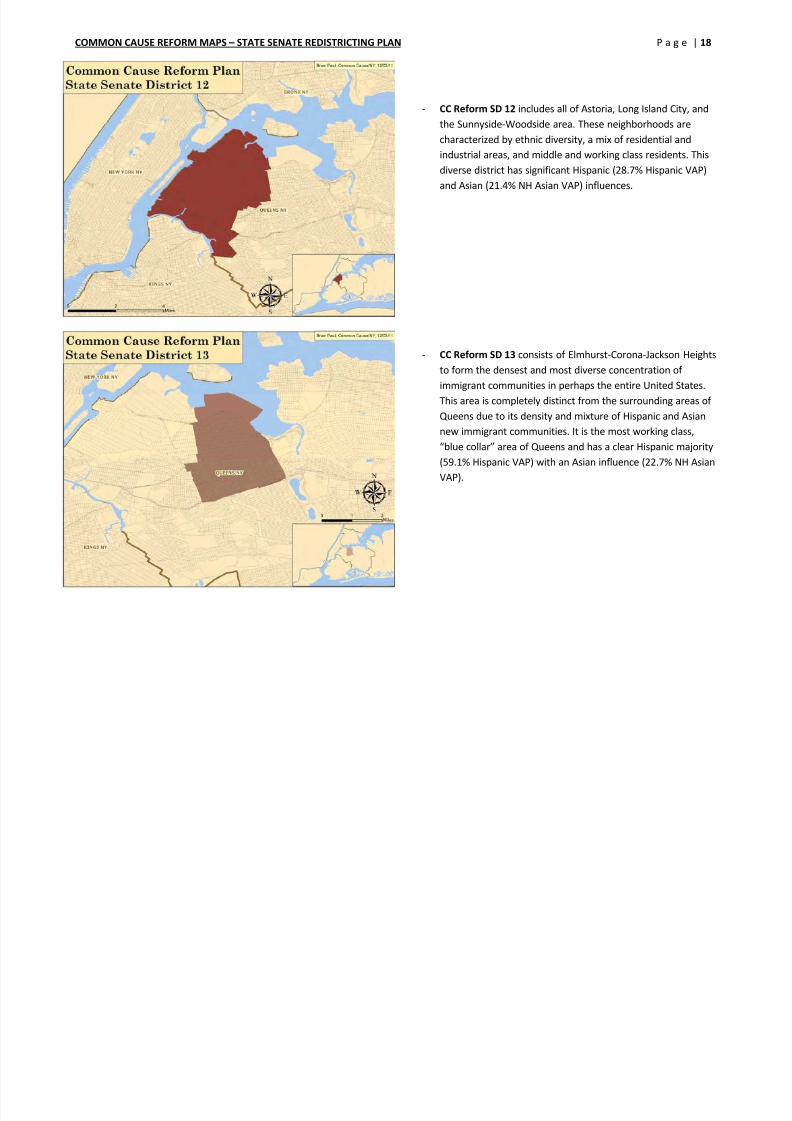
- CC Reform SD 12 includes all of Astoria, Long Island City, andthe Sunnyside-Woodside area. These neighborhoods are
characterized by ethnic diversity, a mix of residential and
industrial areas, and middle and working class residents. This
diverse district has significant Hispanic (28.7% Hispanic VAP)
and Asian (21.4% NH Asian VAP) influences.
- CC Reform SD 13 consists of Elmhurst-Corona-Jackson Heights
to form the densest and most diverse concentration of
immigrant communities in perhaps the entire United States.
This area is completely distinct from the surrounding areas of
Queens due to its density and mixture of Hispanic and Asian
new immigrant communities. It is the most working class,“blue collar” area of Queens and has a clear Hispanic majority
(59.1% Hispanic VAP) with an Asian influence (22.7% NH Asian
VAP).
8/3/2019 Ccny Senate Guide -- Newsday Criteria Version -- With Maps
http://slidepdf.com/reader/full/ccny-senate-guide-newsday-criteria-version-with-maps 19/77
COMMON CAUSE REFORM MAPS – STATE SENATE REDISTRICTING PLAN P a g e | 19
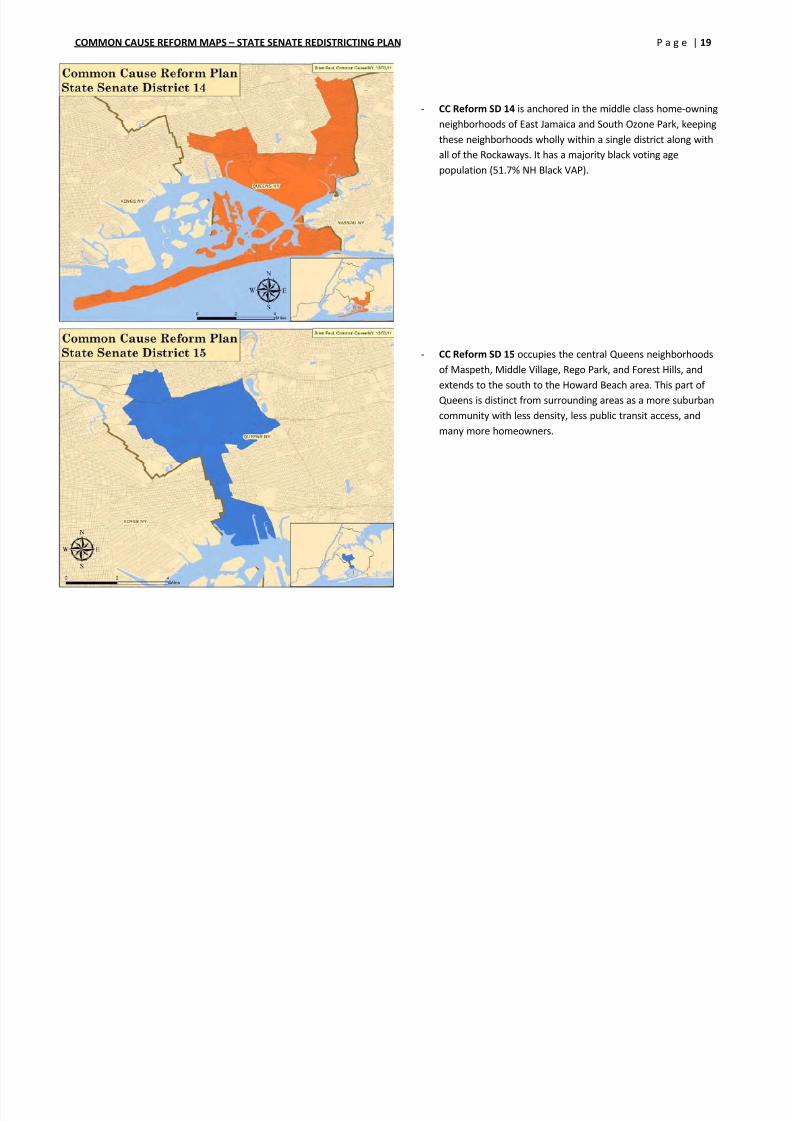
- CC Reform SD 14 is anchored in the middle class home-owningneighborhoods of East Jamaica and South Ozone Park, keeping
these neighborhoods wholly within a single district along with
all of the Rockaways. It has a majority black voting age
population (51.7% NH Black VAP).
- CC Reform SD 15 occupies the central Queens neighborhoods
of Maspeth, Middle Village, Rego Park, and Forest Hills, and
extends to the south to the Howard Beach area. This part of
Queens is distinct from surrounding areas as a more suburban
community with less density, less public transit access, and
many more homeowners.
8/3/2019 Ccny Senate Guide -- Newsday Criteria Version -- With Maps
http://slidepdf.com/reader/full/ccny-senate-guide-newsday-criteria-version-with-maps 20/77
COMMON CAUSE REFORM MAPS – STATE SENATE REDISTRICTING PLAN P a g e | 20
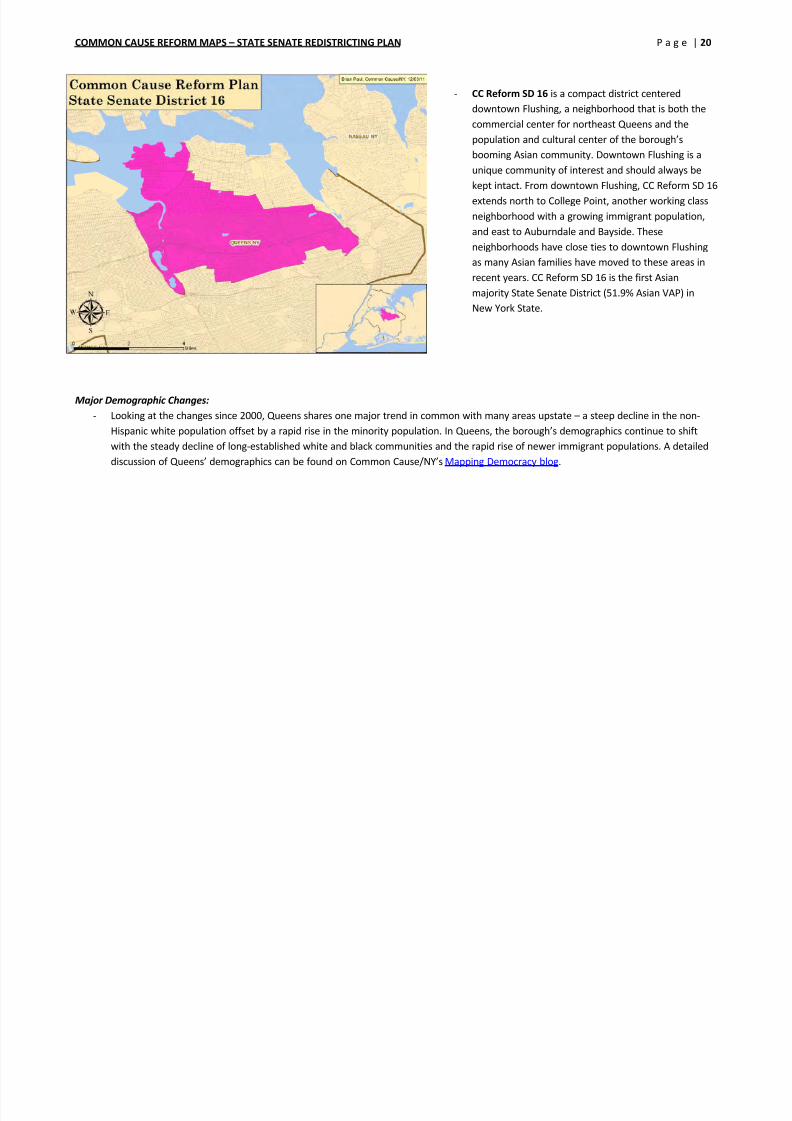
- CC Reform SD 16 is a compact district centered
downtown Flushing, a neighborhood that is both thecommercial center for northeast Queens and the
population and cultural center of the borough’s
booming Asian community. Downtown Flushing is a
unique community of interest and should always be
kept intact. From downtown Flushing, CC Reform SD 16
extends north to College Point, another working class
neighborhood with a growing immigrant population,and east to Auburndale and Bayside. These
neighborhoods have close ties to downtown Flushing
as many Asian families have moved to these areas in
recent years. CC Reform SD 16 is the first Asian
majority State Senate District (51.9% Asian VAP) in
New York State.
Major Demographic Changes:
- Looking at the changes since 2000, Queens shares one major trend in common with many areas upstate – a steep decline in the non-
Hispanic white population offset by a rapid rise in the minority population. In Queens, the borough’s demographics continue to shiftwith the steady decline of long-established white and black communities and the rapid rise of newer immigrant populations. A detailed
discussion of Queens’ demographics can be found on Common Cause/NY’s Mapping Democracy blog.
8/3/2019 Ccny Senate Guide -- Newsday Criteria Version -- With Maps
http://slidepdf.com/reader/full/ccny-senate-guide-newsday-criteria-version-with-maps 21/77
COMMON CAUSE REFORM MAPS – STATE SENATE REDISTRICTING PLAN P a g e | 21
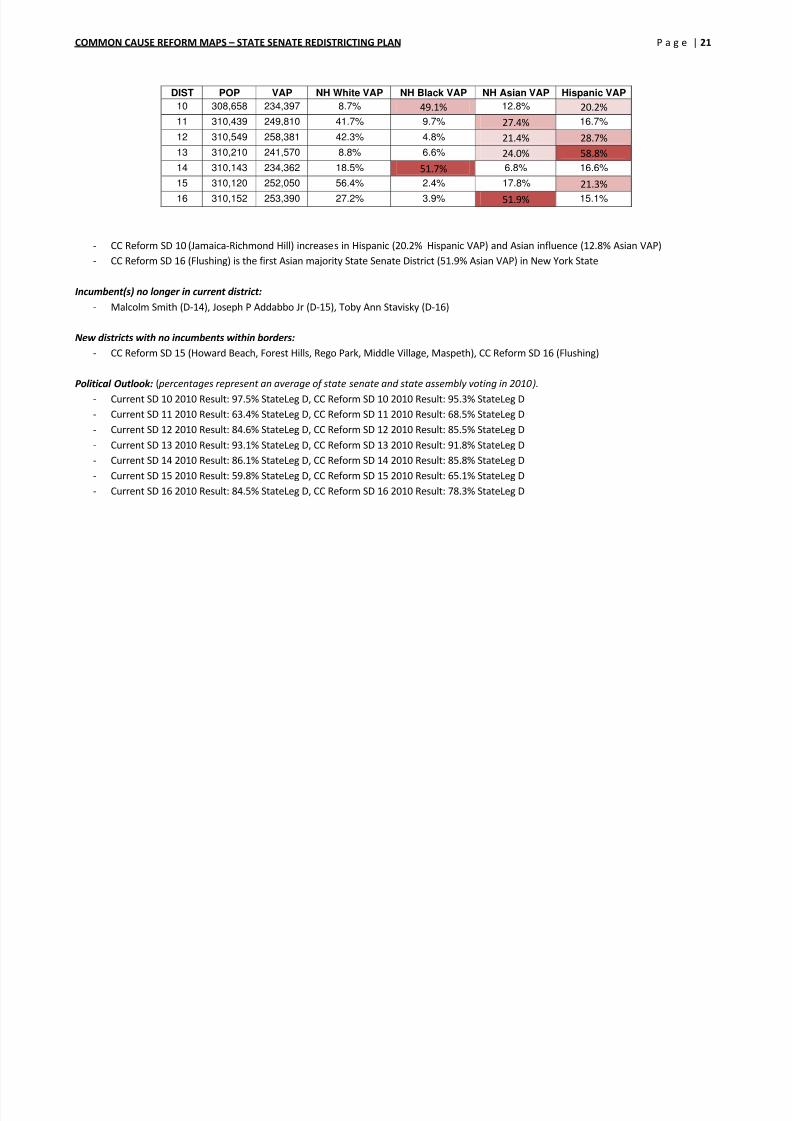
DIST POP VAP NH White VAP NH Black VAP NH Asian VAP Hispanic VAP
10 308,658 234,397 8.7%49.1%
12.8%20.2%
11 310,439 249,810 41.7% 9.7% 27.4% 16.7%
12 310,549 258,381 42.3% 4.8% 21.4% 28.7%
13 310,210 241,570 8.8% 6.6% 24.0% 58.8%
14 310,143 234,362 18.5% 51.7% 6.8% 16.6%
15 310,120 252,050 56.4% 2.4% 17.8% 21.3%
16 310,152 253,390 27.2% 3.9% 51.9% 15.1%
- CC Reform SD 10 (Jamaica-Richmond Hill) increases in Hispanic (20.2% Hispanic VAP) and Asian influence (12.8% Asian VAP)
- CC Reform SD 16 (Flushing) is the first Asian majority State Senate District (51.9% Asian VAP) in New York State
Incumbent(s) no longer in current district:
- Malcolm Smith (D-14), Joseph P Addabbo Jr (D-15), Toby Ann Stavisky (D-16)
New districts with no incumbents within borders:
- CC Reform SD 15 (Howard Beach, Forest Hills, Rego Park, Middle Village, Maspeth), CC Reform SD 16 (Flushing)
Political Outlook: ( percentages represent an average of state senate and state assembly voting in 2010).
- Current SD 10 2010 Result: 97.5% StateLeg D, CC Reform SD 10 2010 Result: 95.3% StateLeg D
- Current SD 11 2010 Result: 63.4% StateLeg D, CC Reform SD 11 2010 Result: 68.5% StateLeg D
- Current SD 12 2010 Result: 84.6% StateLeg D, CC Reform SD 12 2010 Result: 85.5% StateLeg D- Current SD 13 2010 Result: 93.1% StateLeg D, CC Reform SD 13 2010 Result: 91.8% StateLeg D
- Current SD 14 2010 Result: 86.1% StateLeg D, CC Reform SD 14 2010 Result: 85.8% StateLeg D
- Current SD 15 2010 Result: 59.8% StateLeg D, CC Reform SD 15 2010 Result: 65.1% StateLeg D
- Current SD 16 2010 Result: 84.5% StateLeg D, CC Reform SD 16 2010 Result: 78.3% StateLeg D
8/3/2019 Ccny Senate Guide -- Newsday Criteria Version -- With Maps
http://slidepdf.com/reader/full/ccny-senate-guide-newsday-criteria-version-with-maps 22/77
COMMON CAUSE REFORM MAPS – STATE SENATE REDISTRICTING PLAN P a g e | 22

8/3/2019 Ccny Senate Guide -- Newsday Criteria Version -- With Maps
http://slidepdf.com/reader/full/ccny-senate-guide-newsday-criteria-version-with-maps 23/77
COMMON CAUSE REFORM MAPS – STATE SENATE REDISTRICTING PLAN P a g e | 23
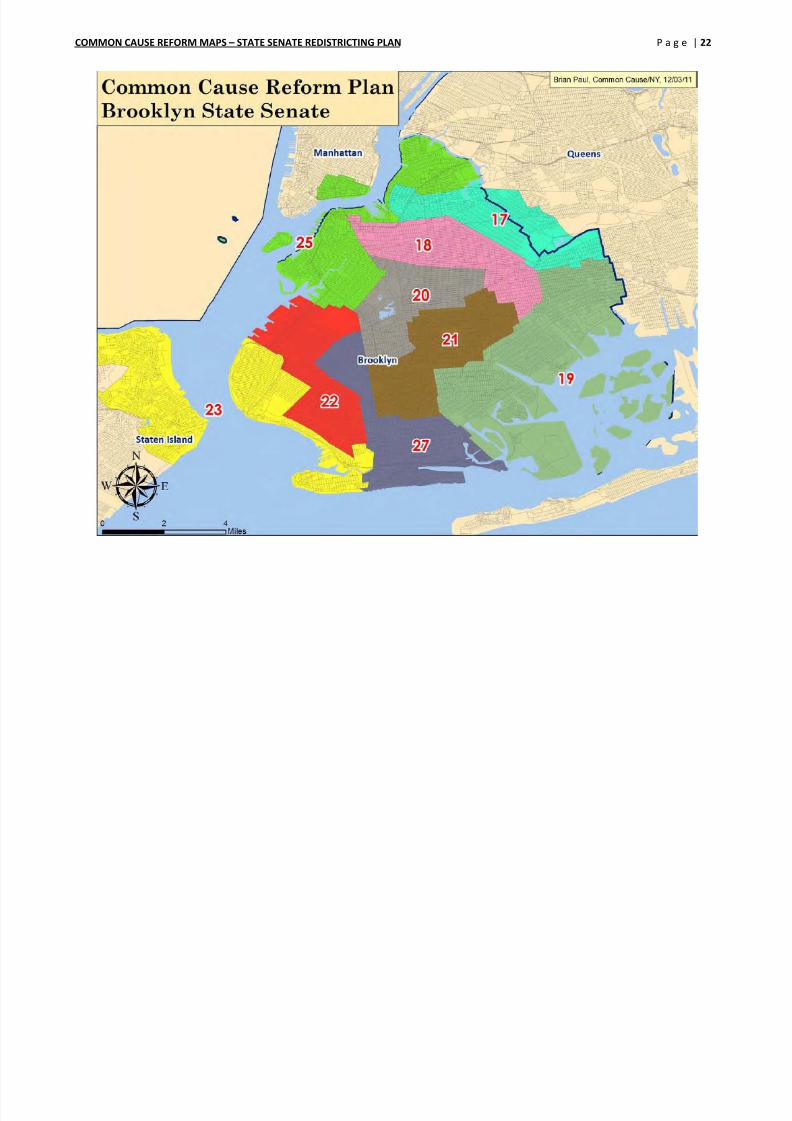
BROOKLYN – STATEN ISLAND
Common Cause Reform Map description and explanation
- Drawn from a blank slate with an incumbent-blind process, the Common Cause Reform senate districts in Brooklyn keep distinct
neighborhoods and communities of interest together as much as possible in compact, contiguous districts, while following the precepts
of the Voting Rights Act to maximize minority communities’ opportunities for representation.
- The population of Staten Island too large for a single Senate district but two small to fit two, so one district must cross between Staten
Island and Brooklyn. The Queens-Brooklyn border also needs to be crossed because drawing seven senate districts entirely within
Queens (as was done in the last cycle) produces districts with a +4% population deviation from the statewide average.
Kings County, which is identical to the Borough of Brooklyn, is a covered jurisdiction under Section 5 of the Voting Rights Act.
- In Brooklyn, the Common Cause Reform Plan draws:
o Four majority NH Black districts -- SDs 19, 20, 21, and 22 – equal to the four that currently exist.
o One majority Hispanic districts – SD 17 -- (which crosses the Brooklyn-Queens line), and two Hispanic influence districts -- SDs 22
and 23 – equal to the number that currently exist.
o One strong Asian influence district – SD 22 – at 37.5% Asian VAP. This population is currently divided between two weaker
influence districts, SDs 22 and 23.
- CC Reform SD 17 runs from Cypress Hills through
Bushwick and Ridgewood to Southside Williamsburg. In
addition to being mostly Hispanic (53.7% Hispanic VAP),
these are working-class communities of renters with a
particularly high proportion of blue-collar workers in
industrial, transportation, and construction jobs. In the
central portion of the district, the Ridgewood-Bushwick
community functions as a single neighborhood unit and
should be kept together despite the presence of the
borough/county line.
- The Queens-Brooklyn border needs to be crossed
because drawing 7 senate districts entirely within Queens
produces districts with a +4% population deviation from
the statewide average. Ridgewood-Bushwick is the ideal
place to cross the borough border.
8/3/2019 Ccny Senate Guide -- Newsday Criteria Version -- With Maps
http://slidepdf.com/reader/full/ccny-senate-guide-newsday-criteria-version-with-maps 24/77
COMMON CAUSE REFORM MAPS – STATE SENATE REDISTRICTING PLAN P a g e | 24
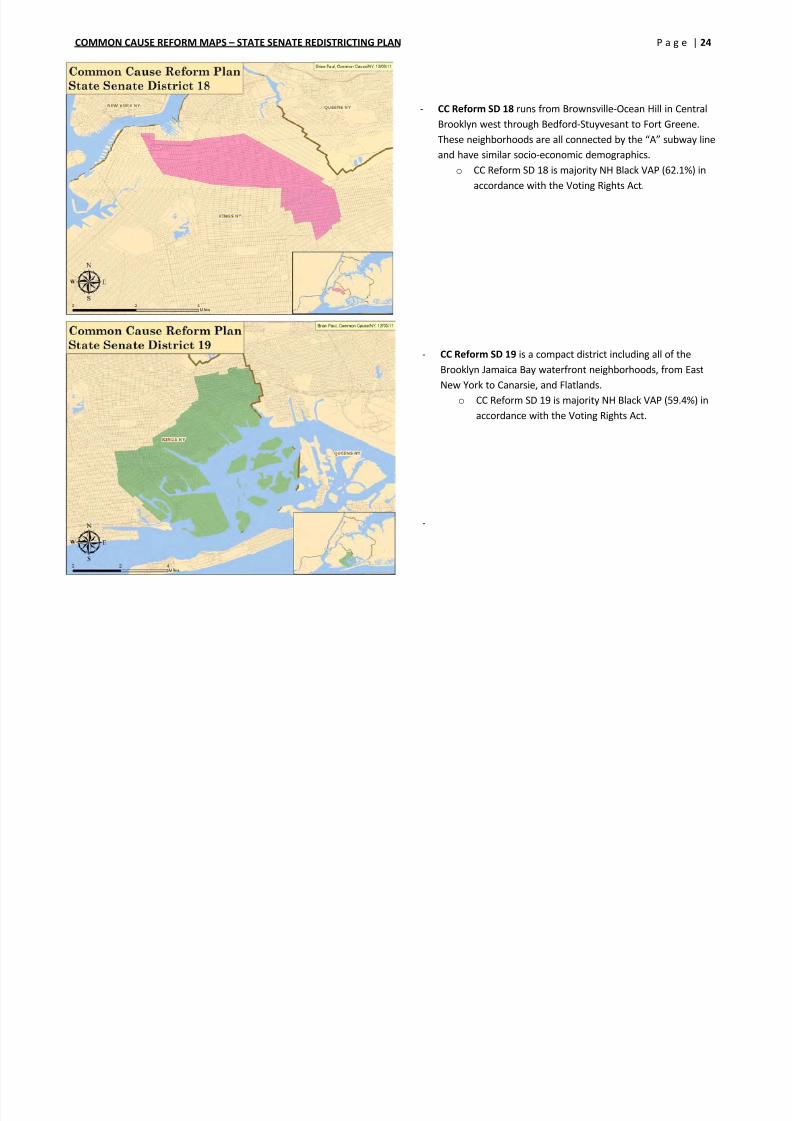
- CC Reform SD 18 runs from Brownsville-Ocean Hill in CentralBrooklyn west through Bedford-Stuyvesant to Fort Greene.
These neighborhoods are all connected by the “A” subway line
and have similar socio-economic demographics.
o CC Reform SD 18 is majority NH Black VAP (62.1%) in
accordance with the Voting Rights Act.
- CC Reform SD 19 is a compact district including all of the
Brooklyn Jamaica Bay waterfront neighborhoods, from East
New York to Canarsie, and Flatlands.
o CC Reform SD 19 is majority NH Black VAP (59.4%) in
accordance with the Voting Rights Act.
-
8/3/2019 Ccny Senate Guide -- Newsday Criteria Version -- With Maps
http://slidepdf.com/reader/full/ccny-senate-guide-newsday-criteria-version-with-maps 25/77
COMMON CAUSE REFORM MAPS – STATE SENATE REDISTRICTING PLAN P a g e | 25
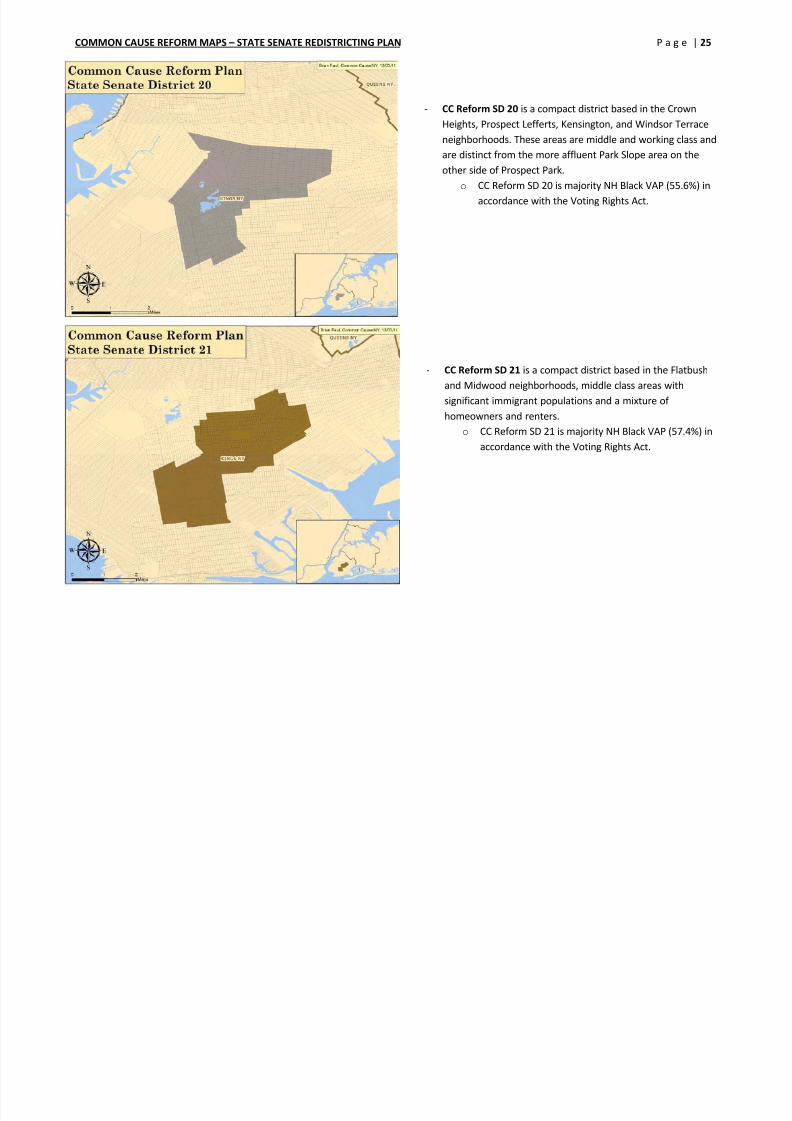
- CC Reform SD 20 is a compact district based in the CrownHeights, Prospect Lefferts, Kensington, and Windsor Terrace
neighborhoods. These areas are middle and working class and
are distinct from the more affluent Park Slope area on the
other side of Prospect Park.
o CC Reform SD 20 is majority NH Black VAP (55.6%) in
accordance with the Voting Rights Act.
- CC Reform SD 21 is a compact district based in the Flatbush
and Midwood neighborhoods, middle class areas with
significant immigrant populations and a mixture of
homeowners and renters.
o CC Reform SD 21 is majority NH Black VAP (57.4%) inaccordance with the Voting Rights Act.
8/3/2019 Ccny Senate Guide -- Newsday Criteria Version -- With Maps
http://slidepdf.com/reader/full/ccny-senate-guide-newsday-criteria-version-with-maps 26/77
COMMON CAUSE REFORM MAPS – STATE SENATE REDISTRICTING PLAN P a g e | 26
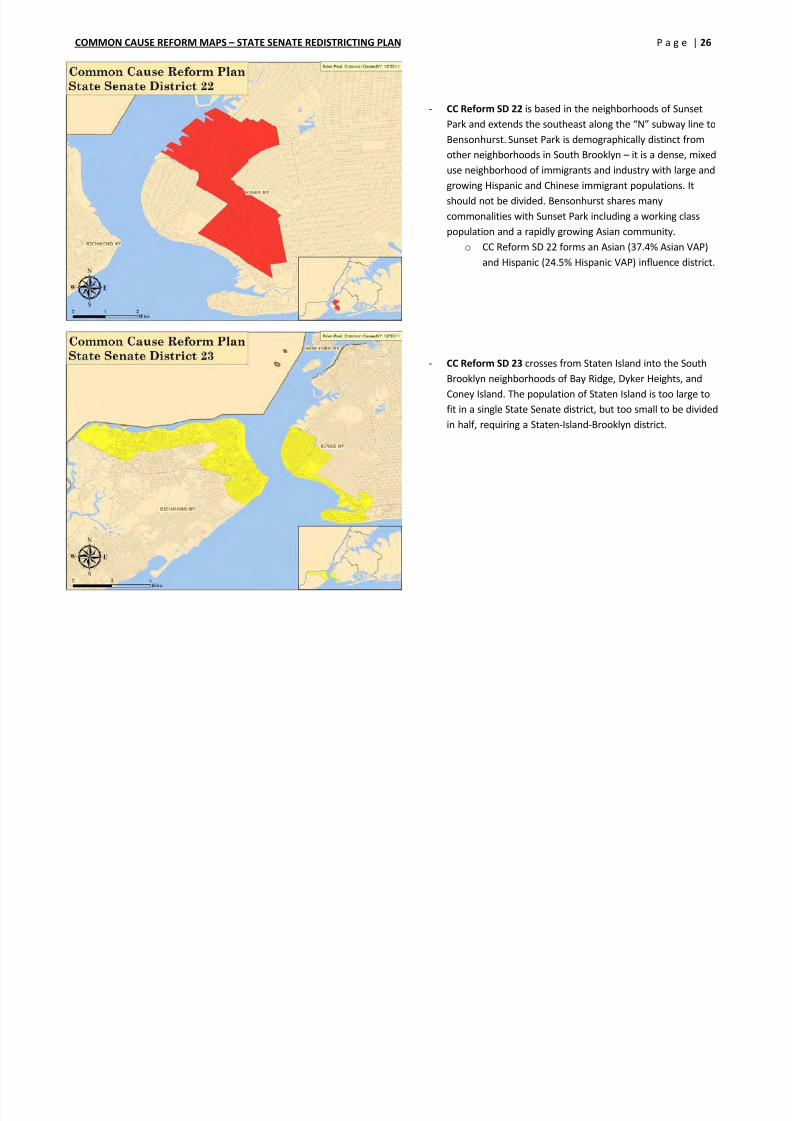
- CC Reform SD 22 is based in the neighborhoods of SunsetPark and extends the southeast along the “N” subway line to
Bensonhurst. Sunset Park is demographically distinct from
other neighborhoods in South Brooklyn – it is a dense, mixed
use neighborhood of immigrants and industry with large and
growing Hispanic and Chinese immigrant populations. It
should not be divided. Bensonhurst shares many
commonalities with Sunset Park including a working classpopulation and a rapidly growing Asian community.
o CC Reform SD 22 forms an Asian (37.4% Asian VAP)
and Hispanic (24.5% Hispanic VAP) influence district.
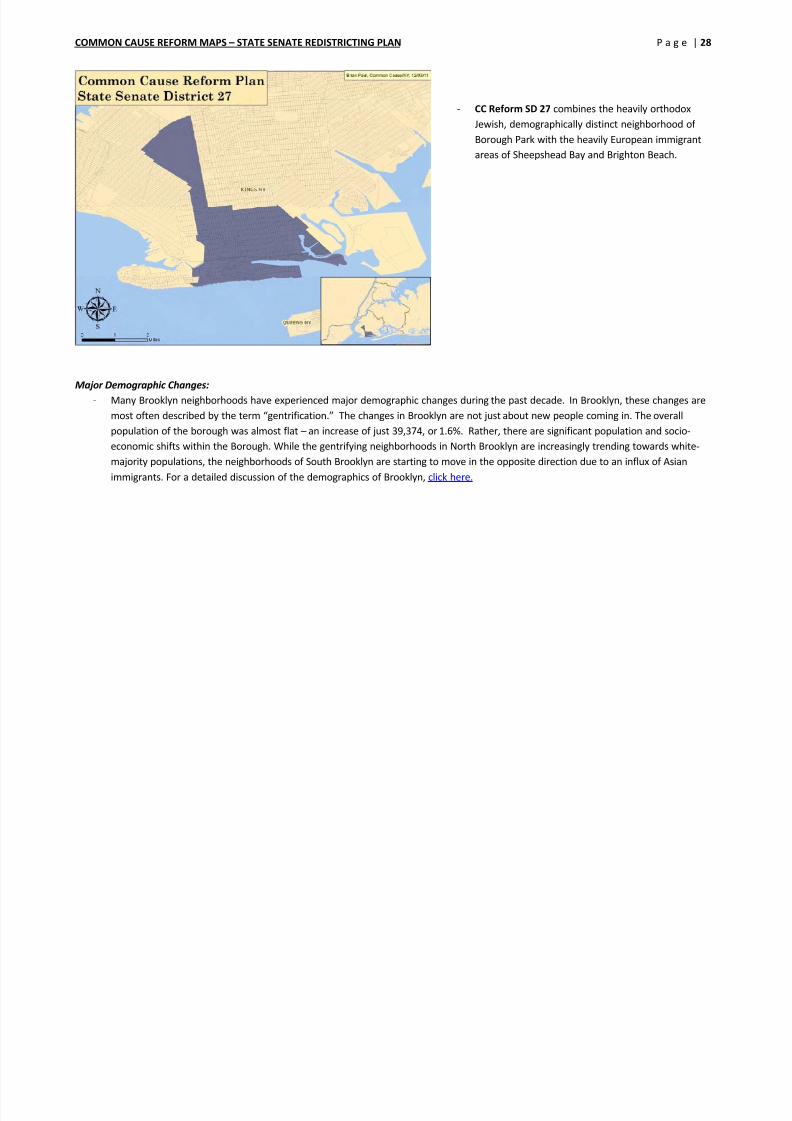
- CC Reform SD 23 crosses from Staten Island into the South
Brooklyn neighborhoods of Bay Ridge, Dyker Heights, and
Coney Island. The population of Staten Island is too large to
fit in a single State Senate district, but too small to be divided
in half, requiring a Staten-Island-Brooklyn district.
|

8/3/2019 Ccny Senate Guide -- Newsday Criteria Version -- With Maps
http://slidepdf.com/reader/full/ccny-senate-guide-newsday-criteria-version-with-maps 27/77
COMMON CAUSE REFORM MAPS – STATE SENATE REDISTRICTING PLAN P a g e | 27
- CC Reform SD 24 consists of the central and southern areasof Staten Island, which are demographically distinct from the
north shore and form a compact community of interest.
- CC Reform SD 25 includes all of the “Brownstone Brooklyn”
neighborhoods -- Brooklyn Heights, Cobble Hill, Carroll
Gardens, and Park Slope – within a single district alongside
most of Williamsburg-Greenpoint.
COMMON CAUSE REFORM MAPS STATE SENATE REDISTRICTING PLAN P | 28
8/3/2019 Ccny Senate Guide -- Newsday Criteria Version -- With Maps
http://slidepdf.com/reader/full/ccny-senate-guide-newsday-criteria-version-with-maps 28/77
COMMON CAUSE REFORM MAPS – STATE SENATE REDISTRICTING PLAN P a g e | 28
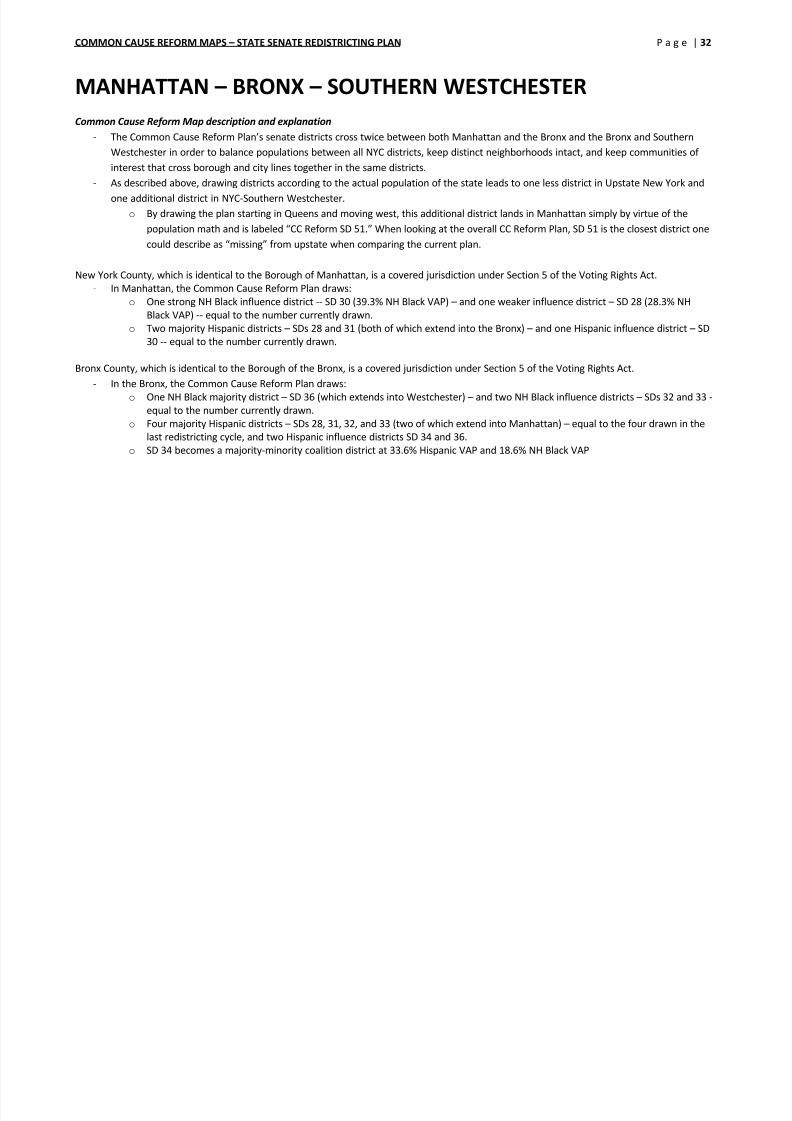
- CC Reform SD 27
combines the heavily orthodoxJewish, demographically distinct neighborhood of
Borough Park with the heavily European immigrant
areas of Sheepshead Bay and Brighton Beach.
Major Demographic Changes:
- Many Brooklyn neighborhoods have experienced major demographic changes during the past decade. In Brooklyn, these changes are
most often described by the term “gentrification.” The changes in Brooklyn are not just about new people coming in. The overall
population of the borough was almost flat – an increase of just 39,374, or 1.6%. Rather, there are significant population and socio-economic shifts within the Borough. While the gentrifying neighborhoods in North Brooklyn are increasingly trending towards white-
majority populations, the neighborhoods of South Brooklyn are starting to move in the opposite direction due to an influx of Asian
immigrants. For a detailed discussion of the demographics of Brooklyn, click here.
COMMON CAUSE REFORM MAPS STATE SENATE REDISTRICTING PLAN P a g e | 29

8/3/2019 Ccny Senate Guide -- Newsday Criteria Version -- With Maps
http://slidepdf.com/reader/full/ccny-senate-guide-newsday-criteria-version-with-maps 29/77
COMMON CAUSE REFORM MAPS – STATE SENATE REDISTRICTING PLAN P a g e | 29
DIST POP VAP NH White VAP NH Black VAP NH Asian VAP Hispanic VAP
17 310,320 224,000 26.5% 11.7% 6.1% 53.6%
18 310,192 232,324 12.5% 62.1% 3.2% 19.8%
19 310,328 230,193 19.0% 59.4% 4.3% 15.1%
20 310,539 239,453 22.9% 55.6% 5.4% 13.5%
21 310,516 234,589 28.0% 57.4% 4.7% 7.8%
22 310,602 241,614 35.3% 1.4% 37.5% 24.5%
23 310,630 238,353 50.1% 15.5% 11.1% 21.3%
24 310,515 243,504 80.6% 1.9% 7.1% 9.2%
25 310,014 261,576 56.2% 6.4% 18.7% 16.6%
27 310,278 231,204 74.0% 2.2% 13.5% 9.0%
- CC Reform SD 17 increases in Hispanic population to 53.7% Hispanic VAP (from 46.6% in current SD 17).
- CC Reform SD 22, containing the Sunset Park area entirely within a single district, unites minority communities that are currently cracked
and forms an Asian (37.4% Asian VAP) and Hispanic (24.5% Hispanic VAP) influence district.
Incumbent(s) no longer in current district:
- Marty Golden (22-R), Carl Kruger (27-D)
New districts with no incumbents within borders:
- CC Reform SD 22 (Sunset Park-Bensonhurst), CC Reform SD 27 (Borough Park, Gravesend, Sheepshead Bay, Brighton Beach)
Political Outlook: ( percentages represent an average of state senate and state assembly voting in 2010).
- Current SD 17 2010 Result: 90.9% StateLeg D, CC Reform SD 17 2010 Result: 88.0% StateLeg D
- Current SD 18 2010 Result: 95.7% StateLeg D, CC Reform SD 18 2010 Result: 96.8% StateLeg D
- Current SD 19 2010 Result: 93.7% StateLeg D, CC Reform SD 19 2010 Result: 88.3% StateLeg D
- Current SD 20 2010 Result: 92.0% StateLeg D, CC Reform SD 20 2010 Result: 91.7% StateLeg D
- Current SD 21 2010 Result: 87.6% StateLeg D, CC Reform SD 21 2010 Result: 85.1% StateLeg D
- Current SD 22 2010 Result: 52.7% StateLeg R, CC Reform SD 22 2010 Result: 66.6% StateLeg D
COMMON CAUSE REFORM MAPS – STATE SENATE REDISTRICTING PLAN P a g e | 30

8/3/2019 Ccny Senate Guide -- Newsday Criteria Version -- With Maps
http://slidepdf.com/reader/full/ccny-senate-guide-newsday-criteria-version-with-maps 30/77
COMMON CAUSE REFORM MAPS – STATE SENATE REDISTRICTING PLAN P a g e | 30
- Current SD 23 2010 Result: 89.7% StateLeg D, CC Reform SD 23 2010 Result: 71.8% StateLeg D
- Current SD 24 2010 Result: 75.4% StateLeg R, CC Reform SD 25 2010 Result: 75.8% StateLeg R
-
Current SD 25 2010 Result: 84.5% StateLeg D, CC Reform SD 25 2010 Result: 78.3% StateLeg D- Current SD 27 2010 Result: 70.5% StateLeg D, CC Reform SD 27 2010 Result: 64.6% StateLeg D
COMMON CAUSE REFORM MAPS – STATE SENATE REDISTRICTING PLAN P a g e | 31

8/3/2019 Ccny Senate Guide -- Newsday Criteria Version -- With Maps
http://slidepdf.com/reader/full/ccny-senate-guide-newsday-criteria-version-with-maps 31/77
COMMON CAUSE REFORM MAPS STATE SENATE REDISTRICTING PLAN P a g e | 31
COMMON CAUSE REFORM MAPS – STATE SENATE REDISTRICTING PLAN P a g e | 32
8/3/2019 Ccny Senate Guide -- Newsday Criteria Version -- With Maps
http://slidepdf.com/reader/full/ccny-senate-guide-newsday-criteria-version-with-maps 32/77
CO O C US O S S S S C G a g e | 3
MANHATTAN – BRONX – SOUTHERN WESTCHESTER
Common Cause Reform Map description and explanation
- The Common Cause Reform Plan’s senate districts cross twice between both Manhattan and the Bronx and the Bronx and Southern
Westchester in order to balance populations between all NYC districts, keep distinct neighborhoods intact, and keep communities of
interest that cross borough and city lines together in the same districts.
- As described above, drawing districts according to the actual population of the state leads to one less district in Upstate New York and
one additional district in NYC-Southern Westchester.
o By drawing the plan starting in Queens and moving west, this additional district lands in Manhattan simply by virtue of the
population math and is labeled “CC Reform SD 51.” When looking at the overall CC Reform Plan, SD 51 is the closest district one
could describe as “missing” from upstate when comparing the current plan.
New York County, which is identical to the Borough of Manhattan, is a covered jurisdiction under Section 5 of the Voting Rights Act.
- In Manhattan, the Common Cause Reform Plan draws:
o One strong NH Black influence district -- SD 30 (39.3% NH Black VAP) – and one weaker influence district – SD 28 (28.3% NH
Black VAP) -- equal to the number currently drawn.
o Two majority Hispanic districts – SDs 28 and 31 (both of which extend into the Bronx) – and one Hispanic influence district – SD30 -- equal to the number currently drawn.
Bronx County, which is identical to the Borough of the Bronx, is a covered jurisdiction under Section 5 of the Voting Rights Act.
- In the Bronx, the Common Cause Reform Plan draws:
o One NH Black majority district – SD 36 (which extends into Westchester) – and two NH Black influence districts – SDs 32 and 33 -
equal to the number currently drawn.
o Four majority Hispanic districts – SDs 28, 31, 32, and 33 (two of which extend into Manhattan) – equal to the four drawn in the
last redistricting cycle, and two Hispanic influence districts SD 34 and 36.o SD 34 becomes a majority-minority coalition district at 33.6% Hispanic VAP and 18.6% NH Black VAP
COMMON CAUSE REFORM MAPS – STATE SENATE REDISTRICTING PLAN P a g e | 33
8/3/2019 Ccny Senate Guide -- Newsday Criteria Version -- With Maps
http://slidepdf.com/reader/full/ccny-senate-guide-newsday-criteria-version-with-maps 33/77
g |
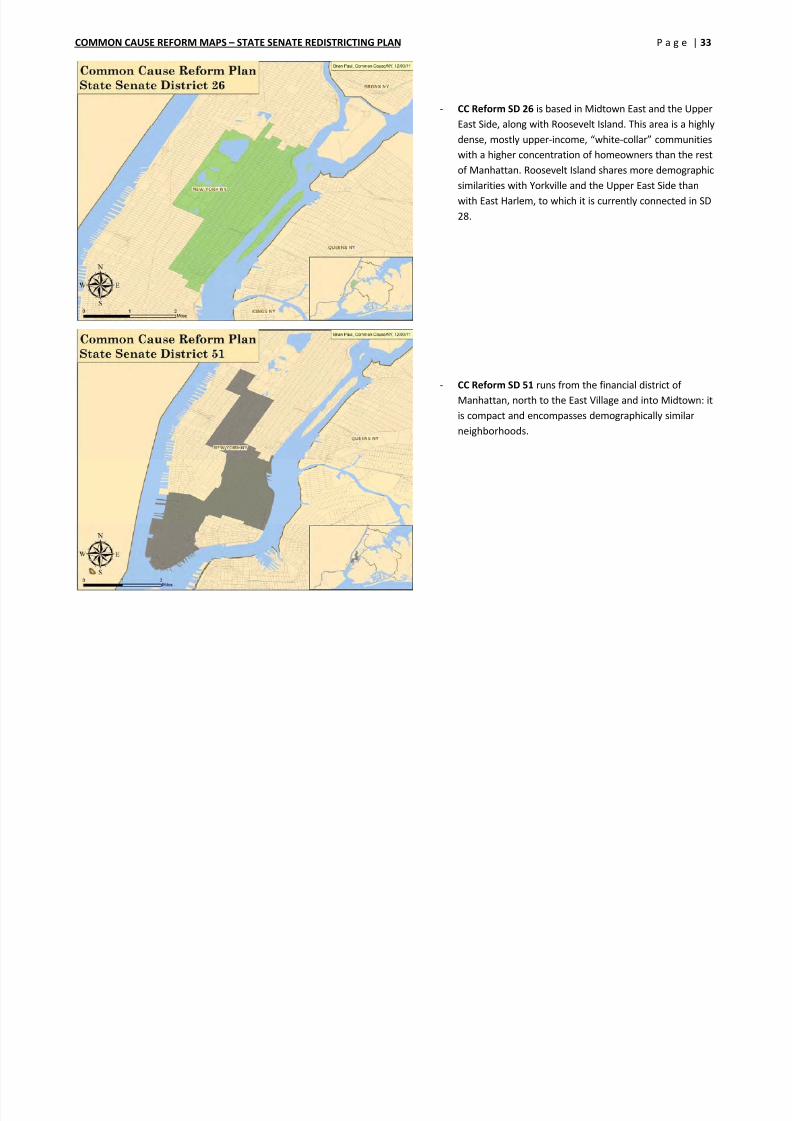
- CC Reform SD 26 is based in Midtown East and the Upper
East Side, along with Roosevelt Island. This area is a highly
dense, mostly upper-income, “white-collar” communities
with a higher concentration of homeowners than the rest
of Manhattan. Roosevelt Island shares more demographic
similarities with Yorkville and the Upper East Side than
with East Harlem, to which it is currently connected in SD
28.
- CC Reform SD 51 runs from the financial district of
Manhattan, north to the East Village and into Midtown: it
is compact and encompasses demographically similar
neighborhoods.
COMMON CAUSE REFORM MAPS – STATE SENATE REDISTRICTING PLAN P a g e | 34

8/3/2019 Ccny Senate Guide -- Newsday Criteria Version -- With Maps
http://slidepdf.com/reader/full/ccny-senate-guide-newsday-criteria-version-with-maps 34/77
- CC Reform SD 28 occupies East Harlem and the South Bronx
waterfront, placing the similar neighborhoods of Port Morris
and Hunts Point in the same district.
o CC Reform SD 28 is majority Hispanic VAP (63.5%) in
accordance with the Voting Rights Act.
- CC Reform SD 29 is based on Manhattan’s West Side, running
from Greenwich Village, through Chelsea and Hell’s Kitchen, to
the Upper West Side all the way to West 97th St. Manhattan’s
West Side and East Side have separate subway lines and very
different character, especially in Midtown where the MidtownWest and Hell’s Kitchen areas retain working class population
and some industrial businesses. The West Side also has the
highest concentration of same-sex couples in New York.
COMMON CAUSE REFORM MAPS – STATE SENATE REDISTRICTING PLAN P a g e | 35

8/3/2019 Ccny Senate Guide -- Newsday Criteria Version -- With Maps
http://slidepdf.com/reader/full/ccny-senate-guide-newsday-criteria-version-with-maps 35/77
- CC Reform SD 30 covers all of Central and West Harlem,
Morningside Heights, and the Upper West Side north of 97th
Street. Overall, this area is much more working class than the
areas to the south, with lower incomes, education, and
homeownership, and more blue-collar and service sector
workers than white collar workers in professions and
management.
o CC Reform SD 30 is plurality NH Black VAP (39.3%) in
accordance with the Voting Rights Act, with a strong
Hispanic influence (30.2% VAP).
- CC Reform SD 31 combines the entire neighborhoods of
Riverdale, Inwood, and Washington Heights and adds the
neighborhoods immediately across the Harlem River in the
West Bronx, Highbridge and Morris Heights The large
Dominican community of Northern Manhattan and the West
Bronx share numerous demographic indicators and represent
a community of interest. Community residents testified asLATFOR’s Bronx hearing in support of a district crossing
between Washington Heights and the Highbridge and Morris
Heights areas of the Bronx.
o CC Reform SD 31 is majority Hispanic VAP (59.0%) in
accordance with the Voting Rights Act.
COMMON CAUSE REFORM MAPS – STATE SENATE REDISTRICTING PLAN P a g e | 36
8/3/2019 Ccny Senate Guide -- Newsday Criteria Version -- With Maps
http://slidepdf.com/reader/full/ccny-senate-guide-newsday-criteria-version-with-maps 36/77
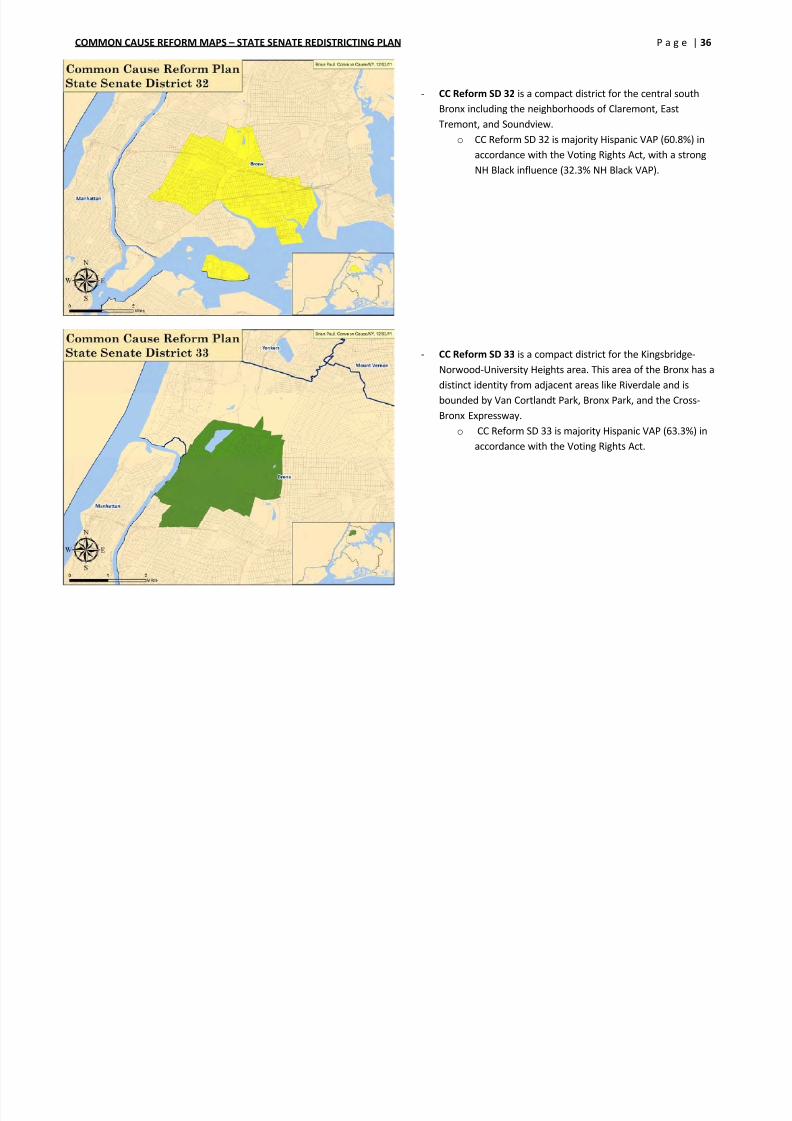
- CC Reform SD 32 is a compact district for the central south
Bronx including the neighborhoods of Claremont, East
Tremont, and Soundview.
o CC Reform SD 32 is majority Hispanic VAP (60.8%) in
accordance with the Voting Rights Act, with a strong
NH Black influence (32.3% NH Black VAP).
- CC Reform SD 33 is a compact district for the Kingsbridge-
Norwood-University Heights area. This area of the Bronx has a
distinct identity from adjacent areas like Riverdale and is
bounded by Van Cortlandt Park, Bronx Park, and the Cross-
Bronx Expressway.
o CC Reform SD 33 is majority Hispanic VAP (63.3%) in
accordance with the Voting Rights Act.
COMMON CAUSE REFORM MAPS – STATE SENATE REDISTRICTING PLAN P a g e | 37

8/3/2019 Ccny Senate Guide -- Newsday Criteria Version -- With Maps
http://slidepdf.com/reader/full/ccny-senate-guide-newsday-criteria-version-with-maps 37/77
- CC Reform SD 34 centers the district on the Long Island
Sound waterfront, stretching from Throgs Neck to New
Rochelle. The East Bronx is distinct from the rest of the
borough with lower population density and higher rates of
median income, homeownership, vehicular use, senior
citizens and a relatively lower population of children.
- As a diverse urban environment with a mix of working and
middle class residents, New Rochelle shares more in common
with the East Bronx than with the surrounding areas of
Westchester.
o CC Reform SD 34 is a majority-minority coalition
district at 33.6% Hispanic VAP and 18.6% NH Black
VAP
- CC Reform SD 36 forms a compact district in the Northeast
Bronx and Southern Westchester, following the demographic
patterns across the county line. The district includes the
entire City of Mt. Vernon, which then extends into the
southeast corner of Yonkers, an area with very similar socio-
economic demographic profile to Mount Vernon.
o CC Reform SD 31 is majority NH Black VAP (51.6%) in
accordance with the Voting Rights Act.
COMMON CAUSE REFORM MAPS – STATE SENATE REDISTRICTING PLAN P a g e | 38

8/3/2019 Ccny Senate Guide -- Newsday Criteria Version -- With Maps
http://slidepdf.com/reader/full/ccny-senate-guide-newsday-criteria-version-with-maps 38/77
CC Reform SD 35 is a Southern
Westchester Hudson River district
running from Yonkers north to
Ossining. The Hudson River side
of Westchester is generally more
middle-class than the more
affluent eastern Long Island
Sound side of Westchester, and
residents work and associate
more within the north-south
shape of this district rather than
east-west across Westchester.
- This district, and CC Reform SD 37, are included within the New York City grouping because they meet the borders of CC Reform SDs 36
and 34 within the boundaries of a city (Yonkers and New Rochelle) rather than at the border of a county or a town. The NY State
Constitution’s “block on border” rule mandates that these districts have equal population to the New York City districts.
- Yonkers and parts of Greenburgh and the river towns are highly diverse and CC Reform SD 35 has significant Hispanic (26.3% VAP) and
NH Black (14.2%) influence.
COMMON CAUSE REFORM MAPS – STATE SENATE REDISTRICTING PLAN P a g e | 39

8/3/2019 Ccny Senate Guide -- Newsday Criteria Version -- With Maps
http://slidepdf.com/reader/full/ccny-senate-guide-newsday-criteria-version-with-maps 39/77
CC Reform SD 37 is an
eastern Westchester district
including all the Long Island
Sound shore communities
north of New Rochelle as
well as the entire City of
White Plains. Also included in
this district is the inland
northeastern portion of
Westchester, which is much
more open and rural in
comparison to Southern
Westchester.
o Ideally it would be preferable to have one Senate district for all of Southern Westchester but the population math does not
permit it. Since the population math requires two districts be drawn, it is best to separate southern Westchester between east
and west.
COMMON CAUSE REFORM MAPS – STATE SENATE REDISTRICTING PLAN P a g e | 40
8/3/2019 Ccny Senate Guide -- Newsday Criteria Version -- With Maps
http://slidepdf.com/reader/full/ccny-senate-guide-newsday-criteria-version-with-maps 40/77
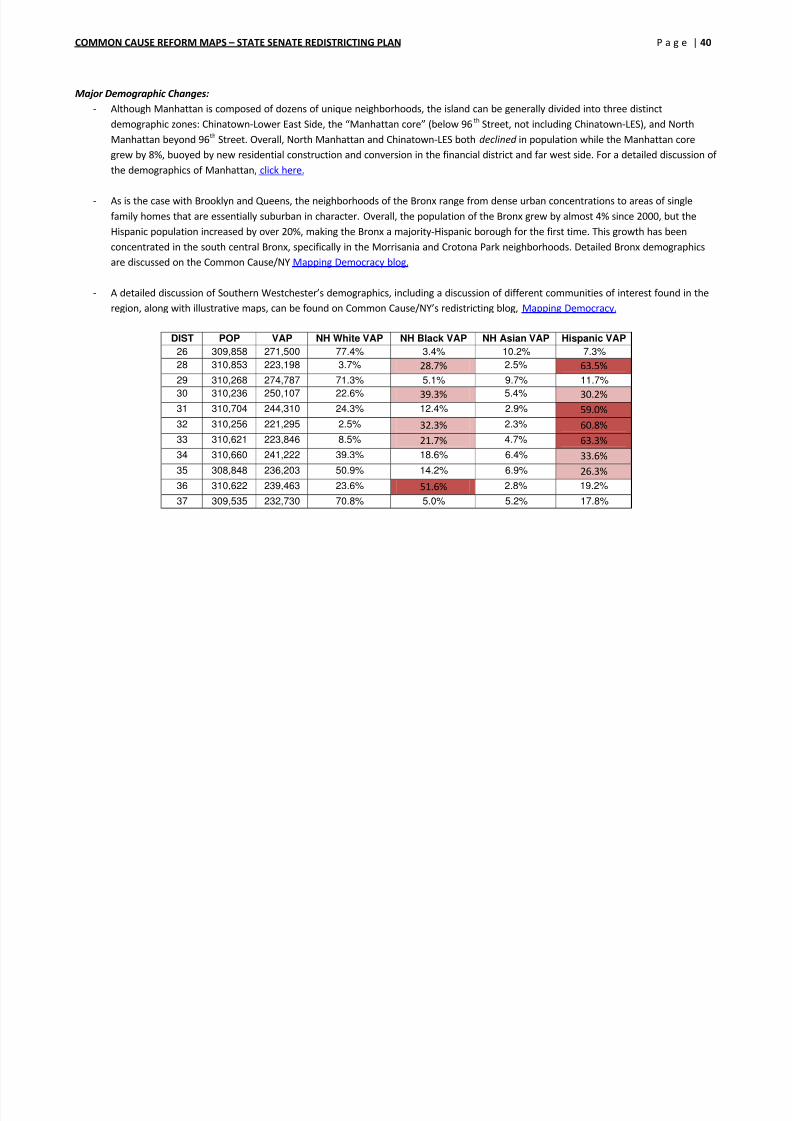
Major Demographic Changes:
- Although Manhattan is composed of dozens of unique neighborhoods, the island can be generally divided into three distinct
demographic zones: Chinatown-Lower East Side, the “Manhattan core” (below 96th Street, not including Chinatown-LES), and North
Manhattan beyond 96th Street. Overall, North Manhattan and Chinatown-LES both declined in population while the Manhattan core
grew by 8%, buoyed by new residential construction and conversion in the financial district and far west side. For a detailed discussion of
the demographics of Manhattan, click here.
- As is the case with Brooklyn and Queens, the neighborhoods of the Bronx range from dense urban concentrations to areas of single
family homes that are essentially suburban in character. Overall, the population of the Bronx grew by almost 4% since 2000, but the
Hispanic population increased by over 20%, making the Bronx a majority-Hispanic borough for the first time. This growth has been
concentrated in the south central Bronx, specifically in the Morrisania and Crotona Park neighborhoods. Detailed Bronx demographics
are discussed on the Common Cause/NY Mapping Democracy blog.
- A detailed discussion of Southern Westchester’s demographics, including a discussion of different communities of interest found in the
region, along with illustrative maps, can be found on Common Cause/NY’s redistricting blog, Mapping Democracy.
DIST POP VAP NH White VAP NH Black VAP NH Asian VAP Hispanic VAP
26 309,858 271,500 77.4% 3.4% 10.2% 7.3%
28 310,853 223,198 3.7% 28.7% 2.5% 63.5%
29 310,268 274,787 71.3% 5.1% 9.7% 11.7%
30 310,236 250,107 22.6% 39.3% 5.4% 30.2%
31 310,704 244,310 24.3% 12.4% 2.9% 59.0%
32 310,256 221,295 2.5% 32.3% 2.3% 60.8%
33 310,621 223,846 8.5% 21.7% 4.7% 63.3%
34 310,660 241,222 39.3% 18.6% 6.4% 33.6%
35 308,848 236,203 50.9% 14.2% 6.9% 26.3%
36 310,622 239,463 23.6% 51.6% 2.8% 19.2%
37 309,535 232,730 70.8% 5.0% 5.2% 17.8%
COMMON CAUSE REFORM MAPS – STATE SENATE REDISTRICTING PLAN P a g e | 41
8/3/2019 Ccny Senate Guide -- Newsday Criteria Version -- With Maps
http://slidepdf.com/reader/full/ccny-senate-guide-newsday-criteria-version-with-maps 41/77
Incumbent(s) no longer in current district:
- Ruben Diaz (32-D)
New districts with no incumbents within borders:
- CC Reform SD 51 (Financial District-Midtown), CC Reform SD 32 (Claremont-Soundview)
Political Outlook: ( percentages represent an average of state senate and state assembly voting in 2010).
- Current SD 26 2010 Result: 71.5% StateLeg D, CC Reform SD 26 2010 Result: 71.8% StateLeg D
- Current SD 51 2010 Result: 87.0% StateLeg R, CC Reform SD 51 2010 Result: 84.2% StateLeg D
- Current SD 28 2010 Result: 92.2% StateLeg D, CC Reform SD 28 2010 Result: 95.2% StateLeg D
- Current SD 29 2010 Result: 87.5% StateLeg D, CC Reform SD 29 2010 Result: 89.7% StateLeg D
- Current SD 30 2010 Result: 95.7% StateLeg D, CC Reform SD 30 2010 Result: 95.9% StateLeg D
- Current SD 31 2010 Result: 89.1% StateLeg D, CC Reform SD 31 2010 Result: 87.1% StateLeg D
- Current SD 32 2010 Result: 90.8% StateLeg D, CC Reform SD 32 2010 Result: 93.3% StateLeg D
- Current SD 33 2010 Result: 94.8% StateLeg D, CC Reform SD 33 2010 Result: 94.8% StateLeg D
- Current SD 34 2010 Result: 63.6% StateLeg D, CC Reform SD 34 2010 Result: 70.7% StateLegD
- Current SD 35 2010 Result: 58.7% StateLeg D, CC Reform SD 35 2010 Result: 60.5% StateLegD
- Current SD 36 2010 Result: 96.4% StateLeg D, CC Reform SD 36 2010 Result: 82.9% StateLegD
- Current SD 37 2010 Result: 56.7% StateLeg D, CC Reform SD 37 2010 Result: 51.3% StateLegD
COMMON CAUSE REFORM MAPS – STATE SENATE REDISTRICTING PLAN P a g e | 42

8/3/2019 Ccny Senate Guide -- Newsday Criteria Version -- With Maps
http://slidepdf.com/reader/full/ccny-senate-guide-newsday-criteria-version-with-maps 42/77
COMMON CAUSE REFORM MAPS – STATE SENATE REDISTRICTING PLAN P a g e | 43
8/3/2019 Ccny Senate Guide -- Newsday Criteria Version -- With Maps
http://slidepdf.com/reader/full/ccny-senate-guide-newsday-criteria-version-with-maps 43/77
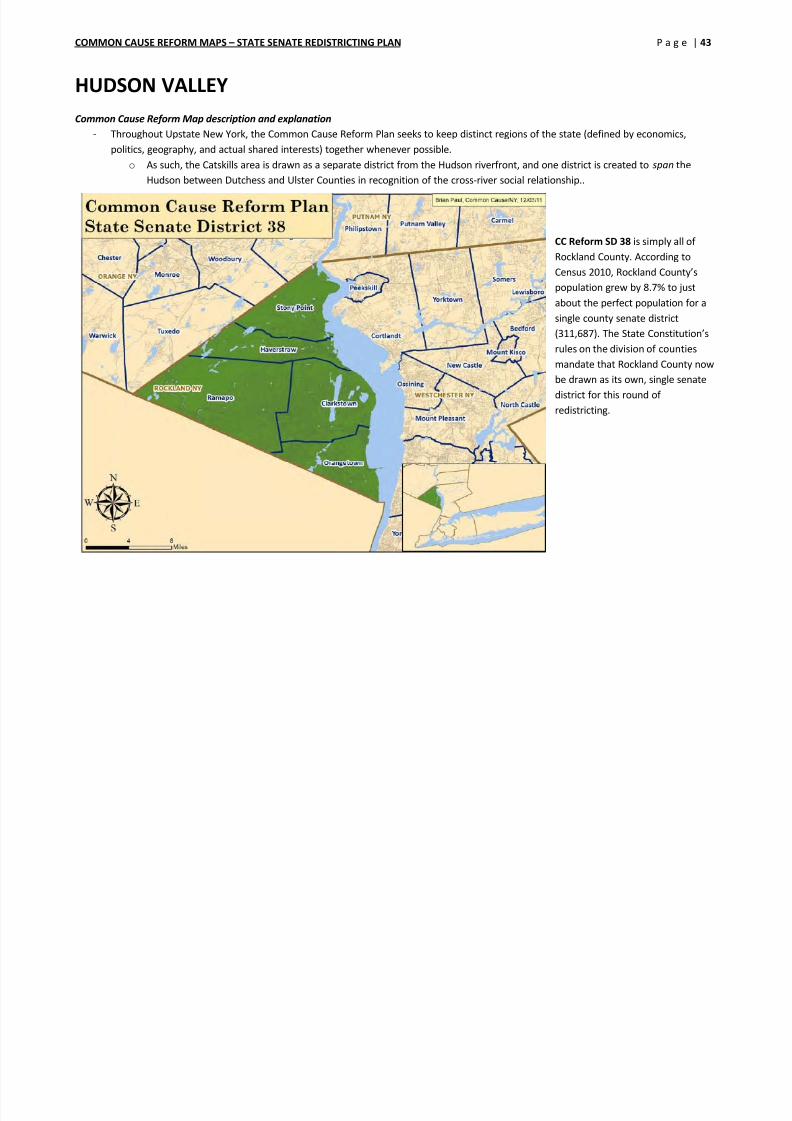
HUDSON VALLEY
Common Cause Reform Map description and explanation
- Throughout Upstate New York, the Common Cause Reform Plan seeks to keep distinct regions of the state (defined by economics,
politics, geography, and actual shared interests) together whenever possible.
o As such, the Catskills area is drawn as a separate district from the Hudson riverfront, and one district is created to span the
Hudson between Dutchess and Ulster Counties in recognition of the cross-river social relationship..
CC Reform SD 38 is simply all of
Rockland County. According to
Census 2010, Rockland County’s
population grew by 8.7% to just
about the perfect population for a
single county senate district
(311,687). The State Constitution’s
rules on the division of counties
mandate that Rockland County now
be drawn as its own, single senate
district for this round of
redistricting.
COMMON CAUSE REFORM MAPS – STATE SENATE REDISTRICTING PLAN P a g e | 44
8/3/2019 Ccny Senate Guide -- Newsday Criteria Version -- With Maps
http://slidepdf.com/reader/full/ccny-senate-guide-newsday-criteria-version-with-maps 44/77
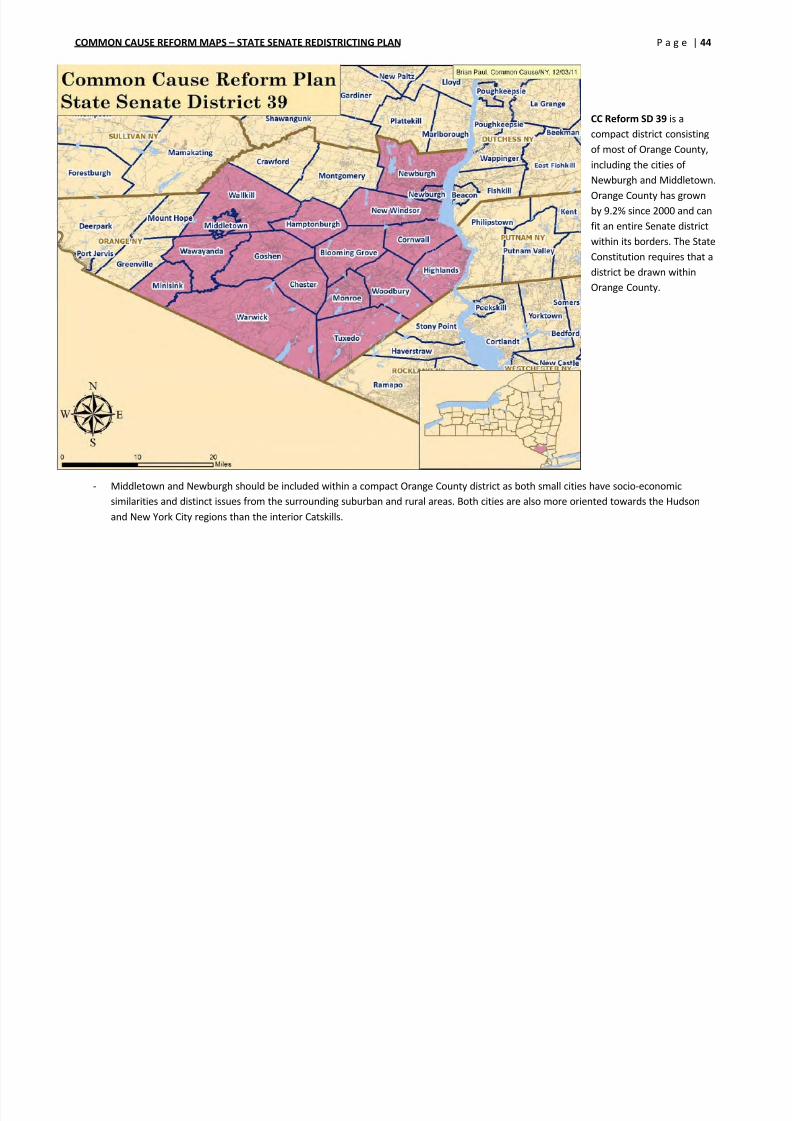
CC Reform SD 39 is acompact district consisting
of most of Orange County,
including the cities of
Newburgh and Middletown.
Orange County has grown
by 9.2% since 2000 and can
fit an entire Senate districtwithin its borders. The State
Constitution requires that a
district be drawn within
Orange County.
- Middletown and Newburgh should be included within a compact Orange County district as both small cities have socio-economic
similarities and distinct issues from the surrounding suburban and rural areas. Both cities are also more oriented towards the Hudson
and New York City regions than the interior Catskills.
COMMON CAUSE REFORM MAPS – STATE SENATE REDISTRICTING PLAN P a g e | 45
8/3/2019 Ccny Senate Guide -- Newsday Criteria Version -- With Maps
http://slidepdf.com/reader/full/ccny-senate-guide-newsday-criteria-version-with-maps 45/77
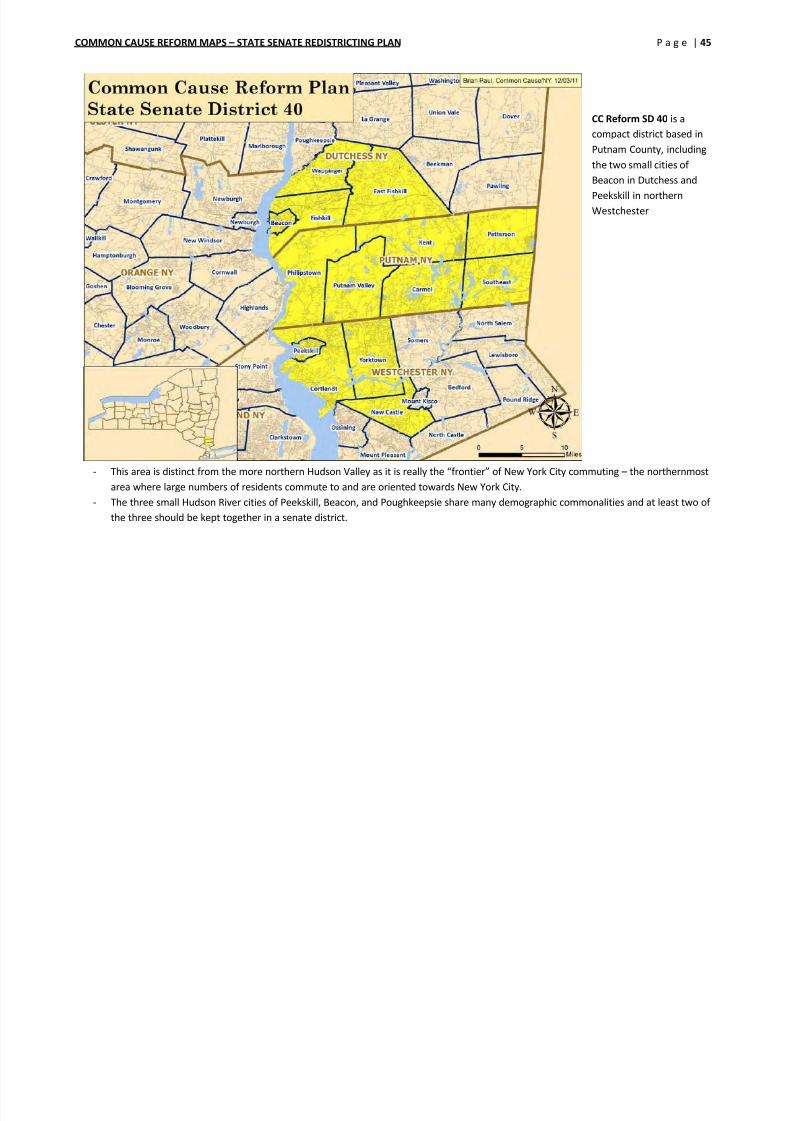
CC Reform SD 40 is acompact district based in
Putnam County, including
the two small cities of
Beacon in Dutchess and
Peekskill in northern
Westchester
- This area is distinct from the more northern Hudson Valley as it is really the “frontier” of New York City commuting – the northernmost
area where large numbers of residents commute to and are oriented towards New York City.
- The three small Hudson River cities of Peekskill, Beacon, and Poughkeepsie share many demographic commonalities and at least two of
the three should be kept together in a senate district.
COMMON CAUSE REFORM MAPS – STATE SENATE REDISTRICTING PLAN P a g e | 46

8/3/2019 Ccny Senate Guide -- Newsday Criteria Version -- With Maps
http://slidepdf.com/reader/full/ccny-senate-guide-newsday-criteria-version-with-maps 46/77
CC Reform SD 41 is a
compact Mid-
Hudson district
including the Hudson
waterfronts of
Dutchess and
Columbia County.
The social life and
economic activity of
this area is largely
oriented east-west
amongst cities and
towns like
Poughkeepsie, New
Paltz, Kingston and
Rhinebeck rather
than north-south.
COMMON CAUSE REFORM MAPS – STATE SENATE REDISTRICTING PLAN P a g e | 47
8/3/2019 Ccny Senate Guide -- Newsday Criteria Version -- With Maps
http://slidepdf.com/reader/full/ccny-senate-guide-newsday-criteria-version-with-maps 47/77
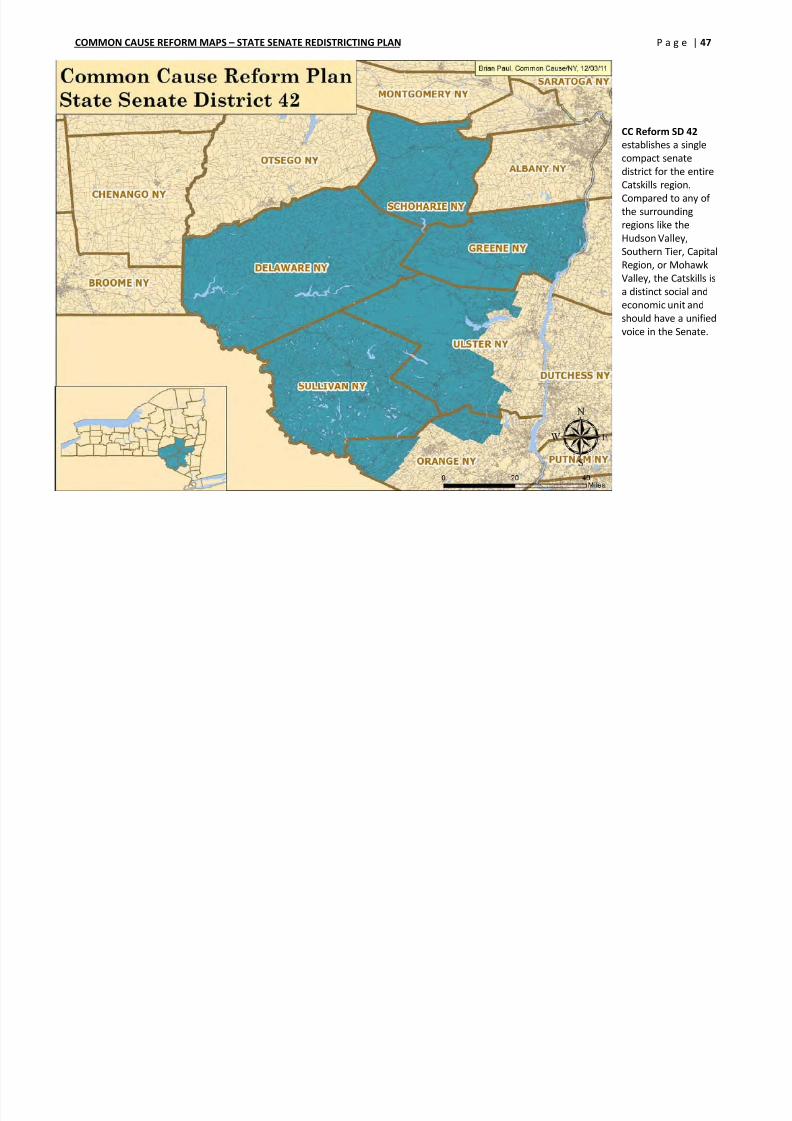
CC Reform SD 42
establishes a single
compact senate
district for the entire
Catskills region.
Compared to any of
the surrounding
regions like theHudson Valley,
Southern Tier, Capital
Region, or Mohawk
Valley, the Catskills is
a distinct social and
economic unit and
should have a unified
voice in the Senate.
COMMON CAUSE REFORM MAPS – STATE SENATE REDISTRICTING PLAN P a g e | 48
8/3/2019 Ccny Senate Guide -- Newsday Criteria Version -- With Maps
http://slidepdf.com/reader/full/ccny-senate-guide-newsday-criteria-version-with-maps 48/77
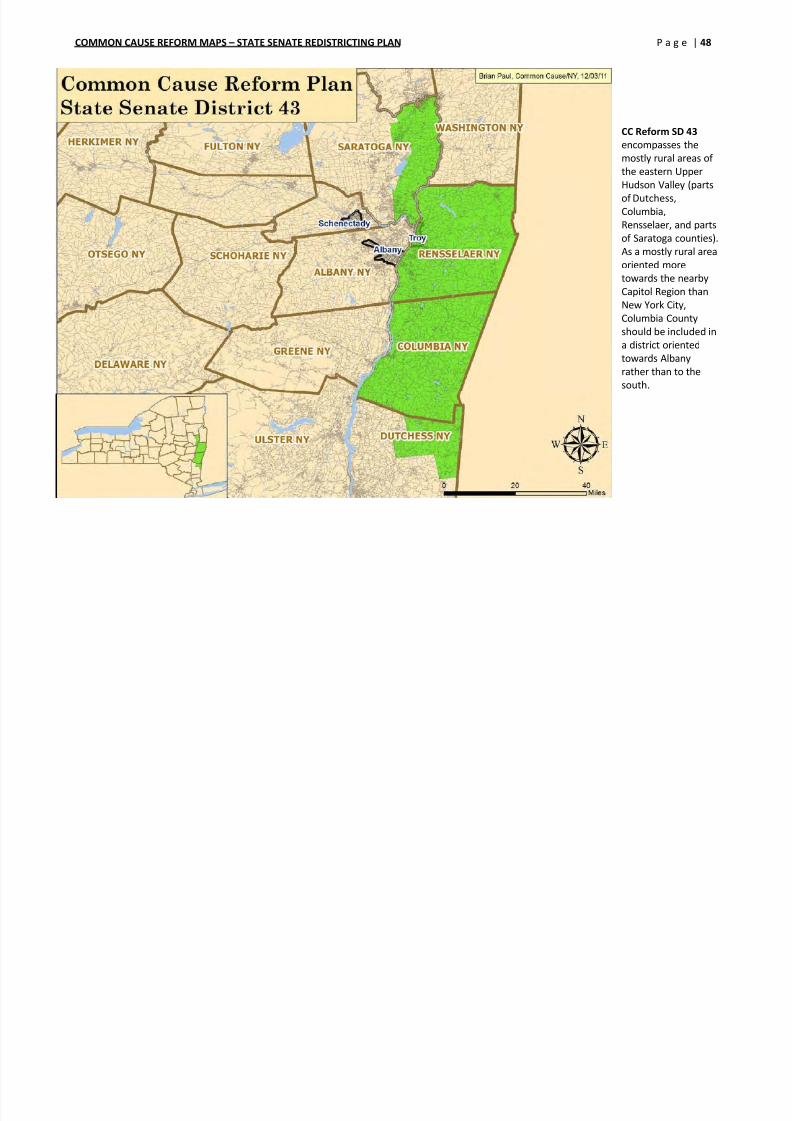
CC Reform SD 43
encompasses the
mostly rural areas of
the eastern Upper
Hudson Valley (parts
of Dutchess,
Columbia,
Rensselaer, and partsof Saratoga counties).
As a mostly rural area
oriented more
towards the nearby
Capitol Region than
New York City,
Columbia County
should be included ina district oriented
towards Albany
rather than to the
south.
COMMON CAUSE REFORM MAPS – STATE SENATE REDISTRICTING PLAN P a g e | 49
8/3/2019 Ccny Senate Guide -- Newsday Criteria Version -- With Maps
http://slidepdf.com/reader/full/ccny-senate-guide-newsday-criteria-version-with-maps 49/77
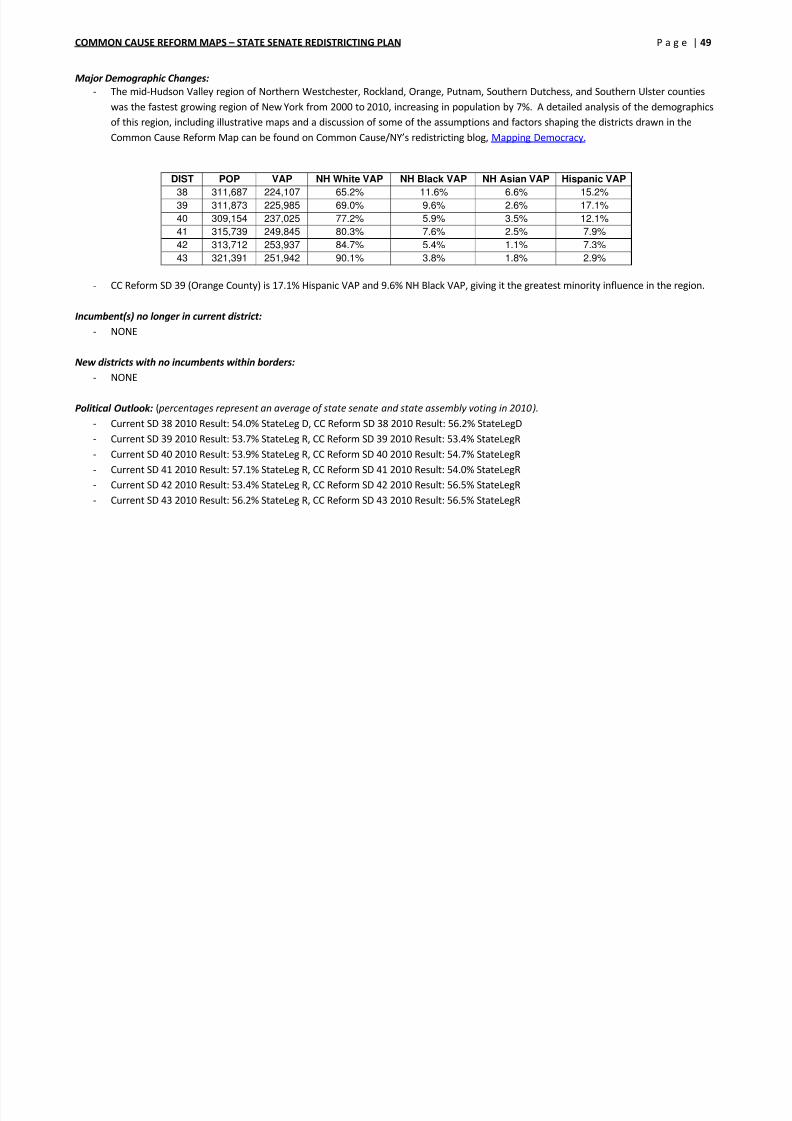
Major Demographic Changes:
- The mid-Hudson Valley region of Northern Westchester, Rockland, Orange, Putnam, Southern Dutchess, and Southern Ulster counties
was the fastest growing region of New York from 2000 to 2010, increasing in population by 7%. A detailed analysis of the demographics
of this region, including illustrative maps and a discussion of some of the assumptions and factors shaping the districts drawn in the
Common Cause Reform Map can be found on Common Cause/NY’s redistricting blog, Mapping Democracy.
DIST POP VAP NH White VAP NH Black VAP NH Asian VAP Hispanic VAP
38 311,687 224,107 65.2% 11.6% 6.6% 15.2%
39 311,873 225,985 69.0% 9.6% 2.6% 17.1%
40 309,154 237,025 77.2% 5.9% 3.5% 12.1%
41 315,739 249,845 80.3% 7.6% 2.5% 7.9%
42 313,712 253,937 84.7% 5.4% 1.1% 7.3%
43 321,391 251,942 90.1% 3.8% 1.8% 2.9%
- CC Reform SD 39 (Orange County) is 17.1% Hispanic VAP and 9.6% NH Black VAP, giving it the greatest minority influence in the region.
Incumbent(s) no longer in current district:
- NONE
New districts with no incumbents within borders:
- NONE
Political Outlook: ( percentages represent an average of state senate and state assembly voting in 2010).
- Current SD 38 2010 Result: 54.0% StateLeg D, CC Reform SD 38 2010 Result: 56.2% StateLegD
- Current SD 39 2010 Result: 53.7% StateLeg R, CC Reform SD 39 2010 Result: 53.4% StateLegR- Current SD 40 2010 Result: 53.9% StateLeg R, CC Reform SD 40 2010 Result: 54.7% StateLegR
- Current SD 41 2010 Result: 57.1% StateLeg R, CC Reform SD 41 2010 Result: 54.0% StateLegR
- Current SD 42 2010 Result: 53.4% StateLeg R, CC Reform SD 42 2010 Result: 56.5% StateLegR
- Current SD 43 2010 Result: 56.2% StateLeg R, CC Reform SD 43 2010 Result: 56.5% StateLegR
COMMON CAUSE REFORM MAPS – STATE SENATE REDISTRICTING PLAN P a g e | 50

8/3/2019 Ccny Senate Guide -- Newsday Criteria Version -- With Maps
http://slidepdf.com/reader/full/ccny-senate-guide-newsday-criteria-version-with-maps 50/77
COMMON CAUSE REFORM MAPS – STATE SENATE REDISTRICTING PLAN P a g e | 51
8/3/2019 Ccny Senate Guide -- Newsday Criteria Version -- With Maps
http://slidepdf.com/reader/full/ccny-senate-guide-newsday-criteria-version-with-maps 51/77
CAPITOL REGION
Common Cause Reform Map description and explanation
- In the Capitol Region, the three cities of Albany, Troy, and Schenectady share many demographic commonalities compared to the
surrounding region. In addition to having a higher concentration of minority residents, Albany, Troy, and Schenectady are characterized
by lower income, blue collar workers, who rent and take public transportation. Drawing districts based on communities of interest
suggests that at least two of the three cities be included within the same district.
o Unfortunately the particular geography and demography of the Capitol Region counties makes it impossible to do so withoutegregiously breaking the State Constitutional rule against unnecessarily dividing counties.
With a population of 304,202, Albany County is within -3% of the average State Senate District population of 312,550
and must be drawn as a single senate district. So Albany cannot be combined with either of the other cities.
Troy and Schenectady cannot be combined because the populations of Rensselaer and Schenectady Counties are too
large to combine while also passing through southern Saratoga County.
o Rensselaer County and Troy are included in SD 43 (Upper Hudson East), a district that is a mix of Albany suburbs, Hudson Rivertowns, and rural areas.
COMMON CAUSE REFORM MAPS – STATE SENATE REDISTRICTING PLAN P a g e | 52

8/3/2019 Ccny Senate Guide -- Newsday Criteria Version -- With Maps
http://slidepdf.com/reader/full/ccny-senate-guide-newsday-criteria-version-with-maps 52/77
CC Reform SD 44 is
based in Schenectady
and includes Saratoga
Springs and some
Saratoga County
suburbs as well as
Fulton County along
the Mohawk River to
the west. This is the
most compact, Capitol
Region oriented district
that can be created
around Schenectady
while avoiding
unnecessary division of
counties. Schenectady,
Saratoga Springs, and
the small city of
Amsterdam in Fulton
County share many
demographics
associated with
urbanity.
COMMON CAUSE REFORM MAPS – STATE SENATE REDISTRICTING PLAN P a g e | 53
8/3/2019 Ccny Senate Guide -- Newsday Criteria Version -- With Maps
http://slidepdf.com/reader/full/ccny-senate-guide-newsday-criteria-version-with-maps 53/77
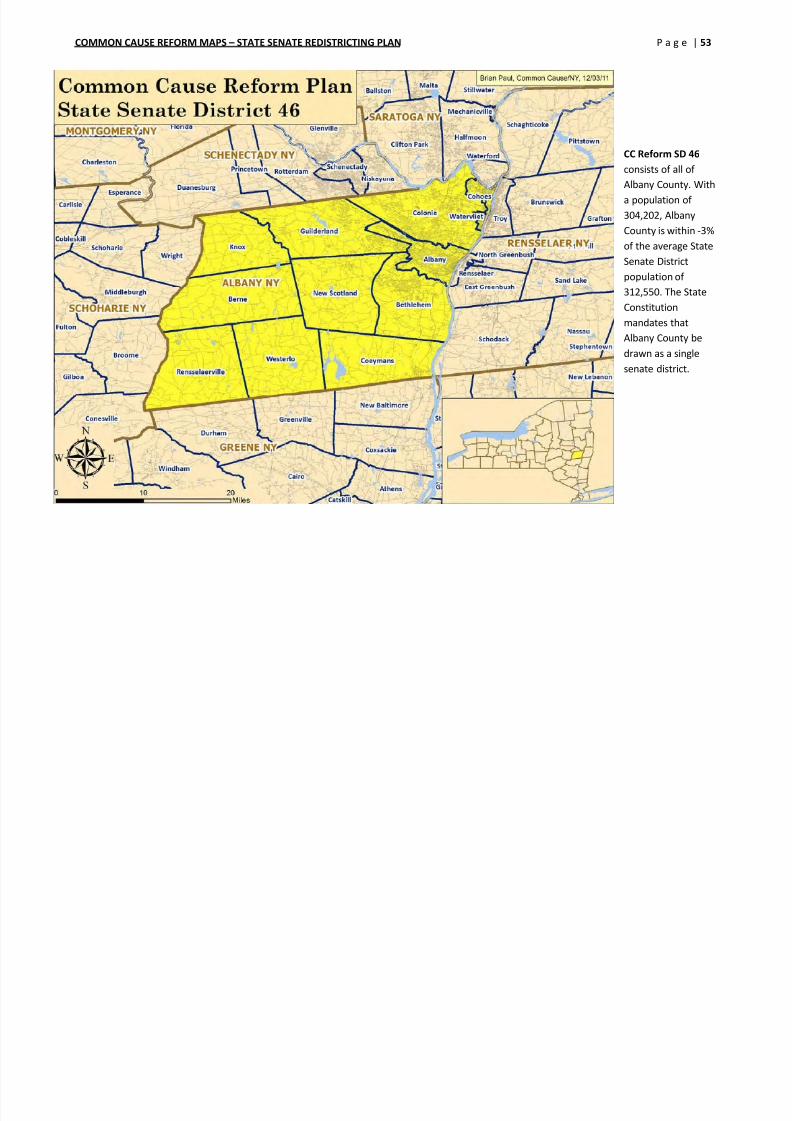
CC Reform SD 46
consists of all of
Albany County. With
a population of
304,202, Albany
County is within -3%
of the average State
Senate District
population of
312,550. The State
Constitution
mandates that
Albany County be
drawn as a single
senate district.
COMMON CAUSE REFORM MAPS – STATE SENATE REDISTRICTING PLAN P a g e | 54
Major Demographic Changes:
8/3/2019 Ccny Senate Guide -- Newsday Criteria Version -- With Maps
http://slidepdf.com/reader/full/ccny-senate-guide-newsday-criteria-version-with-maps 54/77
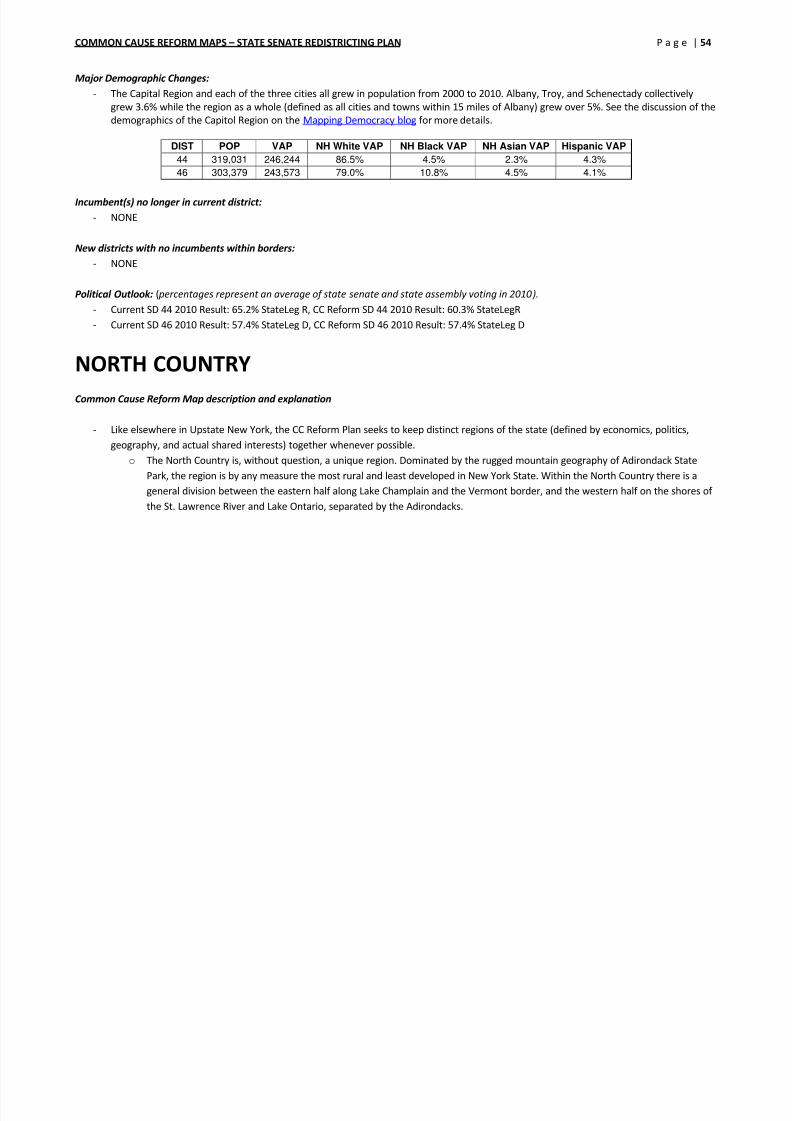
Major Demographic Changes:
- The Capital Region and each of the three cities all grew in population from 2000 to 2010. Albany, Troy, and Schenectady collectively
grew 3.6% while the region as a whole (defined as all cities and towns within 15 miles of Albany) grew over 5%. See the discussion of the
demographics of the Capitol Region on the Mapping Democracy blog for more details.
DIST POP VAP NH White VAP NH Black VAP NH Asian VAP Hispanic VAP
44 319,031 246,244 86.5% 4.5% 2.3% 4.3%
46 303,379 243,573 79.0% 10.8% 4.5% 4.1%
Incumbent(s) no longer in current district:
- NONE
New districts with no incumbents within borders:
- NONE
Political Outlook: ( percentages represent an average of state senate and state assembly voting in 2010).
- Current SD 44 2010 Result: 65.2% StateLeg R, CC Reform SD 44 2010 Result: 60.3% StateLegR
- Current SD 46 2010 Result: 57.4% StateLeg D, CC Reform SD 46 2010 Result: 57.4% StateLeg D
NORTH COUNTRY
Common Cause Reform Map description and explanation
- Like elsewhere in Upstate New York, the CC Reform Plan seeks to keep distinct regions of the state (defined by economics, politics,
geography, and actual shared interests) together whenever possible.
o The North Country is, without question, a unique region. Dominated by the rugged mountain geography of Adirondack State
Park, the region is by any measure the most rural and least developed in New York State. Within the North Country there is a
general division between the eastern half along Lake Champlain and the Vermont border, and the western half on the shores of
the St. Lawrence River and Lake Ontario, separated by the Adirondacks.
COMMON CAUSE REFORM MAPS – STATE SENATE REDISTRICTING PLAN P a g e | 55

8/3/2019 Ccny Senate Guide -- Newsday Criteria Version -- With Maps
http://slidepdf.com/reader/full/ccny-senate-guide-newsday-criteria-version-with-maps 55/77
CC Reform SD 45 is a
North Country East
district covering
Clinton, Franklin,
Essex, Hamilton,
Warren, Washington,
and the northern
portion of Saratoga
counties.
- This part of the North Country is home to numerous large state prison facilities. Although this area will lose 11,610 prisoners who must
be reallocated to their residence of origin by law, the loss is less significant as a result of the population growth in the Plattsburg and
Glens Falls areas.
COMMON CAUSE REFORM MAPS – STATE SENATE REDISTRICTING PLAN P a g e | 56
8/3/2019 Ccny Senate Guide -- Newsday Criteria Version -- With Maps
http://slidepdf.com/reader/full/ccny-senate-guide-newsday-criteria-version-with-maps 56/77
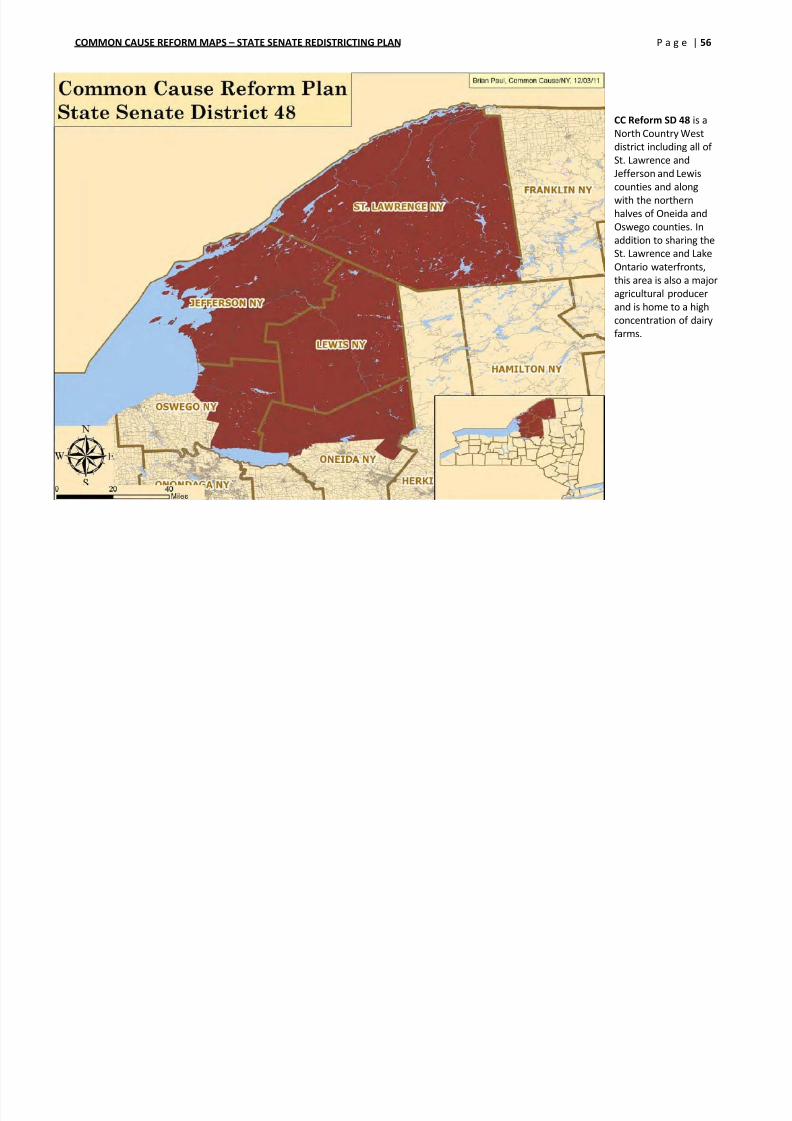
CC Reform SD 48 is aNorth Country West
district including all of
St. Lawrence and
Jefferson and Lewis
counties and along
with the northern
halves of Oneida and
Oswego counties. Inaddition to sharing the
St. Lawrence and Lake
Ontario waterfronts,
this area is also a major
agricultural producer
and is home to a high
concentration of dairy
farms.
COMMON CAUSE REFORM MAPS – STATE SENATE REDISTRICTING PLAN P a g e | 57
Major Demographic Changes:
8/3/2019 Ccny Senate Guide -- Newsday Criteria Version -- With Maps
http://slidepdf.com/reader/full/ccny-senate-guide-newsday-criteria-version-with-maps 57/77
- The North County experienced a population increase from 482,867 in 2000 to 491,962 in 2010, which mostly compensates for the loss of
prisoners. We agree with Assemblymember Ken Blankenbush (R), who represents District 122 in the western portion of the North
Country, who argued at LATFOR hearings that the North Country region is a very distinct community with different interests and
priorities than the regions to the south. A detailed discussion of demography of the North Country can befound here.
DIST POP VAP NH White VAP NH Black VAP NH Asian VAP Hispanic VAP
45 315,175 260,808 91.7% 3.3% 0.6% 2.3%
48 317,144 245,405 92.4% 2.6% 0.9% 2.5%
Incumbent(s) no longer in current district:- NONE
New districts with no incumbents within borders:
- NONE
Political Outlook: ( percentages represent an average of state senate and state assembly voting in 2010).
- Current SD 45 2010 Result: 93.4% StateLeg R, CC Reform SD 45 2010 Result: 91.8% StateLeg R- Current SD 48 2010 Result: 61.2% StateLeg R, CC Reform SD 48 2010 Result: 59.6% StateLeg R
MOHAWK VALLEY
Common Cause Reform Map description and explanation
- The Mohawk Valley region of New York lies between the Albany region and Syracuse area along the Mohawk River and Erie Canal and ishome to numerous small towns and cities with a shared industrial heritage (including Amsterdam, Gloversville, Johnstown, Little Falls,
Herkimer, Utica, and Rome). The region is also closely connected by the New York State Thruway.
o Fulton County is included in CC Reform SD 44 alongside fellow Mohawk River county Schenectady.
COMMON CAUSE REFORM MAPS – STATE SENATE REDISTRICTING PLAN P a g e | 58
8/3/2019 Ccny Senate Guide -- Newsday Criteria Version -- With Maps
http://slidepdf.com/reader/full/ccny-senate-guide-newsday-criteria-version-with-maps 58/77
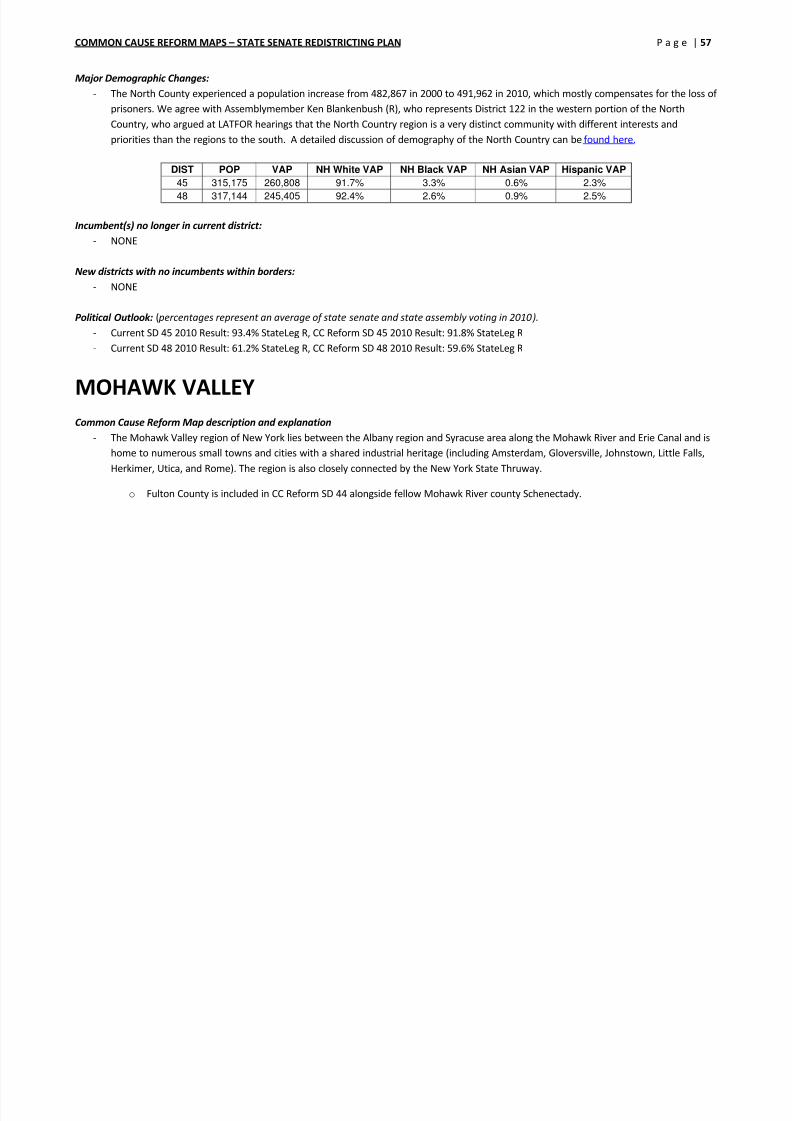
CC Reform SD 47 coversthe rest of the Mohawk
Valley – the counties of
Fulton, Herkimer, and the
southern area of Oneida
County which includes the
cities of Utica and Rome.
- The district extends into the North Country to follow the “top hat” shaped border of Herkimer County in order to keep the county wholly
within a single district. The northern “top hat” area of Herkimer is home to less than 3,000 residents.
COMMON CAUSE REFORM MAPS – STATE SENATE REDISTRICTING PLAN P a g e | 59
Major Demographic Changes:

8/3/2019 Ccny Senate Guide -- Newsday Criteria Version -- With Maps
http://slidepdf.com/reader/full/ccny-senate-guide-newsday-criteria-version-with-maps 59/77
- Overall the population of the Mohawk Valley region was nearly flat from 2000 to 2010.
DIST POP VAP NH White VAP NH Black VAP NH Asian VAP Hispanic VAP47 312,665 248,160 89.2% 4.5% 1.9% 3.2%
Incumbent(s) no longer in current district:
- NONE
New districts with no incumbents within borders:
- NONE
Political Outlook: ( percentages represent an average of state senate and state assembly voting in 2010).
- Current SD 47 2010 Result: 63.6% StateLeg R, CC Reform SD 45 2010 Result: 72.0% StateLeg R
COMMON CAUSE REFORM MAPS – STATE SENATE REDISTRICTING PLAN P a g e | 60
SYRACUSE AND CENTRAL NEW YORK

8/3/2019 Ccny Senate Guide -- Newsday Criteria Version -- With Maps
http://slidepdf.com/reader/full/ccny-senate-guide-newsday-criteria-version-with-maps 60/77
SYRACUSE AND CENTRAL NEW YORK
CC Reform SD 49 is a
compact regional district
within rural central New
York (Otsego, Chenango,
Cortland, Madison, andparts of Onondaga and
Tompkins Counties). This
is an overwhelmingly
rural district save for a
small part of the
Syracuse suburbs, and a
few small towns andcities like Oneonta,
Norwich, and Cortland,
and is one of the most
productive agricultural
regions of the state.
COMMON CAUSE REFORM MAPS – STATE SENATE REDISTRICTING PLAN P a g e | 61
8/3/2019 Ccny Senate Guide -- Newsday Criteria Version -- With Maps
http://slidepdf.com/reader/full/ccny-senate-guide-newsday-criteria-version-with-maps 61/77
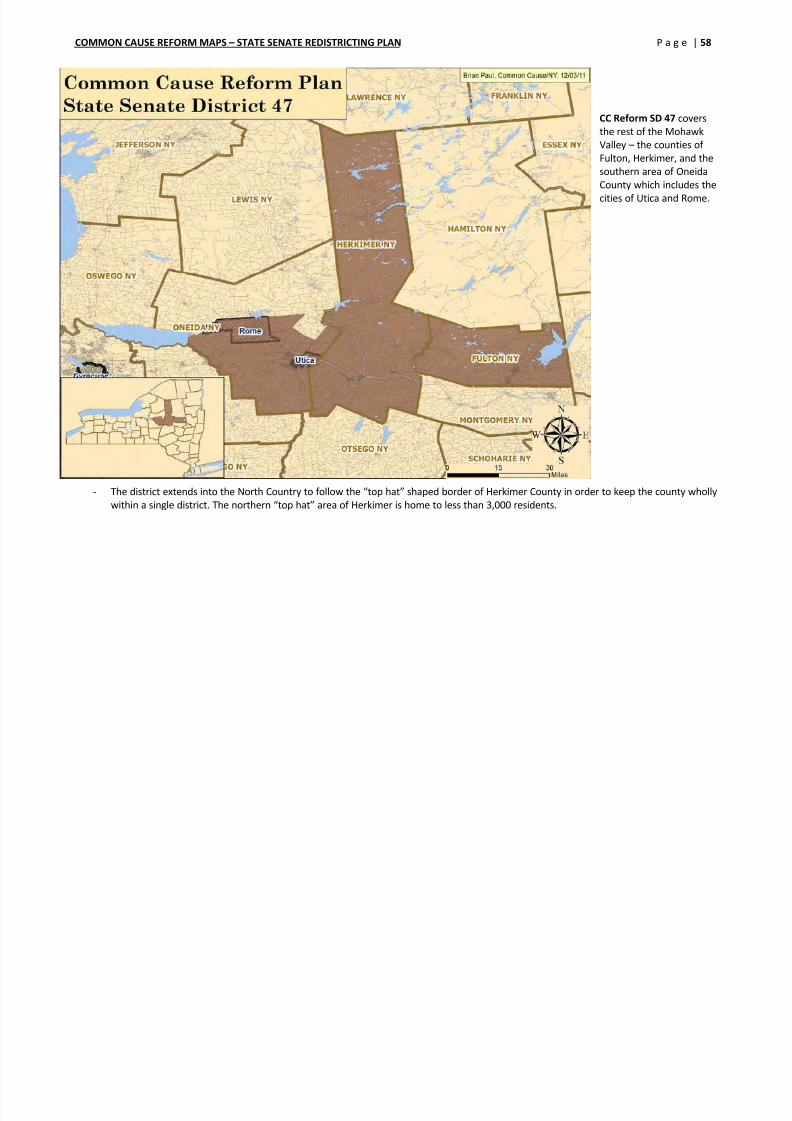
CC Reform SD 50 keeps the
whole City of Syracuse(2010 population: 145,170)
within a single senate
district alongside four
surrounding suburban
towns. There’s no rational,
non-partisan reason to
divide the city between
two SDs. Communities
within the City of Syracuse
are more racially diverse,
less wealthy, have more
children, and have much
lower rates of
homeownership than
communities in
surrounding areas, and
constitute a distinct
community of interest that
should be kept together in
a single district.
- The towns of Geddes, Salina, and DeWitt are included with Syracuse because they are the immediately adjacent and the densest of the
city’s surrounding suburbs. Clay and Cicero are included over Manlius and Camillus simply because of population math.
COMMON CAUSE REFORM MAPS – STATE SENATE REDISTRICTING PLAN P a g e | 62
8/3/2019 Ccny Senate Guide -- Newsday Criteria Version -- With Maps
http://slidepdf.com/reader/full/ccny-senate-guide-newsday-criteria-version-with-maps 62/77
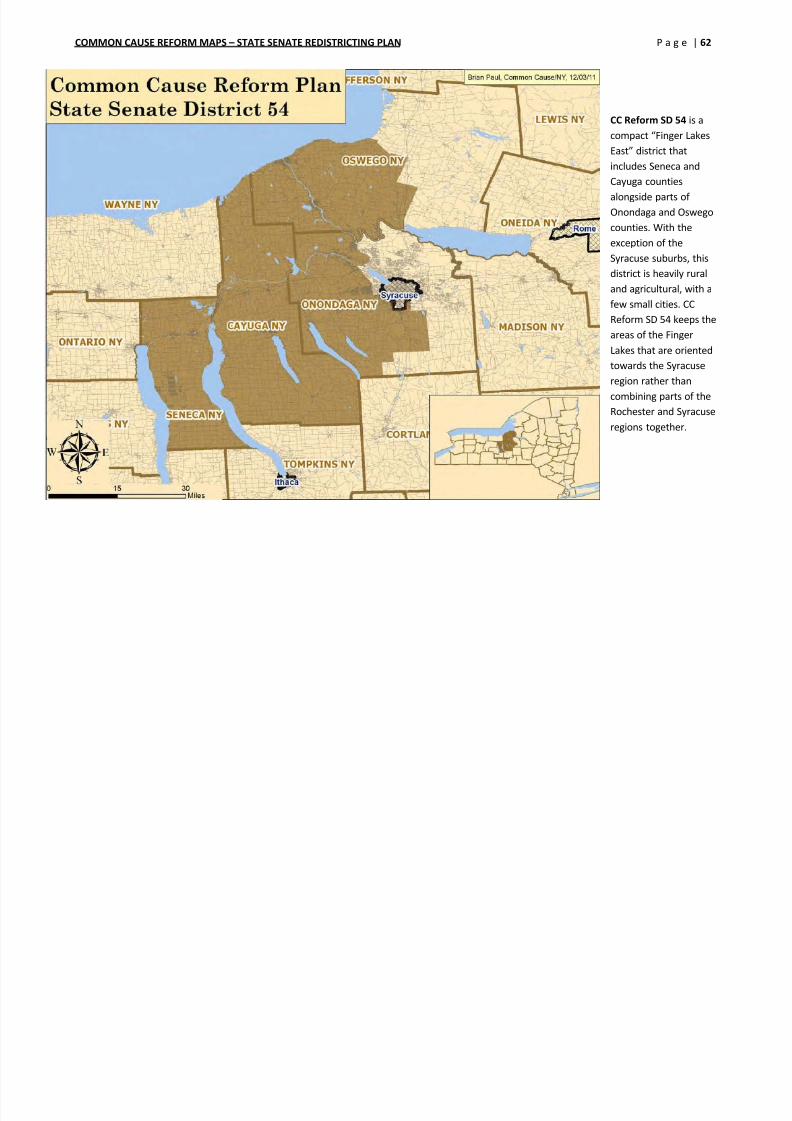
CC Reform SD 54 is acompact “Finger Lakes
East” district that
includes Seneca and
Cayuga counties
alongside parts of
Onondaga and Oswego
counties. With theexception of the
Syracuse suburbs, this
district is heavily rural
and agricultural, with a
few small cities. CC
Reform SD 54 keeps the
areas of the FingerLakes that are oriented
towards the Syracuse
region rather than
combining parts of the
Rochester and Syracuse
regions together.
COMMON CAUSE REFORM MAPS – STATE SENATE REDISTRICTING PLAN P a g e | 63
Major Demographic Changes:
From 2000 to 2010 the population of the City of Syracuse declined by 1 5% to a total of 145 170 This decline is considerably less than
8/3/2019 Ccny Senate Guide -- Newsday Criteria Version -- With Maps
http://slidepdf.com/reader/full/ccny-senate-guide-newsday-criteria-version-with-maps 63/77
- From 2000 to 2010, the population of the City of Syracuse declined by 1.5% to a total of 145,170. This decline is considerably less than
the other major upstate cities due to considerable growth in the city’s minority communities which offset some of the white population
decline. A detailed discussion of the demographics of the Syracuse region, including illustrative maps can be found on the CommonCause/NY Mapping Democracy blog.
DIST POP VAP NH White VAP NH Black VAP NH Asian VAP Hispanic VAP
49 314,240 246,538 93.9% 1.4% 1.4% 1.9%
50 311,674 240,756 76.7% 12.9% 3.8% 4.1%
54 315,507 248,455 93.6% 2.3% 0.8% 1.8%
- Keeping the City of Syracuse entirely within a single district allows for increased minority influence among these communities that are
currently broken up. CC Reform SD 50, at 12.9% NH Black VAP and 4.1% Hispanic VAP, has roughly 25% more minority influence than any
existing district in the area.
Incumbent(s) no longer in current district:
- James Seward (51-R)
New districts with no incumbents within borders:
- NONE
Political Outlook: ( percentages represent an average of state senate and state assembly voting in 2010).
- Current SD 49 2010 Result: 51.6% StateLeg D, CC Reform SD 49 2010 Result: 65.5% StateLeg R
- Current SD 50 2010 Result: 60.4% StateLeg R, CC Reform SD 50 2010 Result: 54.6% StateLeg D
-
Current SD 54 2010 Result: 74.7% StateLeg R, CC Reform SD 54 2010 Result: 75.8% StateLeg R
COMMON CAUSE REFORM MAPS – STATE SENATE REDISTRICTING PLAN P a g e | 64
SOUTHERN TIER

8/3/2019 Ccny Senate Guide -- Newsday Criteria Version -- With Maps
http://slidepdf.com/reader/full/ccny-senate-guide-newsday-criteria-version-with-maps 64/77
Common Cause Reform Map description and explanation- The Southern Tier is a regionally distinct area which should be kept whole. Similarly the geographic boundaries of counties, towns, and
cities must be respected whenever possible. The reform map unites counties and communities of interest, drawing districts within the
Southern Tier and eliminating fragments from other regions.
CC Reform SD 52 covers Broome,
Tioga, and part of Tompkins
counties.
Binghamton and Ithaca are home
to SUNY Binghamton and Cornell
University respectively and have
many demographiccommonalities due to the
presence of two major research
universities (more college
graduates and a more “white
collar” economy than the
surrounding region). Binghamton
and Ithaca should be includedwithin the same Senate district.
COMMON CAUSE REFORM MAPS – STATE SENATE REDISTRICTING PLAN P a g e | 65
8/3/2019 Ccny Senate Guide -- Newsday Criteria Version -- With Maps
http://slidepdf.com/reader/full/ccny-senate-guide-newsday-criteria-version-with-maps 65/77
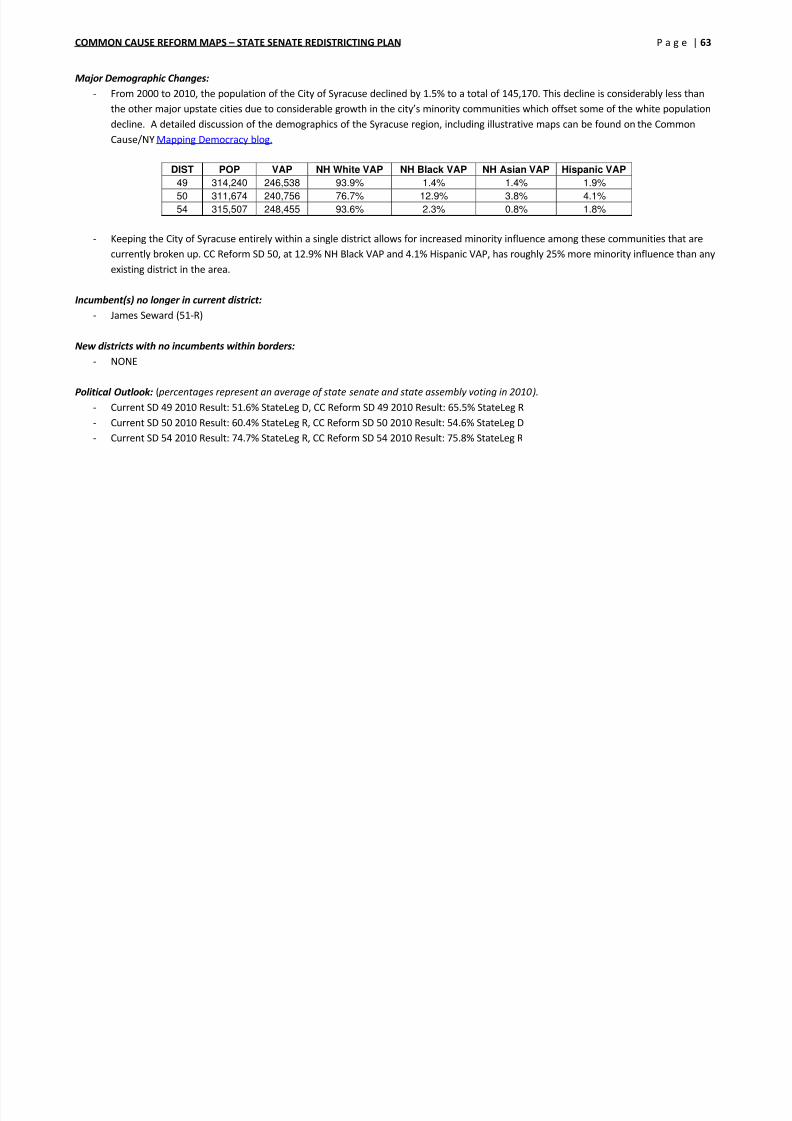
CC Reform SD 53
covers the rural
central southern
tier including
Chemung,
Schuyler, Steuben,
Allegany, and
most of Livingston
County.
COMMON CAUSE REFORM MAPS – STATE SENATE REDISTRICTING PLAN P a g e | 66
Major Demographic Changes:
- This large region of New York State is predominantly rural. From 2000 to 2010, the region grew by an estimated 1,695 residents, or 0.2%.

8/3/2019 Ccny Senate Guide -- Newsday Criteria Version -- With Maps
http://slidepdf.com/reader/full/ccny-senate-guide-newsday-criteria-version-with-maps 66/77
g g p y , g g y , ,
However, the region’s population would indeed have declined if not for major growth in the minority communities, which are mostly
within the region’s small cities. A detailed discussion of the demographics of this region can be found on the Common Cause/NYredistricting blog, Mapping Democracy.
DIST POP VAP NH White VAP NH Black VAP NH Asian VAP Hispanic VAP
52 318,567 256,944 86.9% 3.4% 5.0% 2.9%
53 306,088 242,108 93.0% 3.0% 1.1% 1.7%
Incumbent(s) no longer in current district:
- NONE
New districts with no incumbents within borders:
- NONE
Political Outlook: ( percentages represent an average of state senate and state assembly voting in 2010). - Current SD 52 2010 Result: 64.3% StateLeg R, CC Reform SD 52 2010 Result: 55.1% StateLeg R
- Current SD 53 2010 Result: 64.2% StateLeg R, CC Reform SD 53 2010 Result: 76.3% StateLeg R
COMMON CAUSE REFORM MAPS – STATE SENATE REDISTRICTING PLAN P a g e | 67
ROCHESTER REGION

8/3/2019 Ccny Senate Guide -- Newsday Criteria Version -- With Maps
http://slidepdf.com/reader/full/ccny-senate-guide-newsday-criteria-version-with-maps 67/77
Common Cause Reform Map description and explanation- Rochester represents the center of a distinct regional economic, social, and political unit within Western New York. Districts in the region
should be oriented toward the metropolitan region rather than extending into the area from far flung areas across the state.
CC Reform SD 55is a compact
“Finger Lakes West” district
consisting of Ontario, Wayne,
and Yates counties. These
counties are the part of the
Finger Lakes region that is more
oriented towards Rochester
than Syracuse.
Some Rochester suburbs are
also included in this district
simply because Monroe County
is too large to fit into two
senate districts alone.
COMMON CAUSE REFORM MAPS – STATE SENATE REDISTRICTING PLAN P a g e | 68
8/3/2019 Ccny Senate Guide -- Newsday Criteria Version -- With Maps
http://slidepdf.com/reader/full/ccny-senate-guide-newsday-criteria-version-with-maps 68/77
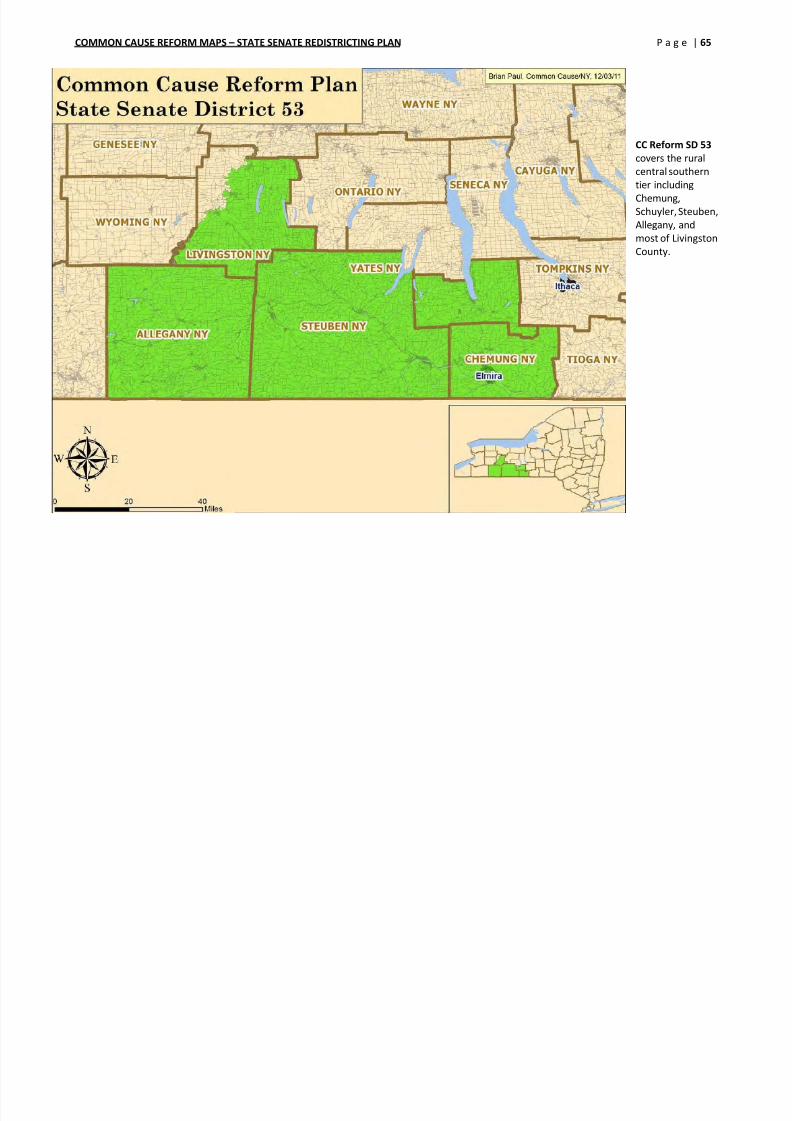
CC Reform SD 56 keeps
the City of Rochester in asingle senate district along
with the suburban towns
of Irondequoit and
Webster. As of Census
2010, Rochester has a
population of 210,565
which is small enough tobe included in one senate
district.
Communities within the
City of Rochester are
more racially diverse, less
wealthy, have morechildren, and have much
lower rates of
homeownership than
communities in
surrounding areas, and
constitute a distinct
community of interest.
- The choice of Irondequoit and Webster as opposed to other suburbs like Greece, Gates, or Brighton is a function of population math –
only the populations of Irondequoit and Webster combined with Rochester’s to produce a district within +/- 3% of the mean (312,250).
COMMON CAUSE REFORM MAPS – STATE SENATE REDISTRICTING PLAN P a g e | 69
8/3/2019 Ccny Senate Guide -- Newsday Criteria Version -- With Maps
http://slidepdf.com/reader/full/ccny-senate-guide-newsday-criteria-version-with-maps 69/77
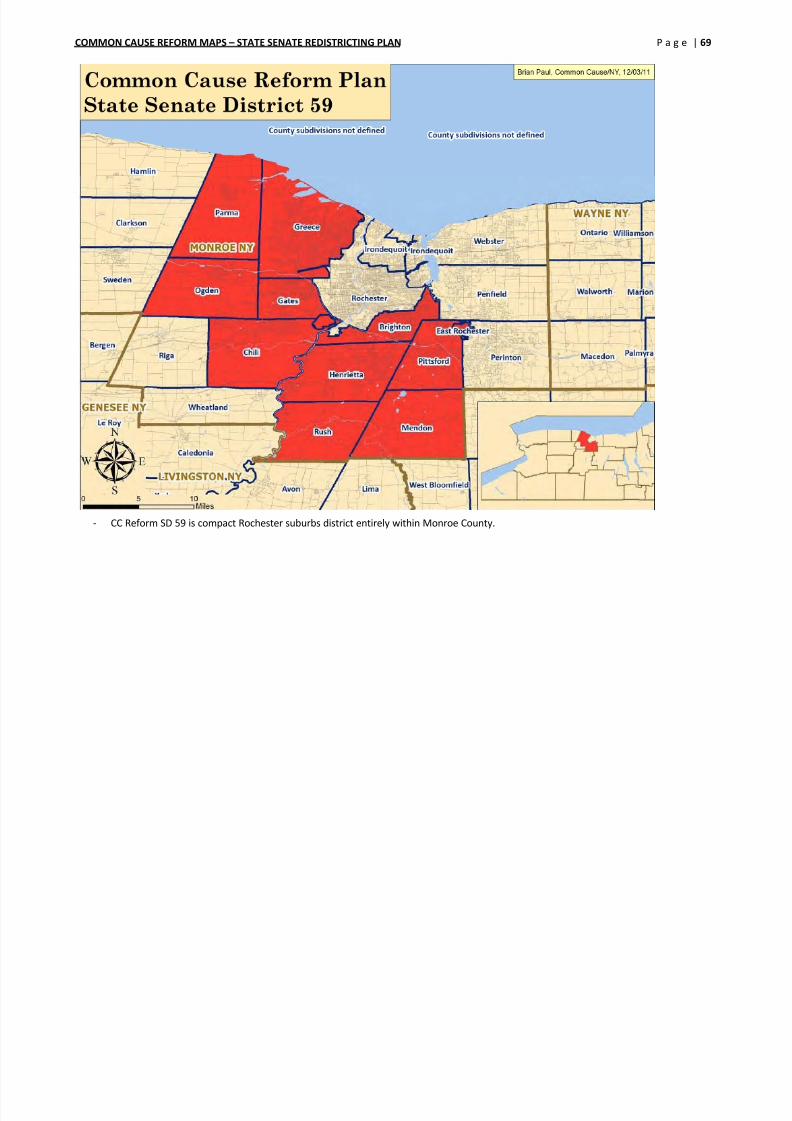
- CC Reform SD 59 is compact Rochester suburbs district entirely within Monroe County.
COMMON CAUSE REFORM MAPS – STATE SENATE REDISTRICTING PLAN P a g e | 70
Major Demographic Changes:
8/3/2019 Ccny Senate Guide -- Newsday Criteria Version -- With Maps
http://slidepdf.com/reader/full/ccny-senate-guide-newsday-criteria-version-with-maps 70/77
- Monroe County as a whole grew by 1.2% between 2000 and 2010 but the City of Rochester shrunk by 4.2% -- less so than Buffalo but
more than Syracuse.- Monroe County would have actually lost population and Rochester would have shrunken further if not for major growth in the minority
communities. In Monroe County, the Hispanic population grew by 45.8% and the NH Black population by 18.8% between 2000 and 2010.
- In the Finger Lakes West area of Wayne and Yates were flat but Ontario County grew by over 7,700 residents with most of this growth
taking place in the Canandaigua area.
DIST POP VAP NH White VAP NH Black VAP NH Asian VAP Hispanic VAP
55 309,523 237,420 93.2% 2.1% 1.3% 2.4%
56 304,829 232,034 59.0% 25.6% 2.8% 10.5%
59 316,431 248,497 86.8% 4.9% 4.0% 3.1%
- By keeping the City of Rochester whole, CC Reform SD 56 forms a minority coalition influence district that has roughly 20% greater
minority influence than any existing Senate district in the area.
Incumbent(s) no longer in current district:
- NONE
New districts with no incumbents within borders:
- NONE
Political Outlook: ( percentages represent an average of state senate and state assembly voting in 2010).
- Current SD 55 2010 Result: 52.0% StateLeg R, CC Reform SD 55 2010 Result: 67.3% StateLeg R
- Current SD 56 2010 Result: 52.3% StateLeg R, CC Reform SD 56 2010 Result: 58.9% StateLeg D
- Current SD 59 2010 Result: 68.9% StateLeg R, CC Reform SD 59 2010 Result: 59.3% StateLeg R
COMMON CAUSE REFORM MAPS – STATE SENATE REDISTRICTING PLAN P a g e | 71
8/3/2019 Ccny Senate Guide -- Newsday Criteria Version -- With Maps
http://slidepdf.com/reader/full/ccny-senate-guide-newsday-criteria-version-with-maps 71/77
COMMON CAUSE REFORM MAPS – STATE SENATE REDISTRICTING PLAN P a g e | 72
BUFFALO AND WESTERN NEW YORK
8/3/2019 Ccny Senate Guide -- Newsday Criteria Version -- With Maps
http://slidepdf.com/reader/full/ccny-senate-guide-newsday-criteria-version-with-maps 72/77
Common Cause Reform Map description and explanation
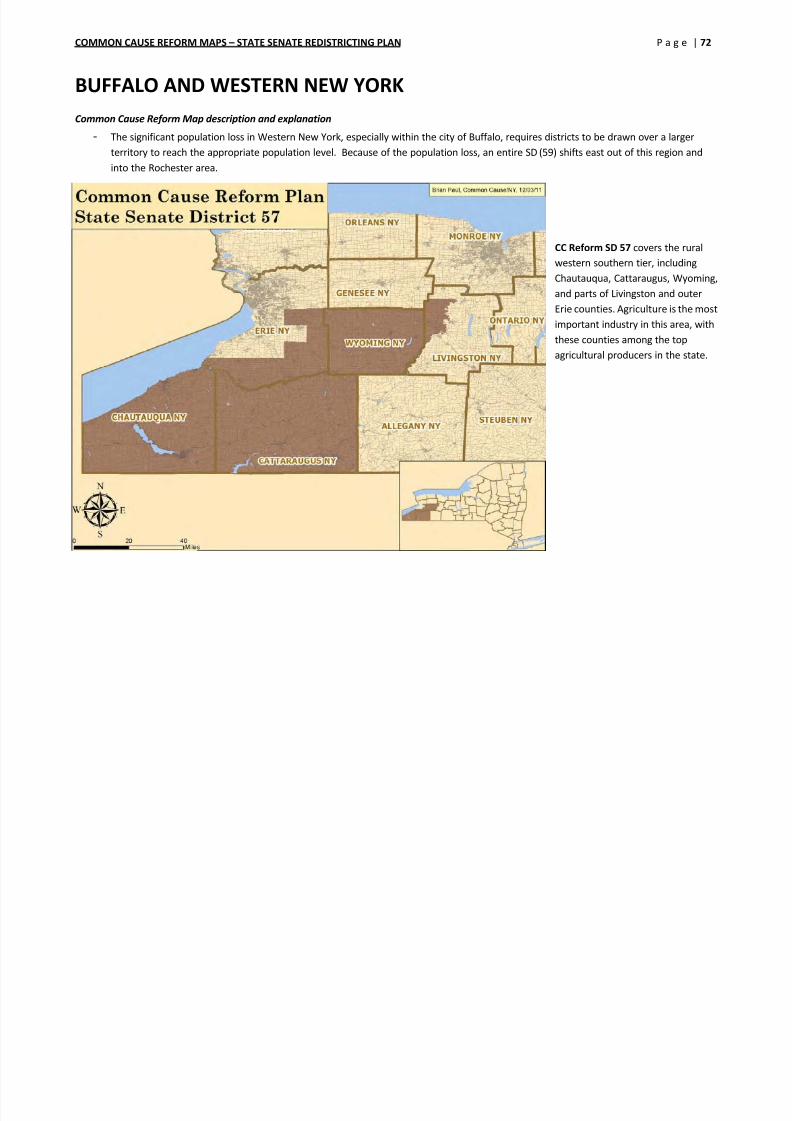
- The significant population loss in Western New York, especially within the city of Buffalo, requires districts to be drawn over a larger
territory to reach the appropriate population level. Because of the population loss, an entire SD (59) shifts east out of this region and
into the Rochester area.
CC Reform SD 57 covers the rural
western southern tier, including
Chautauqua, Cattaraugus, Wyoming,
and parts of Livingston and outer
Erie counties. Agriculture is the most
important industry in this area, with
these counties among the topagricultural producers in the state.
COMMON CAUSE REFORM MAPS – STATE SENATE REDISTRICTING PLAN P a g e | 73

8/3/2019 Ccny Senate Guide -- Newsday Criteria Version -- With Maps
http://slidepdf.com/reader/full/ccny-senate-guide-newsday-criteria-version-with-maps 73/77
CC Reform SD 58 consists of the
southeast corner of
Buffalo and the
surrounding
suburbs of Erie
County. South
Buffalo is a distinct
part of the citywith strong
connections to the
adjacent
Lackawanna and
West Seneca.
COMMON CAUSE REFORM MAPS – STATE SENATE REDISTRICTING PLAN P a g e | 74
8/3/2019 Ccny Senate Guide -- Newsday Criteria Version -- With Maps
http://slidepdf.com/reader/full/ccny-senate-guide-newsday-criteria-version-with-maps 74/77
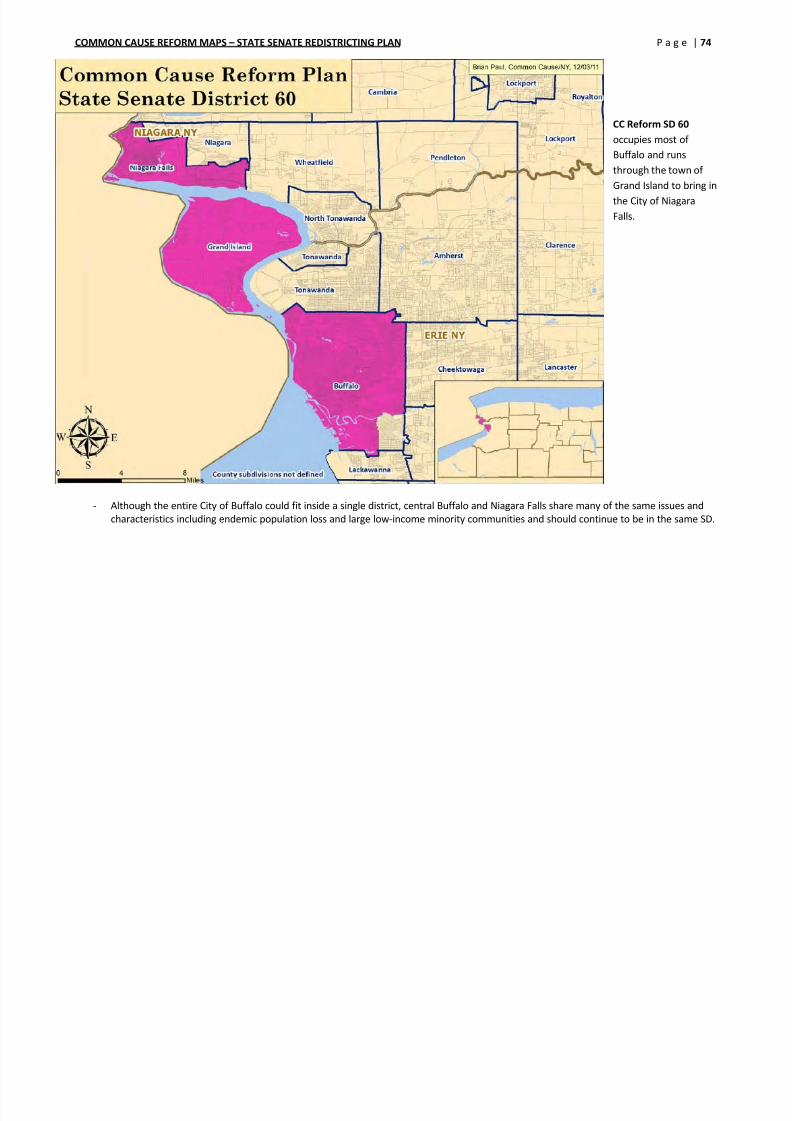
CC Reform SD 60 occupies most of
Buffalo and runs
through the town of
Grand Island to bring in
the City of Niagara
Falls.
- Although the entire City of Buffalo could fit inside a single district, central Buffalo and Niagara Falls share many of the same issues and
characteristics including endemic population loss and large low-income minority communities and should continue to be in the same SD.
COMMON CAUSE REFORM MAPS – STATE SENATE REDISTRICTING PLAN P a g e | 75
CC Reform SD 61 is
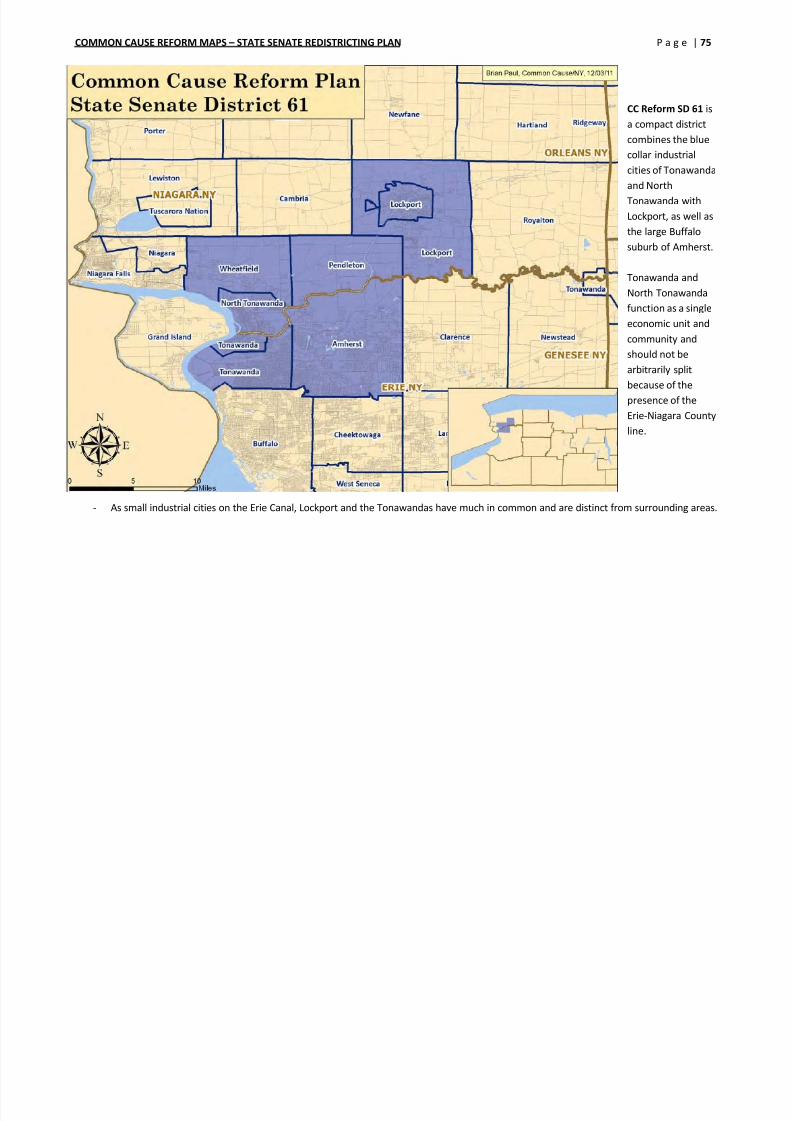
8/3/2019 Ccny Senate Guide -- Newsday Criteria Version -- With Maps
http://slidepdf.com/reader/full/ccny-senate-guide-newsday-criteria-version-with-maps 75/77
CC Reform SD 61 is
a compact districtcombines the blue
collar industrial
cities of Tonawanda
and North
Tonawanda with
Lockport, as well as
the large Buffalosuburb of Amherst.
Tonawanda and
North Tonawanda
function as a single
economic unit and
community andshould not be
arbitrarily split
because of the
presence of the
Erie-Niagara County
line.
- As small industrial cities on the Erie Canal, Lockport and the Tonawandas have much in common and are distinct from surrounding areas.
COMMON CAUSE REFORM MAPS – STATE SENATE REDISTRICTING PLAN P a g e | 76

8/3/2019 Ccny Senate Guide -- Newsday Criteria Version -- With Maps
http://slidepdf.com/reader/full/ccny-senate-guide-newsday-criteria-version-with-maps 76/77
CC Reform SD 62 is a northern
West New York
rural district
consisting of the
outer areas of
Erie and Niagara
counties alongwith Orleans,
Genessee, and
the outer part of
Monroe County.
COMMON CAUSE REFORM MAPS – STATE SENATE REDISTRICTING PLAN P a g e | 77
Major Demographic Changes:
- The Buffalo region, defined as Erie County and Niagara County, lost 32,920 residents over the past decade, with the overall population
declining by 2 8% The City of Buffalo lost more than 10% of its population since the last census A detailed discussion of the

8/3/2019 Ccny Senate Guide -- Newsday Criteria Version -- With Maps
http://slidepdf.com/reader/full/ccny-senate-guide-newsday-criteria-version-with-maps 77/77
declining by 2.8%. The City of Buffalo lost more than 10% of its population since the last census. A detailed discussion of the
demography of the region can be found here.
DIST POP VAP NH White VAP NH Black VAP NH Asian VAP Hispanic VAP
57 307,459 245,389 91.7% 2.5% 0.5% 3.1%
58 307,457 242,797 93.3% 3.0% 0.9% 1.9%
60 307,337 235,661 54.7% 32.6% 2.9% 7.4%
61 308,839 246,487 89.6% 3.6% 3.8% 1.8%
62 304,254 239,894 93.3% 2.6% 0.8% 1.9%
Incumbent(s) no longer in current district:
- Patrick Gallivan (59-R)
New districts with no incumbents within borders:
- NONE
Political Outlook: ( percentages represent an average of state senate and state assembly voting in 2010).
- Current SD 57 2010 Result: 75.8% StateLeg R, CC Reform SD 57 2010 Result: 73.9% StateLeg R
- Current SD 58 2010 Result: 55.9% StateLeg D, CC Reform SD 58 2010 Result: 51.3% StateLeg D
- Current SD 60 2010 Result: 59.9% StateLeg D, CC Reform SD 60 2010 Result: 62.1% StateLeg D
- Current SD 61 2010 Result: 62.0% StateLeg R, CC Reform SD 61 2010 Result: 60.9% StateLeg R
- Current SD 62 2010 Result: 64.3% StateLeg R, CC Reform SD 62 2010 Result: 69.7% StateLeg R


