
An Integrated, Handheld Multi-function Base Station Test Tool forGreater Flexibility and Technician Productivity
Cell Master™
MT8212B
User’s GuideMS2712
SiteMaster SpectrumMaster CellMaster
S331D Site Master SiteMaster MS2712MS2711D Spectrum Master SpectrumMaster MS2712MT8212A Cell Master CellMaster
00986-00079.qxd 6/1/06 9:26 AM Page 1
WARRANTY
The Anritsu product(s) listed on the title page is (are) warranted against defects inmaterials and workmanship for one year from the date of shipment.Anritsu's obligation covers repairing or replacing products which prove to be defec-tive during the warranty period. Buyers shall prepay transportation charges forequipment returned to Anritsu for warranty repairs. Obligation is limited to the origi-nal purchaser. Anritsu is not liable for consequential damages.
LIMITATION OF WARRANTY
The foregoing warranty does not apply to Anritsu connectors that have failed due tonormal wear. Also, the warranty does not apply to defects resulting from improper orinadequate maintenance by the Buyer, unauthorized modification or misuse, or op-eration outside the environmental specifications of the product. No other warranty isexpressed or implied, and the remedies provided herein are the Buyer's sole andexclusive remedies.
TRADEMARK ACKNOWLEDGMENTS
Windows, Windows 95, Windows NT, Windows 98, Windows 2000, Windows MEand Windows XP are registered trademarks of the Microsoft Corporation.Anritsu, FlexCal, InstaCal and Cell Master are trademarks of Anritsu Company.
NOTICE
Anritsu Company has prepared this manual for use by Anritsu Company personneland customers as a guide for the proper installation, operation and maintenance ofAnritsu Company equipment and computer programs. The drawings, specifications,and information contained herein are the property of Anritsu Company, and any un-authorized use or disclosure of these drawings, specifications, and information isprohibited; they shall not be reproduced, copied, or used in whole or in part as thebasis for manufacture or sale of the equipment or software programs without theprior written consent of Anritsu Company.
UPDATES
Updates to this manual, if any, may be downloaded from the Anritsu internet site at:http://www.us.anritsu.com.
March 2007 10580-00089
Copyright � 2004-2007 Anritsu Co. Revision: J
Equipment marked with the Crossed-out WheelieBin symbol complies with the European
Parliament and Council Directive 2002/96/EC (the“WEEE Directive”) in European Union.the
For Products placed on the EU market afterAugust 13, 2005, please contact your local Anritsurepresentative at the end of the product's usefullife to arrange disposal in accordance with your
initial contract and the local law.

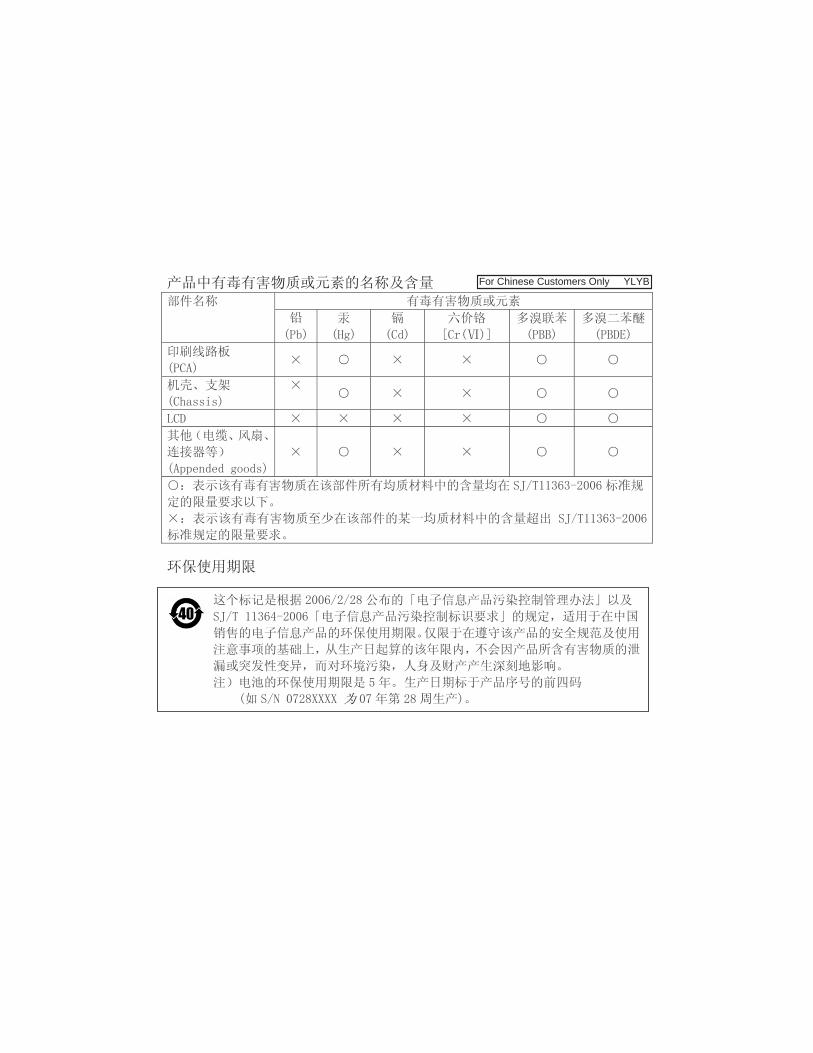
For Chinese Customers Only YLYB


Table of Contents
Chapter 1 - General Information
Introduction . . . . . . . . . . . . . . . . . . . . . . . . . . . . . . . . . . 1-1
Description . . . . . . . . . . . . . . . . . . . . . . . . . . . . . . . . . . . 1-1
Options . . . . . . . . . . . . . . . . . . . . . . . . . . . . . . . . . . . . . 1-1
Printers . . . . . . . . . . . . . . . . . . . . . . . . . . . . . . . . . . . . . 1-2
Standard Accessories . . . . . . . . . . . . . . . . . . . . . . . . . . . . . 1-2
Optional Accessories. . . . . . . . . . . . . . . . . . . . . . . . . . . . . . 1-3
Performance Specifications . . . . . . . . . . . . . . . . . . . . . . . . . . 1-6
Preventive Maintenance . . . . . . . . . . . . . . . . . . . . . . . . . . . 1-13
Calibration . . . . . . . . . . . . . . . . . . . . . . . . . . . . . . . . . . 1-13
InstaCal Module . . . . . . . . . . . . . . . . . . . . . . . . . . . . . . . 1-14
Annual Verification. . . . . . . . . . . . . . . . . . . . . . . . . . . . . . 1-14
ESD Precautions . . . . . . . . . . . . . . . . . . . . . . . . . . . . . . . 1-14
Mode References . . . . . . . . . . . . . . . . . . . . . . . . . . . . . . . 1-14
Chapter 2 - Functions and Operations
Introduction . . . . . . . . . . . . . . . . . . . . . . . . . . . . . . . . . . 2-1
Connector Panel . . . . . . . . . . . . . . . . . . . . . . . . . . . . . . . . 2-1
Display Overview . . . . . . . . . . . . . . . . . . . . . . . . . . . . . . . 2-3
Front Panel Overview . . . . . . . . . . . . . . . . . . . . . . . . . . . . . 2-4
Function Hard Keys . . . . . . . . . . . . . . . . . . . . . . . . . . . . . . 2-5
Keypad Hard Keys . . . . . . . . . . . . . . . . . . . . . . . . . . . . . . . 2-6
Soft Keys. . . . . . . . . . . . . . . . . . . . . . . . . . . . . . . . . . . . 2-7
Cable and Antenna Analyzer Mode . . . . . . . . . . . . . . . . . . . . . . 2-8
Spectrum Analyzer Mode . . . . . . . . . . . . . . . . . . . . . . . . . . 2-16
Power Meter (Internal) Mode. . . . . . . . . . . . . . . . . . . . . . . . . 2-29
Power Monitor (External Detector) (Option 5). . . . . . . . . . . . . . . . 2-34
High Accuracy Power Sensor Mode (Option 19) . . . . . . . . . . . . . . 2-37
Transmission Measurement Mode (Option 21) . . . . . . . . . . . . . . . 2-39
Interference Analyzer Mode (Option 25). . . . . . . . . . . . . . . . . . . 2-49
Channel Scanner Mode (Option 27) . . . . . . . . . . . . . . . . . . . . . 2-61
CW Signal Generator Mode (Option 28) . . . . . . . . . . . . . . . . . . . 2-66
GSM Mode (Option 40) . . . . . . . . . . . . . . . . . . . . . . . . . . . 2-69
CDMA Mode (Options 33, 42 and 43) . . . . . . . . . . . . . . . . . . . . 2-73
T1 Tester Mode (Option 50) . . . . . . . . . . . . . . . . . . . . . . . . . 2-80
E1 Tester Mode (Option 50) . . . . . . . . . . . . . . . . . . . . . . . . . 2-86
EVDO Mode (Options 34, 62, and 63) . . . . . . . . . . . . . . . . . . . . 2-91
Symbols. . . . . . . . . . . . . . . . . . . . . . . . . . . . . . . . . . . . 2-98
Self Test . . . . . . . . . . . . . . . . . . . . . . . . . . . . . . . . . . . 2-99
Error Messages . . . . . . . . . . . . . . . . . . . . . . . . . . . . . . . 2-100
Battery Information . . . . . . . . . . . . . . . . . . . . . . . . . . . . . 2-105
Charging a New Battery. . . . . . . . . . . . . . . . . . . . . . . . . . . 2-105
Determining Remaining Battery Life . . . . . . . . . . . . . . . . . . . . 2-106
Important Battery Information . . . . . . . . . . . . . . . . . . . . . . . 2-108
i

Chapter 3 - Getting Started
Introduction . . . . . . . . . . . . . . . . . . . . . . . . . . . . . . . . . . 3-1
Power On Procedure . . . . . . . . . . . . . . . . . . . . . . . . . . . . . . 3-1
Cable and Antenna Analyzer Mode . . . . . . . . . . . . . . . . . . . . . . 3-2
Spectrum Analyzer Mode . . . . . . . . . . . . . . . . . . . . . . . . . . 3-10
All Modes. . . . . . . . . . . . . . . . . . . . . . . . . . . . . . . . . . . 3-14
Selecting a Signal Standard. . . . . . . . . . . . . . . . . . . . . . . . . . 3-14
Save and Recall a Setup . . . . . . . . . . . . . . . . . . . . . . . . . . . 3-14
Save and Recall a Display . . . . . . . . . . . . . . . . . . . . . . . . . . 3-15
Changing the Units . . . . . . . . . . . . . . . . . . . . . . . . . . . . . . 3-15
Changing the Language. . . . . . . . . . . . . . . . . . . . . . . . . . . . 3-16
Adjusting Markers . . . . . . . . . . . . . . . . . . . . . . . . . . . . . . 3-16
Adjusting Limits . . . . . . . . . . . . . . . . . . . . . . . . . . . . . . . 3-17
Adjusting the LCD Brightness . . . . . . . . . . . . . . . . . . . . . . . . 3-18
Printing . . . . . . . . . . . . . . . . . . . . . . . . . . . . . . . . . . . . 3-19
Using the Soft Carrying Case. . . . . . . . . . . . . . . . . . . . . . . . . 3-20
Chapter 4 - Cable & Antenna Analyzer Measurement Mode
Introduction . . . . . . . . . . . . . . . . . . . . . . . . . . . . . . . . . . 4-1
Line Sweep Fundamentals . . . . . . . . . . . . . . . . . . . . . . . . . . . 4-1
CW Mode . . . . . . . . . . . . . . . . . . . . . . . . . . . . . . . . . . . 4-2
Information Required for a Line Sweep . . . . . . . . . . . . . . . . . . . . 4-3
Typical Line Sweep Test Procedures . . . . . . . . . . . . . . . . . . . . . 4-3
Chapter 5 - Spectrum Analyzer Measurement Mode
Introduction . . . . . . . . . . . . . . . . . . . . . . . . . . . . . . . . . . 5-1
Measurement Fundamentals . . . . . . . . . . . . . . . . . . . . . . . . . . 5-1
Preamplifier . . . . . . . . . . . . . . . . . . . . . . . . . . . . . . . . . . 5-3
Preamplifier Operation. . . . . . . . . . . . . . . . . . . . . . . . . . . . . 5-3
Preamplifier Measurement Example. . . . . . . . . . . . . . . . . . . . . . 5-4
Dynamic Attenuation Control . . . . . . . . . . . . . . . . . . . . . . . . . 5-6
Selecting the Signal Standard and Channel . . . . . . . . . . . . . . . . . . 5-7
Field Strength Measurements . . . . . . . . . . . . . . . . . . . . . . . . . 5-8
Occupied Bandwidth. . . . . . . . . . . . . . . . . . . . . . . . . . . . . . 5-9
Channel Power Measurement . . . . . . . . . . . . . . . . . . . . . . . . 5-11
Adjacent Channel Power Ratio . . . . . . . . . . . . . . . . . . . . . . . . 5-13
AM/FM Demodulation . . . . . . . . . . . . . . . . . . . . . . . . . . . . 5-15
Demodulation Procedure . . . . . . . . . . . . . . . . . . . . . . . . . . . 5-15
Carrier to Interference Ratio (C/I) . . . . . . . . . . . . . . . . . . . . . . 5-17
Chapter 6 - Internal Power Meter Mode
Introduction . . . . . . . . . . . . . . . . . . . . . . . . . . . . . . . . . . 6-1
Power Measurement . . . . . . . . . . . . . . . . . . . . . . . . . . . . . . 6-1
Offset Calibration . . . . . . . . . . . . . . . . . . . . . . . . . . . . . . . 6-2
Chapter 7 - Power Monitor Mode (Option 5)
Introduction . . . . . . . . . . . . . . . . . . . . . . . . . . . . . . . . . . 7-1
Power Measurement . . . . . . . . . . . . . . . . . . . . . . . . . . . . . . 7-1
ii

Chapter 8 - High Accuracy Power Meter
Introduction . . . . . . . . . . . . . . . . . . . . . . . . . . . . . . . . . . 8-1
Power Measurement . . . . . . . . . . . . . . . . . . . . . . . . . . . . . . 8-2
Chapter 9 - T1 Measurement Mode
Introduction . . . . . . . . . . . . . . . . . . . . . . . . . . . . . . . . . . 9-1
T1 Fundamentals . . . . . . . . . . . . . . . . . . . . . . . . . . . . . . . . 9-1
G.821 Measurement Definitions . . . . . . . . . . . . . . . . . . . . . . . . 9-2
Network Equipment . . . . . . . . . . . . . . . . . . . . . . . . . . . . . . 9-2
Testing T1 Circuits. . . . . . . . . . . . . . . . . . . . . . . . . . . . . . . 9-4
In Service Testing . . . . . . . . . . . . . . . . . . . . . . . . . . . . . . . 9-4
Out-Of-Service Testing . . . . . . . . . . . . . . . . . . . . . . . . . . . . 9-7
DS0 Testing. . . . . . . . . . . . . . . . . . . . . . . . . . . . . . . . . . 9-12
Chapter 10 - E1 Measurement Mode
Introduction . . . . . . . . . . . . . . . . . . . . . . . . . . . . . . . . . . 10-1
E1 Fundamentals . . . . . . . . . . . . . . . . . . . . . . . . . . . . . . . 10-1
G.821 Measurement Definitions . . . . . . . . . . . . . . . . . . . . . . . 10-2
Network Equipment . . . . . . . . . . . . . . . . . . . . . . . . . . . . . 10-2
Testing E1 Circuits . . . . . . . . . . . . . . . . . . . . . . . . . . . . . . 10-3
In Service Testing . . . . . . . . . . . . . . . . . . . . . . . . . . . . . . 10-3
Out-Of-Service Testing. . . . . . . . . . . . . . . . . . . . . . . . . . . . 10-8
VF Channel Access Testing . . . . . . . . . . . . . . . . . . . . . . . . . 10-11
Chapter 11 - Transmission Measurement Mode
Introduction . . . . . . . . . . . . . . . . . . . . . . . . . . . . . . . . . . 11-1
Measuring Active Devices . . . . . . . . . . . . . . . . . . . . . . . . . . 11-1
Calibration . . . . . . . . . . . . . . . . . . . . . . . . . . . . . . . . . . 11-1
Transmission Measurement Procedure . . . . . . . . . . . . . . . . . . . . 11-3
Bias Tee (Option 10A) . . . . . . . . . . . . . . . . . . . . . . . . . . . . 11-4
Chapter 12 - GPS Feature
Introduction . . . . . . . . . . . . . . . . . . . . . . . . . . . . . . . . . . 12-1
Activating the GPS Feature. . . . . . . . . . . . . . . . . . . . . . . . . . 12-1
Saving with GPS Information . . . . . . . . . . . . . . . . . . . . . . . . 12-3
Recalling GPS Information . . . . . . . . . . . . . . . . . . . . . . . . . . 12-3
Chapter 13 - CDMA Measurement Mode
Introduction . . . . . . . . . . . . . . . . . . . . . . . . . . . . . . . . . . 13-1
CDMA Measurements . . . . . . . . . . . . . . . . . . . . . . . . . . . . 13-1
CDMA RF Measurements . . . . . . . . . . . . . . . . . . . . . . . . . . 13-6
Demodulator, cdmaOne and CDMA2000 Measurements . . . . . . . . . . 13-7
Over The Air Measurements . . . . . . . . . . . . . . . . . . . . . . . . 13-10
Chapter 14 - GSM Measurement Mode
Introduction . . . . . . . . . . . . . . . . . . . . . . . . . . . . . . . . . . 14-1
Configuration . . . . . . . . . . . . . . . . . . . . . . . . . . . . . . . . . 14-1
Measurement Results . . . . . . . . . . . . . . . . . . . . . . . . . . . . . 14-4
iii

Chapter 15 - Interference Analyzer Mode
Introduction . . . . . . . . . . . . . . . . . . . . . . . . . . . . . . . . . . 15-1
Interference Analysis . . . . . . . . . . . . . . . . . . . . . . . . . . . . . 15-1
Spectrogram . . . . . . . . . . . . . . . . . . . . . . . . . . . . . . . . . 15-1
Signal Strength . . . . . . . . . . . . . . . . . . . . . . . . . . . . . . . . 15-3
RSSI . . . . . . . . . . . . . . . . . . . . . . . . . . . . . . . . . . . . . 15-4
Signal ID . . . . . . . . . . . . . . . . . . . . . . . . . . . . . . . . . . . 15-5
Chapter 16 - Channel Scanner Mode
Introduction . . . . . . . . . . . . . . . . . . . . . . . . . . . . . . . . . . 16-1
Channel Scanner . . . . . . . . . . . . . . . . . . . . . . . . . . . . . . . 16-1
Chapter 17 - Signal Generator Mode
Introduction . . . . . . . . . . . . . . . . . . . . . . . . . . . . . . . . . . 17-1
Required Equipment . . . . . . . . . . . . . . . . . . . . . . . . . . . . . 17-1
Procedure . . . . . . . . . . . . . . . . . . . . . . . . . . . . . . . . . . . 17-1
Operation with Option 5, External Power Monitor. . . . . . . . . . . . . . 17-2
Softkeys. . . . . . . . . . . . . . . . . . . . . . . . . . . . . . . . . . . . 17-3
Negative Offset . . . . . . . . . . . . . . . . . . . . . . . . . . . . . . . . 17-3
Chapter 18 - EVDO Mode
Introduction . . . . . . . . . . . . . . . . . . . . . . . . . . . . . . . . . . 18-1
Cell Master Setup. . . . . . . . . . . . . . . . . . . . . . . . . . . . . . . 18-1
EVDO Over The Air Measurements . . . . . . . . . . . . . . . . . . . . 18-11
Activating the GPS Feature . . . . . . . . . . . . . . . . . . . . . . . . . 18-11
Chapter 19 - Handheld Software Tools
Introduction . . . . . . . . . . . . . . . . . . . . . . . . . . . . . . . . . . 19-1
Features . . . . . . . . . . . . . . . . . . . . . . . . . . . . . . . . . . . . 19-1
System Requirements. . . . . . . . . . . . . . . . . . . . . . . . . . . . . 19-1
Installation . . . . . . . . . . . . . . . . . . . . . . . . . . . . . . . . . . 19-2
Using Handheld Software Tools . . . . . . . . . . . . . . . . . . . . . . . 19-3
Downloading Traces . . . . . . . . . . . . . . . . . . . . . . . . . . . . . 19-3
Plot Capture to the PC . . . . . . . . . . . . . . . . . . . . . . . . . . . . 19-4
Plot Upload to the Instrument . . . . . . . . . . . . . . . . . . . . . . . . 19-4
Plot Properties . . . . . . . . . . . . . . . . . . . . . . . . . . . . . . . . 19-4
Signal Standards Editor . . . . . . . . . . . . . . . . . . . . . . . . . . . 19-11
Appendix A - Reference Data
Coaxial Cable Technical Data. . . . . . . . . . . . . . . . . . . . . . . . . A-1
Antenna Technical Data . . . . . . . . . . . . . . . . . . . . . . . . . . . . A-4
Appendix B - Windowing
Introduction . . . . . . . . . . . . . . . . . . . . . . . . . . . . . . . . . . B-1
Examples . . . . . . . . . . . . . . . . . . . . . . . . . . . . . . . . . . . B-1
Appendix C - Signal Standards
Introduction . . . . . . . . . . . . . . . . . . . . . . . . . . . . . . . . . . C-1
iv
Chapter 1
General Information
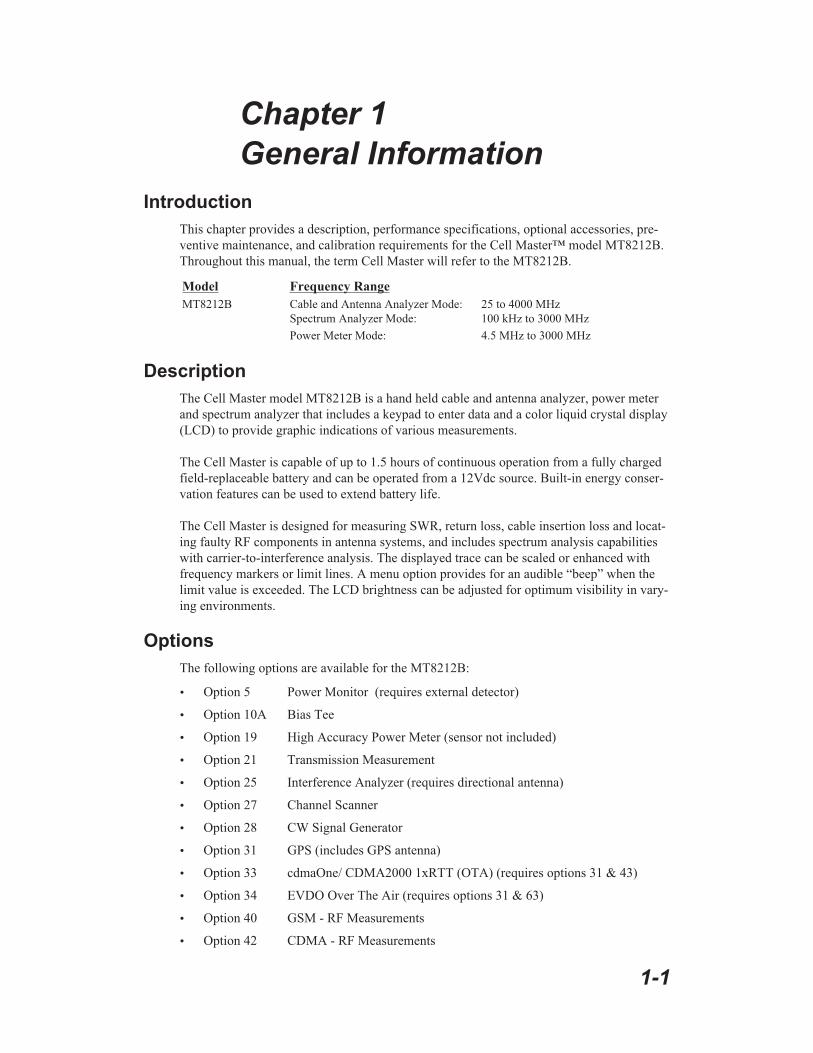
Introduction
This chapter provides a description, performance specifications, optional accessories, pre-
ventive maintenance, and calibration requirements for the Cell Master™ model MT8212B.
Throughout this manual, the term Cell Master will refer to the MT8212B.
Model Frequency Range
MT8212B Cable and Antenna Analyzer Mode: 25 to 4000 MHz
Spectrum Analyzer Mode: 100 kHz to 3000 MHz
Power Meter Mode: 4.5 MHz to 3000 MHz
Description
The Cell Master model MT8212B is a hand held cable and antenna analyzer, power meter
and spectrum analyzer that includes a keypad to enter data and a color liquid crystal display
(LCD) to provide graphic indications of various measurements.
The Cell Master is capable of up to 1.5 hours of continuous operation from a fully charged
field-replaceable battery and can be operated from a 12Vdc source. Built-in energy conser-
vation features can be used to extend battery life.
The Cell Master is designed for measuring SWR, return loss, cable insertion loss and locat-
ing faulty RF components in antenna systems, and includes spectrum analysis capabilities
with carrier-to-interference analysis. The displayed trace can be scaled or enhanced with
frequency markers or limit lines. A menu option provides for an audible “beep” when the
limit value is exceeded. The LCD brightness can be adjusted for optimum visibility in vary-
ing environments.
Options
The following options are available for the MT8212B:
� Option 5 Power Monitor (requires external detector)
� Option 10A Bias Tee
� Option 19 High Accuracy Power Meter (sensor not included)
� Option 21 Transmission Measurement
� Option 25 Interference Analyzer (requires directional antenna)
� Option 27 Channel Scanner
� Option 28 CW Signal Generator
� Option 31 GPS (includes GPS antenna)
� Option 33 cdmaOne/ CDMA2000 1xRTT (OTA) (requires options 31 & 43)
� Option 34 EVDO Over The Air (requires options 31 & 63)
� Option 40 GSM - RF Measurements
� Option 42 CDMA - RF Measurements
1-1

� Option 43 cdmaOne/ CDMA2000 1xRTT Demodulator
� Option 50 T1/E1 Analyzer
� Option 62 EVDO - RF Measurements
� Option 63 EVDO Demodulator
Printers
The following printers and printer accessories can be used with the MT8212B Cell Master:
� 2000-1214 HP DeskJet Printer, Model 450 w/Interface Cable, Black Print
Cartridge, and U.S. Power Cable
� 2000-1215 Color Print Cartridge for HP450 DeskJet
� 2000-1216 Black Print Cartridge for HP450 DeskJet
� 2000-1217 Rechargeable Battery Pack for HP450 DeskJet
� 2000-1218 Power Cable (U.K.) for DeskJet Printer
� 2000-663 Power Cable (Europe) for DeskJet Printer
� 2000-664 Power Cable (Australia) for DeskJet Printer
� 2000-667 Power Cable (S. Africa) for DeskJet Printer
� 2000-753 Serial-to-Parallel Converter Cable, DB9 (f) to Centronics (m)
� 1091-310 Cable Adapter, Centronics (f) to DB25 (f)
Standard Accessories
The following items are supplied with the basic hardware:
� Soft Carrying Case
� Rechargeable Battery
� AC-DC Adapter
� Automotive Cigarette Lighter 12 Volt DC Adapter
� Handheld Software Tools CDROM
� Serial Interface Cable (null modem type)
� One year Warranty (includes battery, firmware, and software)
� User's Guide
1-2
Chapter 1 General Information

Optional Accessories
1-3
Chapter 1 General Information
Part Number Description
1N50C Limiter, N(m) to N(f), 50W, 10 MHz to 18 GHz
42N50-20 Attenuator, 20 dB, 5 Watt, DC to 18 GHz, N(m)-N(f)
42N50A-30 Attenuator, 30 dB, 50 Watt, DC to 18 GHz, N(m)-N(f)
SC7179 Variable Attenuator, DC to 2 GHz, 0~90 dB, N(m)-N(f)
ICN50 InstaCal� Calibration Module, 2 MHz to 4.0 GHz, N(m), 50�
22N50 Open/Short, DC to 18 GHz, N(m), 50�
22NF50 Open/Short, DC to 18 GHz, N(f), 50�
SM/PL Precision Load, DC to 4 GHz, 42 dB, N(m), 50�
SM/PLNF Precision Load, DC to 4 GHz, 42 dB, N(f), 50�
OSLN50LF Precision Open/Short/Load, DC to 4 GHz, 42 dB, 50�, N(m)
OSLNF50LF Precision Open/Short/Load, DC to 4 GHz, 42 dB, 50�, N(f)
2000-767 Precision Open/Short/Load, DC to 4 GHz, 7/16 DIN(m), 50�
2000-768 Precision Open/Short/Load, DC to 4 GHz, 7/16 DIN(f), 50�
65701 Power Meter Offset Cal Kit consisting of one each:3-1010-119, 10 dB Attenuator, DC to 6 GHz, 2W3-806-151, 4 GHz Cable, 18" (46 cm)
SC7371 CW Signal Generator Kit with Housing
15NN50-1.5C Test Port Cable Armored, 1.5 meters, N(m)-N(m), 6 GHz
50W5NN50-3.0C Test Port Cable Armored, 3.0 meters, N(m)-N(m), 6 GHz
50W5NN50-5.0C Test Port Cable Armored, 5.0 meters, N(m)-N(m), 6 GHz, 50�
15NNF50-1.5C Test Port Cable Armored, 1.5 meters, N(m)-N(f), 6 GHz, 50�
15NNF50-3.0C Test Port Cable Armored, 3.0 meters, N(m)-N(f), 6 GHz, 50�
15NNF50-5.0C Test Port Cable Armored, 5.0 meters, N(m)-N(f), 6 GHz, 50�
15ND50-1.5C Test Port Cable Armored, 1.5 meters, N(m)-7/16 DIN(m), 6 GHz, 50�
15NDF50-1.5C Test Port Cable Armored, 1.5 meters, N(m)-7/16 DIN(f), 6 GHz, 50�
34NN50A Precision Adapter, N(m)-N(m), DC to 18 GHz, 50�
34NFNF50 Precision Adapter, N(f)-N(f), DC to 18 GHz, 50�
1091-26 Adapter, N(m)-SMA(m), DC to 18 GHz, 50�
1091-27 Adapter, N(m)-SMA(f), DC to 18 GHz, 50�
1091-80 Adapter, N(f)-SMA(m), DC to 18 GHz, 50�
1091-81 Adapter, N(f)-SMA(f), DC to 18 GHz, 50�
1091-172 Adapter, N(m)-BNC(f), DC to 1.3 GHz, 50�
510-90 Adapter, 7/16 DIN(f)-N(m), DC to 7.5 GHz, 50�
510-91 Adapter, 7/16 DIN(f)-N(f), DC to 7.5 GHz, 50�
510-92 Adapter, 7/16 DIN(m)-N(m), DC to 7.5 GHz, 50�
510-93 Adapter, 7/16 DIN(m)-N(f), DC to 7.5 GHz, 50�
510-96 Adapter, 7/16 DIN(m)-7/16 DIN(m), DC to 7.5 GHz, 50�
510-97 Adapter, 7/16 DIN(f)-7/16 DIN(f), DC to 7.5 GHz, 50�
510-102 Adapter, N(m)-N(m), 90� Right Angle, DC to 11 GHz, 50�

Optional Accessories, continued
1-4
Chapter 1 General Information
Part Number Description
2000-1030 Portable Antenna, SMA (m), 1.71 to 1.88 GHz, 50�
2000-1031 Portable Antenna, SMA (m), 1.85 to 1.99 GHz, 50�
2000-1032 Portable Antenna, SMA (m), 2.4 to 2.5 GHz, 50�
2000-1035 Portable Antenna, SMA (m), 896-941 MHz, 50�
2000-1200 Portable Antenna, SMA (m), 806-869 MHz, 50�
2000-1361 Portable Antenna, SMA(m), 5.725-5.825 GHz, 50�
2000-1411 Portable YAGI Antenna, N(f), 822-900 MHz, 10 dBd
2000-1412 Portable YAGI Antenna, N(f), 885-975 MHz, 10 dBd
2000-1413 Portable YAGI Antenna, N(f), 1.71-1.88 GHz, 10 dBd
2000-1414 Portable YAGI Antenna, N(f), 1.85-1.99 GHz, 9.3 dBd
2000-1415 Portable YAGI Antenna, N(f), 2.4-2.5 GHz, 12 dBd
2000-1416 Portable YAGI Antenna, N(f), 1.92-2.23 GHz, 12 dBd
61532 Antenna Kit, consisting of one each: 2000-1030, 2000-1031, 2000-1032,2000-1035, 2000-1200, and 2000-1361
2000-1410 Magnet Mount GPS Antenna with 15-foot cable
1030-105 Filter, Bandpass, 902.5 MHz Ctr Freq, 25 MHz BW, N(m) to N(f), 50�
1030-106 Filter, Bandpass, 1750 MHz Ctr Freq, 80 MHz BW, N(m) to N(f), 50�
1030-107 Filter, Bandpass, 1950 MHz Ctr Freq, 80 MHz BW, N(m) to N(f), 50�
1030-109 Filter, Bandpass, 836.5 MHz Ctr Freq, 25.8 MHz BW, N(m) to SMA(f), 50�
1030-110 Filter, Bandpass, 897.5 MHz Ctr Freq, 35 MHz BW, N(m) to SMA(f), 50�
1030-111 Filter, Bandpass, 1880 MHz Ctr Freq, 63.1 MHz BW, N(m) to SMA(f), 50�
1030-112 Filter, Bandpass, 2442 MHz Ctr Freq, 85.1 MHz BW, N(m) to SMA(f), 50�
806-16 Bantam Plug to Bantam Plug
806-116 Bantam Plug to BNC
806-117 Bantam “Y” Plug to RJ48
551-1691 USB to RS-232 Adapter Cable
48258 Soft Carrying Case
760-235 Transit Case
633-27 Rechargeable Battery, NiMH
2000-1029 Battery Charger, NiMH, w/ Universal Power Supply
40-168 AC/DC Adapter
806-141 Automotive Cigarette Lighter/12 Volt DC Adapter
800-441 Serial Interface Cable
2300-347 Software Tools
10580-00089 Cell Master MT8212B User’s Guide
10580-00106 Cell Master MT8212B Programming Manual
10580-00107 Cell Master MT8212B Maintenance Manual

Optional Accessories, continued
Power Monitor (Option 5) RF Detectors
The Anritsu 5400 and 560 Series Detectors use zero-biased Schottky diodes. Measurement
range is –55 dBm to +16 dBm using single cycle per sweep AC detection, auto-zeroing
with DC detection during the frequency sweep. Extender cables can be used with the
MT8212B Cell Master with Option 5 installed.
ModelFrequency
RangeImpedance Return Loss
Input
Conn.Frequency Response
5400-71N50 0.001 to 3 GHz 50� 26 dB N(m) �0.2 dB, <1 GHz�0.3 dB, <3 GHz
5400-71N75 0.001 to 3 GHz 75� 26 dB, <2 GHz20 dB, <3 GHz N(m) �0.2 dB, <1 GHz
�0.5 dB, <3 GHz
0 0.01 to 18 GHz 50�15 dB, <0.04 GHz22 dB, <8.00 GHz17 dB, <18.0 GHz
GPC-7 �0.5 dB, <18 GHz
560-7N560-7A550B 0.01 to 20 GHz 50�
15 dB, <0.04 GHz22 dB, <8.00 GHz17 dB, <18.0 GHz14 dB, <20.0 GHz
N(m) �0.5 dB, <18 GHz�1.25 dB, <20 GHz
560-7S50B 0.01 to 20 GHz 50�
15 dB, <0.04 GHz22 dB, <8.00 GHz17 dB, <18.0 GHz14 dB, <20.0 GHz
WSMA(m)
�0.5 dB, <18 GHz�1.25 dB, <20 GHz
560-7S50-2 0.01 to 26.5 GHz 50�
15 dB, <0.04 GHz22 dB, <8.00 GHz17 dB, <18.0 GHz14 dB, <26.5 GHz
WSMA(m)
�0.5 dB, <18 GHz�1.25 dB, <26.5 GHz
560-7K50 0.01 to 40 GHz 50�
12 dB, <0.04 GHz22 dB, <8.00 GHz17 dB, <18.0 GHz15 dB, <26.5 GHz14 dB, <32.0 GHz13 dB, <40.0 GHz
K(m)
�0.5 dB, <18 GHz�1.25 dB, <26.5 GHz
�2.2 dB, <32 GHz�2.5 dB, <40 GHz
560-7VA50 0.01 to 50 GHz 50�
12 dB, <0.04 GHz19 dB, <20.0 GHz15 dB, <40.0 GHz10 dB, <50.0 GHz
V(m)�0.8 dB, <20 GHz�2.5 dB, <40 GHz�3.0 dB, <50 GHz
High Accuracy Power Meter (Option 19) Accessories
PSN50 High Accuracy Power Sensor, 50 MHz to 6 GHz
3-1010-122 Attenuator (Bi-directional), 20dB, 5 Watt, DC to 12.4 GHz, N(m)-N(f)
3-1010-123 Attenuator (Bi-directional), 30 dB, 50 Watt, DC to 8.5 GHz, N(m)-N(f)
3-1010-124 Attenuator (Uni-directional), 40 dB, 100 Watt, DC to 8.5 GHz, N(m)-N(f)
1-5
Chapter 1 General Information

Performance Specifications
Performance specifications are provided in Table 1-1. All specifications apply when cali-
brated at ambient temperature after a five minute warm up. Typical values are given for ref-
erence, and are not guaranteed.
1-6
Chapter 1 General Information
Cable and Antenna Analyzer
Frequency Range: 25 MHz to 4000 MHz
Frequency Accuracy: � � 75 ppm @ +25°C
Frequency Resolution: 100 kHz
Output Power: < 0 dBm (–10 dBm nominal)
Immunity to Interfering Signals: on-channel +17 dBm
on-frequency –5 dBm
Measurement speed: � 3.5 msec / data point (CW ON)
Number of data points: 130 or 259 or 517
Return Loss:
Range: 0.00 to 60.00 dB
Resolution: 0.01 dB
VSWR:
Range: 1.00 to 65.00
Resolution: 0.01
Cable Loss:
Range: 0.00 to 30.00 dB
Resolution: 0.01 dB
Measurement Accuracy: > 42 dB corrected directivity after calibration
Distance-To-Fault
Vertical Range:
Return Loss: 0.00 to 60.00 dB
VSWR: 1.00 to 65.00
Horizontal Range: 0 to (# of data pts –1) x Resolution to a maximum of
1197m (3929 ft)
# of data pts = 130, 259 or 517
Horizontal Resolution (rectangular windowing):
Resolution (meters) = (1.5 x 10⁸) x (Vp)/DF
Where Vp is the relative propagation velocity of the cable and DF is the stop frequency minus the
start frequency (in Hz).
Spectrum Analyzer
Frequency Range: 100 kHz to 3000 MHz (tunable to 9 kHz)
Frequency Reference (internal timebase):
Aging: ± 1 ppm/yr
Accuracy: ± 2 ppm
Frequency Span: 10 Hz to 2.99 GHz in 1, 2, 5 step selections in auto mode,
plus zero span
Table 1-1. Performance Specifications (1 of 7)
1-7
Chapter 1 General Information
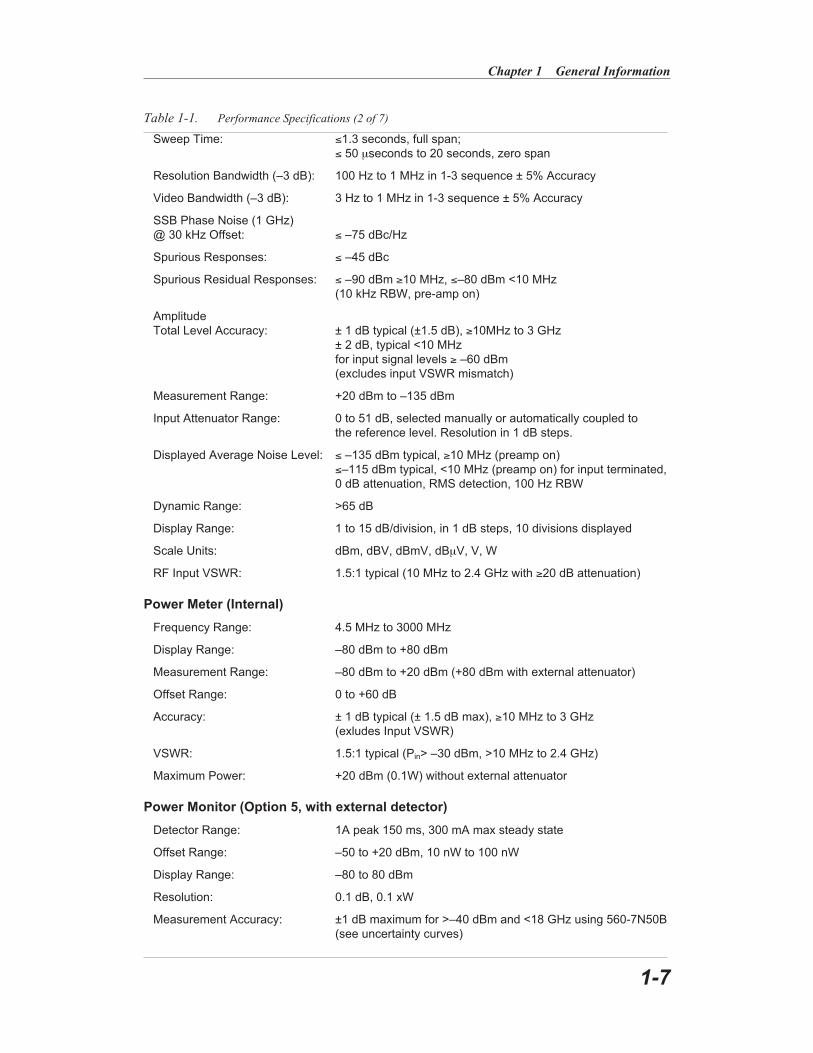
Sweep Time: �1.3 seconds, full span;
� 50 �seconds to 20 seconds, zero span
Resolution Bandwidth (–3 dB): 100 Hz to 1 MHz in 1-3 sequence ± 5% Accuracy
Video Bandwidth (–3 dB): 3 Hz to 1 MHz in 1-3 sequence ± 5% Accuracy
SSB Phase Noise (1 GHz)
@ 30 kHz Offset: � –75 dBc/Hz
Spurious Responses: � –45 dBc
Spurious Residual Responses: � –90 dBm 10 MHz, �–80 dBm <10 MHz
(10 kHz RBW, pre-amp on)
Amplitude
Total Level Accuracy: ± 1 dB typical (±1.5 dB), 10MHz to 3 GHz
± 2 dB, typical <10 MHz
for input signal levels –60 dBm
(excludes input VSWR mismatch)
Measurement Range: +20 dBm to –135 dBm
Input Attenuator Range: 0 to 51 dB, selected manually or automatically coupled to
the reference level. Resolution in 1 dB steps.
Displayed Average Noise Level: � –135 dBm typical, 10 MHz (preamp on)
�–115 dBm typical, <10 MHz (preamp on) for input terminated,
0 dB attenuation, RMS detection, 100 Hz RBW
Dynamic Range: >65 dB
Display Range: 1 to 15 dB/division, in 1 dB steps, 10 divisions displayed
Scale Units: dBm, dBV, dBmV, dB�V, V, W
RF Input VSWR: 1.5:1 typical (10 MHz to 2.4 GHz with 20 dB attenuation)
Power Meter (Internal)
Frequency Range: 4.5 MHz to 3000 MHz
Display Range: –80 dBm to +80 dBm
Measurement Range: –80 dBm to +20 dBm (+80 dBm with external attenuator)
Offset Range: 0 to +60 dB
Accuracy: ± 1 dB typical (± 1.5 dB max), 10 MHz to 3 GHz
(exludes Input VSWR)
VSWR: 1.5:1 typical (Pin> –30 dBm, >10 MHz to 2.4 GHz)
Maximum Power: +20 dBm (0.1W) without external attenuator
Power Monitor (Option 5, with external detector)
Detector Range: 1A peak 150 ms, 300 mA max steady state
Offset Range: –50 to +20 dBm, 10 nW to 100 nW
Display Range: –80 to 80 dBm
Resolution: 0.1 dB, 0.1 xW
Measurement Accuracy: ±1 dB maximum for >–40 dBm and <18 GHz using 560-7N50B
(see uncertainty curves)
Table 1-1. Performance Specifications (2 of 7)

1-8
Chapter 1 General Information
Bias Tee (Option 10A)
Voltage: +12 to +24 Vdc (variable in 1V steps)
Power Maximum: 6W, steady state
High Accuracy Power Meter (Option 19, with PSN50 Power Sensor)
Sensor:
Measurement Range: –30 to +20 dBm
Frequency Range: 50 MHz to 6 GHz
Input Connector: Type N, male, 50�
Max Input Without Damage: +33 dBm, ± 25 VDC
Input Return Loss : 50 MHz to 2 GHz: 26 dB
2 GHz to 6 GHz: 20 dB
Accuracy:
Total RSS Meas. Uncertainty: CW signals: ± 0.16 dB (0 to 50�C)*
Noise: 20 nW max
Zero Set: 20 nW
Zero Drift: 10 nW max**
Instrumentation Accuracy: 0.00 dB
Sensor Linearity: ± 0.13 dB max
Sensor Cal Factor Uncertainty: ± 0.06 dB
Temperature Compensation: ± 0.06 dB max
Continuous digital modulation uncertainty:
+0.06 dB (+17 to +20 dBm)
System:
Measurement Resolution: 0.01 dB
Offset Range: ± 60dB
Power Requirements:
Supply Voltage: 8 to 18 Vdc
Supply Current: <100 mA
*Excludes mismatch errors. Excludes noise, zero set, zero drift for levels <-20 dBm. Excludes digital modula-tion uncertainty between +17 and +20 dBm.
**After 30 minute warm-up
Transmission Measurement (Option 21)
RF Source,
Frequency Range: 25 MHz to 3 GHz
Frequency Resolution: 10 Hz
Output Power Level: –10 dBm typical (up to –90 dBm with external attenuator)
Table 1-1. Performance Specifications (3 of 7)

1-9
Chapter 1 General Information
Dynamic Range: 80 dB, 25 MHz to 2 GHz
60 dB, >2 GHz to 3 GHz
Output Impedance: 50�
Interference Analysis (Option 25)
Audible tone - identify interference type
Strength of the Interferer
RSSI
Spectrogram
Channel Scanner (Option 27)
Frequency Range: 100 kHz to 3.0 GHz
Frequency Accuracy: � 10 Hz + Time base error, 99% confidence level
Measurement Range: +20 dBm to –110 dBm
Channel Power: � 1 dB typical (� 1.5 dB max)
Adjacent Channel Pwr Accuracy: � 0.75 dBc
GPS (Option 31)
GPS Location Indicator
Latitude, Longitude and Altitude on Display
Latitude, Longitude and Altitude with Trace Storage
cdmaOne and CDMA2000 1xRTT Over The Air (Option 33)
EVDO Over The Air (Option 34)
Over The Air Measurement: Six strongest pilots with Tau and Ec/Io
Two multipaths relative to strongest pilot
Tau: ±2 µs
GSM - RF Measurements (Option 40)
Occupied Bandwidth: Bandwidth within which 99% of the power transmitted on
a single channel lies.
Channel power: �1 dB typical (�1.5 dB max)
Burst power: �1 dB typical for –20 dBm to +20 dBm (�1.5 dB max)
�1.75 dB typical for –80 dBm to –20 dBm (�2 dB max)
Frequency error: �10 Hz + Time base error, 99% confidence level
CDMA - RF Measurements (Option 42)
EVDO RF Measurements (Option 62)
Occupied Bandwidh: Bandwidth within which 99% of the power transmitted on a
single channel lies
Channel power: �1 dB typical (�1.5 dB max)
Frequency error: �50 Hz + Time base error, 99% confidence level
Table 1-1. Performance Specifications (4 of 7)

1-10
Chapter 1 General Information
EVDO: Idle and active power versus time graph
cdmaOne and CDMA2000 1xRTT Demodulator (Option 43)
Residual Rho: 0.98 for RF input from +20 dBm to –48 dBm
Rho Accuracy: �0.01 for 0.9
Code domain power (CDP): Accurate to within ±1.5 dB above –20dB for RF input
from +20dBm to –48 dBm
CDP can be displayed for RF input from +20dBm to –90 dBm
Tone Generator: Frequency: 100 Hz to 3000 Hz
Level: –30 to 0 dBm, 1 dB steps
Carrier Freq Error: �50 Hz 99% confidence level
Power Accuracy: �1 dB typical (�1.5 dB absolute)
PN Offset: within 1 � 64 chips
Pilot Time Alignment (tau): within 2 chips
Pilot Power: �1.5 dB typical
T1 Analyzer (Option 50)
Line Coding: AMI, B8ZS
Framing Modes: D4 (Superframe), ESF (Extended Superframe)
Connection Configurations: Terminate (100�)
Bridge ( 1000�)
Monitor (Connect via 20 dB pad in DSX)
Receiver Sensitivity: 0 to –36 dBdsx
Transmit Level: 0 dB, –7.5 dB, and –15 dB
Clock Sources: External
Internal: 1.544 MHz ± 30 ppm
Pulse Shapes: Conform to ANSI T1.403
Pattern Generation & Detection: PRBS: 2-9, 2-11, 2-15, 2-20, 2-23 Inverted and non-inverted,
QRSS, 1-in-8 (1-in-7), 2-in-8, 3-in-24, All ones, All zeros,
T1-Daly, User defined (� 32 bits)
Circuit Status Reports: Carrier present, Frame ID and Sync., Pattern ID and Sync.
Alarm Detection: AIS (Blue Alarm), RAI (Yellow Alarm)
Error Detection: Frame Bits, Bit, BER, BPV, CRC, Error Sec
Error Insertion: Bit, BPV, Framing Bits, RAI, AIS
Loopback Modes: Self loop, CSU, NIU, user defined, In-band or Data Link
Level Measurements: Vp-p (± 5%), dBdsx
Data Log: Continuous, up to 48 hrs
T1 Frequency: �10 ppm
Table 1-1. Performance Specifications (5 of 7)

1-11
Chapter 1 General Information
DS0 Channel Access
Tone Generator
Frequency: 100 Hz to 3000 Hz
Level: –30 to 0 dBm, 1 dB steps
Audio Monitor: Manually select channel 1-24
VF Measurement: Frequency: 100 Hz to 3000 Hz, �2 Hz
Level: –40.0 to +3.0 dBm, �0.2 dBm
ITU-T G.821 Analysis: Errored seconds, error free seconds, severely errored
seconds, unavailable seconds, available seconds, degraded
minutes
E1 Analyzer (Option 50)
Line Coding: AMI, HDB3
Framing Modes: PCM30, PCM30CRC, PCM31, PCM31CRC
Connection Configurations: Terminate (75�, 120�)
Bridge (1000�)
Monitor (Connect via 20 dB pad in DSX)
Receiver Sensitivity: 0 to –43 dB
Clock Sources: External
Internal, 2.048 MHz ± 30 ppm
Pulse Shapes: Conform to ITU G.703
Pattern Generation and Detection:
PRBS: 2-9, 2-11, 2-15, 2-20, 2-23 Inverted and
non-inverted, QRSS, 1-in-8 (1-in-7), 2-in-8, 3-in-24,
All ones, All zeros, T1-Daly, User defined (� 32 bits)
Circuit Status Reports: Carrier present, Frame ID and Sync., Pattern ID and Sync.
Alarm Detection: AIS, RAI, MMF
Error Detection: Frame Bits, Bit, BER, BPV, CRC, E-Bits, Error Sec
Error Insertion: Bit, BPV, Framing Bits, RAI, AIS
Loopback Modes: Self loopback
Level Measurements: Vp-p (± 5%), dBdsx
Data Log: Continuous, up to 48 hrs
E1 Frequency: �10 ppm
VF Channel Access
Tone Generator Frequency: 100 Hz to 3000 Hz
Level: –30 to 0 dBm
Audio Monitor: Manually select channel 1-31
VF Measuremen:
Frequency: 100 Hz to 3000 Hz �2 Hz
Level: –40.0 to +3.0 dBm �0.2 dBm
Table 1-1. Performance Specifications (6 of 7)

1-12
Chapter 1 General Information
ITU-T G.821 Analysis: Errored seconds, error free seconds, severely errored
seconds, unavailable seconds, available seconds, degraded
minutes
EVDO Demodulator (Option 63)
Rho Accuracy: ±0.02 for 0.9<r<1
Code Domain Power Display: Demodulation from –80 dBm to +15 dBm
Code Domain Power (CDP): ±1 dB when > -20 dB relative to Tx power
Mac Code Power: ±1 dB CDP level > -20 dB rel to total power in MAC interval
Data Code Power: ±1 dB for non-idle slot data
Frequency Accuracy: ±50 Hz + timebase error for 99% of measurements
Channel Power: ±1 dB typical (±1.5 dB absolute)
Pilot Power: ±1 dB typical (±1.5 dB absolute)
General
Language Support: English, Spanish, French, German, Chinese, Japanese
Internal Trace Memory: Up to 300 traces
Setup Configurations: 25 (10 VNA, 5 SPA/CDMA/GSM/EVDO, 5 Pwr Meter/T1/E1)
Display: TFT Color display with adjustable backlight
Inputs and Outputs Ports:
RF Out: Type N, female, 50�Maximum Input without Damage: +23 dBm, ± 50 VDC
RF In: Type N, female, 50�Maximum Input without Damage: +43 dBm (Peak), ± 50 VDC
Ext. Trig In: BNC, female (5V TTL)
Ext. Freq Ref In (2 to 20 MHz): Shared BNC, female, 50�, (–15 dBm to +10 dBm)
Serial Interface: RS-232 9 pin D-sub, three wire serial
GPS Antenna: Reverse BNC
T1/E1 (Receive & Transmit): Bantam Jack
RF Detector Type N
Electromagnetic Compatibility: Meets European Community requirements for CE marking
Safety: Conforms to EN 61010-1 for Class 1 portable equipment
Temperature:
Operating: -10°C to 55°C, humidity 85% or less
Non-operating: –51°C to +71°C (recommend battery stored separately
between 0°C and +40°C for any prolonged non-operating
storage period)
Power Supply:
External DC Input: +12.0 to +15 VDC, 5A
Internal: NiMH battery: 10.8 volts, 1800 mA maximum
Dimensions:
Size (w x h x d): 25.4 cm x 17.8 cm x 6.1 cm (10.0 in x 7.0 in x 2.4 in)
Weight: < 2.28 kg (< 5 lbs) including battery
Table 1-1. Performance Specifications (7 of 7)

Preventive Maintenance
Cell Master preventive maintenance consists of cleaning the unit and inspecting and clean-
ing the RF connectors on the instrument and all accessories.
Clean the Cell Master with a soft, lint-free cloth dampened with water or water and a mild
cleaning solution.
CAUTION: To avoid damaging the display or case, do not use solvents or abra-
sive cleaners.
Clean the RF connectors and center pins with a cotton swab dampened with denatured alco-
hol. Visually inspect the connectors. The fingers of the N (f) connectors and the pins of the
N (m) connectors should be unbroken and uniform in appearance. If you are unsure whether
the connectors are good, gauge the connectors to confirm that the dimensions are correct.
Visually inspect the test port cable(s). The test port cable should be uniform in appearance,
not stretched, kinked, dented, or broken.
Calibration
The Cell Master is a field portable unit operating in the rigors of the test environment. An
Open-Short-Load (OSL) calibration, InstaCal calibration, FlexCal calibration with
open-short-load, or FlexCal calibration with an InstaCal module should be performed prior
to making a measurement in the field (see Calibration, page 3-2). A built-in temperature
sensor in the Cell Master advises the user when the internal temperature has exceeded a
measurement accuracy window, and the user is advised to perform another calibration in or-
der to maintain the integrity of the measurement.
NOTES:
For best calibration results—compensation for all measurement uncertain-
ties—ensure that the Open/Short/Load is at the end of the test port or optional
extension cable; that is, at the same point that you will connect the antenna or
device to be tested.
For best results, use a phase stable Test Port Extension Cable (see Optional
Accessories). If you use a typical laboratory cable to extend the Cell Master test
port to the device under test, cable bending subsequent to the OSL calibration
will cause uncompensated phase reflections inside the cable. Thus, cables
which are NOT phase stable may cause measurement errors that are more pro-
nounced as the test frequency increases.
For optimum calibration, Anritsu recommends using precision calibration com-
ponents.
1-13
Chapter 1 General Information

InstaCal Module
The Anritsu InstaCal module can be used in place of discrete components to calibrate the
Cell Master. The InstaCal module can be used to perform an Open, Short and Load (OSL)
or a FlexCal calibration procedure. Calibration of the Cell Master with the InstaCal takes
approximately 45 seconds (see Calibration, page 3-2). Unlike a discrete calibration compo-
nent, the InstaCal module can not be used at the top of the tower to conduct load or inser-
tion loss measurements. The module operates from 2 MHz to 4 GHz and weighs eight
ounces.
Anritsu recommends annual verification of the InstaCal module to verify performance with
precision instrument data. The verification may be performed at a local Anritsu Service
Center or at the Anritsu factory.
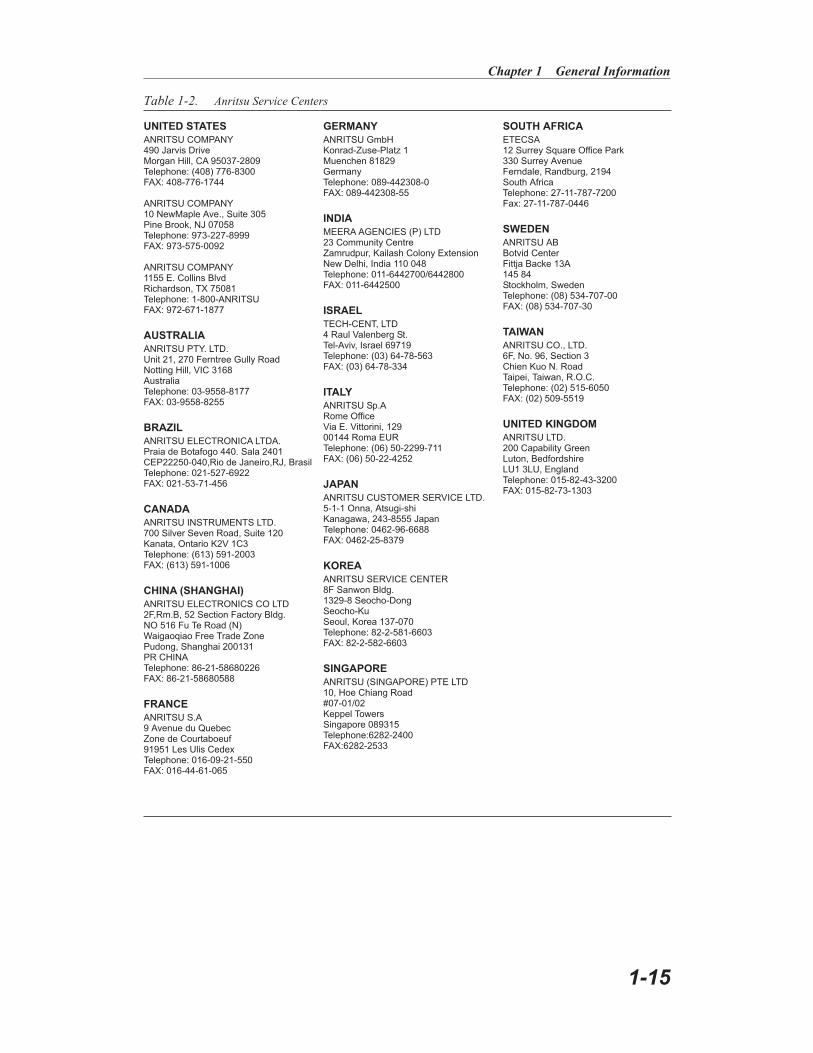
Annual Verification
Anritsu recommends an annual calibration and performance verification of the Cell Master
and the OSL calibration components and InstaCal module by local Anritsu service centers.
Anritsu service centers are listed in Table 1-2 on the following page.
The Cell Master itself is self-calibrating, meaning that there are no field-adjustable compo-
nents. However, the OSL calibration components are crucial to the integrity of the calibra-
tion and therefore, must be verified periodically to ensure performance conformity. This is
especially important if the OSL calibration components have been accidentally dropped or
over-torqued.
ESD Precautions
The Cell Master, like other high performance instruments, is susceptible to ESD damage.
Very often, coaxial cables and antennas build up a static charge, which, if allowed to dis-
charge by connecting to the Cell Master, may damage the Cell Master input circuitry. Cell
Master operators should be aware of the potential for ESD damage and take all necessary
precautions. Operators should exercise practices outlined within industry standards like
JEDEC-625 (EIA-625), MIL-HDBK-263, and MIL-STD-1686, which pertain to ESD and
ESDS devices, equipment, and practices.
As these apply to the Cell Master, it is recommended to dissipate any static charges that
may be present before connecting the coaxial cables or antennas to the Cell Master. This
may be as simple as temporarily attaching a short or load device to the cable or antenna
prior to attaching to the Cell Master. It is important to remember that the operator may also
carry a static charge that can cause damage. Following the practices outlined in the above
standards will insure a safe environment for both personnel and equipment.
Mode References
The term “VNA” in reference to the Cell Master denotes cable and antenna analyzer modes.
The term “SPA” in reference to the Cell Master denotes Spectrum Analyzer mode. All
other modes are referenced individually.
1-14
Chapter 1 General Information
1-15
Chapter 1 General Information
UNITED STATES
ANRITSU COMPANY490 Jarvis DriveMorgan Hill, CA 95037-2809Telephone: (408) 776-8300FAX: 408-776-1744
ANRITSU COMPANY10 NewMaple Ave., Suite 305Pine Brook, NJ 07058Telephone: 973-227-8999FAX: 973-575-0092
ANRITSU COMPANY1155 E. Collins BlvdRichardson, TX 75081Telephone: 1-800-ANRITSUFAX: 972-671-1877
AUSTRALIA
ANRITSU PTY. LTD.Unit 21, 270 Ferntree Gully RoadNotting Hill, VIC 3168AustraliaTelephone: 03-9558-8177FAX: 03-9558-8255
BRAZIL
ANRITSU ELECTRONICA LTDA.Praia de Botafogo 440. Sala 2401CEP22250-040,Rio de Janeiro,RJ, BrasilTelephone: 021-527-6922FAX: 021-53-71-456
CANADA
ANRITSU INSTRUMENTS LTD.700 Silver Seven Road, Suite 120Kanata, Ontario K2V 1C3Telephone: (613) 591-2003FAX: (613) 591-1006
CHINA (SHANGHAI)
ANRITSU ELECTRONICS CO LTD2F,Rm.B, 52 Section Factory Bldg.NO 516 Fu Te Road (N)Waigaoqiao Free Trade ZonePudong, Shanghai 200131PR CHINATelephone: 86-21-58680226FAX: 86-21-58680588
FRANCE
ANRITSU S.A9 Avenue du QuebecZone de Courtaboeuf91951 Les Ulis CedexTelephone: 016-09-21-550FAX: 016-44-61-065
GERMANY
ANRITSU GmbHKonrad-Zuse-Platz 1Muenchen 81829GermanyTelephone: 089-442308-0FAX: 089-442308-55
INDIA
MEERA AGENCIES (P) LTD23 Community CentreZamrudpur, Kailash Colony ExtensionNew Delhi, India 110 048Telephone: 011-6442700/6442800FAX: 011-6442500
ISRAEL
TECH-CENT, LTD4 Raul Valenberg St.Tel-Aviv, Israel 69719Telephone: (03) 64-78-563FAX: (03) 64-78-334
ITALY
ANRITSU Sp.ARome OfficeVia E. Vittorini, 12900144 Roma EURTelephone: (06) 50-2299-711FAX: (06) 50-22-4252
JAPAN
ANRITSU CUSTOMER SERVICE LTD.5-1-1 Onna, Atsugi-shiKanagawa, 243-8555 JapanTelephone: 0462-96-6688FAX: 0462-25-8379
KOREA
ANRITSU SERVICE CENTER8F Sanwon Bldg.1329-8 Seocho-DongSeocho-KuSeoul, Korea 137-070Telephone: 82-2-581-6603FAX: 82-2-582-6603
SINGAPORE
ANRITSU (SINGAPORE) PTE LTD10, Hoe Chiang Road#07-01/02Keppel TowersSingapore 089315Telephone:6282-2400FAX:6282-2533
SOUTH AFRICA
ETECSA12 Surrey Square Office Park330 Surrey AvenueFerndale, Randburg, 2194South AfricaTelephone: 27-11-787-7200Fax: 27-11-787-0446
SWEDEN
ANRITSU ABBotvid CenterFittja Backe 13A145 84Stockholm, SwedenTelephone: (08) 534-707-00FAX: (08) 534-707-30
TAIWAN
ANRITSU CO., LTD.6F, No. 96, Section 3Chien Kuo N. RoadTaipei, Taiwan, R.O.C.Telephone: (02) 515-6050FAX: (02) 509-5519
UNITED KINGDOM
ANRITSU LTD.200 Capability GreenLuton, BedfordshireLU1 3LU, EnglandTelephone: 015-82-43-3200FAX: 015-82-73-1303
Table 1-2. Anritsu Service Centers

Chapter 2
Functions and Operations
Introduction
This chapter provides a brief overview of the Cell Master functions and operations, provid-
ing the user with a starting point for making basic measurements. For more detailed infor-
mation, refer to the specific chapters for the measurements being made.
The Cell Master is designed specifically for field environments and applications requiring
mobility. As such, it is a lightweight, handheld, battery operated unit which can be easily
carried to any location, and is capable of up to 1.5 hours of continuous operation from a
field replaceable battery for extended time in the field. Built-in energy conservation fea-
tures allow battery life to be further extended. The Cell Master can also be powered by a
12Vdc external source. The external source can be either the Anritsu AC-DC Adapter (P/N
40-168) or 12Vdc Automotive Cigarette Lighter Adapter (P/N 806-141). Both items are
standard accessories.
Connector Panel
The connectors and indicators located on the test panel (Figure 2-1) are listed and described
below. The illustration depicts an MT8212B with Option 50, T1/E1 installed.
External
Power
12- 15 VDC
(3A)
12 to 15 VDC @ 5A external input to power the unit or for battery charging.
WARNING
When using the AC-DC Adapter, always use a three-wire power cable connected
to a three-wire power line outlet. If power is supplied without grounding the equip-
ment in this manner, there is a risk of receiving a severe or fatal electric shock, or
damaging the equipment.
2-1
SERIAL INTERFACE
HEADPHONE JACK
EXTERNAL POWER
EXTERNAL FREQ REF / EXT TRIGGER
EXTERNAL POWER LED
BATTERYCHARGING LED
RF IN
GPS ANTENNA
RF OUTCDMA TIMING INPUT
T1 / E1or RF DETECTOR
(OPTION 5)
Figure 2-1. MT8212B Test Connector Panel

Battery
Charging LED
Illuminates when the battery is being charged. The indicator automatically shuts
off when the battery is fully charged.
External
Power LED
Illuminates when the Cell Master is being powered by the external charging
unit.
Serial
Interface
RS232 DB9 interface to a COM port on a personal computer (for use with the
Anritsu Handheld Software Tools program) or to a supported printer.
RF Out/
Reflection 50�
RF output, 50 � impedance, for reflection measurements. Maximum input is
+23 dBm at �50 Vdc.
Spectrum
Analyzer
RF In 50�
RF input, 50 � impedance, for spectrum analysis measurements. Maximum in-
put is +43 dBm at �50 Vdc.
Ext Freq Ref/
Ext Trigger
Input for an external frequency reference signal or trigger in Spectrum Analyzer
mode.
T1/E1
Receive/
Transmit
Transmit and Receive connectors for T1 and E1 measurements (Option 50)
RF Detector RF detector connector for Power Monitor measurements (Option 5). Refer to the
table of available RF Detectors on page 1-5.
Headphone
Jack
Provides audio output for the built-in AM/FM demodulator for testing and trou-
bleshooting wireless communication systems. Also provides audio output for
DS0/E0 monitoring.
GPS Antenna GPS antenna connection. Do not connect anything other than the Anritsu GPS
antenna to this port.
CDMA Timing
Input
Input for an Even Second Time Mark (ESTM) or Pulse Per 2 Second (PP2S) to
provide a timing reference for CDMA measurements.
2-2
Chapter 2 Functions and Operations

Display Overview
Figure 2-2 illustrates some of the key information areas of the MT8212B display in cable
and antenna analyzer modes.
Figure 2-3 illustrates some of the key information areas of the MT8212B display in Spec-
trum Analyzer mode.
Chapter 2 Functions and Operations
2-3
TITLE BARDATA
POINTS
SWEEPTIME
CALIBRATIONSTATUS
MESSAGE AREA
CURRENTMENU
Figure 2-2. MT8212B Distance-To-Fault Display Overview
TITLE BAR
SWEEPMODE
DETECTIONMETHOD
PREAMPLIFIERSTATE
MESSAGE AREA
CURRENTMENU
Figure 2-3. MT8212B Spectrum Analyzer Mode Display Overview

Front Panel Overview
The Cell Master menu-driven user interface is easy to use and requires little training. Hard
keys on the front panel are used to initiate function-specific menus. There are four function
hard keys located below the status window: Mode, Frequency/Distance, Amplitude and
Measure/Display.
There are seventeen keypad hard keys located to the right of the status window. Twelve of
the keypad hard keys perform more than one function, depending on the current mode of
operation. The dual purpose keys are labeled with one function in black, the other in blue.
There are also six soft keys that change function depending upon the current mode selec-
tion. The current soft key function is indicated in the soft key menu area to the right of the
status window. The locations of the different keys are illustrated in Figure 2-4.
The following sections describe the various key functions.
2-4
Chapter 2 Functions and Operations
Soft Keys
Soft KeyMenu
Status WindowKeypadHardKeys
Function Hard Keys
HOLDRUN
STARTCAL
AUTOSCALE
SAVESETUP
RECALLSETUP
LIMIT MARKER
SAVEDISPLAY
RECALLDISPLAY
MODE FREQ/DIST AMPLITUDE MEAS/DISP
SYS
ENTER
CLEAR
ESCAPE
ON
OFF
/
1 2
4
5 6
7 8
9 0
3
+-
.
MT8212B CellMaster
Figure 2-4. Cell Master Front Panel

Function Hard Keys
MODE Opens the mode selection box (below). Use the Up/Down arrow key to select a
mode. Press the ENTER key to implement.
NOTE: Available mode selections will vary according to the options installed.
FREQ/DIST Displays the Frequency or Distance to Fault soft key menus depending on the
measurement mode.
AMPLITUDE Displays the amplitude soft key menu for the current operating mode.
MEAS/DISP Displays the measurement and display soft key menus for the current operating
mode.
Chapter 2 Functions and Operations
2-5
Measurement Mode
Freq - SWR
Return Loss
Cable Loss - One Port
DTF - SWR
Return Loss
Power Monitor (External Detector)
Power Meter (Internal)
Spectrum Analyzer
Interference Analyzer
T1 Tester
E1 Tester
CDMA
EVDO
GSM
Transmission Measurement
Channel Scanner
CW Signal Generator
Figure 2-5. Mode Selection Box Example

Keypad Hard Keys
This section contains an alphabetical listing of the Cell Master front panel keypad controls
along with a brief description of each. More detailed descriptions of the major function
keys follow.
The following keypad hard key functions are printed in black on the keypad keys.
0-9 These keys are used to enter numerical data as required to setup or per-
form measurements.
+/– The plus/minus key is used to enter positive or negative values as required
to setup or perform measurements.
� The decimal point is used to enter decimal values as required to setup or
perform measurements.
ESCAPE
CLEAR
Exits the present operation or clears the status window. If a parameter is
being edited, pressing this key will clear the value currently being entered
and restore the last valid entry. Pressing this key again will close the pa-
rameter. During normal sweeping, pressing this key will move up one
menu level.
Up/Down
Arrows
Increments or decrements a parameter value or moves up or down a list.
The specific parameter value affected typically appears in the message
area of the LCD.
ENTER Implements the current action or parameter selection.
ON
OFF
Turns the Anritsu Cell Master on or off. When turned on, the saved sys-
tem state at the last turn-off is restored. If the ESCAPE/CLEAR key is
held down while the ON/OFF key is pressed, the factory preset state will
be restored.
SYS Allows selection of system and application setup parameters and the dis-
play language.
NOTE: Holding down the SYS key while turning the unit on with the On/Off key
will initiate a Full Factory Reset. A Full Factory Reset will erase all saved set-
ups, stored traces, custom antennas, custom cables and signal standards. A
Full Factory Reset is required whenever the unit has been updated with new
firmware.
2-6
Chapter 2 Functions and Operations

The following keypad hard key functions are printed in blue on the keypad keys.
This key is used to adust the brightness of the color display. Use the
Up/Down arrow key and ENTER to adjust the display brightness.
AUTO
SCALE
Automatically scales the status window for optimum resolution in cable
and antenna analyzer mode.
LIMIT Displays the limit line menu for the current operating mode when in cable,
antenna analyzer or spectrum analyzer mode.
MARKER Displays the marker menu of the current operating mode when in cable,
antenna analyzer or spectrum analyzer mode.
PRINT Prints the current display to the selected printer via the RS232 serial port.
RECALL
DISPLAY
Recalls a previously saved trace from memory. When the key is pressed, a
Recall Trace selection box appears on the display. Select a trace using the
Up/Down arrow key and press the ENTER key to implement.
RECALL
SETUP
Recalls a previously saved setup from a memory location. When the key
is pressed, a Recall Setup selection box appears on the display. Select a
setup using the Up/Down arrow key and press the ENTER key to imple-
ment. Setup 0 recalls the factory preset state for the current mode.
RUN
HOLD
When in the Hold mode, this key starts the Cell Master sweeping and pro-
vides a Single Sweep Mode trigger; when in the Run mode, it pauses the
sweep. When in the Hold mode, the hold symbol (page 2-98) appears on
the display. Hold mode can be used to conserve battery power.
SAVE
DISPLAY
Saves up to 200 displayed traces to non-volatile memory. When the key is
pressed, the Trace Name: box appears. Use the soft keys to enter up to 16
alphanumeric characters for that trace name and press the ENTER key to
save the trace.
SAVE
SETUP
Saves the current system setup to an internal non-volatile memory loca-
tion. The number of locations available varies with the model number and
installed options. There are ten available locations in cable and antenna
analyzer mode, and five in SPA, CDMA and GSM modes. There are five
available locations in Power Meter mode and five each in T1/E1 modes
(Option 50). When the key is pressed, a Save Setup selection box appears
on the status window. Use the Up/Down arrow key to select a setup loca-
tion, use the soft keys to enter a label for the saved setup, and press the
ENTER key to implement.
START
CAL
Starts the calibration in SWR, Return Loss, Cable Loss, or DTF measure-
ment modes (not available in Spectrum Analyzer or Power Meter modes).
Soft Keys
Each keypad key opens a set of soft key selections. Each of the soft keys has a correspond-
ing soft key label area on the status window. The label identifies the function of the soft key
for the current Mode selection.
Chapter 2 Functions and Operations
2-7

Cable and Antenna Analyzer Mode
The following section explains the hard keys and soft keys available when the Cell Master
is set to cable and antenna analyzer mode.
2-8
Chapter 2 Functions and Operations
MODE=Return Loss:
SOFTKEYS: F1
130
F2
259
517
Bottom
SignalStandard
Downlink
Up+Downlink
UplinkPageUp
SelectTrace
PageDown
Back
Back
Bottomof
List
DeleteTrace
DeleteAll
Traces
Top
SelectStandard
Topof
List
On/Off
Resolu-tion
SingleSweep
TraceMath
TraceOverlay
FixedCW
FREQ/DIST AMPLITUDE MEAS/DISP
PageUp
PageDown
Bottomof
List
Topof
List
PageUp
PageDown
Topof
List
Bottomof
List
ShowAll
ShowSelected
Select/Deselect
Figure 2-6. Return Loss Mode Soft Key Labels

Chapter 2 Functions and Operations
2-9
MODE=DTF:
SOFTKEYS:
Bottom
Top
FREQ/DIST AMPLITUDE
D2
DTF Aid
More
D1
Loss
Cable
Window
Back
PropVel
SelectTrace
Back
On/Off
Resolu-tion
SingleSweep
TraceMath
TraceOverlay
FixedCW
MEAS/DISP
DeleteTrace
DeleteAll
Traces
PageUp
PageDown
Bottomof
List
Topof
List
Figure 2-7. Distance to Fault Mode Soft Key Labels
FREQ/DIST Displays the frequency and distance menu depending on the measurement mode.
Frequency
Menu
The frequency and distance menu for cable and antenna analyzer measurements
provides for setting sweep frequency end points when Freq mode is selected. Se-
lected frequency values may be changed using the keypad or Up/Down arrow
key.
� F1 — Opens the F1 parameter for data entry. This is the start value for the
frequency sweep. Press ENTER when data entry is complete.
� F2 — Opens the F2 parameter for data entry. This is the stop value for the
frequency sweep. Press ENTER when data entry is complete.
� Signal Standard — Allows selection of the signal standard to be used.
� Select Standard — Opens the signal standard menu, showing the selected
signal standards. Press the Show All soft key to show the complete signal
standard list. The currently selected signal standards are marked with an
asterisk. Press the Show Selected soft key to show only the selected signal
standards.
� Uplink — Selects only uplink frequencies.
� Downlink — Selects only downlink frequencies.
� Up+Down Link — Selects uplink and downlink frequencies.
� Back — Returns to the previous menu.
Distance
Menu
Provides for setting Distance to Fault parameters when a DTF mode is selected.
Choosing DIST causes the soft keys, below, to be displayed and the correspond-
ing values to be shown in the message area. Selected distance values may be
changed using the keypad or Up/Down arrow key.
� D1 — Opens the start distance (D1) parameter for data entry. This is the start
value for the distance range (D1 default = 0). Press ENTER when data entry
is complete.
� D2 — Opens the end distance (D2) parameter for data entry. This is the end
value for the distance range. Press ENTER when data entry is complete.
� DTF Aid — Provides interactive help to optimize DTF set up parameters. Use
the Up/Down arrow key to select a parameter to edit. Press ENTER when
data entry is complete.
� More — Selects the Distance Sub-Menu, detailed below.
� Loss — Opens the Cable Loss parameter for data entry. Enter the loss per
meter (or foot) for the type of transmission line being tested. Press
ENTER when data entry is complete. (Range is 0.5 to 5.0 dB/m, 1.524
dB/ft)
� Prop Vel (relative propagation velocity) — Opens the Propagation Veloc-
ity parameter for data entry. Enter the propagation velocity for the type of
transmission line being tested. Press ENTER when data entry is complete.
(Range is 0.010 to 1.000)
� Cable — Opens a list of cable three common coaxial folders (1000 MHz,
2000 MHz, and 2500 MHz) and one custom folder. Select either folder and
use the Up/Down arrow key and ENTER to make a selection. This feature
provides a rapid means of setting both cable loss and propagation velocity.
(Refer to Appendix A for a listing of common coaxial cables showing val-
2-10
Chapter 2 Functions and Operations

ues for Relative Propagation Velocity and Nominal Attenuation in dB/m or
dB/ft @ 1000 MHz, 2000 MHz and 2500 MHz.) The custom cable folder
can consist of up to 49 user-defined cable parameters uploaded via the
Handheld Software Tools program.
� Window — Opens a menu of FFT windowing types for the DTF calcula-
tion. Scroll the menu using the Up/Down arrow key and make a selection
with the ENTER key. Refer to Appendix B for more details on window-
ing.
� Back — Returns to the Distance Menu.
AMPLITUDE Choosing the AMPLITUDE key in cable and antenna analyzer measurement
modes causes the soft keys, below, to be displayed and the corresponding values
to be shown in the message area or scale menu depending on the measurement
mode.
� Top — Opens the top parameter for data entry and provides for setting the
top scale value. Press ENTER when data entry is complete.
� Bottom — Opens the bottom parameter for data entry and provides for setting
the bottom scale value. Press ENTER when data entry is complete.
MEAS/DISP Choosing MEAS/DISP in cable and antenna analyzer freq or DTF measurement
modes causes the soft keys below to be displayed.
� Resolution — Opens the status window to change the resolution. Choose 130,
259, or 517 data points. (In DTF mode, resolution can only be adjusted
through the DTF Aid table.)
� Single Sweep — Toggles the sweep between single sweep and continuous
sweep. In single sweep mode, each sweep must be activated by the
RUN/HOLD button.
� Trace Math — Opens up the Trace Math functions (trace-memory or
trace+memory) for comparison of the real time trace in the status window
with any of the traces from memory. (Not available in DTF mode.)
� Trace Overlay — Opens up the Trace Overlay functions menu to allow the
current trace to be displayed with a trace in memory overlaid on it. Choose
On or Off and Select Trace to select the trace from memory to be overlaid.
� Fixed CW — Toggles the fixed CW function ON or OFF. When OFF, a nar-
row band of frequencies around the selected frequency is generated. This en-
hances the immunity of the Cell Master to an interfering signal. When CW is
ON, only a single frequency with a very narrow band width is generated by
the Cell Master. The sweep speed is somewhat faster in CW ON mode. If
CW is ON during normal RL or SWR measurements, it will be more suscep-
tible to interfering signals, so use this feature with caution. Interfering signals
can make the measurement look better or worse than it really is.
Chapter 2 Functions and Operations
2-11

MARKER Choosing MARKER in cable and antenna analyzer freq and dist mode causes
the soft keys, below, to be displayed and the corresponding values to be shown
in the message area. Selected frequency marker or distance marker locations
may be changed using the keypad or Up/Down arrow key.
� M1 — Selects the M1 marker parameter and opens the M1 marker second
level menu.
� On/Off — Turns the selected marker on or off.
� Edit — Opens the selected marker parameter for data entry. Press ENTER
when data entry is complete or ESCAPE to restore the previous value.
� Marker To Peak — Places the selected marker at the frequency or distance
with the maximum amplitude value.
� Marker To Valley — Places the selected marker at the frequency or dis-
tance with the minimum amplitude value.
� Back — Returns to the Main Markers Menu.
� M2 through M4 — Selects the marker parameter and opens the marker second
level menu.
� On/Off — Turns the selected marker on or off.
� Edit — Opens the selected marker parameter for data entry. Press ENTER
when data entry is complete or ESCAPE to restore the previous value.
� Delta (Mx-M1) — Displays delta amplitude value as well as delta fre-
quency or distance for the selected marker with respect to the M1 marker.
� Marker To Peak — Places the selected marker at the frequency or distance
with the maximum amplitude value.
� Marker To Valley — Places the selected marker at the frequency or dis-
tance with the minimum amplitude value.
� Back — Returns to the Main Markers Menu.
� All Off — Turns all markers off.
� More — Opens the continuation of the Marker Menus.
� M5 — Selects the M5 marker parameter and opens the M5 second level
menu.
� On/Off — Turns the selected marker on or off.
� Edit — Opens the selected marker parameter for data entry. Press
ENTER when data entry is complete or ESCAPE to restore the pre-
vious value.
� Peak Between M1 & M2 — Places the selected marker at the fre-
quency or distance with the maximum amplitude value between
marker M1 and marker M2.
� Valley Between M1 & M2 — Places the selected marker at the fre-
quency or distance with the minimum amplitude value between
marker M1 and marker M2.
� Back — Returns to the Main Markers Menu.
� M6 — Selects the M6 marker parameter and opens the M6 second level
menu.
� On/Off — Turns the selected marker on or off.
2-12
Chapter 2 Functions and Operations

� Edit — Opens the selected marker parameter for data entry. Press
ENTER when data entry is complete or ESCAPE to restore the pre-
vious value.
� Peak Between M3 & M4 — Places the selected marker at the peak be-
tween marker M3 and marker M4.
� Valley Between M3 & M4 — Places the selected marker at the valley
between marker M3 and marker M4.
� Back — Returns to the Main Markers Menu.
� All Off —Turns all markers off
� Back — Returns to the Main Markers Menu.
LIMIT Pressing LIMIT in cable and antenna analyzer frequency and distance mode acti-
vates a menu of limit related functions. Use the corresponding soft key to select
the desired limit function. Then use the Up/Down arrow key to change its value,
which is displayed in the message area at the bottom of the status window.
NOTE: Limit is only available in cable and antenna analyzer, interference ana-
lyzer, and spectrum analyzer modes.
Choosing LIMIT in Freq or DTF measurement modes causes the soft keys below
to be displayed.
� Single Limit — Sets a single limit value in dBm. Menu choices are:
� On/Off — Turns the single limit function on or off
� Edit — Allows entry of the limit amplitude.
� Back — Returns to the previous menu.
� Multiple Limits — Sets multiple user defined limits, and can be used to create
a limit mask for quick pass/fail measurements.
� Segment 1 through Segment 5 — Opens the segment menu.
� On/Off — Turns the segment on or off.
� Edit — Opens the parameter for data entry.
� Prev Segment — Edit or view the parameters of the previous seg-
ment.
� Next Segment — Edit or view the parameters of the next segment. If
the next segment is off when this button is pressed, the starting point
of the next segment will be set equal to the ending point of the current
segment.
� Back — Returns to the previous menu.
� Back — Returns to the previous menu.
� Limit Beep — Turns the audible limit beep indicator on or off.
Chapter 2 Functions and Operations
2-13

SYS In cable and antenna analyzer mode, pressing the SYS key displays the follow-
ing System menu soft key selections:
� System Options — Displays a second level of system option functions:
� Clock — Displays a second level of functions:
� Hour — Enter the hour (0-23) using the Up/Down arrow key or the
keypad. Press ENTER when data entry is complete or ESCAPE to
restore the previous value.
� Minute — Enter the minute (0-59) using the Up/Down arrow key or
the keypad. Press ENTER when data entry is complete or ESCAPE
to restore the previous value.
� Month — Enter the month (1-12) using the Up/Down arrow key or the
keypad. Press ENTER when data entry is complete or ESCAPE to
restore the previous value.
� Day — Enter the day using the Up/Down arrow key or the keypad.
Press ENTER when data entry is complete or ESCAPE to restore the
previous value.
2-14
Chapter 2 Functions and Operations
SystemOptions
Hour
ApplicationOptions
Clock
Status
Minute
SelfTest
Month LanguageEnglish
Day
Year
Units
GPSOn/Off
PrinterCAL
Mode
ChangeDate
Format
Back
Back
Back Location
Quality
Reset
Back
GPS
Figure 2-8. SYS Key Menu in Cable and Antenna Analyzer Mode

� Year — Enter the year (2003-2036) using the Up/Down arrow key or
the keypad. Press ENTER when data entry is complete or ESCAPE
to restore the previous value.
� Back — Returns to the top-level SYS menu.
� Printer — Displays a menu of supported printers. Use the Up/Down arrow
key and ENTER key to make the selection.
� Units — Select the unit of measurement (metric or English).
� Change Date Format — Toggles the date format between
MM/DD/YYYY, DD/MM/YYYY, and YYYY/MM/DD.
� Back — Returns to the top-level SYS menu.
� Application Options — Application options displays options applicable to par-
ticular mode.
� CAL Mode — In cable and antenna analyzer modes, selects either OSL Cal
or FlexCal�. FlexCal is a broadband frequency calibration valid from 25
MHz to 4 GHz. Refer to Calibration, page 3-2, for more information.
� Back — Returns to the top-level SYS menu.
� Self Test — Start an instrument self test.
� Status — In cable and antenna analyzer freq or dist measurement mode, dis-
plays the current instrument status, including calibration status, temperature,
and battery charge state. Press ESCAPE to return to operation.
� GPS — Opens the GPS soft key menu.
� Press the GPS On/Off soft key to turn the GPS feature on or off.
� Press the Location soft key to view the latitude, longitude and altitude in-
formation and UTC timing.
� Press the Quality soft key to display the number of tracked satellites and
the GPS quality.
� Press the Reset soft key to reset the GPS.
� Back — Returns to the previous menu.
� Language — Pressing this soft key immediately changes the language used to
display messages on the Cell Master status window. Choices are English,
French, German, Spanish, Chinese, and Japanese. The default language is
English.
Chapter 2 Functions and Operations
2-15

Spectrum Analyzer Mode
The following section explains the hard keys and soft keys available when the Cell Master
is set to Spectrum Analyzer mode.
2-16
Chapter 2 Functions and Operations
MODE=SPECTRUM ANALYZER:
SOFTKEYS: Center
Span
Start
Stop
SelectChannel
SignalStandard
Scale
Atten/Preamp
Units
RefLevelOffset
RefLevel
FREQ/DIST AMPLITUDE
Edit
Full
Zero
SpanUp
1-2-5
Back
SpanDown1-2-5
dBm
EditdBV
MeasureOffsetdBmV
dBuV
BACK
Linear
Back
Auto
Auto
Manual
Manual
Dynamic
Dynamic
Back
Back
PreampControlManual
PreampAuto
PreampOn/Off
Downlink
UplinkPageUp
PageDown
Back
Bottomof
List
SelectStandard
Topof
List
PageUp
PageDown
Topof
List
Bottomof
List
ShowAll
ShowSelected
Select/Deselect
Edit
ShiftLeft
1 Div
ShiftLeft
9 Div
ShiftRight1 Div
ShiftRight9 Div
Back
Figure 2-9. Spectrum Analyzer Mode Soft Key Labels
Chapter 2 Functions and Operations
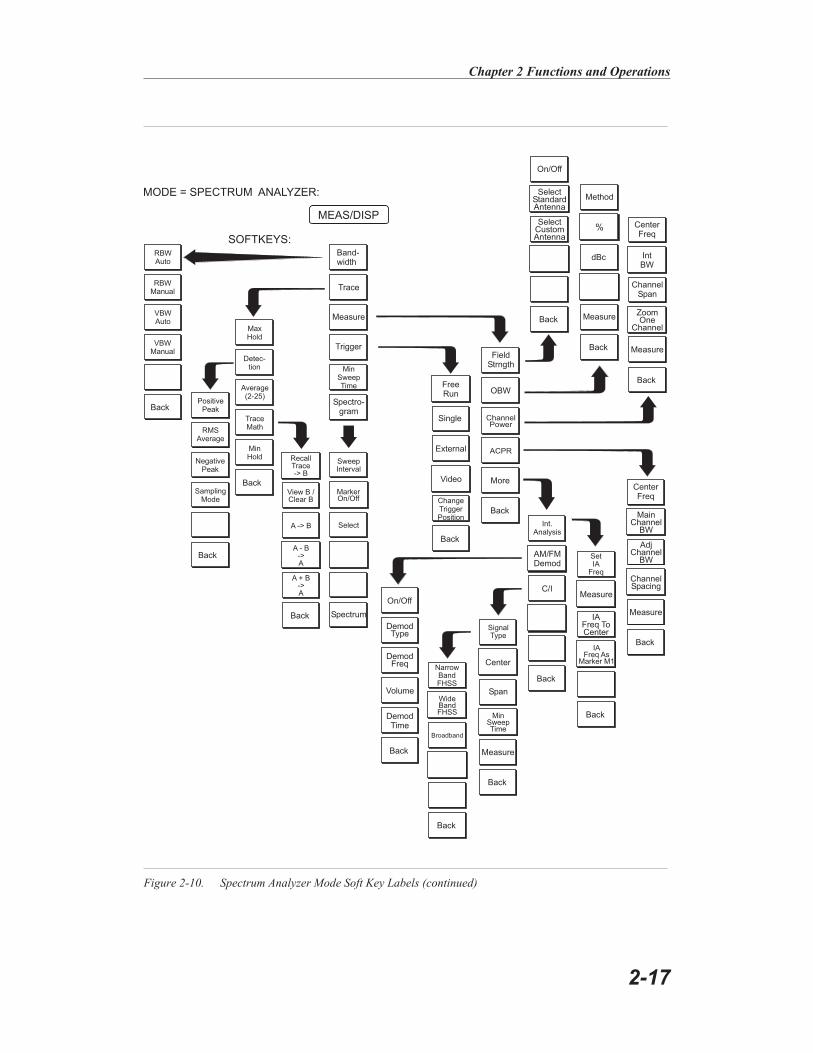
2-17
MODE = SPECTRUM ANALYZER:
SOFTKEYS:Band-width
Measure
Trigger
Spectro-gram
Measure
Trace
MEAS/DISP
MaxHold
PositivePeak
Average(2-25)
NegativePeak
RecallTrace-> B
View B /Clear B
A -> B
A - B->A
A + B->A
FreeRun
Method
On/Off
ACPR
Detec-tion
RMSAverage
TraceMath
MinSweepTime
MinHold
SamplingMode
Single
dBc
%
SelectStandardAntenna
SelectCustomAntenna
OBW
Video
ChangeTriggerPosition
Back
MoreBack
Back
RBWAuto
VBWAuto
RBWManual
VBWManual
Back
Back
Back
Back
Back
Measure
Measure
CenterFreq
CenterFreq
SetIA
Freq
SignalType
NarrowBandFHSS
AdjChannel
BW
ChannelSpacing
ChannelSpan
ZoomOne
Channel
MainChannel
BW
Measure
Measure
Center
WideBandFHSS
C/I
IAFreq ToCenter
Span
Broadband
IAFreq As
Marker M1
MinSweepTime
IntBW
Back
Back
Back
Back
Back
SweepInterval
MarkerOn/Off
Select
Spectrum
Back
External
Int.Analysis
ChannelPower
FieldStrngth
AM/FMDemod
DemodType
DemodFreq
On/Off
Volume
DemodTime
Back
Figure 2-10. Spectrum Analyzer Mode Soft Key Labels (continued)

FREQ/DIST Choosing FREQ/DIST in Spectrum Analyzer mode causes the soft keys, below,
to be displayed and the corresponding values to be shown in the message area.
� Center � Sets the center frequency of the Spectrum Analyzer. Enter a value
using the Up/Down arrow key or keypad, press ENTER to accept, ESCAPE
to restore previous value.
� Edit allows editing of the center frequency. Enter a value using the
Up/Down arrow key or keypad.
� Shift Left 1 Div shifts the center frequency left by one division.
� Shift Left 9 Div shifts the center frequency left by nine divisions.
� Shift Right 1 Div shifts the center frequency right by one division.
� Shift Right 9 Div shifts the center frequency right by nine divisions.
� Span � Sets the user-defined frequency span. Use the Up/Down arrow key
or keypad to enter a value in MHz. Also brings up Full and Zero soft keys.
� Edit allows editing of the frequency span. Enter a value using the number
keys.
� Full span sets the Spectrum Analyzer to its maximum frequency span.
� Zero span sets the span to 0 Hz. This displays the input signal in an ampli-
tude versus time mode, which is useful for viewing modulation.
� Span Up 1-2-5 activates the span function so that the span may be in-
creased quickly in a 1-2-5 sequence.
� Span Down 1-2-5 activates the span function so that the span may be re-
duced quickly in a 1-2-5 sequence.
� Back returns to the previous menu level.
� Start � Sets the Spectrum Analyzer in the START-STOP mode. Enter a
start frequency value (in kHz, MHz, or GHz) using the Up/Down arrow key
or keypad, press ENTER to accept, ESCAPE to restore.
� Stop � Sets the Spectrum Analyzer in the START-STOP mode. Enter a stop
frequency value (in kHz, MHz, or GHz) using the Up/Down arrow key or
keypad, press ENTER to accept, ESCAPE to restore.
� Signal Standard � Opens a menu of soft keys used to select the signal stan-
dard to be used. For more information on signal standards, refer to Appendix
C.
� Select Standard � Opens the signal standard menu, showing the currently
selected signal standards. Use the soft keys to navigate the list. Press the
Show All soft key to show the complete signal standard list. When the
complete list is displayed, the currently selected signal standards are
marked with an asterisk. Press the Show Selected soft key to show only
the currently selected signal standards.
� Select Channel � Sets the channel information for the available standard.
� Uplink � Selects only uplink frequencies.
� Downlink � Selects only downlink frequencies.
� Back � Returns to the previous menu.
2-18
Chapter 2 Functions and Operations

AMPLITUDE Choosing AMPLITUDE in Spectrum Analyzer mode causes the soft keys,
below, to be displayed and the corresponding values to be shown in the message
area.
� Ref Level — Activates the amplitude reference level function. Valid refer-
ence levels are from +20 to –120 dBm.
� Scale — Activates the scale function in a 1 through 15 dB logarithmic ampli-
tude scale. This soft key is not active if the units are set to linear.
� Atten/Preamp — Sets the internal input attenuator so that it is either coupled
automatically to the reference level (Auto), manually adjustable (Manual), dy-
namically coupled to the input signal (Dynamic) and provides control for the
preamplifier.
� Auto — Sets the input attenuator so that it is coupled automatically to the
reference level.
� Manual — Sets the input attenuator manually from 0 to 51 dB.
� Dynamic — Sets the input attenuator so that it is dynamically coupled to
the input signal and turns the preamp on or off as necessary.
� Preamp Control Manual — Activates the preamp menu.
� Preamp On/Off — Sets the preamplifier on or off.
� Preamp Auto — Automatically adjusts the preamplifier according to
the reference level.
� Back — Returns to the previous menu level.
� Units — Choose from the menu of amplitude related units. When Linear is
selected, the available selections are Volts or Watts. When Log is selected,
the selection of dBm sets absolute decibels relative to 1 mW as the amplitude
unit. Selection of dBV, dBmV or dB�V sets absolute decibels relative to 1
volt, 1 millivolt, or 1 microvolt respectively as the amplitude unit.
� Ref Level Offset — Sets the reference level offset. This feature allows mea-
surement of high gain devices in combination with an attenuator. It is used to
offset the reference level to view the correct output level. For example, to
measure a high gain amplifier with an output of 70 dBm, an external 50 dB
attenuator must be inserted between the Cell Master and the device. To com-
pensate, set the reference level offset to –50 dB.
MEAS/DISP Choosing MEAS/DISP in Spectrum Analyzer mode causes the soft keys be-
low to be displayed.
� Bandwidth — Activates a menu that allows the resolution and video
bandwidths to be either coupled automatically to the span (Auto) or manually
adjustable (Manual).
� RBW Auto — Sets the resolution bandwidth so that it is automatically cou-
pled to the span.
� RBW Manual — Sets the resolution bandwidth manually, independent of
the span.
� VBW Auto — Sets the video bandwidth so that it is automatically coupled
to the RBW.
� VBW Manual — Sets the video bandwidth manually, independent of the
RBW.
Chapter 2 Functions and Operations
2-19

� Back — Returns to the previous menu level.
� Trace — Activates a menu of trace related functions. Use the corresponding
soft key to select the desired trace function.
� Max Hold — Displays and holds the maximum responses of the input sig-
nal.
� Detection — Accesses a menu of detector modes including Positive Peak
detection, RMS Average detection, Negative Peak detection, and Sampling
Mode.
� Positive Peak — The unit reads and displays the highest measured
data point within a display point.
� RMS Average — The unit displays the average power within a display
point.
� Negative Peak — The unit reads and displays the lowest measured
data point within a display point.
� Sampling Mode — The unit reads and displays a single measured
point at each display point.
� Average (2-25) — The display will be an average of the number of sweeps
specified here. For example, if the number four is entered here, the data
displayed will be an average of the four most recent sweeps.
� Trace Math — Opens up the Trace Math functions for comparison of the
real time trace in the graph with any of the traces from memory.
� Recall Trace –> B — Recalls the selected saved trace to trace B.
� View B / Clear B — Views the recalled trace as trace B, or clears trace
B from the status window.
� A –> B — Moves trace A to trace B.
� A – B –> A — Moves the results of trace A minus trace B to trace A.
� A + B –> A — Moves the results of trace A plus trace B to trace A.
� Back — Returns to the previous menu level.
� Min Hold — Displays and holds the minimum responses of the input sig-
nal.
� Back — Returns to the previous menu level.
� Measure — Activates a menu of measurement related functions. Use the cor-
responding soft key to select the measurement function.
� Field Strength — Accesses a menu of field strength measurement options.
� On/Off — Turns field strength measurements on or off.
� Select Standard Antenna — Select from the list of antenna profiles
provided.
� Select Custom Antenna — Select a custom antenna profile as up-
loaded to the Cell Master using the Handheld Software Tools pro-
gram.
� Back — Returns to the previous menu.
� OBW — Activates the occupied bandwidth menu.
2-20
Chapter 2 Functions and Operations

� Method — Allows selection of either % of power or dB Down.
� % — Allows entry of the desired % of occupied bandwidth to be mea-
sured.
� dBc — Allows entry of the desired power level (dBc) to be measured.
� Measure — Enables and disables the OBW measurement.
� Back — Returns to the previous menu level.
� Channel Power — Activates Channel Power measurement. Channel power
is measured in dBm. Channel Power density is measured in dBm/Hz. The
displayed units is determined by the setting of the Units soft key in the
AMPLITUDE menu.
� Center Freq - Activates the center frequency function and sets the Cell
Master to the center frequency. A specific center frequency can be en-
tered using the keypad or Up/Down arrow key.
� Int BW — Enter the integration bandwidth frequency appropriate for
the application. Integration bandwidth must be at least one tenth of the
channel span.
� Channel Span — Sets the channel span to a value appropriate for the
application.
� Zoom One Channel — Automatically sets the span to cover one chan-
nel as defined by the selected signal standard.
� Measure — Enables and disables the channel power measurement.
� Back — Returns to the previous menu level.
� ACPR — Accesses a menu of Adjacent Channel Power Ratio measure-
ment options:
� Center Freq - Activates the center frequency function and sets the Cell
Master to the center frequency. A specific center frequency can be en-
tered using the keypad or Up/Down arrow key.
� Main Channel BW - Sets the bandwidth of the main channel.
� Adjacent Channel BW - Sets the bandwidth of the adjacent channel.
� Channel Spacing - Sets the channel spacing.
� Measure -Enables and disables the ACPR measurement.
� Back - Returns to the previous menu.
� More — Opens more measurement menus in spectrum analyzer mode.
� Int. Analysis — Opens the interference analysis measurement menu.
� Set IA Freq. — Set the interference analysis frequency from 9 kHzto 3000 MHz to measure the interference.
� Measure — Measures the interference.
� IA Freq. To Center — Set the interference analysis frequency tothe center of the interference frequency.
� IA Freq as Marker M1 — Set the interference analysis frequency asmarker M1.
� Back — Returns to the previous menu.
Chapter 2 Functions and Operations
2-21

� AM/FM Demod — Select AM, Narrow Band FM (300 ms de-empha-
sis), Wide Band FM (50 ms de-emphasis), USB or LSB.
� On/Off — Turns AM/FM Demodulation on or off.
� Demod Type — Select either AM, FM Wide Band, FM NarrowBand, SSB Lower or SSB Upper demodulation.
� Demod Freq — Use the Up/Down arrow key or the keypad to in-crease or decrease the demodulation frequency. Select the GHz,MHz, kHz, or Hz soft key to accept the frequency input.
� Volume — The current volume setting is displayed at the lowerright of the screen. Use the Up/Down arrow key to increase or de-crease the volume, and press the ENTER key to select.
� Demod Time — Use the Up/Down arrow key or the keypad to in-crease or decrease the demodulation time, and press the ENTERkey to select.
� Back — Returns to the previous menu.
� C/I — Opens carrier to interference measurement menu.
� Signal Type - Opens a menu to select the signal type. Selectionsare narrow band FHSS, wide band FHSS or a broadband signal.
� Center - Activates the center frequency function and sets the CellMaster to the center frequency. A specific center frequency can beentered using the keypad or Up/Down arrow key.
� Span - Sets the user-defined frequency span. Use the Up/Down ar-row key or keypad to enter a value in MHz.
� Min Sweep Time - Sets a sweep time of one second or more to im-prove the ability to capture instances of the interfering signal.
� Measure - Starts the carrier to interference measurement.
� Back - Returns to the previous menu.
� Back — Returns to the previous menu.
� Trigger — Select the method used to trigger the sweep.
� Free Run — The sweep is continuous.
� Single — A single sweep will be performed with each press of the
Run/Hold key.
� Video — Sets the video trigger level if the span is set to zero.
� Change Trigger Position — Changes the trigger sweep position from
5 msec to 2000 msec.
� Back — Returns to the previous menu.
MARKER Choosing MARKER in spectrum analyzer mode causes the soft keys, below, to
be displayed and the corresponding values to be shown in the message area. Se-
lected frequency marker or distance marker locations may be changed using the
keypad or Up/Down arrow key.
� M1 — Selects the M1 marker parameter and opens the M1 marker second
level menu.
� On/Off — Turns the selected marker on or off.
� Edit — Opens the selected marker parameter for data entry. Press ENTER
when data entry is complete or ESCAPE to restore the previous value.
2-22
Chapter 2 Functions and Operations

� Marker To Channel — Displays the closest channel to the marker fre-
quency in the edit box. Entering a different channel number will cause the
marker to go to that channel.
� Marker To Peak — Places the selected marker at the frequency with the
maximum amplitude value.
� Marker Freq To Center — Makes the center frequency of the Cell Master
equal to the frequency of the selected marker.
� Back — Returns to the Main Markers Menu.
� M2 through M4 — Selects the marker parameter and opens the marker second
level menu.
� On/Off — Turns the selected marker on or off.
� Edit — Opens the selected marker parameter for data entry. Press ENTER
when data entry is complete or ESCAPE to restore the previous value.
� Delta (Mx-M1) — Displays delta amplitude value as well as delta fre-
quency for the selected marker with respect to the M1 marker.
� Marker To Peak — Places the selected marker at the frequency with the
maximum amplitude value.
� Marker Freq To Center — Makes the center frequency of the Cell Master
equal to the frequency of the selected marker.
� Back — Returns to the Main Markers Menu.
� All Off — Turns all markers off.
� More — Opens the continuation of the Marker Menus.
� M5 — Selects the M5 marker parameter and opens the M5 second level
menu.
� On/Off — Turns the selected marker on or off.
� Edit — Opens the selected marker parameter for data entry. Press
ENTER when data entry is complete or ESCAPE to restore the pre-
vious value.
� Marker Freq To Center — Makes the center frequency of the Cell
Master equal to the frequency of the selected marker.
� Peak Between M1 & M2 — Places the selected marker at the fre-
quency with the maximum amplitude value between marker M1 and
marker M2.
� Valley Between M1 & M2 — Places the selected marker at the fre-
quency with the minimum amplitude value between marker M1 and
marker M2.
� Back — Returns to the Main Markers Menu.
� M6 — Selects the M6 marker parameter and opens the M6 second level
menu.
� On/Off — Turns the selected marker on or off.
� Edit — Opens the selected marker parameter for data entry. Press
ENTER when data entry is complete or ESCAPE to restore the pre-
vious value.
Chapter 2 Functions and Operations
2-23

� Marker Freq To Center — Makes the center frequency of the Cell
Master equal to the frequency of the selected marker.
� Peak Between M3 & M4 — Places the selected marker at the fre-
quency with the maximum amplitude value between marker M3 and
marker M4.
� Valley Between M3 & M4 — Places the selected marker at the fre-
quency with the minimum amplitude value between marker M3 and
marker M4.
� Back — Returns to the Main Markers Menu.
� Regular Marker — Measures the signal level at the point of the marker in
the unit type selected in the Amplitude - Units menu. When the regular
marker option is selected, all markers are regular markers.
� Noise Marker — Measures noise level normalized to a 1 Hz bandwidth.
The unit of measure is dBm/Hz only. When Noise Marker is selected, the
detection type is automatically changed to RMS average. When the Noise
Marker option is selected, all markers are noise markers.
� All Off — Turns all markers off.
Back — Returns to the Main Markers Menu.
LIMIT Choosing LIMIT in Spectrum Analyzer measurement mode causes the soft keys
below to be displayed.
NOTE: Limit is available only in cable and antenna analyzer, transmission mea-
surement, interference analyzer and spectrum analyzer modes.
� Single Limit — Sets a single limit value in dBm. Menu choices are:
� On/Off — Turns the limit on or off.
� Edit — Opens the parameter for data entry.
� Upper / Lower Limit — Activate the upper and lower limit lines by toggling
this soft key. The unit beeps if the data is above or below the set limit lines
and the status is displayed in the message area.
� Back — Returns to the previous menu.
� Multiple Upper Limits — Sets multiple user-defined upper limits, and can be
used to create an upper limit mask for quick pass/fail measurements. An up-
per limit will result in a failure when the data falls above the limit line. Menu
choices are:
� Segment 1 through Segment 5 — Opens the segment menu.
� On/Off — Turns the segment on or off.
� Edit — Opens the parameter for data entry.
� Prev Segment — Edit or view the parameters of the previous seg-
ment.
� Next Segment — Edit or view the parameters of the next segment. If
the next segment is off when this button is pressed, the starting point
of the next segment will be set equal to the ending point of the current
segment.
2-24
Chapter 2 Functions and Operations

� Back — Returns to the previous menu.
� Back — Returns to the previous menu.
� Multiple Lower Limits — Set multiple user defined lower limits, and can be
used to create a lower limit mask for quick pass/fail measurements. A lower
limit will result in a failure when the data falls below the limit line. Menu
choices are:
� Segment 1 through Segment 5 — Opens the segment menu.
� On/Off — Turns the segment on or off.
� Edit — Opens the parameter for data entry.
� Prev Segment — Edit or view the parameters of the previous seg-
ment.
� Next Segment — Edit or view the parameters of the next segment. If
the next segment is off when this button is pressed, the starting point
of the next segment will be set equal to the ending point of the current
segment.
� Back — Returns to the previous menu.
� Back — Returns to the previous menu.
� Limit Beep — Turns the audible limit beep indicator on or off.
Chapter 2 Functions and Operations
2-25

SYS In Spectrum Analyzer mode, pressing the SYS key displays the following Sys-
tem menu soft key selections:
� System Options — Displays a second level of system option functions:
� Clock — Displays a second level of functions:
� Hour — Enter the hour (0-23) using the Up/Down arrow key or the
keypad. Press ENTER when data entry is complete or ESCAPE to
restore the previous value.
� Minute — Enter the minute (0-59) using the Up/Down arrow key or
the keypad. Press ENTER when data entry is complete or ESCAPE
to restore the previous value.
� Month — Enter the month (1-12) using the Up/Down arrow key or the
keypad. Press ENTER when data entry is complete or ESCAPE to
restore the previous value.
� Day — Enter the day using the Up/Down arrow key or the keypad.
Press ENTER when data entry is complete or ESCAPE to restore the
previous value.
� Year — Enter the year (2003-2036) using the Up/Down arrow key or
the keypad. Press ENTER when data entry is complete or ESCAPE
to restore the previous value.
2-26
Chapter 2 Functions and Operations
Impedance
ExternalRefFreq
50
75Anritsu
12N50-75B
__
OtherAdapterOffset
Back
SystemOptions
Hour
ApplicationOptions
Clock
Status
Minute
SelfTest
Month LanguageEnglish
Day
Year
Units
GPSOn/Off
Printer
ChangeDate
Format
Back
Back
Back Location
Quality
Reset
Back
GPS
BiasTee
Figure 2-11. SYS Key Menu in Spectrum Analyzer Mode

� Back — Returns to the top-level SYS menu.
� Printer — Displays a menu of supported printers. Use the Up/Down arrow
key and ENTER key to make the selection.
� Units — Select the unit of measurement (metric or English).
� Change Date Format — Toggles the date format between
MM/DD/YYYY, DD/MM/YYYY, and YYYY/MM/DD.
� Back — Returns to the top-level SYS menu.
� Application Options — Application options displays options applicable to par-
ticular mode.
� External Ref Freq — Set the external reference frequency from 2 MHz to
20 MHz.
� Bias Tee — Selects the Bias Tee.
� Bias Tee Voltage — Set the bias tee voltage between 12 and 24 Vdc,
in 1V increments, using the number keys or the Up/Down arrow keys.
� Bias Tee On/Off — Turn the bias voltage on or off.
� Impedance — Sets the input impedance of the instrument
� 50� — Sets the input impedance of the instrument to 50�, which is
the default setting.
� 75� Anritsu 12N50-75B — Displays measurements as if the input
impedance was 75�. The actual input impedance is still 50�, but the
displayed information is transformed to the equivalent 75� value
based on the offset value specified by the adapter used in the measure-
ment. This setting is commonly used for cable TV-related measure-
ments. Pressing this soft key will also compensate 7.5 dB for the loss
of the Anritsu 12N50-75B adapter.
� Other adapter Offset — This key allows the user to enter other adapter
offset values. Enter the desired loss using the keypad or Up/Down ar-
row key and press the ENTER key to accept.
� Back — Returns to the previous menu.
� Back — Returns to the top-level SYS menu.
� Self Test — Start an instrument self test.
� Status — In cable and antenna analyzer freq or dist measurement mode, dis-
plays the current instrument status, including calibration status, temperature,
and battery charge state. Press ESCAPE to return to operation.
� GPS — Opens the GPS soft key menu.
� Press the GPS On/Off soft key to turn the GPS feature on or off.
� Press the Location soft key to view the latitude, longitude and altitude in-
formation and UTC timing.
� Press the Quality soft key to display the number of tracked satellites and
the GPS quality.
� Press the Reset soft key to reset the GPS.
� Back — Returns to the previous menu.
Chapter 2 Functions and Operations
2-27

� Language — Pressing this soft key immediately changes the language used to
display messages on the Cell Master status window. Choices are English,
French, German, Spanish, Chinese, and Japanese. The default language is
English.
2-28
Chapter 2 Functions and Operations

Power Meter (Internal) Mode
Selecting Power Meter (Internal) from the mode menu causes the soft keys, described be-
low, to be displayed and the corresponding values shown in the message area.
FREQ/DIST Choosing FREQ/DIST in Power Meter mode causes the soft keys, below, to be
displayed and the corresponding values to be shown in the message area.
� Center — Activates the center frequency function and sets the power meter to
the center frequency. A frequency from 4.5 MHz to 2.9985 MHz can be en-
tered.
� Span — Opens the parameter for editing and activates a menu of span related
choices.
� Edit — Allows editing of the span to enter specific frequency.
� Full — Sets the power meter to its maximum frequency span.
� Min — Minimum span in Power Meter mode is 3 MHz.
� Span Up 1-2-5 — Activates the span function so that the span may be in-
creased quickly in a 1-2-5 sequence.
� Span Down 1-2-5 — Activates the span function so that the span may be
reduced quickly in a 1-2-5 sequence.
Chapter 2 Functions and Operations
2-29
MODE=POWER METER:
SOFTKEYS:Center
Off
Edit
Span
Low
Full
SignalStandard
Medium
Min High
Units
Rel
Offset
Zero
SpanUp
1-2-5
Back
Back
SpanDown1-2-5
FREQ/DIST AMPLITUDE MEAS/DISP
RMSAveraging
SelectChannel
Downlink
Uplink
PageUp
Select/Deselect
ShowSelected
PageDown
Back
Bottomof
List
SelectStandard
Topof
List
Figure 2-12. Power Meter Mode Soft Key Labels

� Back — Returns to the previous menu level.
� Signal Standard � Opens a menu of soft keys used to select the signal stan-
dard to be used. For more information on signal standards, refer to Appendix
C.
� Select Standard � Opens the signal standard menu, showing the currently
selected signal standards. Use the soft keys to navigate the list. Press the
Show All soft key to show the complete signal standard list. When the
complete list is displayed, the currently selected signal standards are
marked with an asterisk. Press the Show Selected soft key to show only
the currently selected signal standards.
� Select Channel � Sets the channel information for the available standard.
� Uplink � Selects only uplink frequencies.
� Downlink � Selects only downlink frequencies.
� Back � Returns to the previous menu.
AMPLITUDE Choosing AMPLITUDE in Power Meter mode causes the soft keys, below, to
be displayed and the corresponding values to be shown in the message area. The
following soft keys are available when the AMPLITUDE key is pressed.
� Units — Choose either Watts or dBm.
� Rel — Selects whether relative power is on or off. When on, the message
Relative: On will show in the message area.
� Offset — Turns offset on or off. When on, a value from 0-60 dB can be en-
tered.
� Zero — Turns zero adjust on or off.
MEAS/DISP The following soft key is available when the MEAS/DISP key is pressed in
Power Meter mode.
� RMS Averaging — Activates the RMS Averaging menu. The RMS average is
calculated by taking the log of the average power and the power is calculated
from voltage. The number of points to average can be set to low, medium or
high.
� Off — Turns off RMS averaging.
� Low
� Medium
� High
� Back — Returns to the previous menu.
2-30
Chapter 2 Functions and Operations

SYS In Power Meter mode, pressing the SYS key displays the following System
menu soft key selections:
� System Options — Displays a second level of system option functions:
� Clock — Displays a second level of functions:
� Hour — Enter the hour (0-23) using the Up/Down arrow key or the
keypad. Press ENTER when data entry is complete or ESCAPE to
restore the previous value.
� Minute — Enter the minute (0-59) using the Up/Down arrow key or
the keypad. Press ENTER when data entry is complete or ESCAPE
to restore the previous value.
� Month — Enter the month (1-12) using the Up/Down arrow key or the
keypad. Press ENTER when data entry is complete or ESCAPE to
restore the previous value.
� Day — Enter the day using the Up/Down arrow key or the keypad.
Press ENTER when data entry is complete or ESCAPE to restore the
previous value.
� Year — Enter the year (2003-2036) using the Up/Down arrow key or
the keypad. Press ENTER when data entry is complete or ESCAPE
to restore the previous value.
Chapter 2 Functions and Operations
2-31
Impedance
ExternalRefFreq
50
75Anritsu
12N50-75B
__
OtherAdapterOffset
Back
SystemOptions
Hour
ApplicationOptions
Clock
Status
Minute
SelfTest
Month LanguageEnglish
Day
Year
Units
GPSOn/Off
Printer
ChangeDate
Format
Back
Back
Back Location
Quality
Reset
Back
GPS
BiasTee
Figure 2-13. SYS Key Menu in Power Meter Mode
� Back — Returns to the top-level SYS menu.
� Printer — Displays a menu of supported printers. Use the Up/Down arrow
key and ENTER key to make the selection.
� Units — Select the unit of measurement (metric or English).
� Change Date Format — Toggles the date format between
MM/DD/YYYY, DD/MM/YYYY, and YYYY/MM/DD.
� Back — Returns to the top-level SYS menu.
� Application Options — Application options displays options applicable to par-
ticular mode.
� External Ref Freq — Set the external reference frequency from 2 MHz to
20 MHz.
� Bias Tee — Selects the Bias Tee.
� Bias Tee Voltage — Set the bias tee voltage between 12 and 24 Vdc,
in 1V increments, using the number keys or the Up/Down arrow keys.
� Bias Tee On/Off — Turn the bias voltage on or off.
� Impedance — Sets the input impedance of the instrument
� 50� — Sets the input impedance of the instrument to 50�, which is
the default setting.
� 75� Anritsu 12N50-75B — Displays measurements as if the input
impedance was 75�. The actual input impedance is still 50�, but the
displayed information is transformed to the equivalent 75� value
based on the offset value specified by the adapter used in the measure-
ment. This setting is commonly used for cable TV-related measure-
ments. Pressing this soft key will also compensate 7.5 dB for the loss
of the Anritsu 12N50-75B adapter.
� Other adapter Offset — This key allows the user to enter other adapter
offset values. Enter the desired loss using the keypad or Up/Down ar-
row key and press the ENTER key to accept.
� Back — Returns to the previous menu.
� Back — Returns to the top-level SYS menu.
� Self Test — Start an instrument self test.
� Status — In cable and antenna analyzer freq or dist measurement mode, dis-
plays the current instrument status, including calibration status, temperature,
and battery charge state. Press ESCAPE to return to operation.
� GPS — Opens the GPS soft key menu.
� Press the GPS On/Off soft key to turn the GPS feature on or off.
� Press the Location soft key to view the latitude, longitude and altitude in-
formation and UTC timing.
� Press the Quality soft key to display the number of tracked satellites and
the GPS quality.
� Press the Reset soft key to reset the GPS.
� Back — Returns to the previous menu.
2-32
Chapter 2 Functions and Operations

� Language — Pressing this soft key immediately changes the language used to
display messages on the Cell Master status window. Choices are English,
French, German, Spanish, Chinese, and Japanese. The default language is
English.
Chapter 2 Functions and Operations
2-33
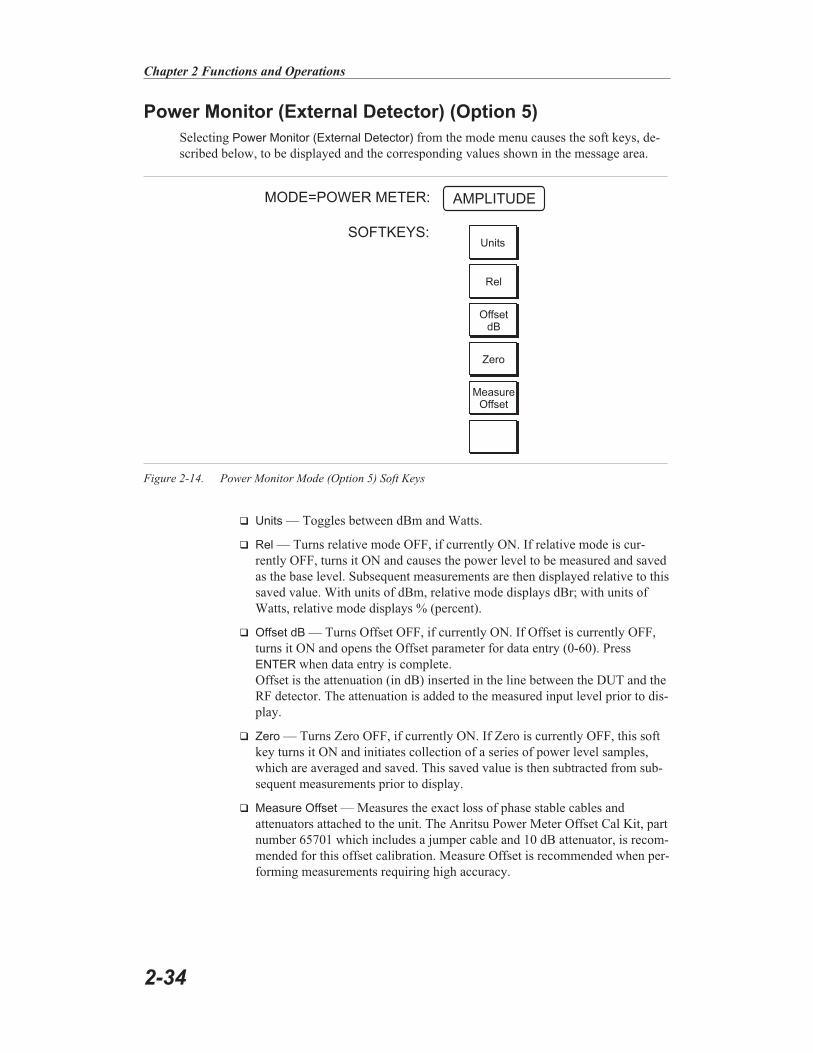
Power Monitor (External Detector) (Option 5)
Selecting Power Monitor (External Detector) from the mode menu causes the soft keys, de-
scribed below, to be displayed and the corresponding values shown in the message area.
� Units — Toggles between dBm and Watts.
� Rel — Turns relative mode OFF, if currently ON. If relative mode is cur-
rently OFF, turns it ON and causes the power level to be measured and saved
as the base level. Subsequent measurements are then displayed relative to this
saved value. With units of dBm, relative mode displays dBr; with units of
Watts, relative mode displays % (percent).
� Offset dB — Turns Offset OFF, if currently ON. If Offset is currently OFF,
turns it ON and opens the Offset parameter for data entry (0-60). Press
ENTER when data entry is complete.
Offset is the attenuation (in dB) inserted in the line between the DUT and the
RF detector. The attenuation is added to the measured input level prior to dis-
play.
� Zero — Turns Zero OFF, if currently ON. If Zero is currently OFF, this soft
key turns it ON and initiates collection of a series of power level samples,
which are averaged and saved. This saved value is then subtracted from sub-
sequent measurements prior to display.
� Measure Offset — Measures the exact loss of phase stable cables and
attenuators attached to the unit. The Anritsu Power Meter Offset Cal Kit, part
number 65701 which includes a jumper cable and 10 dB attenuator, is recom-
mended for this offset calibration. Measure Offset is recommended when per-
forming measurements requiring high accuracy.
2-34
Chapter 2 Functions and Operations
MODE=POWER METER:
SOFTKEYS:Units
Rel
OffsetdB
Zero
MeasureOffset
AMPLITUDE
Figure 2-14. Power Monitor Mode (Option 5) Soft Keys
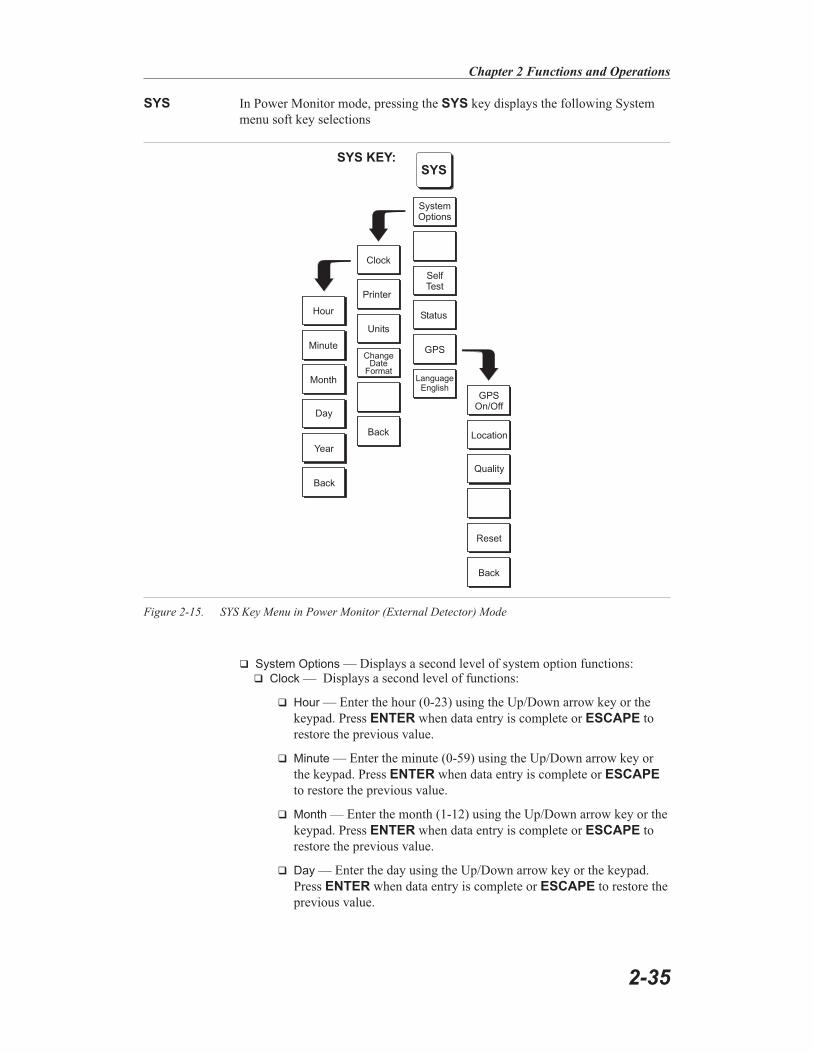
SYS In Power Monitor mode, pressing the SYS key displays the following System
menu soft key selections
� System Options — Displays a second level of system option functions:� Clock — Displays a second level of functions:
� Hour — Enter the hour (0-23) using the Up/Down arrow key or the
keypad. Press ENTER when data entry is complete or ESCAPE to
restore the previous value.
� Minute — Enter the minute (0-59) using the Up/Down arrow key or
the keypad. Press ENTER when data entry is complete or ESCAPE
to restore the previous value.
� Month — Enter the month (1-12) using the Up/Down arrow key or the
keypad. Press ENTER when data entry is complete or ESCAPE to
restore the previous value.
� Day — Enter the day using the Up/Down arrow key or the keypad.
Press ENTER when data entry is complete or ESCAPE to restore the
previous value.
Chapter 2 Functions and Operations
2-35
SystemOptions
Hour
Clock
Status
Minute
SelfTest
Month LanguageEnglish
Day
Year
Units
GPSOn/Off
Printer
ChangeDate
Format
Back
Back Location
Quality
Reset
Back
GPS
Figure 2-15. SYS Key Menu in Power Monitor (External Detector) Mode

� Year — Enter the year (2003-2036) using the Up/Down arrow key or
the keypad. Press ENTER when data entry is complete or ESCAPE
to restore the previous value.
� Back — Returns to the top-level SYS menu.
� Printer — Displays a menu of supported printers. Use the Up/Down arrow
key and ENTER key to make the selection.
� Units — Select the unit of measurement (metric or English).
� Change Date Format — Toggles the date format between
MM/DD/YYYY, DD/MM/YYYY, and YYYY/MM/DD.
� Back — Returns to the top-level SYS menu.
� Self Test — Start an instrument self test.
� Status — In cable and antenna analyzer freq or dist measurement mode, dis-
plays the current instrument status, including calibration status, temperature,
and battery charge state. Press ESCAPE to return to operation.
� GPS — Opens the GPS soft key menu.
� Press the GPS On/Off soft key to turn the GPS feature on or off.
� Press the Location soft key to view the latitude, longitude and altitude in-
formation and UTC timing.
� Press the Quality soft key to display the number of tracked satellites and
the GPS quality.
� Press the Reset soft key to reset the GPS.
� Back — Returns to the previous menu.
� Language — Pressing this soft key immediately changes the language used to
display messages on the Cell Master status window. Choices are English,
French, German, Spanish, Chinese, and Japanese. The default language is
English.
2-36
Chapter 2 Functions and Operations

High Accuracy Power Sensor Mode (Option 19)
Selecting High Accuracy Power Sensor from the mode menu causes the soft keys, described
below, to be displayed and the corresponding values shown in the message area.
FREQ/DIST Choosing the FREQ/DIST key causes the soft keys, below, to be displayed and
the corresponding values to be shown in the message area.
� Center � Sets the center frequency of the Spectrum Analyzer. Enter a value
using the Up/Down arrow key or keypad, press ENTER to accept, ESCAPE
to restore previous value.
� Signal Standard � Opens a menu of soft keys used to select the signal stan-
dard to be used. For more information on signal standards, refer to Appendix
C.
� Select Standard � Opens the signal standard menu, showing the currently
selected signal standards. Use the soft keys to navigate the list. Press the
Show All soft key to show the complete signal standard list. When the
complete list is displayed, the currently selected signal standards are
marked with an asterisk. Press the Show Selected soft key to show only
the currently selected signal standards.
� Select Channel � Sets the channel information for the available standard.
� Uplink � Selects only uplink frequencies.
� Downlink � Selects only downlink frequencies.
Chapter 2 Functions and Operations
2-37
MODE=HIGH ACCURACY POWER SENSOR
SOFTKEYS: Center
SignalStandard
OffsetdB
Zero
Rel
FREQ/DIST AMPLITUDE
MaxHold
LimitON/OFF
LowerLimit
UpperLimit
LimitUnits
RunningAverages
MEAS/DISP
Downlink
ChannelIncrement
UplinkPageUp
Select/Deselect
ShowSelected
PageDown
Back
Bottomof
List
SelectStandard
Topof
List
SelectChannel
Figure 2-16. High Accuracy Power Sensor Mode (Option 19) Soft Keys

� Channel Increment — Changes the channel increment step size when the
Up/Down arrows are used to select the channel number.
� Back � Returns to the previous menu.
AMPLITUDE Choosing the AMPLITUDE key causes the soft keys, below, to be displayed
and the corresponding values to be shown in the message area or scale menu de-
pending on the measurement mode.
� Rel — Selects whether relative power is on or off. When on, the message
Relative: On will show in the message area.
� Offset dB — Turns offset on or off. When on, a value from 0-60 dB can be
entered.
� Zero — Turns zero adjust on or off.
MEAS/DISP Choosing MEAS/DISP causes the soft keys below to be displayed.
� Running Averages — Press the Running Averages soft key and use the key-
pad to enter the number of averages to use (up to 50)
� Max Hold — Displays and holds the maximum responses of the input signal.
� Limit ON/OFF — Press the Limit ON/OFF soft key to turn on the limits.
� Lower Limit — Activate the lower limit line by toggling this soft key. The
unit beeps if the data is below the set limit line and the status is displayed in
the message area.
� Upper Limit — Activate the upper limit line by toggling this soft key. The
unit beeps if the data is above the set limit line and the status is displayed in
the message area.
� Limit Units — Press the Limit Units soft key to select the units.
2-38
Chapter 2 Functions and Operations

Transmission Measurement Mode (Option 21)
Selecting Transmission Measurement from the mode menu causes the soft keys, described
below, to be displayed and the corresponding values shown in the message area.
Chapter 2 Functions and Operations
2-39
MODE = TRANSMISSION MEASUREMENT
SOFTKEYS: Center
Span
Start
Stop
SignalStandard
Scale
Atten/Preamp
RefLevel
FREQ/SPAN AMPLITUDE
Edit
Full
Min
SpanUp
1-2-5
Back
SpanDown1-2-5
Auto
Manual
Dynamic
Back
PreampControlManual
Auto
Manual
Dynamic
Back
PreampAuto
PreampOn/Off
BW/SWEEP
Band-width
CalibrateTM
RBWAuto
VBWAuto
RBWManual
VBWManual
BackSelectChannel
Downlink
Uplink
PageUp
Select/Deselect
ShowSelected
PageDown
Back
Bottomof
List
SelectStandard
Topof
List
Trace
MaxHold
Average(2-25)
Detec-tion
TraceMath
MinHold
Back
RecallTrace-> B
View B /Clear B
A -> B
A - B->A
A + B->A
Back
Figure 2-17. Transmission Measurement Mode Soft Keys

FREQ/DIST Pressing the FREQ/DIST key in Transmission Measurement mode activates a
menu of frequency-related choices in the active function block. Use the corre-
sponding soft key to select the desired function, explained below. Use the key-
pad or Up/Down arrow key to change or enter values shown in the edit box.
Complete the entry by pressing the appropriate soft key frequency terminator.
� Center — Sets the center frequency. A specific center frequency can be en-
tered using the Up/Down arrow key, or the keypad and the GHz, MHz, kHz,
or Hz soft keys.
� Span — Pressing the Span soft key activates a menu of span related choices
in the active function block.
� Edit — Allows direct entry of a specific frequency span. Use the keypad or
Up/Down arrow key to select the span.
� Full — Sets the Anritsu Cell Master to its maximum frequency span, 2.975
GHz.
� Min — Sets the span to the minimum frequency.
� Span Up 1-2-5 — Activates the span function so that the span may be in-
creased quickly in a 1-2-5 sequence.
� Span Down 1-2-5 — Activates the span function so that the span may be
reduced quickly in a 1-2-5 sequence.
� Back — Returns to the previous menu level.
� Start — Activates the start frequency and sets the Anritsu Cell Master in the
Start/Stop mode. Use the keypad to enter the desired start frequency and
complete the entry by pressing the GHz, MHz, kHz, or Hz soft key to accept
the start frequency input.
� Stop — Activates the stop frequency and sets the Anritsu Cell Master in the
Start/Stop mode. Use the keypad to enter the desired stop frequency and com-
plete the entry by pressing the GHz, MHz, kHz, or Hz soft key to accept the
stop frequency input.
� Signal Standard � Opens a menu of soft keys used to select the signal stan-
dard to be used. For more information on signal standards, refer to Appendix
C.
� Select Standard � Opens the signal standard menu, showing the currently
selected signal standards. Use the soft keys to navigate the list. Press the
Show All soft key to show the complete signal standard list. When the
complete list is displayed, the currently selected signal standards are
marked with an asterisk. Press the Show Selected soft key to show only
the currently selected signal standards.
� Select Channel � Sets the channel information for the available standard.
� Uplink � Selects only uplink frequencies.
� Downlink � Selects only downlink frequencies.
� Back � Returns to the previous menu.
2-40
Chapter 2 Functions and Operations
AMPLITUDE Pressing AMPLITUDE in Transmission Measurement mode activates a menu of
amplitude-related functions.
� Ref Level — Activates the amplitude reference level function. A specific ref-
erence level can be entered using the keypad or Up/Down arrow key. Press
ENTER to accept the reference level value. Valid reference levels are +20
dBm to –120 dBm.
� Scale — Activates the scale function in a 1 through 15 dB per division loga-
rithmic amplitude scale. Enter the desired scale using the keypad or
Up/Down arrow key. Press ENTER to accept.
� Atten/Preamp — Sets the Anritsu Cell Master input attenuator so that it is ei-
ther coupled automatically to the reference level (Auto), manually adjustable
(Manual), or dynamically controlled (Dynamic).
� Auto — Press this soft key to automatically couple the attenuation to the
reference level. The automatic attenuation value is displayed to the left of
the display below the Atten.
� Manual — Sets the attenuation to manual mode. The attenuation can be ad-
justed from 0 to 51 dB, in 1 dB increments, using the keypad or Up/Down
arrow key. Press ENTER to accept the selected value. The value is dis-
played to the left of the display below the Atten*.
IMPORTANT! Attenuation is normally a coupled function and is automatically
adjusted when the reference level changes. The reference level will not change
however, when the attenuator changes. The attenuator should be adjusted so
that the maximum signal amplitude at the input mixer is –30 dBm or less. For
example, if the reference level is + 20 dBm, the attenuation should be 50 dB for
an input signal of –30 dBm at the mixer (+20 – 50 = –30). This prevents signal
compression. (This is with the preamplifier off.)
� Dynamic — Turns on the dynamic attenuation control feature. Dynamic at-
tenuation tracks the input signal level, automatically adjusting the attenua-
tion and preamp to give the maximum dynamic range without compressing
the input mixer.
Dynamic attenuation is based on a broadband detector. This means that an
out of band signal may interfere and force the need to use a bandpass filter
to eliminate the out of band interference and enable accurate measure-
ments.
� Preamp Control Manual — Allows manual control of the preamplifier
on/off state. The Preamp On/Off soft key turns the preamplifier on or off.
The Preamp Auto soft key returns to automatic control of the preamplifier.
� Back — Returns to the previous menu level.
Chapter 2 Functions and Operations
2-41

MEAS/DISP Pressing MEAS/DISP in Transmission Measurement mode activates a menu of
bandwidth- and sweep-related functions. Use the corresponding soft key to se-
lect the desired function.
� Bandwidth — Activates a menu that allows the resolution and video
bandwidths to be either coupled automatically to the span (Auto) or manually
adjustable (Manual).
� RBW Auto — Sets the resolution bandwidth so that it is automatically cou-
pled to the span.
� RBW Manual — Sets the resolution bandwidth manually, independent of
the span.
� VBW Auto — Sets the video bandwidth so that it is automatically coupled
to the RBW.
� VBW Manual — Sets the video bandwidth manually, independent of the
RBW.
� Back — Returns to the previous menu level.
� Trace — Activates a menu of trace related functions. Use the corresponding
soft key to select the desired trace function.
� Max Hold — Displays and holds the maximum responses of the input sig-
nal.
� Average (2-25) — Sets the number of the sweeps to be averaged. The
number of the sweeps can be adjusted from 2 to 25 using the Up/Down ar-
row key, or entered directly with the keypad number keys. Select OFF, or
enter 1 to turn off averaging. Press ENTER to accept the selected value.
This feature uses a measurement routine that averages samples over a
user-defined number of successive sweeps. The averaging is done on a
point-by-point basis. Each displayed point reflects the current measure-
ment associated with that point averaged with the measurements associ-
ated with that point from previous sweeps. This feature can be used to
minimize the impact of transients on the displayed signal and noise.
� Min Hold — Displays and holds the minimum responses of the input sig-
nal over multiple sweeps. This feature is useful for detecting small, dis-
crete, stable signals in the presence of noise.
� Trace Math — Pressing the Trace Math key in Transmission Measure-
ment mode activates a menu of trace-related functions. Use the corre-
sponding soft key to select the desired trace function.
NOTE: For this function, Trace A is always the runtime trace, and Trace B is al-
ways a saved trace. Trace A is displayed as a yellow trace, and Trace B is dis-
played as a magenta trace. Refer to page 3-15 for information on saving and
recalling traces.
� Recall Trace B — Recalls a stored trace into the Trace B buffer.
� View B /Clear B — Overlays a stored trace over the current trace. If
there is no trace in the Trace B buffer, the Recall Trace list will dis-
play. Select a trace from the menu of saved traces to recall to the
Trace B buffer. Pressing the soft key again turns off the trace overlay.
2-42
Chapter 2 Functions and Operations

� A B — Moves the currently displayed trace into the Trace B
buffer.
� A - B A — Subtracts Trace B from Trace A and displays the result
as Trace A.
� A + B A — Adds Trace B to Trace A and displays the result as
Trace A.
� Calibrate TM — Calibrates the Cell Master for transmission measure-
ments.
MARKER Pressing MARKER on the data keypad in Transmission Measurement mode ac-
tivates a menu for the six different markers. Use the corresponding soft key to
select the desired marker. Then use the marker second level menu to turn the
markers on or off, and to edit marker parameters and values.
� M1 — Selects the M1 marker parameter and opens the Markers second level
menu with M1 highlighted.
� On/Off — Turns the selected marker on or off.
� Edit — Opens the selected marker parameter for data entry. Enter the de-
sired marker frequency using the keypad or Up/Down arrow key. Select
the GHz, MHz, kHz, or Hz soft key to accept the marker frequency input.
� Delta (Mx-M1) — Displays delta frequency and amplitude for the selected
marker Mx (M2, M3 or M4) with respect to the M1 marker.
� Marker To Peak — Places the selected marker at the maximum amplitude
of a trace (M1 - M4 only).
� Marker Freq To Center — Makes the center frequency equal to the fre-
quency of the selected marker.
� Back — Returns to the previous menu level.
NOTE: The markers second-level menu above is identical for markers M2-M4.
� M2 — Selects the M2 marker parameter and opens the Markers second level
menu with M2 highlighted.
� M3 — Selects the M3 marker parameter and opens the Markers second level
menu with M3 highlighted.
� M4 — Selects the M4 marker parameter and opens the Markers second level
menu with M4 highlighted.
� All Off — Turns off all markers.
� More — Press to access additional marker functions:
� M5 — Selects the M5 marker parameter and opens the M5 marker second
level menu with M5 highlighted.
� On/Off — Turns the selected marker on or off.
� Edit — Opens the selected marker parameter for data entry. Enter the
desired marker frequency using the keypad or Up/Down arrow key.
Select the GHz, MHz, kHz, or Hz soft key to accept the marker fre-
quency input.
� Marker Freq To Center — Makes the center frequency equal to the
frequency of the selected marker.
Chapter 2 Functions and Operations
2-43

� Peak Between M1& M2 — Places the selected marker at the frequency
with maximum amplitude value between marker M1 and M2.
� Valley Between M1 & M2 — Places the selected marker at the fre-
quency with minimum amplitude value between marker M1 and M2.
� Back — Returns to the previous menu level.
NOTE: If markers M1 and/or M2 are off, the Peak and Valley functions above
are executed across the entire span.
� M6 — Selects the M6 marker parameter and opens the M6 marker second
level menu with M6 highlighted.
� On/Off — Turns the selected marker on or off.
� Edit — Opens the selected marker parameter for data entry. Enter the
desired marker frequency using the keypad or Up/Down arrow key.
Select the GHz, MHz, kHz, or Hz soft key to accept the marker fre-
quency input.
� Marker Freq To Center — Makes the center frequency equal to the
frequency of the selected marker.
� Peak Between M3 & M4 — Places the selected marker at the fre-
quency with maximum amplitude value between marker M1 and M2.
� Valley Between M3 & M4 — Places the selected marker at the fre-
quency with minimum amplitude value between marker M1 and M2.
� Back — Returns to the previous menu level.
� Regular Marker — Measures the signal level at the point of the marker in
the unit type selected in the Amplitude - Units menu. When the regular
marker option is selected, all markers are regular markers.
� Noise Marker — Measures noise level normalized to a 1 Hz bandwidth.
The unit of measure is dBm/Hz only. When Noise Marker is selected, the
detection type is automatically changed to RMS average. When the Noise
Marker option is selected, all markers are noise markers.
� All Off — Turns off all markers.
� Back — Returns to the previous menu level.
NOTE: If either marker M3 or marker M4 is off, the Peak and Valley functions
above are executed across the entire span.
LIMIT Pressing LIMIT on the data keypad in Transmission Measurement mode acti-
vates a menu of limit-related functions. Use the corresponding soft key to select
the desired limit function. Then use the Up/Down arrow key to change its value,
which is displayed in the message area at the bottom of the display.
� Single Limit — Sets a single limit value. Menu choices are:
� On/Off — Turns the single limit function on or off.
� Edit — Allows entry of the limit amplitude using the keypad or Up/Down
arrow key. Press ENTER to accept the entered value.
2-44
Chapter 2 Functions and Operations

� Upper / Lower Limit — Selects whether the measurement will fail if the
data is above the limit line or below the limit line, as indicated in the mes-
sage area of the display.
� Back — Returns to the previous menu level.
� Multiple Upper Limits — Sets multiple user-defined upper limits, and can be
used to create an upper limit mask for quick pass/fail measurements. An up-
per limit will result in a failure when the data falls above the limit line. Menu
choices are:
� Segment 1-5 — View/edit upper limit segment 1-5.
� On/Off — Turns the segment on or off.
� Edit — Opens the segment parameters for editing (see Adjusting Seg-
mented Limits, page 3-17).
� Prev Segment — Edit or view the parameters of the previous seg-
ment.
� Next Segment — Edit or view the parameters of the next segment. If
the next segment is off when this button is pressed, the starting point
of the next segment will be set equal to the ending point of the current
segment (if the current segment is on).
� Back — Returns to the previous menu level
� Back — Returns to the previous menu level
� Multiple Lower Limits — Set multiple user-defined lower limits, and can be
used to create a lower limit mask for quick pass/fail measurements. A lower
limit will result in a failure when the data falls below the limit line. Menu
choices are:
� Segment 1-5 — View/edit lower limit segment 1-5.
� On/Off — Turns the segment on or off.
� Edit — Opens the segment parameters for editing (see Adjusting Seg-
mented Limits, page 3-17).
� Prev Segment — Edit or view the parameters of the previous seg-
ment.
� Next Segment — Edit or view the parameters of the next segment. If
the next segment is off when this button is pressed, the starting point
of the next segment will be set equal to the ending point of the current
segment (if the current segment is on).
� Back — Returns to the previous menu level
� Back — Returns to the previous menu level.
� Limit Beep — Turns the audible limit beep indicator on or off. When the limit
beep indicator is on, an audible beep will occur at every data point that ap-
pears above the upper limit or below the lower limit.
Chapter 2 Functions and Operations
2-45

SYS In Transmission Measurement mode, pressing the SYS key displays the follow-
ing System menu soft key selections:
� System Options — Displays a second level of system option functions:
� Clock — Displays a second level of functions:
� Hour — Enter the hour (0-23) using the Up/Down arrow key or the
keypad. Press ENTER when data entry is complete or ESCAPE to
restore the previous value.
� Minute — Enter the minute (0-59) using the Up/Down arrow key or
the keypad. Press ENTER when data entry is complete or ESCAPE
to restore the previous value.
� Month — Enter the month (1-12) using the Up/Down arrow key or the
keypad. Press ENTER when data entry is complete or ESCAPE to
restore the previous value.
� Day — Enter the day using the Up/Down arrow key or the keypad.
Press ENTER when data entry is complete or ESCAPE to restore the
previous value.
� Year — Enter the year (2003-2036) using the Up/Down arrow key or
the keypad. Press ENTER when data entry is complete or ESCAPE
to restore the previous value.
2-46
Chapter 2 Functions and Operations
Impedance
ExternalRefFreq
50
75Anritsu
12N50-75B
__
OtherAdapterOffset
Back
SystemOptions
Hour
ApplicationOptions
Clock
Status
Minute
SelfTest
Month LanguageEnglish
Day
Year
Units
GPSOn/Off
Printer
ChangeDate
Format
Back
Back
Back Location
Quality
Reset
Back
GPS
BiasTee
Figure 2-18. SYS Key Menu in Transmission Measurement Mode

� Back — Returns to the top-level SYS menu.
� Printer — Displays a menu of supported printers. Use the Up/Down arrow
key and ENTER key to make the selection.
� Units — Select the unit of measurement (metric or English).
� Change Date Format — Toggles the date format between
MM/DD/YYYY, DD/MM/YYYY, and YYYY/MM/DD.
� Back — Returns to the top-level SYS menu.
� Application Options — Application options displays options applicable to par-
ticular mode.
� External Ref Freq — Set the external reference frequency from 2 MHz to
20 MHz.
� Bias Tee — Selects the Bias Tee.
� Bias Tee Voltage — Set the bias tee voltage between 12 and 24 Vdc,
in 1V increments, using the number keys or the Up/Down arrow keys.
� Bias Tee On/Off — Turn the bias voltage on or off.
� Impedance — Sets the input impedance of the instrument
� 50� — Sets the input impedance of the instrument to 50�, which is
the default setting.
� 75� Anritsu 12N50-75B — Displays measurements as if the input
impedance was 75�. The actual input impedance is still 50�, but the
displayed information is transformed to the equivalent 75� value
based on the offset value specified by the adapter used in the measure-
ment. This setting is commonly used for cable TV-related measure-
ments. Pressing this soft key will also compensate 7.5 dB for the loss
of the Anritsu 12N50-75B adapter.
� Other adapter Offset — This key allows the user to enter other adapter
offset values. Enter the desired loss using the keypad or Up/Down ar-
row key and press the ENTER key to accept.
� Back — Returns to the previous menu.
� Back — Returns to the top-level SYS menu.
� Self Test — Start an instrument self test.
� Status — In cable and antenna analyzer freq or dist measurement mode, dis-
plays the current instrument status, including calibration status, temperature,
and battery charge state. Press ESCAPE to return to operation.
� GPS — Opens the GPS soft key menu.
� Press the GPS On/Off soft key to turn the GPS feature on or off.
� Press the Location soft key to view the latitude, longitude and altitude in-
formation and UTC timing.
� Press the Quality soft key to display the number of tracked satellites and
the GPS quality.
� Press the Reset soft key to reset the GPS.
� Back — Returns to the previous menu.
Chapter 2 Functions and Operations
2-47

� Language — Pressing this soft key immediately changes the language used to
display messages on the Cell Master status window. Choices are English,
French, German, Spanish, Chinese, and Japanese. The default language is
English.
2-48
Chapter 2 Functions and Operations

Interference Analyzer Mode (Option 25)
The Interference Analyzer option provides several different ways to determine the nature
and source of an interfering signal. Selecting Interference Analyzer from the mode menu
causes the soft keys, described below, to be displayed and the corresponding values shown
in the message area.
Chapter 2 Functions and Operations
2-49
MODE=INTERFERENCE ANALYZER:
SOFTKEYS: Center
Span
Start
Stop
SelectChannel
SignalStandard
Scale
Atten/Preamp
Units
RefLevelOffset
RefLevel
FREQ/DIST AMPLITUDE
Edit
Full
Zero
SpanUp
1-2-5
Back
SpanDown1-2-5
dBm
Edit
(Spectrum and Spectrograph modes only)
dBV
ShiftLeft
1 Div
ShiftLeft
9 Div
ShiftRight1 Div
ShiftRight9 Div
dBmV
dBuV
BACK
Back
Downlink
UplinkPageUp
Select/Deselect
ShowSelected
PageDown
Back
Bottomof
List
SelectStandard
Topof
List
Edit
MeasureOffset
Back
Auto
Auto
Manual
Manual
Dynamic
Dynamic
Back
Back
PreampControlManual
PreampAuto
PreampOn/Off
Figure 2-19. Interference Analyzer Mode Soft Key Labels

To select Interference Analyzer mode, press the MODE key, use the Up/Down arrow key to
highlight Interference Analysis and press ENTER.
2-50
Chapter 2 Functions and Operations
MODE=INTERFERENCE ANALYZER:
SOFTKEYS:
Spectro-gram
SignalStrength
RSSI
Detection
SignalID
Setup
MEAS/DISP
SweepInterval
TimeSpan
AutoSave
Cursor
Spectrum
Volume
Volume
Back
SpeakerTone
On/Off
Band-widthTime
Cursor
FreqCursor
Back
Spectrum
Trigger
MinSweepTime
Spectro-gram
RBWAuto
SetIA
Freq
TimeInterval
IAFreq ToCenter
AutoScaleData
Log DataOff/On
IAFreq As
Marker M1Positive
Peak
VBWAuto
NegativePeak
RBWManual
Measure
TimeSpan
RMSAverage
VBWManual
SamplingMode
Back
Back
Back
Back
Figure 2-20. Interference Analyzer Mode Soft Key Labels (continued)

FREQ/DIST � Center — Sets the frequency at the center of the display. Frequencies can be
entered in units of GHz, MHz, kHz or Hz. When the center frequency is en-
tered, the labeling below the grid shows the center frequency and the span in
the most appropriate units based on the value.
� Span — Sets the width of the measurement window in GHz, MHz, kHz or
Hz. The center frequency and span are displayed in the message area at the
bottom of the status window.
� Start � Enter a start frequency value (in GHz, MHz, kHz or Hz) using the
Up/Down arrow key or keypad, press ENTER to accept, ESCAPE to re-
store. If the entered start frequency is greater than the current stop frequency,
the stop frequency is automatically adjusted to be the same as the start fre-
quency (zero span).
� Stop � Enter a stop frequency value (in GHz, MHz, kHz or Hz) using the
Up/Down arrow key or keypad, press ENTER to accept, ESCAPE to re-
store. If the entered stop frequency is lower than the current start frequency,
the start frequency is automatically adjusted to be the same as the stop fre-
quency (zero span).
� Signal Standard � Opens a menu of soft keys used to select the signal stan-
dard to be used.
� Select Standard � Opens the signal standard menu, showing the currently
selected signal standards. Use the soft keys to navigate the list. Press the
Show All soft key to show the complete signal standard list. When the
complete list is displayed, the currently selected signal standards are
marked with an asterisk. Press the Show Selected soft key to show only
the currently selected signal standards.
� Select Channel � Sets the channel information for the available standard.
If the particular standard has not been used before, the channel number
will default to the lowest legal channel number for that standard. If that
standard has been used before, the last used channel will be the default.
� Uplink � Selects the bank of frequencies that correspond to signals sent
from the client transmitter to the base station.
� Downlink � Selects the bank of frequencies that correspond to the signals
sent from the base station to the client receivers.
� Back � Returns to the previous menu.
AMPLITUDE Choosing AMPLITUDE causes the soft keys, below, to be displayed and the
corresponding values to be shown in the message area.
� Ref Level — Activates the amplitude reference level function which sets the
amplitude at the top of the display. Valid reference levels are from +20 to
–120 dBm.
� Scale — Activates the scale function which sets the dB/division value from 1
dB/div to 15 dB/div in 1 dB steps. This soft key is not active if the units are
set to linear.
� Atten/Preamp — Sets the internal input attenuator so that it is either coupled
automatically to the reference level (Auto), manually adjustable (Manual) or
dynamically coupled to the input signal (Dynamic) and provides control for
the preamplifier.
� Auto — Sets the input attenuator so that it is coupled automatically to the
reference level.
Chapter 2 Functions and Operations
2-51
� Manual — Sets the input attenuator manually from 0 to 51 dB. Choose a
value that does not overload the instrument.
� Dynamic — Sets the value of the input attenuator so that it is dynamically
coupled to the input signal and turns the preamp on or off based on the
overall signal conditions across the entire frequency range of the instru-
ment. The instrument will set the lowest input attenuation consistent with
the need to not saturate the front end.
NOTE: A large signal that is not displayed on-screen can sometimes cause the
instrument to turn off the preamplifier or add input attenuation, causing the
noise floor to jump up or down suddenly as the large signal turns on or off.
� Preamp Control Manual — Activates the preamp menu for manual control
of the preamplifier.
� Preamp On/Off — Sets the preamplifier on or off.
� Preamp Auto — Automatically adjusts the preamplifier according to
the reference level.
� Back — Returns to the previous menu level.
� Units — Choose from the menu of amplitude related units. When Linear is
selected, the available selections are Volts or Watts. When Log is selected,
the selection of dBm sets absolute decibels relative to 1 mW as the amplitude
unit. Selection of dBV, dBmV or dB�V sets absolute decibels relative to 1
volt, 1 millivolt, or 1 microvolt respectively as the amplitude unit.
� Ref Level Offset — Sets the reference level offset, which is a value, in dB, of
gain or loss external to the instrument. Negative values represent external at-
tenuation. This feature allows measurement of high gain devices in combina-
tion with an attenuator, and is used to offset the reference level to view the
correct output level. For example, to measure a high gain amplifier with an
output of 70 dBm, an external 50 dB attenuator must be inserted between the
instrument and the device. To compensate, set the reference level offset to
–50 dB.
MEAS/DISP Pressing MEAS/DISP activates a menu of bandwidth and sweep-related func-
tions. Use the corresponding soft key to select the desired function.
� Spectrum — Spectrum selects a traditional spectrum analyzer display.
� Spectrogram — Selecting Spectrogram provides a three dimensional repre-
sentation of frequency, time and power to aid in the identification of intermit-
tent signals. The bottom portion of the display shows a traditional spectrum
analyzer plot while the upper portion shows the power level in color with the
most recent trace placed at the bottom of the display. A color scale on the left
side of the display translates color into power level. The highest power level
is displayed in red with the lowest power levels in dark blue and black.
� Sweep Interval — Sweep Interval allows for the amount of time between
sweeps to be set from a minimum of zero seconds up to 660 seconds (11
minutes). Enter the number using the Up/Down arrow key or use the key-
pad and select the appropriate soft key for minutes, seconds, milliseconds
or microseconds. The current setting will be displayed in the message area.
A sweep interval of 0 seconds will display as Auto and the instrument will
sweep as fast as possible. Setting this value also determines the time span.
2-52
Chapter 2 Functions and Operations
� Time Span — Time Span sets the total time that will be taken to fill the
waterfall display, from 0 to 4320 minutes (72 hours). Enter the number us-
ing the Up/Down arrow key or use the keypad and select the appropriate
soft key for days, hours, minutes, seconds, milliseconds or microseconds.
The current setting will be displayed in the message area. A time span of 0
seconds will display as Auto and the instrument will sweep as fast as possi-
ble. Setting this value also determines the sweep interval.
� Auto Save — Auto Save saves the screen when the waterfall display is
full. Select the RECALL DISPLAY (0) key to view and recall the saved
displays (page 3-15).
� Cursor — The cursor controls enable the user to look through the waterfall
display and read the power level at a selected frequency and time. The
time, frequency and power level at the measurement point are shown in the
message block at the bottom of the screen. Selecting the Cursor soft key
turns the cursors on.
� Time Cursor — The Time Cursor is a white horizontal line that can be
positioned anywhere in the waterfall display. Select Time Cursor and
use the Up/Down arrow key to move the cursor to the desired time.
The time the trace was taken is shown in the bottom message block. If
the cursor is moved into a portion of the display where there is no
data, the date is shown as January 1, 1970 at midnight. The time cur-
sor will stop the sweep collection. Use the cursor after a full capture is
completed, or on a recalled display, in order to not miss any collection
of data.
� Freq Cursor — The Frequency Cursor is a vertical white line that can
be positioned at any frequency in the span range using the Up/Down
arrow key. Pressing the Up arrow key moves the cursor to a higher
frequency while pressing the Down arrow key moves the cursor to a
lower frequency. The frequency is shown in the bottom message
block.
� Back — Returns to the previous menu level.
� Spectrum — Selecting Spectrum returns to the traditional spectrum ana-
lyzer display and MEAS/DISP soft key menu.
� Signal Strength — Selecting Signal Strength displays the power at a single
frequency (in dBm) along with an optional audible indicator. The frequency
of the audible indicator increases as the measured signal strength increases.
This mode is especially useful when attempting to locate an emitter using a
directional antenna.
� Volume — Select the Volume soft key to adjust the sound level of the au-
dible signal strength indicator using the Up/Down arrow key. The current
volume setting is shown in the lower measurement block.
� Speaker Tone On/Off — The Speaker Tone On/Off soft key toggles the au-
dible indicator on or off. The default is On.
� Back — Returns to the previous menu level.
� RSSI — RSSI provides a way to see the scrolling display of received signal
strength in zero span. Once a full screen of data has been acquired, the oldest
data disappears off the left edge of the display.
� Time Interval — Time Interval sets the time between data points. The inter-
val can be set from 150 ms to 1 minute. Enter the number using the
Chapter 2 Functions and Operations
2-53

Up/Down arrow key or use the keypad and select the appropriate soft key
for minutes, seconds, or milliseconds.
� Time Span — Time Span sets the total duration of measurements. This
value can be set from 1 minute to 7 days. A setting of zero (MANUAL )
can also be entered if no limit on the time span is desired.
� Auto Scale Data — Auto Scale Data sets the reference level and scale fac-
tor to values that spread the data vertically over as much of the screen as
possible, with the reference level set in 0.1 dB steps and vertical scaling
set in 1 dB steps from 1 dB to 15 dB per division.
� Log Data Off/On — Log Data Off/On selects if data will be automatically
logged. When data logging is on, information is stored after each full
screen of data has been captured. Saved data is named by using the word
"LOG" and a dash followed by the time to the nearest second in 24-hour
clock format, such as "LOG - 14:43:01. Select the RECALL DISPLAY
(0) key to view and recall the saved data (page 3-15).
� Back — Returns to the previous menu level.
� Signal ID — Signal Identification is used to determine, if possible, the air in-
terface standard of a signal. If the instrument is unable to determine the mod-
ulation format, it will display the estimated bandwidth of the signal.
� Set IA Freq — Set IA Freq is used to enter the center frequency of the in-
terfering signal to be identified. Enter the frequency using the Up/Down
arrow key or use the keypad and select the appropriate soft key for GHz,
MHz, kHz, or Hz.
� Measure — Pressing the Measure soft key starts the signal identification
process. This process takes approximately one minute to complete. At the
end of the measurement process, a dialog box displays the results. The
results are also shown in the message area at the bottom of the display.
� IA Freq to Center — The IA Freq to Center soft key moves the interference
analysis frequency to the center of the screen.
� IA Freq As Marker M1 — The IA Freq As Marker M1 soft key sets the inter-
ference analysis frequency to be the frequency of marker M1. This is the
easiest way to enter the measurement frequency. Refer to the Marker key
section on the next page for information on setting the markers.
� Back — Returns to the previous menu level.
� Setup — Sets the parameters for IA measurements.
� Bandwidth — Activates a menu that allows the resolution and video
bandwidths to be either coupled automatically to the span (Auto) or manu-
ally adjustable (Manual).
� RBW Auto — Sets the resolution bandwidth so that it is automatically
coupled to the span.
� RBW Manual — Sets the resolution bandwidth manually, independent
of the span, from 30 kHz to 1 MHz in zero span mode, 100 Hz to 1
MHz for a span greater than zero.
� VBW Auto — Sets the video bandwidth so that it is automatically cou-
pled to the RBW.
� VBW Manual — Sets the video bandwidth manually, independent of
the RBW, from 3 Hz to 1 MHz.
2-54
Chapter 2 Functions and Operations

� Back — Returns to the previous menu level.
� Detection — Detection brings up a group of choices that change how the
instrument deals with the multiple RF measurements that are made for
each display point.
� Positive Peak — Positive Peak displays the largest signal in each dis-
play point.
� RMS Average — RMS Average causes the instrument to calculate the
RMS average of all measurements done for each display point and
display that average.
� Negative Peak — Negative Peak displays the smallest value for each
display point.
� Sampling Mode — Sampling Mode displays a single frequency point
for each display point. This is the fastest mode, but may miss display-
ing narrow signals.
� Back — Returns to the previous menu level.
� Volume — Select the Volume soft key to adjust the sound level of the au-
dible signal strength indicator using the Up/Down arrow key. The current
volume setting is shown in the lower measurement block.
MARKER Pressing MARKER on the data keypad activates a menu for the six different
markers. Use the corresponding soft key to select the desired marker. Then use
the marker second level menu to turn the markers on or off, and to edit marker
parameters and values.
NOTE: Markers are only available in IA-Spectrum mode.
� M1 — Selects the M1 marker parameter and opens the Markers second level
menu with M1 highlighted.� On/Off — Turns the selected marker on or off.
� Edit — Opens the selected marker parameter for data entry. Enter the de-
sired marker frequency using the keypad or Up/Down arrow key. Select
the GHz, MHz, kHz, or Hz soft key to accept the marker frequency input.
� Delta (Mx-M1) — Displays delta frequency and amplitude for the selected
marker Mx (M2, M3 or M4) with respect to the M1 marker.
� Marker To Peak — Places the selected marker at the maximum amplitude
of a trace (M1 - M4 only).
� Marker Freq To Center — Makes the center frequency equal to the fre-
quency of the selected marker.
� Back — Returns to the previous menu level.
NOTE: The markers second-level menu above is identical for markers M2-M4.
� M2 — Selects the M2 marker parameter and opens the Markers second level
menu with M2 highlighted.
� M3 — Selects the M3 marker parameter and opens the Markers second level
menu with M3 highlighted.
Chapter 2 Functions and Operations
2-55

� M4 — Selects the M4 marker parameter and opens the Markers second level
menu with M4 highlighted.
� All Off — Turns off all markers.
� More — Press to access additional marker functions:
� M5 — Selects the M5 marker parameter and opens the M5 marker second
level menu with M5 highlighted.
� On/Off — Turns the selected marker on or off.
� Edit — Opens the selected marker parameter for data entry. Enter the
desired marker frequency using the keypad or Up/Down arrow key.
Select the GHz, MHz, kHz, or Hz soft key to accept the marker fre-
quency input.
� Marker Freq To Center — Makes the center frequency equal to the
frequency of the selected marker.
� Peak Between M1& M2 — Places the selected marker at the frequency
with maximum amplitude value between marker M1 and M2.
� Valley Between M1 & M2 — Places the selected marker at the fre-
quency with minimum amplitude value between marker M1 and M2.
� Back — Returns to the previous menu level.
NOTE: If markers M1 and/or M2 are off, the Peak and Valley functions above
are executed across the entire span.
� M6 — Selects the M6 marker parameter and opens the M6 marker second
level menu with M6 highlighted.
� On/Off — Turns the selected marker on or off.
� Edit — Opens the selected marker parameter for data entry. Enter the
desired marker frequency using the keypad or Up/Down arrow key.
Select the GHz, MHz, kHz, or Hz soft key to accept the marker fre-
quency input.
� Marker Freq To Center — Makes the center frequency equal to the
frequency of the selected marker.
� Peak Between M3 & M4 — Places the selected marker at the fre-
quency with maximum amplitude value between marker M1 and M2.
� Valley Between M3 & M4 — Places the selected marker at the fre-
quency with minimum amplitude value between marker M1 and M2.
� Back — Returns to the previous menu level.
� Regular Marker — Measures the signal level at the point of the marker in
the unit type selected in the Amplitude - Units menu. When the regular
marker option is selected, all markers are regular markers.
� Noise Marker — Measures noise level normalized to a 1 Hz bandwidth.
The unit of measure is dBm/Hz only. When Noise Marker is selected, the
detection type is automatically changed to RMS average. When the Noise
Marker option is selected, all markers are noise markers.
� All Off — Turns off all markers.
2-56
Chapter 2 Functions and Operations

� Back — Returns to the previous menu level.
NOTE: If either marker M3 or marker M4 is off, the Peak and Valley functions
above are executed across the entire span.
LIMIT Pressing the LIMIT key activates a menu of limit related functions. Use the cor-
responding soft key to select the desired limit function. Then use the Up/Down
arrow key to change its value, which is displayed in the message area at the bot-
tom of the status window.
NOTE: Limit is only available in IA-Spectrum mode.
� Single Limit — Sets a single limit value. Menu choices are:� On/Off — Turns the single limit function on or off.
� Edit — Allows entry of the limit amplitude using the keypad or Up/Down
arrow key. Press ENTER to accept the entered value.
� Upper / Lower Limit — Selects whether the measurement will fail if the
data is above the limit line or below the limit line, as indicated in the mes-
sage area of the display.
� Back — Returns to the previous menu level.
� Multiple Upper Limits — Sets multiple user-defined upper limits, and can be
used to create an upper limit mask for quick pass/fail measurements. An up-
per limit will result in a failure when the data falls above the limit line. Menu
choices are:
� Segment 1-5 — View/edit upper limit segment 1-5.
� On/Off — Turns the segment on or off.
� Edit — Opens the segment parameters for editing (see Adjusting Seg-
mented Limits, page 3-17).
� Prev Segment — Edit or view the parameters of the previous segment.
� Next Segment — Edit or view the parameters of the next segment. If
the next segment is off when this button is pressed, the starting point
of the next segment will be set equal to the ending point of the current
segment (if the current segment is on).
� Back — Returns to the previous menu level
� Back — Returns to the previous menu level
� Multiple Lower Limits — Set multiple user-defined lower limits, and can be
used to create a lower limit mask for quick pass/fail measurements. A lower
limit will result in a failure when the data falls below the limit line. Menu
choices are:
� Segment 1-5 — View/edit lower limit segment 1-5.
� On/Off — Turns the segment on or off.
� Edit — Opens the segment parameters for editing (see Adjusting Seg-
mented Limits, page 3-17).
� Prev Segment — Edit or view the parameters of the previous segment.
Chapter 2 Functions and Operations
2-57
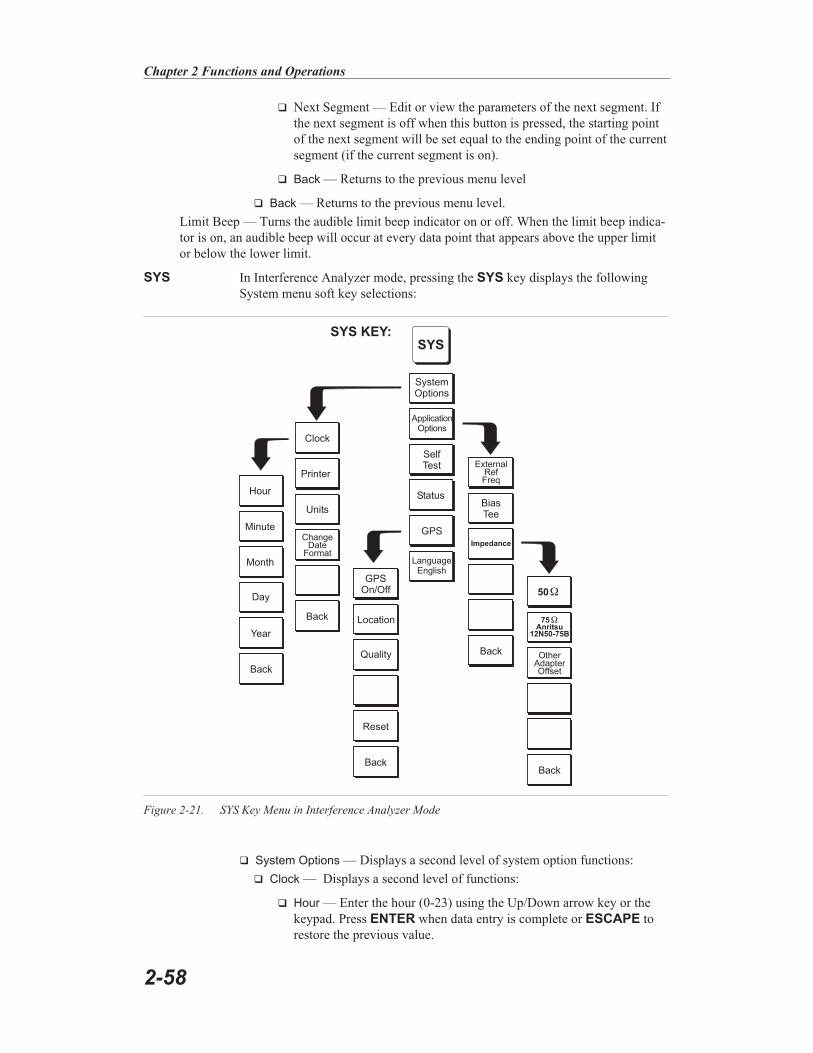
� Next Segment — Edit or view the parameters of the next segment. If
the next segment is off when this button is pressed, the starting point
of the next segment will be set equal to the ending point of the current
segment (if the current segment is on).
� Back — Returns to the previous menu level
� Back — Returns to the previous menu level.
Limit Beep — Turns the audible limit beep indicator on or off. When the limit beep indica-
tor is on, an audible beep will occur at every data point that appears above the upper limit
or below the lower limit.
SYS In Interference Analyzer mode, pressing the SYS key displays the following
System menu soft key selections:
� System Options — Displays a second level of system option functions:
� Clock — Displays a second level of functions:
� Hour — Enter the hour (0-23) using the Up/Down arrow key or the
keypad. Press ENTER when data entry is complete or ESCAPE to
restore the previous value.
2-58
Chapter 2 Functions and Operations
Impedance
ExternalRefFreq
50
75Anritsu
12N50-75B
__
OtherAdapterOffset
Back
SystemOptions
Hour
ApplicationOptions
Clock
Status
Minute
SelfTest
Month LanguageEnglish
Day
Year
Units
GPSOn/Off
Printer
ChangeDate
Format
Back
Back
Back Location
Quality
Reset
Back
GPS
BiasTee
Figure 2-21. SYS Key Menu in Interference Analyzer Mode

� Minute — Enter the minute (0-59) using the Up/Down arrow key or
the keypad. Press ENTER when data entry is complete or ESCAPE
to restore the previous value.
� Month — Enter the month (1-12) using the Up/Down arrow key or the
keypad. Press ENTER when data entry is complete or ESCAPE to
restore the previous value.
� Day — Enter the day using the Up/Down arrow key or the keypad.
Press ENTER when data entry is complete or ESCAPE to restore the
previous value.
� Year — Enter the year (2003-2036) using the Up/Down arrow key or
the keypad. Press ENTER when data entry is complete or ESCAPE
to restore the previous value.
� Back — Returns to the top-level SYS menu.
� Printer — Displays a menu of supported printers. Use the Up/Down arrow
key and ENTER key to make the selection.
� Units — Select the unit of measurement (metric or English).
� Change Date Format — Toggles the date format between
MM/DD/YYYY, DD/MM/YYYY, and YYYY/MM/DD.
� Back — Returns to the top-level SYS menu.
� Application Options — Application options displays options applicable to par-
ticular mode.
� External Ref Freq — Set the external reference frequency from 2 MHz to
20 MHz.
� Bias Tee — Selects the Bias Tee.
� Bias Tee Voltage — Set the bias tee voltage between 12 and 24 Vdc,
in 1V increments, using the number keys or the Up/Down arrow keys.
� Bias Tee On/Off — Turn the bias voltage on or off.
� Impedance — Sets the input impedance of the instrument
� 50� — Sets the input impedance of the instrument to 50�, which is
the default setting.
� 75� Anritsu 12N50-75B — Displays measurements as if the input
impedance was 75�. The actual input impedance is still 50�, but the
displayed information is transformed to the equivalent 75� value
based on the offset value specified by the adapter used in the measure-
ment. This setting is commonly used for cable TV-related measure-
ments. Pressing this soft key will also compensate 7.5 dB for the loss
of the Anritsu 12N50-75B adapter.
� Other adapter Offset — This key allows the user to enter other adapter
offset values. Enter the desired loss using the keypad or Up/Down ar-
row key and press the ENTER key to accept.
� Back — Returns to the previous menu.
� Back — Returns to the top-level SYS menu.
� Self Test — Start an instrument self test.
Chapter 2 Functions and Operations
2-59
� Status — In cable and antenna analyzer freq or dist measurement mode, dis-
plays the current instrument status, including calibration status, temperature,
and battery charge state. Press ESCAPE to return to operation.
� GPS — Opens the GPS soft key menu.
� Press the GPS On/Off soft key to turn the GPS feature on or off.
� Press the Location soft key to view the latitude, longitude and altitude in-
formation and UTC timing.
� Press the Quality soft key to display the number of tracked satellites and
the GPS quality.
� Press the Reset soft key to reset the GPS.
� Back — Returns to the previous menu.
� Language — Pressing this soft key immediately changes the language used to
display messages on the Cell Master status window. Choices are English,
French, German, Spanish, Chinese, and Japanese. The default language is
English.
2-60
Chapter 2 Functions and Operations

Channel Scanner Mode (Option 27)
The Channel Scanner option provides the choice of a bar graph or a text display showing
the amplitude of selected channels for a given air interface standard. The interface settings
can be manually entered if none of the available air interface standards meet the measure-
ment need.
To select Channel Scanner mode, press the MODE key and use the up and down arrows to
highlight Channel Scanner and press ENTER.
FREQ/DIST The operating frequency range for Channel Scanner mode can either be set man-
ually, or the desired air interface standard can be selected from the Signal Stan-
dard list in the instrument. When the frequency range is selected from the Signal
Standard list, all frequency related parameters are automatically set to the
appropriate values for that particular standard.
� Start Freq — Enter a start frequency from 9 kHz to 3000 MHz using the
Up/Down arrow key, or the keypad and the appropriate soft key for Hz, kHz,
MHz or GHz. Press ENTER to accept the input.
� Freq Step Size — The value entered here is the channel spacing. Enter a step
size from 0 to 3000 MHz using the Up/Down arrow key, or the keypad and
Chapter 2 Functions and Operations
2-61
MODE= CHANNEL SCANNER
SOFTKEYS: StartFreq
FreqStepSize
ChannelStepSize
ChannelSpan
StartChannel
SignalStandard
Scale
RefLevel
FREQ/DIST AMPLITUDE
Numberof
Channels
DisplayGraph/
Text
DisplayChannel/
Freq
MEAS/DISP
Downlink
Uplink
PageUp
Select/Deselect
ShowSelected
PageDown
Back
Bottomof
List
SelectStandard
Topof
List
Figure 2-22. Soft Key Menus in Channel Scanner Mode
the appropriate soft key for Hz, kHz, MHz or GHz. Press ENTER to accept
the input.
� Signal Standard � Opens a menu of soft keys used to select the signal stan-
dard to be used.
� Select Standard � Opens the signal standard menu, showing the currently
selected signal standards. Use the soft keys to navigate the list. Press the
Show All soft key to show the complete signal standard list. When the
complete list is displayed, the currently selected signal standards are
marked with an asterisk. Press the Show Selected soft key to show only
the currently selected signal standards.
� Start Channel � Sets the channel information for the available standard. If
the particular standard has not been used before, the channel number will
default to the lowest legal channel number for that standard. If that stan-
dard has been used before, the last used channel will be the default.
� Uplink � Selects the bank of frequencies that correspond to signals sent
from the client transmitter to the base station.
� Downlink � Selects the bank of frequencies that correspond to the signals
sent from the base station to the client receivers.
� Back � Returns to the previous menu.
� Channel Step Size � This integer value tells the system how many channels
to skip when scanning. Enter a step size from 1 to 1023 using the Up/Down
arrow key or the keypad and press ENTER to accept the input. Channel Step
Size is especially useful when channels overlap, such as CDMA and WiFi
channels.
� Channel Span — Channel Span sets the width of each channel. Enter a Chan-
nel Span from 0 to 3000 MHz using the Up/Down arrow key, or the keypad
and the appropriate soft key for Hz, kHz, MHz or GHz. Press ENTER to ac-
cept the input.
AMPLITUDE Choosing AMPLITUDE causes the soft keys, below, to be displayed and the
corresponding values to be shown in the message area.
� Ref Level — Reference Level sets the power level at the top of the display.
Enter a value from +20.0 to –120.0 dBm, in 0.1 dB steps, using the Up/Down
arrow key or the keypad and press ENTER to accept the input. The currently
selected reference level is shown in the message area at the bottom of the dis-
play.
� Scale — Scale sets the number of dB per division. Enter a value from 1 dB
per division to 15 dB per division using the Up/Down arrow key or the key-
pad and press ENTER to accept the input. The currently selected scale is
shown in the message area at the bottom of the display.
MEAS/DISP Pressing MEAS/DISP activates a menu of channel and display functions. Use
the corresponding soft key to select the desired function.
� Number of Channels — Number of Channels sets how many channels are si-
multaneously shown on the display. Enter a value from 1 to 20 channels us-
ing the Up/Down arrow key or the keypad and press ENTER to accept the
input.
2-62
Chapter 2 Functions and Operations

� Display Channel/Freq — Display Channel/Frequency toggles between dis-
playing the channel number or the channel frequency (with a resolution of
100 MHz).
� Display Graph/Text — Display Graph/Text toggles between displaying a bar
chart showing power levels, or a table showing channel number or frequency
(depending upon the current setting of Display Channel Freq) and the power
level.
SYS In Channel Scanner mode, pressing the SYS key displays the following System
menu soft key selections:
� System Options — Displays a second level of system option functions:
� Clock — Displays a second level of functions:
� Hour — Enter the hour (0-23) using the Up/Down arrow key or the
keypad. Press ENTER when data entry is complete or ESCAPE to
restore the previous value.
� Minute — Enter the minute (0-59) using the Up/Down arrow key or
the keypad. Press ENTER when data entry is complete or ESCAPE
to restore the previous value.
Chapter 2 Functions and Operations
2-63
Impedance
ExternalRefFreq
50
75Anritsu
12N50-75B
__
OtherAdapterOffset
Back
SystemOptions
Hour
ApplicationOptions
Clock
Status
Minute
SelfTest
Month LanguageEnglish
Day
Year
Units
GPSOn/Off
Printer
ChangeDate
Format
Back
Back
Back Location
Quality
Reset
Back
GPS
Figure 2-23. SYS Key Menu in Channel Scanner Mode

� Month — Enter the month (1-12) using the Up/Down arrow key or the
keypad. Press ENTER when data entry is complete or ESCAPE to
restore the previous value.
� Day — Enter the day using the Up/Down arrow key or the keypad.
Press ENTER when data entry is complete or ESCAPE to restore the
previous value.
� Year — Enter the year (2003-2036) using the Up/Down arrow key or
the keypad. Press ENTER when data entry is complete or ESCAPE
to restore the previous value.
� Back — Returns to the top-level SYS menu.
� Printer — Displays a menu of supported printers. Use the Up/Down arrow
key and ENTER key to make the selection.
� Units — Select the unit of measurement (metric or English).
� Change Date Format — Toggles the date format between
MM/DD/YYYY, DD/MM/YYYY, and YYYY/MM/DD.
� Back — Returns to the top-level SYS menu.
� Application Options — Application options displays options applicable to par-
ticular mode.
� External Ref Freq — Set the external reference frequency from 2 MHz to
20 MHz.
� Impedance — Sets the input impedance of the instrument
� 50� — Sets the input impedance of the instrument to 50�, which is
the default setting.
� 75� Anritsu 12N50-75B — Displays measurements as if the input
impedance was 75�. The actual input impedance is still 50�, but the
displayed information is transformed to the equivalent 75� value
based on the offset value specified by the adapter used in the measure-
ment. This setting is commonly used for cable TV-related measure-
ments. Pressing this soft key will also compensate 7.5 dB for the loss
of the Anritsu 12N50-75B adapter.
� Other adapter Offset — This key allows the user to enter other adapter
offset values. Enter the desired loss using the keypad or Up/Down ar-
row key and press the ENTER key to accept.
� Back — Returns to the previous menu.
� Back — Returns to the top-level SYS menu.
� Self Test — Start an instrument self test.
� Status — In cable and antenna analyzer freq or dist measurement mode, dis-
plays the current instrument status, including calibration status, temperature,
and battery charge state. Press ESCAPE to return to operation.
� GPS — Opens the GPS soft key menu.
� Press the GPS On/Off soft key to turn the GPS feature on or off.
� Press the Location soft key to view the latitude, longitude and altitude in-
formation and UTC timing.
2-64
Chapter 2 Functions and Operations

� Press the Quality soft key to display the number of tracked satellites and
the GPS quality.
� Press the Reset soft key to reset the GPS.
� Back — Returns to the previous menu.
� Language — Pressing this soft key immediately changes the language used to
display messages on the Cell Master status window. Choices are English,
French, German, Spanish, Chinese, and Japanese. The default language is
English.
Chapter 2 Functions and Operations
2-65

CW Signal Generator Mode (Option 28)
To select CW Signal Generator mode, press the MODE key and use the down arrow to
highlight CW Signal Generator and press ENTER.
The CW Signal Generator option provides a CW signal from the instrument. The primary
purpose of this signal is for sensitivity testing of receivers. To use this feature, the signal is
connected directly to the receiver being measured and the output amplitude is reduced until
the receiver drops the signal.
The external splitter feeds the signal into the instrument's RF input. The display shows the
output power and frequency. The amplitude is set using an external step attenuator. The ex-
ternal splitter and attenuator are customer-supplied.
Soft Keys
The following soft keys are available when entering CW Signal Generator mode, or by
pressing the FREQ/DIST function key while in CW Signal Generator mode:
� Freq — Enter a CW frequency from 25 MHz to 3000 MHz using the
Up/Down arrow key, or the keypad and the appropriate soft key for Hz, kHz,
MHz or GHz. Press ENTER to accept the input.
2-66
Chapter 2 Functions and Operations
MODE = CW:
SOFTKEYS:Freq
PageUp
PageUp
DisplaySetupHelp
SignalStandard
SelectStandard
PageDown
PageDown
SelectChannel
OffsetdB
Topof
List
Topof
List
Back
Uplink
Downlink
Bottomof
List
Bottomof
List
ShowAll
ShowSelected
Select/Deselect
FREQ/DIST AMPLITUDE MEAS/DISP
PowerMonitorExternal
Edit
MeasureOffset
Back
RefLevelOffset
Figure . CW Signal Generator Mode Softkey Menu Map

� Display Setup Help — Selecting this soft key displays a diagram of the rec-
ommended setup to use this option.
MEAS/DISP If Option 5 (Power Monitor) is installed, it is possible to operate Option 5 and
Option 28 simultaneously. This could be practical for repeater measurements or
for high loss cable loss measurements. The following soft key is available by
pressing the MEAS/DISP function key while in CW Signal Generator mode:
� Power Monitor External — Displays the power from the external power mon-
itor.
SYS In CW Signal Generator mode, pressing the SYS key displays the following
System menu soft key selection
� System Options — Displays a second level of system option functions:
� Clock — Displays a second level of functions:
� Hour — Enter the hour (0-23) using the Up/Down arrow key or the
keypad. Press ENTER when data entry is complete or ESCAPE to
restore the previous value.
� Minute — Enter the minute (0-59) using the Up/Down arrow key or
the keypad. Press ENTER when data entry is complete or ESCAPE
to restore the previous value.
� Month — Enter the month (1-12) using the Up/Down arrow key or the
keypad. Press ENTER when data entry is complete or ESCAPE to
restore the previous value.
� Day — Enter the day using the Up/Down arrow key or the keypad.
Press ENTER when data entry is complete or ESCAPE to restore the
previous value.
� Year — Enter the year (2003-2036) using the Up/Down arrow key or
the keypad. Press ENTER when data entry is complete or ESCAPE
to restore the previous value.
� Back — Returns to the top-level SYS menu.
� Printer — Displays a menu of supported printers. Use the Up/Down arrow
key and ENTER key to make the selection.
� Units — Select the unit of measurement (metric or English).
� Change Date Format — Toggles the date format between
MM/DD/YYYY, DD/MM/YYYY, and YYYY/MM/DD.
� Back — Returns to the top-level SYS menu.
� Application Options — Application options displays options applicable to par-
ticular mode.
� External Ref Freq — Set the external reference frequency from 2 MHz to
20 MHz.
� Bias Tee — Selects the Bias Tee.
� Bias Tee Voltage — Set the bias tee voltage between 12 and 24 Vdc,
in 1V increments, using the number keys or the Up/Down arrow keys.
� Bias Tee On/Off — Turn the bias voltage on or off.
� Impedance — Sets the input impedance of the instrument
Chapter 2 Functions and Operations
2-67

� 50� — Sets the input impedance of the instrument to 50�, which is
the default setting.
� 75� Anritsu 12N50-75B — Displays measurements as if the input
impedance was 75�. The actual input impedance is still 50�, but the
displayed information is transformed to the equivalent 75� value
based on the offset value specified by the adapter used in the measure-
ment. This setting is commonly used for cable TV-related measure-
ments. Pressing this soft key will also compensate 7.5 dB for the loss
of the Anritsu 12N50-75B adapter.
� Other adapter Offset — This key allows the user to enter other adapter
offset values. Enter the desired loss using the keypad or Up/Down ar-
row key and press the ENTER key to accept.
� Back — Returns to the previous menu.
� Back — Returns to the top-level SYS menu.
� Self Test — Start an instrument self test.
� Status — In cable and antenna analyzer freq or dist measurement mode, dis-
plays the current instrument status, including calibration status, temperature,
and battery charge state. Press ESCAPE to return to operation.
� GPS — Opens the GPS soft key menu.
� Press the GPS On/Off soft key to turn the GPS feature on or off.
� Press the Location soft key to view the latitude, longitude and altitude in-
formation and UTC timing.
� Press the Quality soft key to display the number of tracked satellites and
the GPS quality.
� Press the Reset soft key to reset the GPS.
� Back — Returns to the previous menu.
� Language — Pressing this soft key immediately changes the language used to
display messages on the Cell Master status window. Choices are English,
French, German, Spanish, Chinese, and Japanese. The default language is
English.
2-68
Chapter 2 Functions and Operations

GSM Mode (Option 40)
The following section explains the hard keys and soft keys available when the Cell Master
is set to GSM mode.
FREQ/DIST Choosing FREQ/DIST in GSM mode causes the soft keys, below, to be dis-
played and the corresponding values to be shown in the message area.
� Center � Sets the center frequency. Enter a value using the Up/Down arrow
key or keypad, press ENTER to accept, ESCAPE to restore the previous
value.
� Signal Standard � Opens a menu of soft keys used to select the signal stan-
dard to be used. For more information on signal standards, refer to Appendix
C.
NOTE: The list of Signal Standards may be updated when a new firmware up-
date is installed. Hold the SYS key while turning on the unit to reset the unit to
the factory defaults and update the Signal Standards list after installing a new
firmware release. Handheld Software Tools (Chapter 18) can also be used to
manually update the list.
Chapter 2 Functions and Operations
2-69
MODE = GSM:
SOFTKEYS:Center
PageUp
PageUp
SignalStandard
ExtRefFreqSelect
Standard
PageDown
PageDown
SelectChannel
dBm/Watts
PowerOffset
Topof
List
Topof
List
Back
Bottomof
List
Bottomof
List
ShowAll
ShowSelected
Select/Deselect
FREQ/DIST AMPLITUDE MEAS/DISP
Spectrum
Power vs.Time
(Frame)
Power vs.Time(Slot)
Edit
MeasureOffset
Back
RefLevelOffset
Figure 2-25. GSM Mode Softkey Menu Map

� Select Standard � Opens the signal standard menu, showing the currently
selected signal standards. Use the soft keys to navigate the list. Press the
Show All soft key to show the complete signal standard list. When the
complete list is displayed, the currently selected signal standards are
marked with an asterisk. Press the Show Selected soft key to show only
the currently selected signal standards.
� Select Channel � Sets the channel information for the available standard.
� Back � Returns to the previous menu.
� External Ref Freq � Enter the External Reference Frequency value using the
Up/Down arrow key or keypad, press ENTER to accept, ESCAPE to restore
the previous value.
AMPLITUDE Choosing AMPLITUDE in GSM mode causes the soft keys, below, to be dis-
played and the corresponding values to be shown in the message area.
� dBm/Watts — The measurement results can be displayed in either dBm or
Watts.
� Power Offset — Choose Power Offset to have the Cell Master automatically
adjust for the loss through any external cables, attenuators, and couplers.
MEAS/DISP Choosing MEAS/DISP in GSM mode causes the soft keys below to be dis-
played.
� Spectrum – Display the GSM spectrum.
� Power vs. Time (Frame) – Display the frame.
� Power vs. Time (Slot) – Display the slot.
2-70
Chapter 2 Functions and Operations

SYS In GSM mode, pressing the SYS key displays the following System menu soft
key selections:
� System Options — Displays a second level of system option functions:
� Clock — Displays a second level of functions:
� Hour — Enter the hour (0-23) using the Up/Down arrow key or the
keypad. Press ENTER when data entry is complete or ESCAPE to
restore the previous value.
� Minute — Enter the minute (0-59) using the Up/Down arrow key or
the keypad. Press ENTER when data entry is complete or ESCAPE
to restore the previous value.
� Month — Enter the month (1-12) using the Up/Down arrow key or the
keypad. Press ENTER when data entry is complete or ESCAPE to
restore the previous value.
� Day — Enter the day using the Up/Down arrow key or the keypad.
Press ENTER when data entry is complete or ESCAPE to restore the
previous value.
Chapter 2 Functions and Operations
2-71
ExternalRefFreq
SystemOptions
Hour
ApplicationOptions
Clock
Status
Minute
SelfTest
Month LanguageEnglish
Day
Year
Units
GPSOn/Off
Printer
ChangeDate
Format
Back
Back
Back Location
Quality
Reset
Back
GPS
Figure 2-26. SYS Key Menu in GSM Mode

� Year — Enter the year (2003-2036) using the Up/Down arrow key or
the keypad. Press ENTER when data entry is complete or ESCAPE
to restore the previous value.
� Back — Returns to the top-level SYS menu.
� Printer — Displays a menu of supported printers. Use the Up/Down arrow
key and ENTER key to make the selection.
� Units — Select the unit of measurement (metric or English).
� Change Date Format — Toggles the date format between
MM/DD/YYYY, DD/MM/YYYY, and YYYY/MM/DD.
� Back — Returns to the top-level SYS menu.
� Application Options — Application options displays options applicable to par-
ticular mode.
� External Ref Freq — Set the external reference frequency from 2 MHz to
20 MHz.
� Back — Returns to the top-level SYS menu.
� Self Test — Start an instrument self test.
� Status — In cable and antenna analyzer freq or dist measurement mode, dis-
plays the current instrument status, including calibration status, temperature,
and battery charge state. Press ESCAPE to return to operation.
� GPS — Opens the GPS soft key menu.
� Press the GPS On/Off soft key to turn the GPS feature on or off.
� Press the Location soft key to view the latitude, longitude and altitude in-
formation and UTC timing.
� Press the Quality soft key to display the number of tracked satellites and
the GPS quality.
� Press the Reset soft key to reset the GPS.
� Back — Returns to the previous menu.
� Language — Pressing this soft key immediately changes the language used to
display messages on the Cell Master status window. Choices are English,
French, German, Spanish, Chinese, and Japanese. The default language is
English.
2-72
Chapter 2 Functions and Operations

CDMA Mode (Options 33, 42 and 43)
The following section explains the hard keys and soft keys available when the Cell Master
is set to CDMA mode.
FREQ/DIST Choosing FREQ/DIST in CDMA mode causes the soft keys, below, to be dis-
played and the corresponding values to be shown in the message area.
� Center � Sets the center frequency. Enter a value using the Up/Down arrow
key or keypad, press ENTER to accept, ESCAPE to restore the previous
value.
Chapter 2 Functions and Operations
2-73
MODE = CDMA:
SOFTKEYS:Center
PageUp
PageUp
SignalStandard
SelectStandard
PageDown
PageDown
SelectChannel
CDPScale
dBm/Watts
PowerOffset
Topof
List
Topof
List
Back
Bottomof
List
Bottomof
List
ShowAll
ShowSelected
Select/Deselect
FREQ/DIST AMPLITUDE
Edit
MeasureOffset
Back
RefLevelOffset
Figure 2-27. CDMA Mode Softkey Menu Map, FREQ/DIST and AMPLITUDE Keys

� Signal Standard � Opens a menu of soft keys used to select the signal stan-
dard to be used. For more information on signal standards, refer to Appendix
C.
� Select Standard � Opens the signal standard menu, showing the currently
selected signal standards. Use the soft keys to navigate the list. Press the
Show All soft key to show the complete signal standard list. When the
complete list is displayed, the currently selected signal standards are
marked with an asterisk. Press the Show Selected soft key to show only
the currently selected signal standards.
� Select Channel � Sets the channel information for the available standard.
� Back � Returns to the previous menu.
AMPLITUDE Choosing AMPLITUDE in CDMA mode causes the soft keys, below, to be dis-
played and the corresponding values to be shown in the message area.
� CDP Scale — The CDP (Code Domain Power) scale can be manually set
from 1 dB/Div to 15 dB/Div.
� dBm/Watts — The measurement results can be displayed in either dBm or
Watts.
� Power Offset — Choose Power Offset to have the Cell Master automatically
adjust for the loss through any external cables, attenuators, and couplers.
NOTE: If the loss is not known, Option 21, Transmission Measurement, or the
Offset Calibration can be used to measure the loss of the system.
2-74
Chapter 2 Functions and Operations

MEAS/DISP Choosing MEAS/DISP in CDMA mode causes the soft keys below to be dis-
played.
Chapter 2 Functions and Operations
2-75
MODE = CDMA:
SOFTKEYS:
NoTrigger
RisingEdge
FallingEdge
MeasSpeed
GPSAuto
ExternalAuto
GPSManual
ExternalManual
Back
Back
Back
ExtTriggerPolarity
Overthe AirMeas
PilotScan
MEAS/DISP
64 Codes
128 Codes
Back
CDP
TextOnly
PNSearch
PNIncrement
Back
WalshCodes
AdvancedSettings
RFMeas
Setup
Multipath
Figure 2-28. CDMA Mode Softkey Menu Map, MEAS/DISP Key

� CDP — When CDP is selected, the display shows Code Domain Power as 64
or 128 bit reversed Walsh codes in graphical format. Pilot power, Channel
Power, Frequency Error, Rho, Noise Floor will be displayed and three strong
pilots will be displayed in OTA measurement.
� Text Only — Displays Pilot Power, Channel Power, Ec/Io, Rho, Tau, Fre-
quency Error and Carrier Feed Through in a text format.
� Over The Air Meas — Select either Pilot Scan or Mutlitpath display.
� Pilot Scan — Displays the six strongest pilots with Tau and Ec/Io
� Multipath — Displays the two strongest multipaths with Ec/Io related to
the strongest pilot.
� RF Meas — Displays Channel Power (RMS), Frequency Error, the Measured
Occupied Bandwidth, Channel Power, Frequency Error, and the Noise Floor.
� Setup — The Setup menu is used to determine the settings for the CDMA
measurement.
� PN Search — To determine PN Numbers and timing errors, the Cell Mas-
ter needs a timing reference. The timing can come from the base station
when the Cell Master is connected to the base station or it can be recov-
ered from GPS when a GPS antenna is connected to the Cell Master.
� GPS Auto — The Cell Master uses GPS as the timing reference, and
automatically detects the strongest pilot. The GPS antenna must be
connected to the Cell Master GPS antenna connector. GPS must be
turned on under Sys|GPS|GPS On/Off and the GPS must be locked to
the satellites before GPS Auto can be used.
� GPS Manual — The Cell Master uses GPS as the timing reference,
but it searches only for the specified PN. The GPS antenna must be
connected to the Cell Master GPS antenna. GPS must be turned on un-
der Sys|GPS|GPS On/Off and the GPS must be locked to the satellites
before GPS Manual can be used.
� External Auto — The Cell Master uses an external even second time
mark as the timing reference. The time mark is usually available at the
base station on a BNC connector labeled as "ESTM" or "PP2S." The
ESTM must be connected to the CDMA Timing Input connector on the
Cell Master. The Cell Master will automatically detect the strongest
pilot.
� External Manual — The Cell Master uses an external even second
time mark as the timing reference. This is usually available at the base
station on a BNC connector labeled as "ESTM" or "PP2S". This
ESTM must be connected to the "CDMA Timing Input" on the Cell
Master. The Cell Master will search only for the specified PN.
� No Trigger — If both GPS and external timing are unavailable, you
may choose No Trigger for the PN search.
� Back — Returns to the previous menu.
� Walsh Codes — The user may select 64 or 128 Walsh codes for display. A
cdmaOne transmitter displays 64 walsh codes and CDMA2000 1xRTT
transmits 128 walsh codes. In 128 Walsh codes mode the Cell Master dis-
plays code domain power in bit reversed order. This is useful with
CDMA2000 signals, where a single user may use several codes (supple-
mental channels) which appear adjacent in the bit reversed order, but not
2-76
Chapter 2 Functions and Operations

in the standard order. In that case, the Cell Master draws them as a single
bar with no spaces in between.
� PN Increment — The PN Increment determines how close together PNs
can be. For instance, if the PN increment is chosen as 4, a measured PN of
9 will be displayed as a PN of 8 with a larger timing error (Tau). PN Incre-
ment is useful in Over The Air testing, where the propagation delay can
shift a PN. Most networks have a PN increment they use to space out the
PNs of their base stations. For conducted measurements, the PN increment
is usually set to 1.
� Advanced Settings — Advanced settings include the measurement length
and the external trigger polarity.
� Meas Speed — Sets the speed of the measurement. Use the Up/Down
arrow key to select FAST, NORMAL or SLOW. Press ENTER to ac-
cept or ESCAPE to restore the previous value.
� Ext Trigger Polarity — The CDMA timing input can use the rising
edge or the falling edge of the ESTM as the zero point in time.
� Back — Returns to the previous menu.
MARKER Choosing MARKER in CDMA mode causes the soft keys, below, to be dis-
played and the corresponding values to be shown in the message area. Selected
frequency marker or distance marker locations may be changed using the key-
pad or Up/Down arrow key.
� M1 — Selects the M1 marker parameter and opens the M1 marker second
level menu.
� On/Off — Turns the selected marker on or off.
� Edit — Opens the selected marker parameter for data entry. Press ENTER
when data entry is complete or ESCAPE to restore the previous value.
� Back — Returns to the Main Markers Menu.
� M2 through M4 — Selects the marker parameter and opens the marker second
level menu.
� On/Off — Turns the selected marker on or off.
� Edit — Opens the selected marker parameter for data entry. Press ENTER
when data entry is complete or ESCAPE to restore the previous value.
� Back — Returns to the Main Markers Menu.
� All Off — Turns all markers off.
� More — Opens the continuation of the Marker Menus.
� M5 — Selects the M5 marker parameter and opens the M5 second level
menu.
� On/Off — Turns the selected marker on or off.
� Edit — Opens the selected marker parameter for data entry. Press
ENTER when data entry is complete or ESCAPE to restore the pre-
vious value.
� Back — Returns to the Main Markers Menu.
� M6 — Selects the M6 marker parameter and opens the M6 second level
menu.
� On/Off — Turns the selected marker on or off.
Chapter 2 Functions and Operations
2-77

� Edit — Opens the selected marker parameter for data entry. Press
ENTER when data entry is complete or ESCAPE to restore the pre-
vious value.
� Back — Returns to the Main Markers Menu.
� All Off — Turns all markers off.
� Back — Returns to the Main Markers Menu.
SYS In CDMA mode, pressing the SYS key displays the following System menu soft
key selections:
� System Options — Displays a second level of system option functions:
� Clock — Displays a second level of functions:
2-78
Chapter 2 Functions and Operations
ExternalRefFreq
SystemOptions
Hour
ApplicationOptions
Clock
Status
Minute
SelfTest
Month LanguageEnglish
Day
Year
Units
GPSOn/Off
Printer
ChangeDate
Format
Back
Back
Back Location
Quality
Reset
Back
GPS
Figure 2-29. SYS Key Menu in CDMA Mode
� Hour — Enter the hour (0-23) using the Up/Down arrow key or the
keypad. Press ENTER when data entry is complete or ESCAPE to
restore the previous value.
� Minute — Enter the minute (0-59) using the Up/Down arrow key or
the keypad. Press ENTER when data entry is complete or ESCAPE
to restore the previous value.
� Month — Enter the month (1-12) using the Up/Down arrow key or the
keypad. Press ENTER when data entry is complete or ESCAPE to
restore the previous value.
� Day — Enter the day using the Up/Down arrow key or the keypad.
Press ENTER when data entry is complete or ESCAPE to restore the
previous value.
� Year — Enter the year (2003-2036) using the Up/Down arrow key or
the keypad. Press ENTER when data entry is complete or ESCAPE
to restore the previous value.
� Back — Returns to the top-level SYS menu.
� Printer — Displays a menu of supported printers. Use the Up/Down arrow
key and ENTER key to make the selection.
� Units — Select the unit of measurement (metric or English).
� Change Date Format — Toggles the date format between
MM/DD/YYYY, DD/MM/YYYY, and YYYY/MM/DD.
� Back — Returns to the top-level SYS menu.
� Application Options — Application options displays options applicable to par-
ticular mode.
� External Ref Freq — Set the external reference frequency from 2 MHz to
20 MHz.
� Back — Returns to the top-level SYS menu.
� Self Test — Start an instrument self test.
� Status — In cable and antenna analyzer freq or dist measurement mode, dis-
plays the current instrument status, including calibration status, temperature,
and battery charge state. Press ESCAPE to return to operation.
� GPS — Opens the GPS soft key menu.
� Press the GPS On/Off soft key to turn the GPS feature on or off.
� Press the Location soft key to view the latitude, longitude and altitude in-
formation and UTC timing.
� Press the Quality soft key to display the number of tracked satellites and
the GPS quality.
� Press the Reset soft key to reset the GPS.
� Back — Returns to the previous menu.
� Language — Pressing this soft key immediately changes the language used to
display messages on the Cell Master status window. Choices are English,
French, German, Spanish, Chinese, and Japanese. The default language is
English.
Chapter 2 Functions and Operations
2-79

T1 Tester Mode (Option 50)
In T1 Tester mode (Option 50), the FREQ/DIST and AMPLITUDE hard keys are not used.
Pressing the MEAS/DISP key in T1 Tester mode causes the soft keys, below, to be dis-
played:
2-80
Chapter 2 Functions and Operations
MODE=T1 Tester:
SOFTKEYS:
Volume
Setup
ANSI CRC/Japan CRC
SelectChannel
TransmitOn/Off
TransmitFrequency
TransmitLevel
Internal
B8ZS
BERT
CSU
Bit
User 1
FramingBits
FramingMode
Terminate
Terminate/Bridged
ClockSource
Auto
MeasureDuration
External
AMI
Vpp
VFChannelAccess
NIU
BPV
User 2
RAI
In Band/Data Link
AIS
ReceiveInput
Monitor+20 dB
LoopCode
Bridged
SetupErrorInsert
D4 SF
ESF
Start /Stop
Measure
Start /Stop
Measure
LineCoding
More
Back
Back
Back
Back
SelfLoopUp
RemoteLoopUp
SelfLoopDown
RemoteLoopDown
More
Back
Back
Vpp/dBdsx
Back
Back
Back
Back
Pattern
InsertErrors
DisplayRaw Data/Histogram
Back
0 dB
-15 dB
-7.5 dB
TransmitLevel
Back
TimeScale
(If Histogramis selected)
MEAS/DISP
Figure 2-30. T1 Tester Mode Soft Keys

MEAS/DISP Choosing MEAS/DISP in T1 mode causes the soft keys below to be displayed.
� Setup — Activates menus that are used to set BERT testing options.
� Framing Mode — Selects the framing mode to be used.
� Auto — Automatically detects the received framing mode.
� D4 SF — Sets the T1 framing mode to Super Frame.
� ESF — Sets the T1 framing mode to Extended Super Frame.
� Back — Returns to the previous menu.
� Receive Input
� Terminate — Terminates the circuit under test with 100�. Termi-nate mode is used to test out of service or newly installed T1 lineswhen there is no traffic data.
� Bridged — Bridged mode provides greater than 1 k� impedance totest the in-service line by bridging the receiver input across T1lines.
� Monitor +20 dB — Monitor mode adds 20 dB of gain, and is usedwhen the connection to the circuit under test is through a 20 dBpad. In the monitor mode the Cell Master sensitivity is increasedby 20 dB to account for the resistive loss at the port, and is set for100� nominal input impedance. In this mode the technicianshould be careful not to disturb the signal by using the wrong con-nector.
� Back — Returns to the previous menu.
� Pattern — Opens a list of available BERT patterns. Use the soft keys
or the Up/Down arrow key to highlight a pattern and press ENTER to
select.
� Line Coding — Selects the line coding to be used.
� B8ZS — Bipolar with eight-zero substitution. A T1 code in whichbipolar violations are deliberately inserted if the user data containsa string of eight or more consecutive zeros. B8ZS is used to en-sure a sufficient number of transitions to maintain system synchro-nization.
� AMI — Alternate Mark Inversion. A bipolar signal in which onesare encoded as pulses with alternating polarity, and zeros are en-coded as zero amplitude.
� Back — Returns to the previous menu.
� More
� Clock Source — Selects the clock source.
� Internal — Uses the internal clock.
� External — The Cell Master clock is synchronized with the re-ceived signal clock.
� Back — Returns to the previous menu.
Chapter 2 Functions and Operations
2-81

� Setup Error Insert — Opens the error insert menu which allows inser-
tion of the following errors in the transmitting signal.
� Bit — Configures the unit to insert bit errors.
� BPV — Configures the unit to insert Bipolar Violations.
� Framing Bits — Configures the unit to insert framing bit errors.
� RAI — Configures the unit to send a Remote Alarm Indication(yellow alarm).
� AIS — Configures the unit to send an Alarm Indication Signal(blue alarm).
� Back
� Loop Code — Selects the loop code to be used.
� CSU — Channel Service Unit. Configures the unit to send CSUloopback codes.
� NIU — Network Interface Unit. Configures the unit to send NIUloopback codes.
� User 1 — Configures the unit to send a user-defined loopbackcode.
� User 2 — Configures the unit to send a user-defined loopbackcode.
� In Band/Data Link — Configures the unit to send the loopbackcode either in the data stream or in the Facility Data Link. TheData Link mode cannot be selected with D4SF framing.
� Back
� Transmit Level — Selects the T1 transmit level.
� 0 dB
� –7.5 dB
� –15 dB
� Back
� ANSI CRC/Japan CRC — Selects either the ANSI or Japanese meth-
ods for calculating CRC. Also selects between the ANSI and Japanese
methods of generating RAI.
� Back
� BERT — Activates menus that are used to control the BERT measurement.
� Display Raw Data/Histogram — Selects whether to display the raw
data or a histogram.
� Start/Stop Measure — Starts or stops the measurement.
� Insert Errors — Injects the selected error(s) into the data stream, or
sends the selected alarm when in transmitting mode.
� Measure Duration — Selects the duration of the measurement. The du-
ration can be 3 minutes, 15 minutes, 30 minutes, 1 hour, 3 hours, 6
hours, 12 hours, 1 day, 2 days or the duration can be manually set.
Use the Up/Down arrow key to display the desired duration and press
ENTER to select, or ESCAPE to restore the previous value.
2-82
Chapter 2 Functions and Operations

� Time Scale — When histogram is selected, the time scale can be set
from one second to one hour in the following steps: 1 second, 15 sec-
onds, 30 seconds, 45 seconds, 1 minute, 15 minutes, 30 minutes, 45
minutes, 60 minutes, or AUTO. When AUTO is selected, the time
scale is adjusted so that the measurement duration will fill the status
window. Use the Up/Down arrow key to display the desired duration
and press ENTER to select, or ESCAPE to restore the previous
value.
� More — Opens the loop code menu.
� Self Loop Up — Loops the received signal to the transmitted sig-nal.
� Self Loop Down — Turns off the internal loopback.
� Remote Loop Up — Transmits the selected loopback activatecode. After the loop activate code has been transmitted for thespecified time, the circuit is tested to see if the attempt was suc-cessful and the result is reported.
� Remote Loop Down — Transmits the selected loopback deactivatecode. After the loopback deactivate code has been transmitted forthe specified time, the circuit is tested to see if the attempt wassuccessful and the result is reported.
� Back — Returns to the previous menu.
� Vpp — Measures and displays the peak-to-peak voltage.
� Start/Stop Measure — Starts or stops the measurement.
� Terminate/Bridged — Select terminated or bridged measurement.
� Vpp/dBdsx — Toggles between a voltage peak-to-peak measurement
and dBdsx measurement.
� Back — Returns to the previous menu.
� VF Channel Access — Opens the VF channel access menu.
� Volume — Adjust the volume using up/down arrow key.
� Select Channel — Select a channel, 1 to 24 to monitor.
� Transmit On/Off — Toggles between transmit On/Off.
� Transmit Frequency — Select a transmit frequency manually, or select
preset frequencies using the Up/Down arrow key. Preset frequencies
are 404 Hz, 1004 Hz, 1804 Hz, 2713 Hz, and 2804 Hz.
� Transmit Level — Use the keypad or the Up/Down arrow key to enter
the transmit frequency level from 0 to –30 dm.
� Back — Returns to the previous menu.
Chapter 2 Functions and Operations
2-83

SYS In T1 measurement mode, pressing the SYS key displays the following System
menu soft key selections:
� System Options — Displays a second level of system option functions:
� Clock — Displays a second level of functions:
� Hour — Enter the hour (0-23) using the Up/Down arrow key or the
keypad. Press ENTER when data entry is complete or ESCAPE to
restore the previous value.
� Minute — Enter the minute (0-59) using the Up/Down arrow key or
the keypad. Press ENTER when data entry is complete or ESCAPE
to restore the previous value.
� Month — Enter the month (1-12) using the Up/Down arrow key or the
keypad. Press ENTER when data entry is complete or ESCAPE to
restore the previous value.
� Day — Enter the day using the Up/Down arrow key or the keypad.
Press ENTER when data entry is complete or ESCAPE to restore the
previous value.
2-84
Chapter 2 Functions and Operations
LogData
SystemOptions
Hour
ApplicationOptions
Clock
Status
Minute
SelfTest
Month LanguageEnglish
Day
Year
Units
GPSOn/Off
Printer
ChangeDate
Format
Back
Back
Back Location
Quality
Reset
Back
GPS
Figure 2-31. SYS Key in T1 Mode (Option 50)

� Year — Enter the year (2003-2036) using the Up/Down arrow key or
the keypad. Press ENTER when data entry is complete or ESCAPE
to restore the previous value.
� Back — Returns to the top-level SYS menu.
� Printer — Displays a menu of supported printers. Use the Up/Down arrow
key and ENTER key to make the selection.
� Units — Select the unit of measurement (metric or English).
� Change Date Format — Toggles the date format between
MM/DD/YYYY, DD/MM/YYYY, and YYYY/MM/DD.
� Back — Returns to the top-level SYS menu.
� Application Options — Application options displays options applicable to par-
ticular mode.
� Log Data — Logs the data.
� Back — Returns to the top-level SYS menu.
� Self Test — Start an instrument self test.
� Status — In cable and antenna analyzer freq or dist measurement mode, dis-
plays the current instrument status, including calibration status, temperature,
and battery charge state. Press ESCAPE to return to operation.
� GPS — Opens the GPS soft key menu.
� Press the GPS On/Off soft key to turn the GPS feature on or off.
� Press the Location soft key to view the latitude, longitude and altitude in-
formation and UTC timing.
� Press the Quality soft key to display the number of tracked satellites and
the GPS quality.
� Press the Reset soft key to reset the GPS.
� Back — Returns to the previous menu.
� Language — Pressing this soft key immediately changes the language used to
display messages on the Cell Master status window. Choices are English,
French, German, Spanish, Chinese, and Japanese. The default language is
English.
Chapter 2 Functions and Operations
2-85
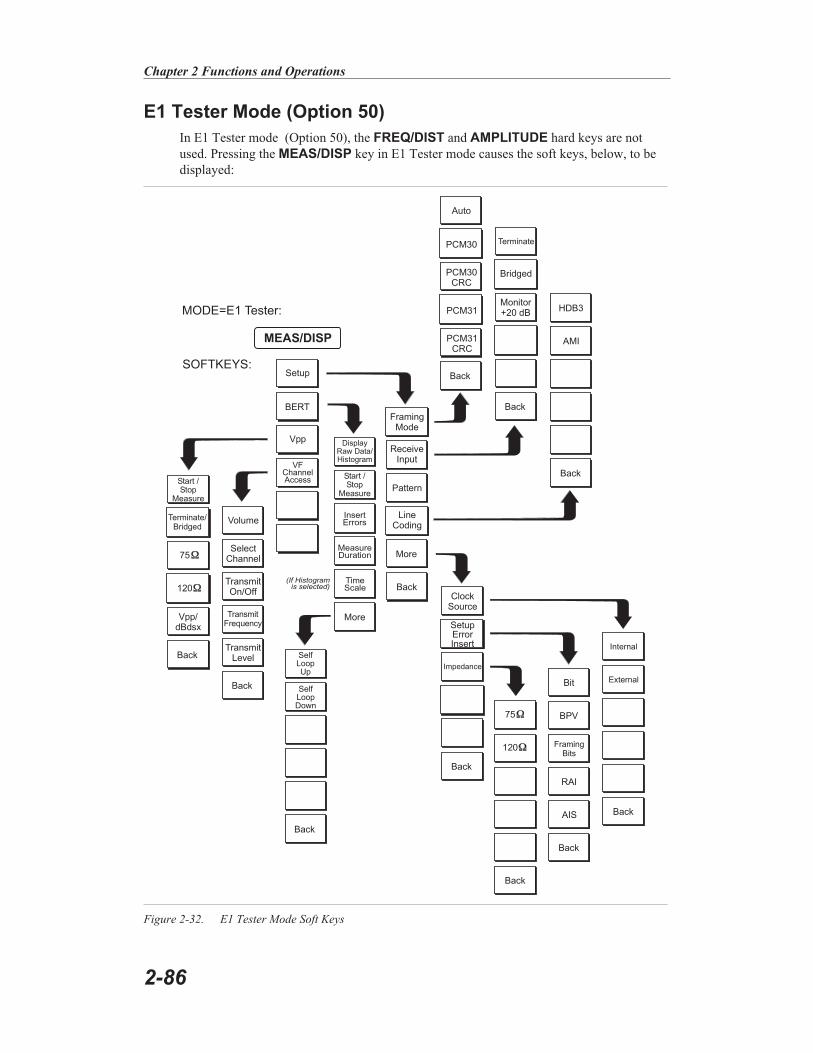
E1 Tester Mode (Option 50)
In E1 Tester mode (Option 50), the FREQ/DIST and AMPLITUDE hard keys are not
used. Pressing the MEAS/DISP key in E1 Tester mode causes the soft keys, below, to be
displayed:
2-86
Chapter 2 Functions and Operations
MODE=E1 Tester:
SOFTKEYS:
Volume
Setup
SelectChannel
TransmitOn/Off
TransmitFrequency
TransmitLevel
Internal
BERT
Bit
FramingBits
FramingMode
Terminate
Terminate/Bridged
ClockSource
Auto
MeasureDuration
External
AMI
Vpp
VFChannelAccess
BPV
RAI
AIS
ReceiveInput
Monitor+20 dB
Bridged
SetupErrorInsert
Start /Stop
Measure
Start /Stop
Measure
LineCoding
More
Back
Back
Back
Back
SelfLoopUp
SelfLoopDown
More
Back
Back
Vpp/dBdsx
Back
Back
Back
Back
Pattern
InsertErrors
DisplayRaw Data/Histogram
Back
TimeScale
(If Histogramis selected)
75
75
120
120
PCM30
PCM30CRC
PCM31
PCM31CRC
HDB3
Impedance
MEAS/DISP
Figure 2-32. E1 Tester Mode Soft Keys

MEAS/DISP Choosing MEAS/DISP in E1 mode causes the soft keys below to be displayed.
� Setup — Activates menus that are used to set BERT testing options.
� Framing Mode — Selects the framing mode to be used.
� Auto — Automatically detects the received framing mode.
� PCM30 — Sets the E1 framing mode to PCM30.
� PCM30 CRC — Sets the E1 framing mode to PCM30 with CRC.
� PCM31 — Sets the E1 framing mode to PCM31.
� PCM31 CRC — Sets the E1 framing mode to PCM31 with CRC.
� Back
� Receive Input
� Terminate — Terminates the circuit under test with either 75 or 120
ohms. Terminate mode is used to test out of service or newly installed
E1 lines when there is no traffic data.
� Bridged — Bridged mode provides greater than 1 k� impedance to
test the in-service line by bridging the receiver input across E1 lines.
� Monitor +20 dB — Monitor mode adds 20 dB of gain, and is used
when the connection to the circuit under test is through a 20 dB pad.
� Back — Returns to the previous menu.
� Pattern — Opens a list of available BERT patterns. Use the soft keys or
the Up/Down arrow key to highlight a pattern and press ENTER to select.
� Line Coding — Selects the line coding to be used.
� HDB3 — High Density Bipolar. An E1 code in which bipolar viola-
tions are inserted if the user data contains more than three consecutive
zeros.
� AMI — Alternate Mark Inversion. A bipolar signal in which ones are
encoded as pulses with alternating polarity, and zeros are encoded as
zero amplitude.
� More
� Clock Source — Selects the clock source.
� Internal — Uses the internal clock.
� External — The clock is recovered from the receiver signal.
� Back — Returns to the previous menu.
� Setup Error Insert — Opens the error insert menu.
� Bit — Configures the unit to insert bit errors.
� BPV — Configures the unit to insert Bipolar Violations.
� Framing Bits — Configures the unit to insert framing bit errors.
� RAI — Configures the unit to send a Remote Alarm Indication(yellow alarm).
� AIS — Configures the unit to send an Alarm Indication Signal(blue alarm).
� Back — Returns to the previous menu.
� Impedance — Sets the Tx and Rx impedance.
Chapter 2 Functions and Operations
2-87

� 75� — Select 75 ohm impedance.
� 120� — Select 120 ohm impedance.
� Back — Returns to the previous menu.
� Back — Returns to the previous menu.
� BERT — Activates menus that are used to control the BERT measurement.
� Display Raw Data/Histogram — Selects whether to display the raw data or
a histogram.
� Start/Stop Measure — Starts or stops the measurement.
� Insert Errors — Injects the selected error(s) into the data stream when
transmitting, or sends the selected alarm.
� Measure Duration — Selects the duration of the measurement. The dura-
tion can be 3 minutes, 15 minutes, 30 minutes, 1 hour, 3 hours, 6 hours, 12
hours, 1 day, 2 days or manual. Use the Up/Down arrow key to display the
desired duration and press ENTER to select, or ESCAPE to restore the
previous value.
� Time Scale — When histogram is selected, the time scale can be set from
one second to one hour in the following steps: 1 second, 15 seconds, 30
seconds, 45 seconds, 1 minute, 15 minutes, 30 minutes, 45 minutes, 60
minutes, or AUTO. Use the Up/Down arrow key to display the desired
time scale and press ENTER to select, or ESCAPE to restore the previous
value.
� More
� Self Loop Up — Loops the received signal to the transmitted signal.
� Self Loop Down — Turns off the internal loopback.
� Back — Returns to the previous menu.
� Vpp — Measures and displays the peak-to-peak voltage.
� Start/Stop Measure — Starts or stops the measurement.
� Terminate/Bridged — Select terminate or bridging for the Vpp measure-
ment.
� 75� — Select 75� impedance.
� 120� — Select 120� impedance.
� Vpp/dBdsx — Toggles between a voltage peak-to-peak measurement and
dBdsx measurement.
� Back — Returns to the previous menu.
� VF Channel Access — Opens the VF channel access menu.
� Volume — Adjust the volume using up/down arrow key.
� Select Channel — Select a channel, 1 to 24 to monitor.
� Transmit On/Off — Toggles between transmit On/Off.
� Transmit Frequency — Select a transmit frequency manually, or select pre-
set frequencies using the Up/Down arrow key. Preset frequencies are 404
Hz, 1004 Hz, 1804 Hz, 2713 Hz, and 2804 Hz.
� Transmit Level — Use the keypad or the Up/Down arrow key to enter the
transmit frequency level from 0 to –30 dm.
2-88
Chapter 2 Functions and Operations

SYS In E1 measurement mode, pressing the SYS key displays the following System
menu soft key selections:
� System Options — Displays a second level of system option functions:
� Clock — Displays a second level of functions:
� Hour — Enter the hour (0-23) using the Up/Down arrow key or the
keypad. Press ENTER when data entry is complete or ESCAPE to
restore the previous value.
� Minute — Enter the minute (0-59) using the Up/Down arrow key or
the keypad. Press ENTER when data entry is complete or ESCAPE
to restore the previous value.
� Month — Enter the month (1-12) using the Up/Down arrow key or the
keypad. Press ENTER when data entry is complete or ESCAPE to
restore the previous value.
� Day — Enter the day using the Up/Down arrow key or the keypad.
Press ENTER when data entry is complete or ESCAPE to restore the
previous value.
Chapter 2 Functions and Operations
2-89
LogData
SystemOptions
Hour
ApplicationOptions
Clock
Status
Minute
SelfTest
Month LanguageEnglish
Day
Year
Units
GPSOn/Off
Printer
ChangeDate
Format
Back
Back
Back Location
Quality
Reset
Back
GPS
Figure 2-33. SYS Key in E1 Mode (Option 50)

� Year — Enter the year (2003-2036) using the Up/Down arrow key or
the keypad. Press ENTER when data entry is complete or ESCAPE
to restore the previous value.
� Back — Returns to the top-level SYS menu.
� Printer — Displays a menu of supported printers. Use the Up/Down arrow
key and ENTER key to make the selection.
� Units — Select the unit of measurement (metric or English).
� Change Date Format — Toggles the date format between
MM/DD/YYYY, DD/MM/YYYY, and YYYY/MM/DD.
� Back — Returns to the top-level SYS menu.
� Application Options — Application options displays options applicable to par-
ticular mode.
� Log Data — Logs the data.
� Back — Returns to the top-level SYS menu.
� Self Test — Start an instrument self test.
� Status — In cable and antenna analyzer freq or dist measurement mode, dis-
plays the current instrument status, including calibration status, temperature,
and battery charge state. Press ESCAPE to return to operation.
� GPS — Opens the GPS soft key menu.
� Press the GPS On/Off soft key to turn the GPS feature on or off.
� Press the Location soft key to view the latitude, longitude and altitude in-
formation and UTC timing.
� Press the Quality soft key to display the number of tracked satellites and
the GPS quality.
� Press the Reset soft key to reset the GPS.
� Back — Returns to the previous menu.
� Language — Pressing this soft key immediately changes the language used to
display messages on the Cell Master status window. Choices are English,
French, German, Spanish, Chinese, and Japanese. The default language is
English.
2-90
Chapter 2 Functions and Operations

EVDO Mode (Options 34, 62, and 63)
The following section explains the hard keys and soft keys available when the Cell Master
is set to EVDO mode. The Cell Master can measure EVDO performance over the air with
an antenna, or by connecting the base station directly to the Cell Master. Option 34, EVDO
Over The Air (OTA), requires Option 31 (GPS) and Option 63 (EVDO Demodulator).
Chapter 2 Functions and Operations
2-91
MODE = EVDO:
SOFTKEYS:Center
PageUp
PageUp
SignalStandard
ExternalRefFreqSelect
Standard
PageDown
PageDown
SelectChannel
ChannelIncrement
CDPScale
dBm/Watts
PowerOffset
Topof
List
Topof
List
Back
Bottomof
List
Bottomof
List
ShowAll
ShowSelected
Select/Deselect
FREQ/DIST AMPLITUDE
Figure 2-34. EVDO Mode Softkey Menu Map, FREQ/DIST and AMPLITUDE Keys

FREQ/DIST Choosing FREQ/DIST in EVDO mode causes the soft keys, below, to be dis-
played and the corresponding values to be shown in the message area.
� Center � Sets the center frequency. Enter a value using the Up/Down arrow
key or keypad, press ENTER to accept, ESCAPE to restore the previous
value.
� Signal Standard � Opens a menu of soft keys used to select the signal stan-
dard to be used. For more information on signal standards, refer to Appendix
C.
� Select Standard � Opens the signal standard menu, showing the currently
selected signal standards. Use the soft keys to navigate the list. Press the
Show All soft key to show the complete signal standard list. When the
complete list is displayed, the currently selected signal standards are
marked with an asterisk. Press the Show Selected soft key to show only
the currently selected signal standards.
� Select Channel � Sets the channel information for the available standard.
� Channel Increment — Changes the channel increment step size when the
Up/Down arrows are used to select the channel number.
� Back � Returns to the previous menu.
� External Ref Freq — Set the external reference frequency. Valid values are: 3
MHz, 9.8304 MHz (8x), 10 MHz, 13 MHz, 15 MHz, 19.6608 MHz (16x).
AMPLITUDE Choosing AMPLITUDE in EVDO mode causes the soft keys, below, to be dis-
played and the corresponding values to be shown in the message area.
� CDP Scale — The CDP (Code Domain Power) scale can be manually set
from 1 dB/Div to 15 dB/Div.
� dBm/Watts — The measurement results can be displayed in either dBm or
Watts.
� Power Offset — Choose Power Offset to have the Cell Master automatically
adjust for the loss through any external cables, attenuators, and couplers.
NOTE: If the loss is not known, Option 21, Transmission Measurement, or the
Offset Calibration can be used to measure the loss of the system.
2-92
Chapter 2 Functions and Operations

MEAS/DISP
Choosing MEAS/DISP in EVDO mode causes the soft keys below to be displayed.
Chapter 2 Functions and Operations
2-93
MODE = EVDO:
SOFTKEYS:
NoTrigger
RisingEdge
MAC CodePower
FallingEdge
Data CodePower
Idle
Active
MeasSpeed
GPSAuto
ExternalAuto
GPSManual
ExternalManual
Back
Back
Back
Back
Back
ExtTriggerPolarity
Overthe AirMeas.
MEAS/DISP
Auto
QPSK
8-PSK
16-QAM
Back
CDP
TextOnly
PNSearch
DataModulation
Type
Back
AdvancedSettings
RFMeas
Setup
Figure 2-35. EVDO Mode Softkey Menu Map, MEAS/DISP Key
� CDP — When CDP is selected, the data can be displayed as a MAC Code
power screen or Data Code Power screen.
� MAC Code Power — In the Mac Code Power screen, Pilot & MAC power
(dBm), Rho Overall 1, Rho Pilot, Data Modulation, and Noise Floor will
be displayed and the three strongest pilots will be displayed in Over The
Air (OTA) measurement mode.
� Data Code Power — In the Data Code Power screen, Data Power (dBm),
Rho Overall 1, Data Modulation, Data Code Max (dB), Data Code Min
(dB), and Pilot Scan Results will be displayed.
� Back — Returns to the previous menu.
� Text Only — Displays Pilot and MAC Power (dBm) critical parameters in a
table format: Pilot Power, Data Power, Channel Power (RMS), Frequency Er-
ror, Data Modulation, PN Offset, Tau, Rho Pilot, Rho Overall 1, Rho Overall
2, Overall EVM, and Carrier Feed Through.
� Over The Air Meas — Select either Pilot Scan or Mutlitpath display.
� Pilot Scan — Displays the six strongest pilots with Tau and Ec/Io
� Multipath — Displays the two strongest multipaths with Ec/Io related to
the strongest pilot.
� RF Meas — Displays the data as Idle or Active Slot information.
� Idle — Displays Pilot & MAC power (dBm), Frequency Error (Hz), Mea-
sured Occupied Bandwidth (kHz), Channel Power (RMS), Idle Activity
(%), and Idle Data Power (dBm).
� Active — Displays Pilot & MAC power (dBm), Frequency Error (Hz),
Measured Occupied Bandwidth (kHz), Channel Power (RMS), Active Ac-
tivity (%), and Active Data Power (dBm).
� Back — Returns to the previous menu.
� Setup — The Setup menu is used to determine the settings for the CDMA
measurement.
� PN Search — To determine PN Numbers and timing errors, the Cell Mas-
ter needs a timing reference. The timing can come from the base station
when the Cell Master is connected to the base station or it can be recov-
ered from GPS when a GPS antenna is connected to the Cell Master.
� GPS Auto — The Cell Master uses GPS as the timing reference, and
automatically detects the strongest pilot. The GPS antenna must be
connected to the Cell Master GPS antenna connector. GPS must be
turned on under Sys|GPS|GPS On/Off and the GPS must be locked to
the satellites before GPS Auto can be used.
� GPS Manual — The Cell Master uses GPS as the timing reference,
but it searches only for the specified PN. The GPS antenna must be
connected to the Cell Master GPS antenna. GPS must be turned on un-
der Sys|GPS|GPS On/Off and the GPS must be locked to the satellites
before GPS Manual can be used.
� External Auto — The Cell Master uses an external even second time
mark as the timing reference. The time mark is usually available at the
base station on a BNC connector labeled as "ESTM" or "PP2S." The
ESTM must be connected to the CDMA Timing Input connector on the
Cell Master. The Cell Master will automatically detect the strongest
pilot.
2-94
Chapter 2 Functions and Operations

� External Manual — The Cell Master uses an external even second
time mark as the timing reference. This is usually available at the base
station on a BNC connector labeled as "ESTM" or "PP2S". This
ESTM must be connected to the CDMA Timing Input connector on the
Cell Master. The Cell Master will search only for the specified PN.
� No Trigger — If both GPS and external timing are unavailable, choose
No Trigger for the PN search.
� Data Modulation Type — In EVDO, the modulation can vary depending
upon the location. Different modulation types, QPSK, 8-PSK and 16-QAM
are supported. Select Auto to demodulate any type of modulation. To de-
modulate a specific modulation type select the appropriate soft key.
� Advanced Settings — Advanced settings include the measurement length
and the external trigger polarity.
� Meas Speed — Sets the speed of the measurement. Use the Up/Down
arrow key to select FAST, NORMAL or SLOW. Press ENTER to ac-
cept or ESCAPE to restore the previous value.
� Ext Trigger Polarity — The EVDO timing input can use the rising edge
or the falling edge of the ESTM as the zero point in time.
� Back — Returns to the previous menu.
� Back — Returns to the previous menu.
Chapter 2 Functions and Operations
2-95
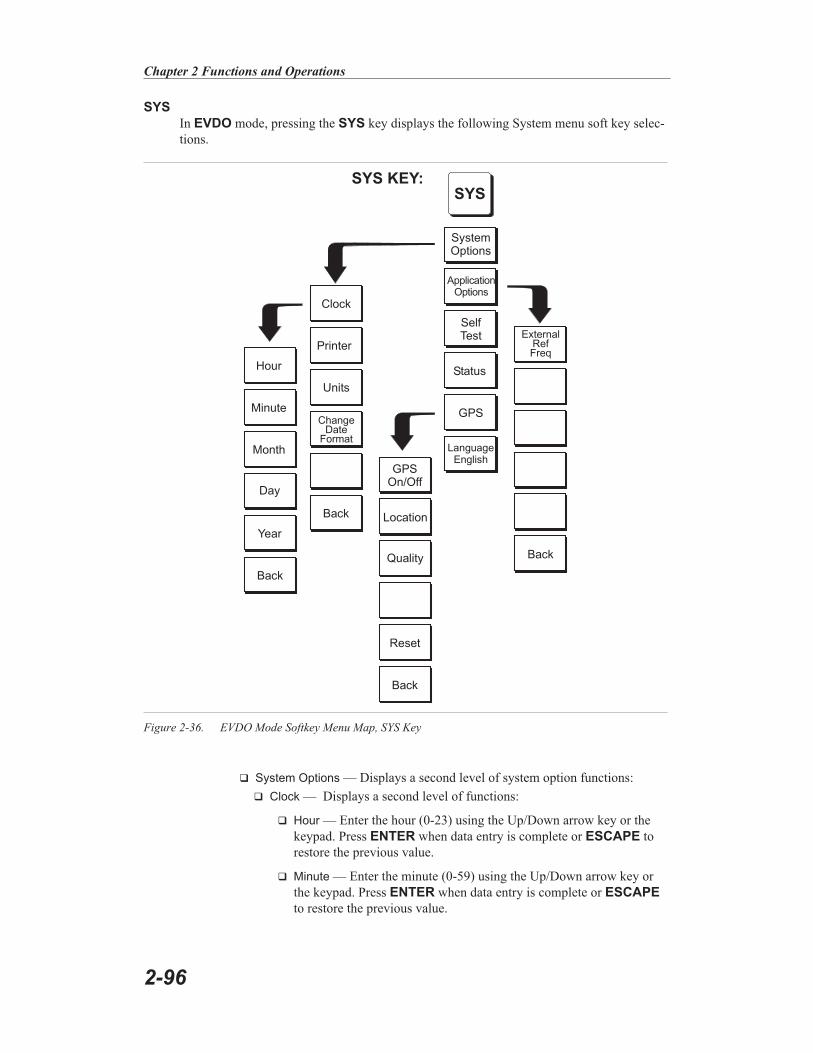
SYS
In EVDO mode, pressing the SYS key displays the following System menu soft key selec-
tions.
� System Options — Displays a second level of system option functions:
� Clock — Displays a second level of functions:
� Hour — Enter the hour (0-23) using the Up/Down arrow key or the
keypad. Press ENTER when data entry is complete or ESCAPE to
restore the previous value.
� Minute — Enter the minute (0-59) using the Up/Down arrow key or
the keypad. Press ENTER when data entry is complete or ESCAPE
to restore the previous value.
2-96
Chapter 2 Functions and Operations
ExternalRefFreq
SystemOptions
Hour
ApplicationOptions
Clock
Status
Minute
SelfTest
Month LanguageEnglish
Day
Year
Units
GPSOn/Off
Printer
ChangeDate
Format
Back
Back
Back Location
Quality
Reset
Back
GPS
Figure 2-36. EVDO Mode Softkey Menu Map, SYS Key

� Month — Enter the month (1-12) using the Up/Down arrow key or the
keypad. Press ENTER when data entry is complete or ESCAPE to
restore the previous value.
� Day — Enter the day using the Up/Down arrow key or the keypad.
Press ENTER when data entry is complete or ESCAPE to restore the
previous value.
� Year — Enter the year (2003-2036) using the Up/Down arrow key or
the keypad. Press ENTER when data entry is complete or ESCAPE
to restore the previous value.
� Back — Returns to the top-level SYS menu.
� Printer — Displays a menu of supported printers. Use the Up/Down arrow
key and ENTER key to make the selection.
� Units — Select the unit of measurement (metric or English).
� Change Date Format — Toggles the date format between
MM/DD/YYYY, DD/MM/YYYY, and YYYY/MM/DD.
� Back — Returns to the top-level SYS menu.
� Application Options — Application options displays options applicable to par-
ticular mode.
� External Ref Freq — Set the external reference frequency from 2 MHz to
20 MHz.
� Back — Returns to the top-level SYS menu.
� Self Test — Start an instrument self test.
� Status — In cable and antenna analyzer freq or dist measurement mode, dis-
plays the current instrument status, including calibration status, temperature,
and battery charge state. Press ESCAPE to return to operation.
� GPS — Opens the GPS soft key menu.
� Press the GPS On/Off soft key to turn the GPS feature on or off.
� Press the Location soft key to view the latitude, longitude and altitude in-
formation and UTC timing.
� Press the Quality soft key to display the number of tracked satellites and
the GPS quality.
� Press the Reset soft key to reset the GPS.
� Back — Returns to the previous menu.
� Language — Pressing this soft key immediately changes the language used to
display messages on the Cell Master status window. Choices are English,
French, German, Spanish, Chinese, and Japanese. The default language is
English.
Chapter 2 Functions and Operations
2-97

Symbols
Table 2-1 provides a listing of the symbols used as condition indicators on the LCD status
window.
2-98
Chapter 2 Functions and Operations
Icon Symbol
Cell Master is in Hold for power conservation. To resume sweeping, press
the RUN/HOLD key. When running on battery power, after 10 minutes
without a key press, the Cell Master will automatically activate the power
conservation mode.
GPS is on and locked to the satellites.
This symbol displayed in red means GPS is on and is searching for satel-
lites. The same symbol in green means the Cell Master has stored the GPS
location information but is not currently locked to the satellites. The data
will remain stored until the unit is turned off.
Integrator Failure. Intermittent integrator failure may be caused by inter-
ference from another antenna. Persistent integrator failure indicates a need
to return the Cell Master to the nearest Anritsu Service Center for repair.
Lock fail indication. Check battery. (If the Cell Master fails to lock with a
fully charged battery, call your Anritsu Service Center.)
When calibration is performed, the Cell Master stores the temperature. If
the temperature drifts outside the specified range, this icon will appear at
the top of the status window, and the Cal Off message will be displayed. A
recalibration at the current temperature is recommended.
Indicates the remaining charge on the battery. The inner white rectangle
grows longer as the battery charge depletes.
Indicates internal data processing.
The Cell Master has been calibrated with discrete Open, Short and Load
components.
The Cell Master has been calibrated with the InstaCal Module.
The Cell Master has not been calibrated.
The Cell Master has been calibrated with discrete Open, Short and Load.
components for the frequency supported by the unit (25 MHz to 4000
MHz).
The Cell Master has been calibrated with the InstaCal Module for the fre-
quency supported by the unit (25 MHz to 4000 MHz).
Table 2-1. LCD Icon Symbols
HOLD
GPS
GPS
dx�
T
�
Cal On
Cal On!
Cal Off
FlexCal On
FlexCal On!

Self Test
At turn-on, the Cell Master runs through a series of quick checks to ensure the system is
functioning properly. Note that the voltage and temperature are displayed in the lower left
corner below the self test message. If the battery is low, or if the ambient temperature is not
within the specified operational range, Self Test will fail. If Self Test fails and the battery is
fully charged and the Cell Master is within the specified operating temperature range, call
your Anritsu Service Center.
During operation, the self test can be run by pressing the SYS key and selecting the Self
Test soft key (Figure 2-37). An example of the self test results display is shown below.
Press ESCAPE to conclude the self test, or press the T1/E1 Test soft key to run a self test
on the T1/E1 circuitry (if Option 50 is installed). The T1/E1 cables must be removed from
the instrument before performing the T1/E1 self test. Press ESCAPE to conclude the self
test.
Chapter 2 Functions and Operations
2-99
Selftest
Temperature . . . . . . . . . . . . 24�C
Memory . . . . . . . . . . . . . . . . PASSED
RTC Battery. . . . . . . . . . . . . 3.1V
Voltage . . . . . . . . . . . . . . . . Battery (11.1V)
Battery Cal . . .. . . . . . . . . . . PASSED
Battery Charge. . . . . . . . . . . 84% (I = –743mA)
VNA PLL . . . . . . . . . . . . . . . PASSED
VNA Integrator . . . . . . . . . . PASSED
SPA LO . . . . . . . . . . . . . . . . PASSED
Press ESCAPE to return.
Figure 2-37. Self Test Display

Error Messages
Self Test Error Messages
A listing of Self Test Error messages is provided in Table 2-2.
2-100
Chapter 2 Functions and Operations
Error Message Description
Battery Low Battery voltage is less than 9.5 volts. Charge battery. If condition per-
sists, call your Anritsu Service Center.
External Power Low External supply voltage is less than 10 volts. If condition persists, call
your Anritsu Service Center.
PLL Failed Phase-locked loops failed to lock. Charge battery. If condition persists
with a fully charged battery, call your Anritsu Service Center.
Integrator Failed Integration circuit could not charge to a valid level. Charge battery. If
condition persists with a fully charged battery, call your Anritsu Ser-
vice Center.
EEPROM R/W
Failed
Non-volatile memory system has failed. If condition persists, call your
Anritsu Service Center..
Out Of Temp.
Range
Ambient temperature is not within the specified operating range. If the
temperature is within the specified operating range and the condition
persists, call your Anritsu Service Center.
RTC Battery Low The internal real-time clock battery is low. A low or drained clock bat-
tery will affect the date stamp on saved traces. If condition persists,
call your Anritsu Service Center..
LO Lock Fail The local oscillator in the spectrum analyzer has phase lock loop er-
rors. If condition persists with a fully charged battery, call your Anritsu
Service Center.
Battery Cal Lost Battery communication failed. The indicated battery charge status may
be invalid. If condition persists, call your Anritsu Service Center.
Memory Fail The EEPROM test on the Cell Master main board has failed. If condi-
tion persists, call your Anritsu Service Center.
The time and date
Have not been set
on this Cell Master.
To set it, after exit-
ing here press
the <SYS> [Clock]
keys.
Press ENTER or
ESC to continue
The time and date are not properly set in the Cell Master. If condition
persists, call your Anritsu Service Center.
Note: A listing of Anritsu Service Centers is provided on page 1-15.
Table 2-2. Self Test Error Messages

Range Error Messages
A listing of Range Error messages is provided in Table 2-3.
Chapter 2 Functions and Operations
2-101
Error Message Description
RANGE
ERROR:F1 > F2
The start (F1) frequency is greater than the stop (F2) frequency.
RANGE
ERROR:D1 > D2
The start (D1) distance is greater than the stop (D2) distance.
RANGE
ERROR:D2 >
DMax=xx.x ft (m)
The stop distance (D2) exceeds the maximum unaliased range. This
range is determined by the frequency span, number of points,
and relative propagation velocity:
MaximumUnaliased Rangedp V f
F F�
� �
�
( . ) ( ) ( )1 5 108 1
2 1
Where: dp is the number of data points (130, 259, or 517)
Vf is the relative propagation velocity
F2 is the stop frequency in Hz
F1 is the start frequency in Hz
Maximum Unaliased Range is in meters
RANGE ERROR:
TOP<=BOTTOM
The SWR scale parameter top value is less than or equal to its bottom
value.
RANGE ERROR:
TOP>=BOTTOM
The RL scale parameter top value is greater than or equal to its bottom
value.
Table 2-3. Range Error Messages

Spectrum Analyzer Error Messages
A listing of Spectrum Analyzer Error Messages is provided in Table 2-4.
2-102
Chapter 2 Functions and Operations
Error Message Description
OVER LOAD
Decrease Input Power
This error message is displayed when there is too much input power.
OVER RANGE!
Increase Attenuation
The ADC is over range.
Mixer Saturation!
Increase Atten
The Mixer has saturated.
Ext Ref Not Locked This error is displayed when a signal is present at the external refer-
ence port, but is not locked to the specified frequency.
External reference un-
available Using inter-
nal reference.
This error is displayed when there is no signal detected at the External
Reference port.
Must be in Zero Span
to perform this opera-
tion
This error is displayed when the user attempts to change the following
parameters when not in zero span:
CHANGE TRIGGER POSITION – (MEAS/DISP/TRIGGER)
VIDEO TRIGGER – (MEAS/DISP/TRIGGER)
Cannot Perform Oper-
ation in Zero Span
This error is displayed when the user tries to do field strength, occupied
bandwidth, channel power and adjacent channel power measurements
when in Zero Span.
Xref N MHz The internal reference is locked to an N MHz external clock.
Min RBW for Zero
Span is 30 kHz. RBW
has been adjusted.
The RBW in Zero Span mode must be at least 30 kHz. If it is not, it will
automatically be adjusted to 30 kHz and this message will be dis-
played.
Over Power Condi-
tion! Remove signals
connected to RF In
port and re-enter
Spectrum Analyzer
mode.
This error message is displayed when the spectrum analyzer mode
cannot be properly calibrated due to too much signal power. The power
must be removed, and the mode re-entered in order to calibrate the
unit.
Table 2-4. Spectrum Analyzer Error Messages

InstaCal Error Messages
If the serial number of the connected InstaCal module does not match the serial number
stored in the Cell Master, the following message is displayed:
The InstaCal characterization data stored in the Cell Master
is for a module different than the one currently connected.
Cell Master contains data for InstaCal module S/N: xxxxx
Currently connected InstaCal Module S/N: xxxxx
Would you like to overwrite the previously loaded InstaCal characterization?
Press the YES soft key to update the stored InstaCal characterization to use the currently
connected module.
Press the NO soft key to keep the stored InstaCal characterization.
A listing of possible InstaCal error messages is provided in Table 2-5.
Bias Tee Error Message (Option 10A only)
The following error message will display if there is an excessive load on the RF In port
while using the Bias Tee option.
Error Message Description
Bias Tee Fault. Excessive Load on the Rf In port. Fix Error to continue. Possible fixes
include:
1. Remove the excessive load from the RF In port
2. Turn off the Bias-Tee option
Chapter 2 Functions and Operations
2-103
Error Message Description
Failed to read serial
number of InstaCal
module
The Cell Master was unable to read the InstaCal module serial number.
Failed to success-
fully transfer
InstaCal module
data to Cell Master
The Cell Master was unable to transfer all necessary data between the
InstaCal module and the Cell Master.
Failed to set baud
with InstaCal
module
The Cell Master was unable to establish communication with the
InstaCal module.
Table 2-5. InstaCal Error Messages

High Accuracy Power Meter (Option 19) Error Messages
The following error messages could be displayed on the Cell Master when using the High
Accuracy Power Meter mode with Power Sensor PSN50. If any error condition persists,
contact your local Anritsu Service Center.
General Error Messages
A listing of General Error Messages is provided below.
2-104
Chapter 2 Functions and Operations
Error Message Description
Warning! Power
Supply Error
Verify that the supply is connected properly.
Warning! RF Power
Level is too high
The specified upper measurement range is +20 dBm. Do not exceed
the specification.
Warning! Sensor
not zeroed properly.
Zero sensor again
The sensor must be zeroed with nothing connected to it.
Warning! Specified
temperature range (0
to 50�C) exceeded
The PSN50 sensor temperature range is 0 to 50�C.
Warning! Tempera-
ture has changed.
Zero sensor again
The temperature changed more than the allowable limit after the sen-
sor was zeroed.
Table 2-6. Option 19 Error Messages
Error Message Description
CAL
Incomplete
A complete open, short, and load calibration must be performed before
calibration can be turned on.
Dist Requires
F1 < F2
Valid distance to fault plots require a non-zero frequency span.
Invalid Sweep Data The sweep data is invalid.
Use Options menu
to select a printer
Attempting to print a display with no printer selected. Select a printer,
then retry.
Flexcal is not suit-
able for this case,
Change To OSL
CAL mode
The cable is too long or too reflective for FlexCal to work. OSL cal
must be used instead.
Cannot zero
input signal too high
Attempting to perform a Power Meter zero adjust function with an in-
put of greater than –20 dBm.
Level Under The level of the signal is not strong enough to make a measurement.
Table 2-7. General Error Messages

Battery Information
Charging a New Battery
The NiMH battery supplied with the Cell Master has already completed charge and dis-
charge cycles at the factory and full battery performance should be realized after your first
charge.
NOTE: The battery will not charge if the battery temperature is above 45� C or
below 0� C.
Charging the Battery in the Cell Master
The battery can be charged while installed in the Cell Master.
Step 1. Turn the Cell Master off.
Step 2. Connect the AC-DC adapter (Anritsu part number: 40-168) to the Cell Master
charging port.
Step 3. Connect the AC adapter to a 120 VAC or 240 VAC power source as appropriate
for your application.
The green external power indicator on the Cell Master will illuminate, indicating
the presence of external DC power, the battery charge indicator will light, and
the battery will begin fast charging. The charging indicator will remain lit as
long as the battery is fast charging. Once the battery is fully charged, the fast
charging indicator will turn off and a trickle charge will be started to maintain
battery capacity. If the battery fails to charge, contact your nearest Anritsu ser-
vice center.
NOTES: If a battery is excessively discharged, it may require several hours of
trickle charging before the charger will allow a fast charge. Switching to fast
charge mode is not automatic. You must either cycle the power on and off, or
disconnect and reconnect the AC-DC adapter.
If the battery temperature exceeds 45� C while charging, the charging will stop
and the charge indicator will turn off. Charging will resume automatically when
the temperature drops below 45� C.
Charging the Battery in the Optional Charger
Up to two batteries can be charged sequentially in the optional battery charger.
Step 1. Remove the NiMH battery from your Cell Master and place it in the optional
charger (Anritsu part number 2000-1029).
Step 2. Connect the lead from the AC-DC adapter to the charger.
Step 3. Connect the AC-DC adapter to a 120 VAC or 240 VAC power source as appro-
priate for your application.
Chapter 2 Functions and Operations
2-105

Each battery holder in the optional charger has an LED charging status indicator. The LED
color changes as the battery is charged:
Red indicates the battery is charging
Green indicates the battery is fully charged
Yellow indicates the battery is in a waiting state (see below).
A yellow light may occur because the battery became too warm during the charge cycle.
The charger will allow the battery to cool off before continuing the charge. A yellow light
may also indicate that the charger is alternating charge to each of the two batteries.
A blinking red light indicates less than 13 VDC is being supplied to the charger stand.
Check that the correct AC charger adapter is connected to the charger stand. If the battery
fails to charge, contact your nearest Anritsu Service Center.
Determining Remaining Battery Life
When the AC-DC adapter is unplugged from the Cell Master, the battery indicator symbol
will be continuously displayed at the top left corner of the Cell Master display (Figure
2-38). A totally black bar within the battery icon indicates a fully charged battery. When
LOW BATT replaces the battery indicator bar at the top left corner, a couple of minutes of
measurement time remains. If a flashing LOW BATT is accompanied by an audio beep at
the end of each trace, the battery has approximately one minute of useable time remaining.
Once all the power has drained from the battery, the Cell Master LCD will fade. At this
point, your Cell Master will switch itself off and the battery will need to be recharged.
During operation, the battery condition can be viewed by pressing the SYS key and select-
ing the Self Test soft key (Figure 2-39). The battery condition will be displayed as a per-
centage of charge remaining.
2-106
Chapter 2 Functions and Operations
BATTERY INDICATOR
AllOff
More
Figure 2-38. Cell Master Battery Indicator

Battery Life
The NiMH battery will last longer and perform better if allowed to completely discharge
before recharging. For maximum battery life, it is recommended that the NiMH battery be
completely discharged and recharged once every three months.
It is normal for NiMH batteries to self-discharge during storage (Figure 2-40) and to de-
grade to 80% of original capacity after 12 months of continuous use.
The battery can be charged and discharged 300 to 500 times, but it will eventually wear out.
The battery may need to be replaced when the operating time between charging is notice-
ably shorter than normal.
Chapter 2 Functions and Operations
2-107
Selftest
Temperature . . . . . . . . . . . . 24�C
Memory . . . . . . . . . . . . . . . . PASSED
RTC Battery. . . . . . . . . . . . . 3.1V
Voltage . . . . . . . . . . . . . . . . Battery (11.1V)
Battery Cal . . .. . . . . . . . . . . PASSED
Battery Charge. . . . . . . . . . . 84% (I = –743mA)
VNA PLL . . . . . . . . . . . . . . . PASSED
VNA Integrator . . . . . . . . . . PASSED
SPA LO . . . . . . . . . . . . . . . . PASSED
Press ESCAPE to return.
Figure 2-39. Self Test Display
Figure 2-40. NiMH Battery Storage Characteristics

Important Battery Information
� With a new NiMH battery, full performance is achieved after three to five complete
charge and discharge cycles.
� Recharge the battery only in the Cell Master, or in an Anritsu approved charger.
� When the Cell Master or the charger is not in use, disconnect it from the power source.
� Do not charge batteries for longer than 24 hours, as overcharging may shorten battery
life.
� If left unused, a fully charged battery will discharge itself over time.
� Storing the battery in extreme hot or cold places will reduce the capacity and lifetime
of the battery. The battery will discharge faster at higher ambient temperatures (see
Figure 2-40).
� Discharge an NiMH battery from time to time to improve battery performance and bat-
tery life.
� The battery can be charged and discharged hundreds of times, but it will eventually
wear out.
� The battery may need to be replaced when the operating time between charging is no-
ticeably shorter than normal.
� If a battery is allowed to totally discharge, the smart-memory capability of the battery
may be lost, resulting in incorrect battery capacity readings or loss of communication
with the battery.
� Do not short-circuit the battery terminals.
� Do not drop, mutilate or attempt to disassemble the battery.
� Never use a damaged or worn out charger or battery.
� Always use the battery for its intended purpose only.
� Temperature extremes will affect the ability of the battery to charge. Allow the battery
to cool down or warm up as necessary before use or charging.
� Battery storage is recommended at less than 45� C.
� Batteries must be recycled or disposed of properly. Do not place batteries in the trash.
� Do not dispose of batteries in a fire!
2-108
Chapter 2 Functions and Operations
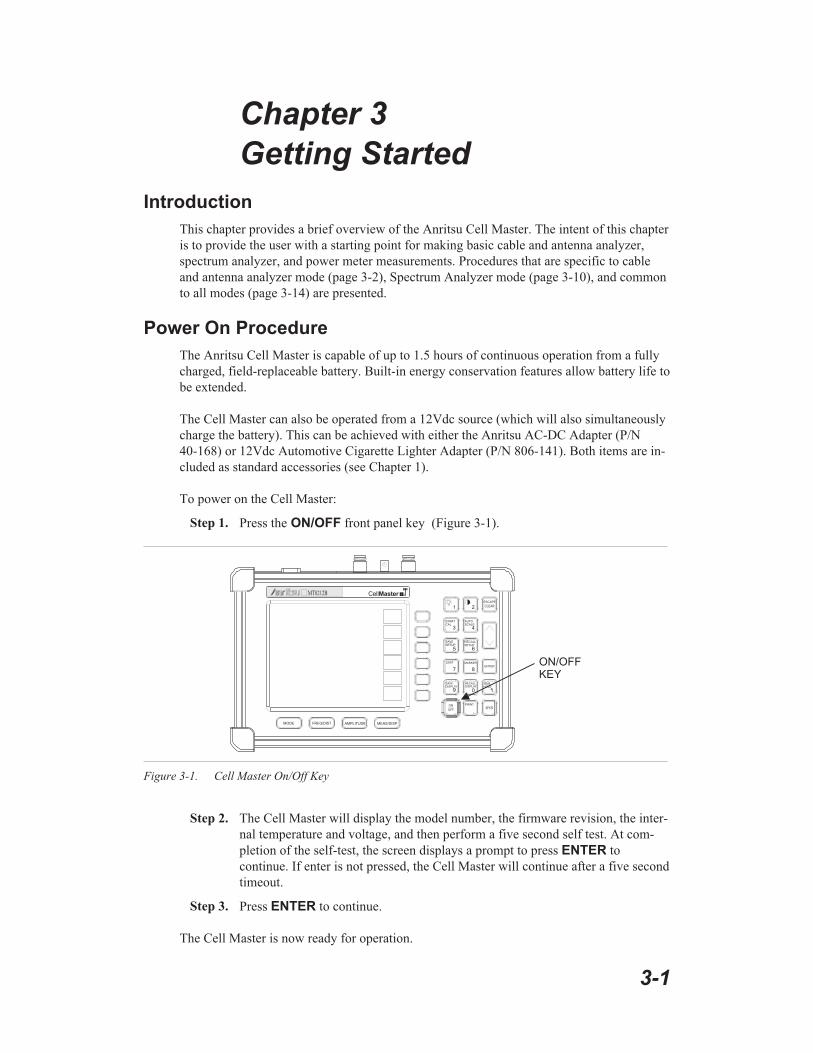
Chapter 3
Getting Started
Introduction
This chapter provides a brief overview of the Anritsu Cell Master. The intent of this chapter
is to provide the user with a starting point for making basic cable and antenna analyzer,
spectrum analyzer, and power meter measurements. Procedures that are specific to cable
and antenna analyzer mode (page 3-2), Spectrum Analyzer mode (page 3-10), and common
to all modes (page 3-14) are presented.
Power On Procedure
The Anritsu Cell Master is capable of up to 1.5 hours of continuous operation from a fully
charged, field-replaceable battery. Built-in energy conservation features allow battery life to
be extended.
The Cell Master can also be operated from a 12Vdc source (which will also simultaneously
charge the battery). This can be achieved with either the Anritsu AC-DC Adapter (P/N
40-168) or 12Vdc Automotive Cigarette Lighter Adapter (P/N 806-141). Both items are in-
cluded as standard accessories (see Chapter 1).
To power on the Cell Master:
Step 1. Press the ON/OFF front panel key (Figure 3-1).
Step 2. The Cell Master will display the model number, the firmware revision, the inter-
nal temperature and voltage, and then perform a five second self test. At com-
pletion of the self-test, the screen displays a prompt to press ENTER to
continue. If enter is not pressed, the Cell Master will continue after a five second
timeout.
Step 3. Press ENTER to continue.
The Cell Master is now ready for operation.
3-1
ON/OFFKEY
HOLDRUN
STARTCAL
AUTOSCALE
SAVESETUP
RECALLSETUP
LIMIT MARKER
SAVEDISPLAY
RECALLDISPLAY
MODE FREQ/DIST AMPLITUDE MEAS/DISP
SYS
ENTER
CLEAR
ESCAPE
ON
OFF
/
1 2
4
5 6
7 8
9 0
3
+-
.
MT8212B CellMaster
Figure 3-1. Cell Master On/Off Key

Cable and Antenna Analyzer Mode
Selecting the Frequency
For the OSL or FlexCal calibration method the frequency range for the desired measure-
ment must be set. The Cell Master will automatically set the frequency when a particular
signal standard is selected, or the frequency can be manually set using the F1 and F2 soft
keys.
To set the frequency to a specific signal standard for an OSL or FlexCal calibration:
Step 1. Press the FREQ/DIST key.
Step 2. Press the Signal Standard soft key.
Step 3. Press the Select Standard key and use the Up/Down arrow key to highlight the
desired standard, then press the ENTER key to select.
To manually select the frequency range for an OSL or FlexCal calibration:
Step 1. Press the FREQ/DIST key.
Step 2. Press the F1 soft key.
Step 3. Enter the desired start frequency using the key pad or the Up/Down arrow key.
Step 4. Press ENTER to set F1 to the desired frequency.
Step 5. Press the F2 soft key.
Step 6. Enter the desired stop frequency using the keypad or the Up/Down arrow key.
Step 7. Press ENTER to set F2 to the desired frequency.
Step 8. Check that the start and stop frequencies displayed match the desired measure-
ment range.
Calibration
Calibration Methods
For accurate results, the Cell Master must be calibrated before making any measurements.
The Cell Master must be re-calibrated whenever the setup frequency changes, the tempera-
ture exceeds the calibration temperature range or when the test port extension cable is re-
moved or replaced.
The two methods of calibrating the Cell Master, FlexCal and OSL calibration, can each be
accomplished with either discrete components or with the InstaCal Module, providing four
calibration techniques for maximum user flexibility. FlexCal is a broadband frequency (25
MHz to 4000 MHz) calibration that remains valid if the frequency is changed. An OSL
calibration is an Open, Short and Load calibration for a selected frequency range, and is no
longer valid if the frequency is changed. The default calibration mode is OSL.
With either calibration method, the Cell Master may be calibrated manually with Open,
Short, Load (OSL) calibration components, or by using the InstaCal module.
3-2
Chapter 3 Getting Started

If a Test Port Extension Cable is to be used, the Cell Master must be calibrated with the
Test Port Extension Cable in place. The Test Port Extension Cable is a phase stable cable
and is used as an extension cable on the test port to ensure accurate and repeatable measure-
ments. This phase stable cable can be moved and bent while making a measurement with-
out causing errors in the measurement.
NOTE: The test port extension cable should have the appropriate connectors
for the measurement. Use of additional connector adapters after the test port
extension cable can contribute to measurement errors not compensated for
during calibration.
Calibration Verification
During the calibration process in Return Loss mode, either with discrete calibration compo-
nents or with the InstaCal module, there are typical measurement levels expected. Verifying
the measurement levels displayed on the screen during calibration can save valuable time in
the field.
Trace Characteristics in Return Loss Mode
As the discrete calibration components are connected to the Cell Master RF out port, the
following measurement levels will be displayed on the screen:
� When an OPEN is connected, a trace will be displayed between 0-10 dB.
� When a SHORT is connected, a trace will be displayed between 0-10 dB.
� When a LOAD is connected, a trace will be displayed between 0-50 dB.
When an InstaCal module is connected to the Cell Master RF out port, the following mea-
surement levels will be displayed on the screen:
� When the Cell Master is measuring an equivalent OPEN, a trace will be displayed
between 0-20 dB.
� When the Cell Master is measuring an equivalent SHORT, a trace will be displayed
between 0-20 dB.
� When the Cell Master is measuring an equivalent LOAD, a trace will be displayed
between 0-50 dB.
The following procedures explain standard OSL, FlexCal, and InstaCal calibration meth-
ods. Refer to Figure 3-2 for a calibration setup diagram.
Chapter 3 Getting Started
3-3

OSL Calibration Procedures
In Cable and Antenna Analyzer Mode, if the Cal Off message is displayed, or the test port
cable has been changed, a new calibration is required. The following procedures detail how
to perform the OSL calibration.
Standard OSL Calibration
Step 1. Select OSL Cal by pressing the SYS key, followed by the Application Options
soft key. The currently selected calibration method is indicated at the bottom of
the status window. Use the CAL Mode soft key to select the OSL calibration
method.
Step 2. Select the appropriate frequency range, as described on page 3-2.
Step 3. Press the START CAL key. The message “Connect OPEN or INSTACAL mod-
ule to RF Out Port” will appear in a message box, with the calibration type in the
message box title bar.
Step 4. Connect the calibrated Open and press the ENTER key. The messages “Mea-
suring OPEN” and “Connect SHORT to RF Out” will appear.
Step 5. Remove the Open, connect the calibrated Short and press the ENTER key. The
messages “Measuring SHORT” and “Connect LOAD to RF Out” will appear.
Step 6. Remove the Short, connect the calibrated Termination and press the ENTER
key. The message “Measuring LOAD” will appear. An audible tone will sound
when the calibration is complete.
Step 7. Verify that the calibration has been properly performed by checking that the Cal
ON message is now displayed in the upper left corner of the display.
3-4
Chapter 3 Getting Started
HOLDRUN
STARTCAL
AUTOSCALE
SAVESETUP
RECALLSETUP
LIMIT MARKER
SAVEDISPLAY
RECALLDISPLAY
MODE FREQ/DIST AMPLITUDE MEAS/DISP
SYS
ENTER
CLEAR
ESCAPE
ON
OFF
/
1 2
4
5 6
7 8
9 0
3
+-
.
S332D
OPEN
LOAD
SHORT CALIBRATION
RFOUT/REFLECTIONTEST PORT
TEST PORT CABLE (OPTIONAL)
Figure 3-2. Calibration Setup

FlexCal OSL Calibration
Step 8. The currently selected calibration method can be viewed by pressing the SYS
key, followed by the Status soft key. To change the calibration method, select
the SYS key, followed by the Application Options soft key. Use the CAL Mode
soft key to select the FlexCal calibration mode.
Step 9. Press the START CAL key. The message “Connect OPEN or INSTACAL mod-
ule to RF Out Port” will appear in a message box, with the calibration type in the
message box title bar.
Step 10. Connect the calibrated Open and press the ENTER key. The messages “Mea-
suring OPEN” and “Connect SHORT to RF Out” will appear and the frequency
is automatically set by the Cell Master from 25 MHz to 4000 MHz.
Step 11. Remove the Open, connect the calibrated Short and press the ENTER key. The
messages “Measuring SHORT” and “Connect LOAD to RF Out” will appear.
Step 12. Remove the Short, connect the calibrated Termination and press the ENTER
key. The message “Measuring LOAD” will appear. An audible tone will sound
when the calibration is complete.
Step 13. Verify that the calibration has been properly performed by checking that the
FlexCal ON message is now displayed in the upper left corner of the LCD.
InstaCal Module Verification
Verifying the InstaCal module before any line sweeping measurements is critical to the
measured data. InstaCal module verification identifies any failures in the module due to cir-
cuitry damage or failure of the control circuitry. This test does not attempt to characterize
the InstaCal module, which is performed at the factory or the service center.
The performance of the InstaCal module can be verified by the Termination method or the
Offset method. The termination method is the preferred method in the field, and is similar
to testing a bad load against a known good load.
Termination Method
The Termination method compares a precision load against the InstaCal module and pro-
vides a baseline for other field measurements. A precision load provides better than 42 dB
directivity.
Step 1. Set the frequency according to the device under test (cellular, PCS, GSM).
Step 2. Press the MODE key and select Freq-Return Loss mode.
Step 3. Connect the InstaCal module to the Cell Master RF Out port and calibrate the
Cell Master using the InstaCal module (page 3-6).
Step 4. Remove the InstaCal module from the RF Out port and connect the precision
load to the RF Out port.
Step 5. Measure the return loss of the precision load. The level should be less than 35
dB across the calibrated frequency range.
Step 6. Press the MARKER key and set the M1 marker to Marker To Peak. The M1
value should be less than 35 dB return loss.
Step 7. Press SAVE DISPLAY (page 3-15) name the trace, and press ENTER.
Chapter 3 Getting Started
3-5
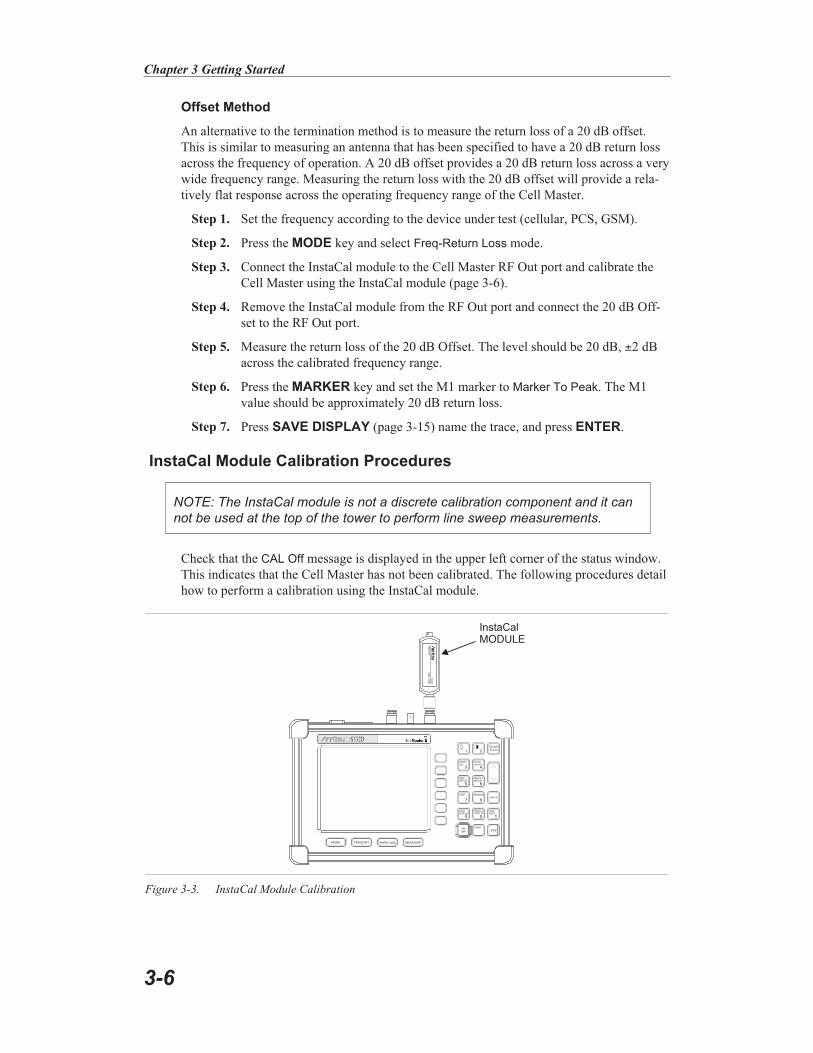
Offset Method
An alternative to the termination method is to measure the return loss of a 20 dB offset.
This is similar to measuring an antenna that has been specified to have a 20 dB return loss
across the frequency of operation. A 20 dB offset provides a 20 dB return loss across a very
wide frequency range. Measuring the return loss with the 20 dB offset will provide a rela-
tively flat response across the operating frequency range of the Cell Master.
Step 1. Set the frequency according to the device under test (cellular, PCS, GSM).
Step 2. Press the MODE key and select Freq-Return Loss mode.
Step 3. Connect the InstaCal module to the Cell Master RF Out port and calibrate the
Cell Master using the InstaCal module (page 3-6).
Step 4. Remove the InstaCal module from the RF Out port and connect the 20 dB Off-
set to the RF Out port.
Step 5. Measure the return loss of the 20 dB Offset. The level should be 20 dB, �2 dB
across the calibrated frequency range.
Step 6. Press the MARKER key and set the M1 marker to Marker To Peak. The M1
value should be approximately 20 dB return loss.
Step 7. Press SAVE DISPLAY (page 3-15) name the trace, and press ENTER.
InstaCal Module Calibration Procedures
NOTE: The InstaCal module is not a discrete calibration component and it can
not be used at the top of the tower to perform line sweep measurements.
Check that the CAL Off message is displayed in the upper left corner of the status window.
This indicates that the Cell Master has not been calibrated. The following procedures detail
how to perform a calibration using the InstaCal module.
3-6
Chapter 3 Getting Started
InstaCal
ModelICN
5010
M
Hz-4.0
G
Hz
InstaCalMODULE
HOLDRUN
STARTCAL
AUTOSCALE
SAVESETUP
RECALLSETUP
LIMIT MARKER
SAVEDISPLAY
RECALLDISPLAY
MODE FREQ/DIST AMPLITUDE MEAS/DISP
SYS
ENTER
CLEAR
ESCAPE
ON
OFF
/
1 2
4
5 6
7 8
9 0
3
+-
.
S332D
Figure 3-3. InstaCal Module Calibration

Standard InstaCal Calibration
Step 1. Select OSL Cal by pressing the SYS key, followed by the Application Options
soft key. The currently selected calibration method is indicated at the bottom of
the status window. Use the CAL Mode soft key to select the OSL calibration
method.
Step 2. Select the appropriate frequency range, as described on page 3-2.
Step 3. Press the START CAL key. The message “Connect OPEN or InstaCal to RF
Out port” will appear in a message box, with the calibration type in the message
box title bar.
Step 4. Connect the InstaCal module to the RF Out port (Figure 3-3).
Step 5. Press the ENTER key. The Cell Master senses the InstaCal module and auto-
matically calibrates the unit using the OSL procedure. The calibration should
take about 45 seconds. An audible tone will sound when the calibration is com-
plete.
Step 6. Verify that the calibration has been properly performed by checking that the Cal
On! message is displayed in the upper left corner of the status window.
FlexCal InstaCal Calibration
Step 1. Select FlexCal by pressing the SYS key, followed by the Application Options
soft key. The currently selected calibration method is indicated at the bottom of
the status window. Use the CAL Mode soft key to select the FlexCal calibration
method.
Step 2. Press the START CAL key. The message “Connect OPEN or InstaCal to RF
Out port” will appear in a message box, with the calibration type in the message
box title bar.
Step 3. Connect the InstaCal module to the RF Out port (Figure 3-3). The Cell Master
automatically sets the frequency from 25 MHz to 4000 MHz.
Step 4. Press the ENTER key. The Cell Master senses the InstaCal module and auto-
matically calibrates the unit using the OSL procedure. The calibration should
take about 45 seconds. An audible tone will sound when the calibration is com-
plete.
Step 5. Verify that the calibration has been properly performed by checking that the
FlexCal On! message is displayed in the upper left corner of the status window.
Calibration with the Test Port Extension Cable
If a Test Port Extension Cable is to be used, the Cell Master must be calibrated with the
Test Port Extension Cable in place. Follow the same calibration procedures as above with
the OSL components or the InstaCal module in place at the end of the test port extension
cable.
Chapter 3 Getting Started
3-7

Auto Scale
The Cell Master can automatically set the scale to the minimum and maximum values of
the measurement on the y-axis of the graph. This function is particularly useful for mea-
surements in SWR mode. To automatically set the scale, press the AUTO SCALE key.
The Cell Master will automatically set the top and bottom scales to the minimum and maxi-
mum values of the measurement with some margin on the y-axis of the LCD.
Amplitude Scale
The following procedure sets the top and bottom scale display.
Step 1. Press the AMPLITUDE key to call up the Scale Menu.
Step 2. Press the Top soft key and use the keypad or Up/Down arrow key to edit the top
scale value. Press ENTER to set.
Step 3. Press the Bottom soft key and use the keypad or Up/Down arrow key to edit the
bottom scale value. Press ENTER to set.
NOTE: Typically the y-axis scale of the graph is 0-60 dB (return loss) but for
some measurements (for example, insertion loss) the scale may be changed to
0-10 dB. If the scale is not changed, some measurement results may not be
easily viewed on the screen.
Set the Distance and Cable Type
In Distance-To-Fault (DTF) mode, the length of the transmission line (distance) and cable
type are selected. The cable type determines the velocity propagation and cable attenuation
factor. The following procedure can be used to set the distance and select the appropriate
cable type.
NOTE: Selecting the correct cable is very important for accurate measurements
and for identifying faults in the transmission line. Selecting the incorrect cable,
or using the correct cable out of its proper frequency characteristics type, will
shift the DTF trace vertically and horizontally making it difficult to accurately lo-
cate faults.
Step 1. Press the MODE key.
Step 2. Select DTF Return Loss or DTF SWR mode. The Cell Master automatically sets
D1 to zero.
Step 3. Press the D2 soft key.
Step 4. Enter the appropriate D2 value for the maximum length of the transmission line
and press the ENTER key to set the D2 value.
Step 5. Press the DTF Aid soft key.
3-8
Chapter 3 Getting Started

Step 6. Using the Up/Down arrow key, select the Cable = and press ENTER. Use the
Up/Down arrow key to select the Standard cable types stored in the standard Cell
Master cable lists (which cannot be edited) or choose Custom, for additional ca-
bles. A custom cable list can be created and uploaded using the Handheld Soft-
ware Tools application provided with the Cell Master (Chapter 10).
Step 7. Using the Up/Down arrow key, select the appropriate type of cable and press the
ENTER key. The selected cable type, Prop Vel and Cable Loss in dB/m (or
dB/ft) will be displayed on the DTF parameters screen.
NOTE: Use the provided Handheld Software Tools program cable editor to add
new cable information to the Cell Master cable list. Refer to Chapter 11 for
more information.
Step 8. Press ENTER.
Chapter 3 Getting Started
3-9

Spectrum Analyzer Mode
Selecting Spectrum Analyzer Mode
Step 1. Press the ON/OFF key.
Step 2. Press the MODE key and use the Up/Down arrow key to select Spectrum Ana-
lyzer mode. Press ENTER to set the mode.
Making a Measurement
Step 1. Connect the input cable to the RF In test port.
Step 2. Locate and display the signal(s) of interest by selecting the desired frequency,
span, and amplitude value.
Selecting the Frequency
Selecting the Start and Stop Frequencies
Step 1. To set a specific frequency band, select the Start soft key and enter the desired
start frequency using the Up/Down arrow key or the keypad and press ENTER
to accept the input.
Step 2. Select the Stop soft key and enter the desired stop frequency using the Up/Down
arrow key or the keypad and press ENTER to accept the input.
Selecting the Center Frequency and Span
NOTE: Changing the center frequency and span will change the start and stop
frequencies. Conversely, changing the Start and Stop frequencies will change
the center frequency and span.
Step 1. To enter a center frequency, select the Center soft key and enter the desired cen-
ter frequency using the Up/Down arrow key or the keypad and press ENTER to
accept the input.
Step 2. Press the Span soft key to display the Span menu.
Step 3. To set a specific span, enter the desired span using the Up/Down arrow key or
the keypad and press ENTER to accept the input.
or
For a full span, select the Full soft key.
or
For a single frequency measurement, select the Zero soft key.
NOTE: To quickly move the span value up or down, select the Span Up 1-2-5 or
Span Down 1-2-5 soft keys. These keys facilitate a zoom-in, zoom-out in a 1-2-5
sequence.
3-10
Chapter 3 Getting Started
Selecting the Signal Standard and Channel
Step 1. Press the Signal Standard soft key and select the appropriate signal standard for
the measurement.
Step 2. Press the Select Channel soft key and select the appropriate channel for the mea-
surement.
Selecting the Amplitude
Step 1. Press the AMPLITUDE key.
Step 2. Press the Units soft key and select the desired units from the soft keys presented
(Volts or Watts in Linear, dBm, dBV, dBmV, or dB�V in Log). Press the Back
soft key to return to the Amplitude menu.
Step 3. Press the Ref Level soft key and use the Up/Down arrow key or directly enter
the desired reference level from the keypad. Press ENTER to set the amplitude
level.
Step 4. Press the Scale soft key and use the Up/Down arrow key or directly enter the de-
sired scale from the keypad. Press ENTER to set the scale. Note that the Scale
soft key is not active when Units is set to Linear.
NOTE: Press the Atten/Preamp soft key and select Auto coupling of the attenu-
ator setting to the reference level to help insure that harmonics and spurs are
not introduced into the measurements.
Selecting Bandwidth Parameters
Both resolution bandwidth (RBW) and video bandwidth (VBW) can be automatically or
manually coupled. Auto coupling of the RBW links the RBW to the span. That is, the wider
the span, the wider the RBW. Auto coupling is indicated on the display as RBW XXX. When
the RBW is manually coupled, it can be adjusted independently of the span. Manual RBW
coupling is indicated on the status window as RBW* XXX.
Auto coupling of the VBW links the VBW to the RBW. That is, the wider the RBW, the
wider the VBW. Auto coupling is indicated on the display as VBW=Auto. When the VBW
is manually coupled, it can be adjusted independently of the RBW. Manual VBW coupling
is indicated on the display as VBW* XXX.
Step 1. Press the MEAS/DISP key and the Bandwidth soft key to display the bandwidth
menu.
Step 2. Press RBW Auto for automatic resolution bandwidth selection, or press RBW
Manual and use the Up/Down arrow key to select the resolution bandwidth.
Press ENTER to set the resolution bandwidth.
Step 3. Press VBW Auto for automatic video bandwidth selection, or press VBW Manual
and use the Up/Down arrow key to select the video bandwidth. Press ENTER to
set the video bandwidth. Press the Back soft key to return to the bandwidth
menu.
Chapter 3 Getting Started
3-11

Selecting Sweep Parameters
Max Hold
To toggle maximum hold on or off, press the MEAS/DISP key, the Trace soft key and the
Max Hold soft key. Maximum hold displays the maximum response of the input signal over
multiple sweeps.
Min Hold
To toggle minimum hold on or off, press the MEAS/DISP key, the Trace soft key and the
Min Hold soft key. Min Hold displays the minimum response of the input signal over multi-
ple sweeps.
Detection Method
Each display point represents some number of measurements combined by a detection
method. The number of measurements per display point is affected by the span and the res-
olution bandwidth. The four available detection methods are Positive Peak, RMS Average,
Negative Peak, and Sampling Mode. Positive peak display the maximum value of all the
measurements associated with that display point. RMS Average detection displays the
RMS average power of all the measurements associated with that display point. Negative
peak displays the minimum value of all the measurements associated with that display
point. Sampling mode displays one measured value for the measurements associated with
the display point.
To set the detection method, press the MEAS/DISP key, the Trace soft key, and press the
Detection soft key and select either Positive Peak, RMS Average, Negative Peak or Sam-
pling Mode detection.
Minimum Sweep Time
The minimum sweep time allows a value from .05 ms to 200 seconds to be entered. The ac-
tual sweep time will be either the Min Sweep Time entered, or the time necessary to
achieve accurate results, whichever is greater.
Sweep Average
In order to reduce the effects of noise, it may be desirable to average the results of several
sweeps and display that average rather than the results of individual sweeps.
To set the number of sweeps to average, press the Average (2-25) soft key and use the
Up/Down arrow key or directly enter the desired number of sweeps from the keypad. Press
ENTER to set the sweep average.
NOTE: Max Hold, Min Hold, and Average are mutually exclusive.
Adjusting Attenuator Settings
The spectrum analyzer attenuation can be automatically coupled, manually coupled, or dy-
namically adjusted.
Step 1. Press the AMPLITUDE key.
Step 2. Press the Atten/Preamp soft key.
Step 3. Select the soft key corresponding to the desired coupling mode, as described be-
low.
3-12
Chapter 3 Getting Started

Auto Coupling
Auto coupling of the attenuation links the attenuation to the reference level. That is, the
higher the reference level, the higher the attenuation. Auto coupling is indicated on the
display as Atten XX dB.
Manual Coupling
When manually coupled, the attenuation can be adjusted independently of the reference
level. Manual attenuation coupling is indicated on the display as Atten* XX dB.
IMPORTANT!
The attenuation should be adjusted such that the maximum signal amplitude at
the input mixer is –30 dBm or less. For example, if the reference level is +20
dBm, the attenuation should be 50 dB such that the input signal at the mixer is
–30 dBm (+20 – 50 = –30). This prevents signal compression.
Dynamic Attenuation
Dynamic attenuation tracks the input signal level, automatically adjusting the attenuation
and preamp to give the maximum dynamic range without compressing the input mixer.
Dynamic attenuation is indicated on the display as Atten=Dynamic.
Setting the System Impedance
The RF In and RF Out ports both have 50� impedance. The Cell Master can compensate
for a 50� to 75� adapter on the RF In port.
Step 1. Press the SYS key.
Step 2. Press the Impedance soft key.
Step 3. If using the Anritsu 12N50-75B adapter, press the 75� Anritsu 12N50-75B soft
key.
Step 4. If using a different adapter, press the Other Adapter Offset soft key and enter the
loss value using the numeric keypad or the Up/Down arrow key. Press the
ENTER key to set the loss value.
Chapter 3 Getting Started
3-13

All Modes
Selecting a Signal Standard
The Cell Master contains a table of common signal standards. To choose a standard for
your application:
Step 1. Press the FREQ/DIST key.
Step 2. Press the Signal Standard soft key and the Select Standard soft key.
NOTE: When the unit is turned on for the very first time, the table will show all
of the signal standards available in the instrument. To create a custom list of
commonly used standards, use the soft keys or the Up/Down arrow key to high-
light a standard and press the Select/Deselect soft key. The newly selected sig-
nal standard will be marked with an asterisk (*). Press the Show Selected soft
key to show only those signal standards on the custom list. To view all the sig-
nal standards in the instrument, press the Show All soft key.
Step 3. To select a signal standard, use the soft keys or the Up/Down arrow key to high-
light the standard and press ENTER.
Step 4. Press the Select Channel soft key to choose the appropriate channel for the se-
lected standard.
Save and Recall a Setup
Saving a Setup
Saving a cable and antenna analyzer setup configuration in memory will preserve the cali-
bration information.
Step 1. To save the configuration in one of the available user setup locations, press
SAVE SETUP. There are ten locations in cable and antenna analyzer modes,
and five in Spectrum Analyzer mode.
Step 2. Use the key pad or the Up/Down arrow key to select a location.
Step 3. Use the soft keys to enter a label for the saved setup.
Step 4. Press ENTER to save the setup.
NOTE: For cable and antenna analyzer modes, an OSL calibration is saved
with an OSL designation, an InstaCal OSL calibration is saved with an OSL!, a
FlexCal OSL calibration is saved with an FLX, and an InstaCal FlexCal calibra-
tion is saved with an FLX!.
Recalling a Setup
The following procedure recalls a setup from memory.
Step 1. Press the RECALL SETUP key.
Step 2. Select the desired setup using the Up/Down arrow key.
Step 3. Press ENTER to recall the setup.
3-14
Chapter 3 Getting Started

NOTE: Only setups from the current mode are displayed.
Save and Recall a Display
Saving a Display
The following procedure saves a display to memory.
Step 1. Press the SAVE DISPLAY key to activate the alphanumeric menu for trace
storage.
Step 2. Use the soft keys to enter a label for the saved trace.
For example, to save a display with the name “TX1 RETURN LOSS” press the
soft key group that contains the letter “T” then press the “T” soft key. Press the
soft key group that contains the letter “X” then press the “X” soft key. Press the
number “1” key on the numeric keypad. Use the soft keys and keypad as neces-
sary to enter the entire name, then press ENTER to complete the process.
NOTES: More than one trace can be saved using the same alphanumeric
name, as traces are stored chronologically, using the time/date stamp.
Pressing the SAVE DISPLAY key will bring up the last saved trace name on
the input line. Pressing the Delete soft key will erase the entire trace name. To
erase only one character of a trace name, press the Up/Down arrow key to se-
lect the character, then press the Delete soft key. This feature can be useful
when naming traces sequentially, such as: Trace 1, Trace 2, etc.
Measurement traces will be saved with GPS coordinates when GPS is active.
GPS data is also automatically saved in the instrument memory until the unit is
turned off, so measurement traces can be saved with the saved GPS coordi-
nates even when the GPS is inactive.
Recalling a Display
The following procedure recalls a previously saved display from memory.
Step 1. Press the RECALL DISPLAY key.
Step 2. Select the desired display using the Up/Down arrow key.
Step 3. Press ENTER to recall the display.
Changing the Units
By default, the Cell Master displays information in metric units. Use the following proce-
dure to change the display to English units when in cable and antenna analyzer mode.
Step 1. Press the SYS key.
Step 2. Select the System Options soft key.
Step 3. Press the Units soft key to change from metric to English measurement units, or
vice versa. The current selection is displayed at the bottom left corner of the
screen.
Chapter 3 Getting Started
3-15

Changing the Language
By default, the Cell Master displays messages in English. To change the display language:
Step 1. Press the SYS key.
Step 2. Select the Language soft key.
Step 3. Select the desired language. Choices are English, French, German, Spanish,
Chinese, and Japanese. The default language is English.
Adjusting Markers
Step 1. Press the MARKER key to call up the Markers menu.
Step 2. Press the M1 soft key to select the M1 marker function.
Step 3. Press the Edit soft key and enter an appropriate value using the keypad or
Up/Down arrow key to move the marker without redrawing the trace. Pressing
the ON/OFF soft key activates or deactivates the M1 marker function.
Step 4. Press the Back soft key to return to the Markers Menu.
Step 5. Repeat the steps for markers M2, M3, M4, M5 and M6.
3-16
Chapter 3 Getting Started

Adjusting Limits
The Cell Master offers two types of limits: a single horizontal limit line and segmented lim-
its.
Adjusting a Single Limit
Step 1. Press the LIMIT key.
Step 2. Press the Single Limit soft key.
Step 3. Press the Edit soft key.
Step 4. Either enter the value using the numeric keypad or scroll the limit line using the
Up/Down arrow key.
Step 5. Press ENTER to set the location of the limit line.
NOTE: The single limit line can be defined as either an upper limit or a lower
limit in Spectrum Analyzer mode only.
Defining an Upper Limit
An upper limit in Spectrum Analyzer mode is one where the measurement fails if the data
appears above the limit line.
Press the Upper/Lower Limit soft key, if necessary, so that the status window says:
Fail if data is: Above Line.
Defining a Lower Limit
A lower limit in Spectrum Analyzer mode is one where the measurement fails if the data
appears below the limit line.
Press the Upper/Lower Limit soft key, if necessary, so that the status window says:
Fail if data is: Below Line.
Adjusting Segmented Limits
Segmented limit lines are defined separately as five upper limit segments and five lower
limit segments. This allows the definition of a spectral mask.
A limit segment is defined by its end points. That is, starting frequency, starting amplitude,
ending frequency, and ending amplitude. This procedure describes the setting of two upper
limit segments. The steps can be carried over to the other upper limit segments as well as to
the lower limit segments.
Step 1. Press the LIMIT key.
Step 2. Press the Multiple Upper Limits soft key.
Step 3. Press the Segment 1 soft key.
Step 4. Press the Edit soft key. The status window will successively display the value of
the segment endpoints: Start Freq, Start Limit, End Freq, End Limit.
Step 5. Edit each value using the numeric keypad or scroll the limit line using the
Up/Down arrow key and press ENTER to set.
Chapter 3 Getting Started
3-17

Step 6. Press the Next Segment soft key to move on to Segment 2. If the status of Seg-
ment 2 is OFF, pressing the Next Segment soft key will automatically set the
start point of segment 2 equal to the end point of Segment 1.
Step 7. Repeat these steps for the remaining segments.
Step 8. When the final segment is defined, press the Back soft key to end the editing
process.
NOTES: The Cell Master does not allow overlapping limit segments of the
same type. That is, two upper limit segments cannot overlap and two lower limit
segments cannot overlap.
The Cell Master also does not allow vertical limit segments. A limit segment in
which the start and end frequencies are the same, but the limit values are dif-
ferent, cannot be specified.
Enabling the Limit Beep
Both limit types can indicate a limit violation by enabling the Limit Beep. An audible
"beep" will sound at each data point that violates the defined limit.
Step 1. Press the LIMIT key (numeric keypad number 7).
Step 2. Press the Limit Beep soft key. The status window will indicate that the status of
the limit beep is On, and the soft key will remain in the "down" state. Press the
Limit Beep soft key again to disable the limit beep.
Adjusting the LCD Brightness
The LCD brightness can be adjusted for optimum visibility in varying environments.
Step 1. Press the light bulb key (numeric keypad number 1).
Step 2. Adjust the brightness using the Up/Down arrow key.
Step 3. Press ENTER to save the new setting.
3-18
Chapter 3 Getting Started

Printing
Printing is accomplished by selecting an available printer and pressing the print key as de-
scribed below. Refer to the particular printer operating manual for specific printer settings.
Printing a Screen
Step 1. Obtain the desired measurement display.
Step 2. Press the SYS key and the System Options soft key.
Step 3. Press the Printer soft key and select from the displayed menu of supported print-
ers.
Step 4. Press the PRINT key.
Step 5. Connect the printer as shown in Figure 3-4.
Printer Switch Settings
Set the switches on the serial-to-parallel interface cable to the HP Deskjet 450 ink jet
printer as follows:
Chapter 3 Getting Started
3-19
HPDESKJETPRINTER
SERIAL-TO-PARALLEL
SITE MASTER
INTERFACE CABLE2000-753
HOLDRUN
STARTCAL
AUTOSCALE
SAVESETUP
RECALLSETUP
LIMIT MARKER
SAVEDISPLAY
RECALLDISPLAY
MODE FREQ/DIST AMPLITUDE MEAS/DISP
SYS
ENTER
CLEAR
ESCAPE
ON
OFF
/
1 2
4
5 6
7 8
9 0
3
+-
.
S332D
Figure 3-4. Cell Master Printer Setup
SW1 SW2 SW3 SW4 SW5 SW6 SW7 SW8
OFF ON OFF OFF OFF OFF ON OFF

Using the Soft Carrying Case
The soft carrying case has been designed such that the strap can be unsnapped to allow the
case to be easily oriented horizontally; thus allowing the Anritsu controls to be more easily
accessed (Figure 3-5).
3-20
Chapter 3 Getting Started
Figure 3-5. Using the Cell Master Soft Carrying Case

Chapter 4
Cable & Antenna Analyzer
Measurement Mode
Introduction
This chapter provides a description of cable and antenna analyzer measurements, including
line sweeping fundamentals and line sweeping measurement procedures, available when the
Cell Master is in frequency or DTF mode.
Line Sweep Fundamentals
In wireless communication, the transmit and receive antennas are connected to the radio
through a transmission line. This transmission line is usually a coaxial cable or waveguide.
This connection system is referred to as a transmission feed line system. Figure 4-1 shows
an example of a typical transmission feed line system.
4-1
Figure 4-1. A Typical Transmission Feed Line System

The performance of a transmission feed line system may be affected by excessive signal re-
flection and cable loss. Signal reflection occurs when the RF signal reflects back due to an
impedance mismatch or change in impedance caused by excessive kinking or bending of
the transmission line. Cable loss is caused by attenuation of the signal as it passes through
the transmission line and connectors.
To verify the performance of the transmission feed line system and analyze these problems,
three types of line sweeps are required:
Return Loss Measurement�Measures the reflected power of the system in decibels (dB).
This measurement can also be taken in the Standing Wave Ratio (SWR) mode, which is the
ratio of the transmitted power to the reflected power.
Cable Loss Measurement�Measures the energy absorbed, or lost, by the transmission
line in dB/meter or dB/ft. Different transmission lines have different losses, and the loss is
frequency and distance specific. The higher the frequency or longer the distance, the greater
the loss.
Distance-To-Fault (DTF) Measurement�Reveals the precise fault location of compo-
nents in the transmission line system. This test helps to identify specific problems in the
system, such as connector transitions, jumpers, kinks in the cable or moisture intrusion.
The different measurements are defined as:
Return Loss - System Sweep�A measurement made when the antenna is connected at the
end of the transmission line. This measurement provides an analysis of how the various
components of the system are interacting and provides an aggregate return loss of the entire
system.
Distance To Fault - Load Sweep�A measurement is made with the antenna disconnected
and replaced with a 50� precision load at the end of the transmission line. This measure-
ment allows analysis of the various components of the transmission feed line system in the
DTF mode.
Cable Loss Sweep�A measurement made when a short is connected at the end of the
transmission line. This condition allows analysis of the signal loss through the transmission
line and identifies the problems in the system. High insertion loss in the feed line or jump-
ers can contribute to poor system performance and loss of coverage.
This whole process of measurements and testing the transmission line system is called Line
Sweeping.
CW Mode
CW mode can be used to maximize sweep speeds of both frequency and DTF measure-
ments. With CW on, sweep times can be twice as fast as with CW off. However, making
measurements with CW on will reduce the instrument’s immunity to interfering signals. In
a controlled environment, this reduced immunity should not be a problem. In the field
however, there can be stray signals from nearby or co-located transmitters that can affect
frequency and DTF measurements. Turning CW on and off can verify that the Cell Master
is reducing the interfering signals. If there is no appreciable difference, then it should be
safe to make measurements with CW on.
4-2
Chapter 4 Cable & Antenna Measurements

Use this feature with caution, as the later introduction of an interfering signal might be mis-
taken for a problem with the antenna or cable run.
If CW is on during a normal RL or SWR measurement, the Cell Master will be more sus-
ceptible to interfering signals. Interfering signals can make the measurement look better or
worse than it really is.
Information Required for a Line Sweep
The following information must be determined before attempting a line sweep measure-
ment:
� System Frequency Range, to set the sweep frequency
� Cable Type, to set the cable characteristics for DTF measurements
� Distance of the Cable Run, to set the distance for DTF measurements
Typical Line Sweep Test Procedures
This section provides typical line sweep measurements used to analyze the performance of
a transmission feed line system.
System Return Loss Measurement
System return loss measurement verifies the performance of the transmission feed line sys-
tem with the antenna connected at the end of the transmission line. To measure the system
return loss:
Required Equipment
� Cell Master Model MT8212B
� Precision Open/Short, Anritsu 22N50 or
Precision Open/Short/Load, Anritsu OSLN50LF or
InstaCal Module ICN50
� Precision Load, Anritsu SM/PL
� Test Port Extension Cable, Anritsu 15NNF50-1.5C
� Optional 510-90 Adapter, DC to 7.5 GHz, 50 ohm, 7/16(F)-N(M)
Device Under Test
� Transmission Feed Line with Antenna
Procedure
Step 1. Press the MODE key.
Step 2. Select Freq-Return Loss using the Up/Down arrow key and press ENTER.
Step 3. Set the start and stop frequencies, automatically by selecting a signal standard or
manually using the F1 and F2 soft keys, as described on page 3-2.
Step 4. Calibrate the Cell Master as described on page 3-2.
Step 5. Connect the Device Under Test to the Cell Master. A trace will be displayed on
the screen when the Cell Master is in the sweep mode.
Step 6. Press SAVE DISPLAY (page 3-15) name the trace, and press ENTER.
Chapter 4 Cable & Antenna Measurements
4-3

NOTE: The antenna must be connected at the end of the transmission feed line
when conducting a System Return Loss measurement.
Figure 4-2 is an example of a typical system return loss measurement trace using a FlexCal
calibration:
NOTE: The system sweep trace should appear at an approximate return loss of
15 dB (�3 dB) in the status window. Typically, greater than a 15 dB return loss
is measured in the passband of the antenna system.
Cable Loss Measurement
The transmission feed line insertion loss test verifies the signal attenuation level of the ca-
ble system in reference to the specification. This test can be conducted with the Cell Master
in Freq–Cable Loss mode.
Required Equipment
� Cell Master Model MT8212B
� Precision Open/Short, Anritsu 22N50 or
Precision Open/Short/Load, Anritsu OSLN50LF or
Anritsu InstaCal Module, ICN50
� Precision Load, Anritsu SM/PL
� Test Port Extension Cable, Anritsu 15NNF50-1.5C
� Optional 510-90 Adapter, DC to 7.5 GHz, 50 ohm, 7/16(F)-N(M)
Device Under Test
� Transmission Feed Line with Short
4-4
Chapter 4 Cable & Antenna Measurements
Figure 4-2. Typical System Return Loss Trace

Procedure - Cable Loss Mode
Step 1. Press the MODE key.
Step 2. Select Freq-Cable Loss using the Up/Down arrow key and press ENTER.
Step 3. Set the start and stop frequencies, automatically by selecting a signal standard or
manually using the F1 and F2 soft keys, as described on page 3-2.
Step 4. Connect the Test Port Extension cable to the RF port and calibrate the Cell Mas-
ter as described on page 3-2.
Step 5. Save the calibration set up (page 3-14).
Step 6. Connect the Device Under Test to the Cell Master phase stable Test Port Exten-
sion cable. A trace will be displayed on the screen as long as the Cell Master is
in sweep mode.
Step 7. Cable loss is displayed in the status window.
Step 8. Press SAVE DISPLAY (page 3-15) name the trace, and press ENTER.
Figure 4-3 is an example of a typical transmission line cable loss measurement trace using a
standard calibration.
Chapter 4 Cable & Antenna Measurements
4-5
Figure 4-3. Typical Transmission Line Cable Loss Trace
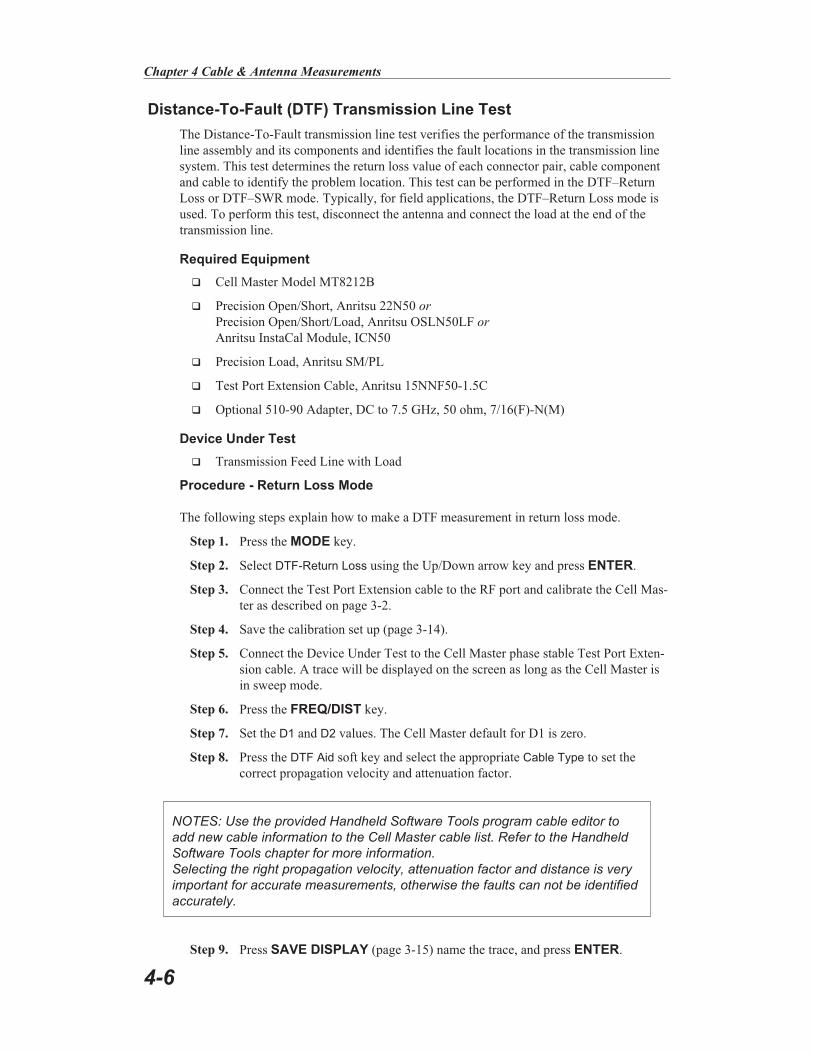
Distance-To-Fault (DTF) Transmission Line Test
The Distance-To-Fault transmission line test verifies the performance of the transmission
line assembly and its components and identifies the fault locations in the transmission line
system. This test determines the return loss value of each connector pair, cable component
and cable to identify the problem location. This test can be performed in the DTF–Return
Loss or DTF–SWR mode. Typically, for field applications, the DTF–Return Loss mode is
used. To perform this test, disconnect the antenna and connect the load at the end of the
transmission line.
Required Equipment
� Cell Master Model MT8212B
� Precision Open/Short, Anritsu 22N50 or
Precision Open/Short/Load, Anritsu OSLN50LF or
Anritsu InstaCal Module, ICN50
� Precision Load, Anritsu SM/PL
� Test Port Extension Cable, Anritsu 15NNF50-1.5C
� Optional 510-90 Adapter, DC to 7.5 GHz, 50 ohm, 7/16(F)-N(M)
Device Under Test
� Transmission Feed Line with Load
Procedure - Return Loss Mode
The following steps explain how to make a DTF measurement in return loss mode.
Step 1. Press the MODE key.
Step 2. Select DTF-Return Loss using the Up/Down arrow key and press ENTER.
Step 3. Connect the Test Port Extension cable to the RF port and calibrate the Cell Mas-
ter as described on page 3-2.
Step 4. Save the calibration set up (page 3-14).
Step 5. Connect the Device Under Test to the Cell Master phase stable Test Port Exten-
sion cable. A trace will be displayed on the screen as long as the Cell Master is
in sweep mode.
Step 6. Press the FREQ/DIST key.
Step 7. Set the D1 and D2 values. The Cell Master default for D1 is zero.
Step 8. Press the DTF Aid soft key and select the appropriate Cable Type to set the
correct propagation velocity and attenuation factor.
NOTES: Use the provided Handheld Software Tools program cable editor to
add new cable information to the Cell Master cable list. Refer to the Handheld
Software Tools chapter for more information.
Selecting the right propagation velocity, attenuation factor and distance is very
important for accurate measurements, otherwise the faults can not be identified
accurately.
Step 9. Press SAVE DISPLAY (page 3-15) name the trace, and press ENTER.
4-6
Chapter 4 Cable & Antenna Measurements
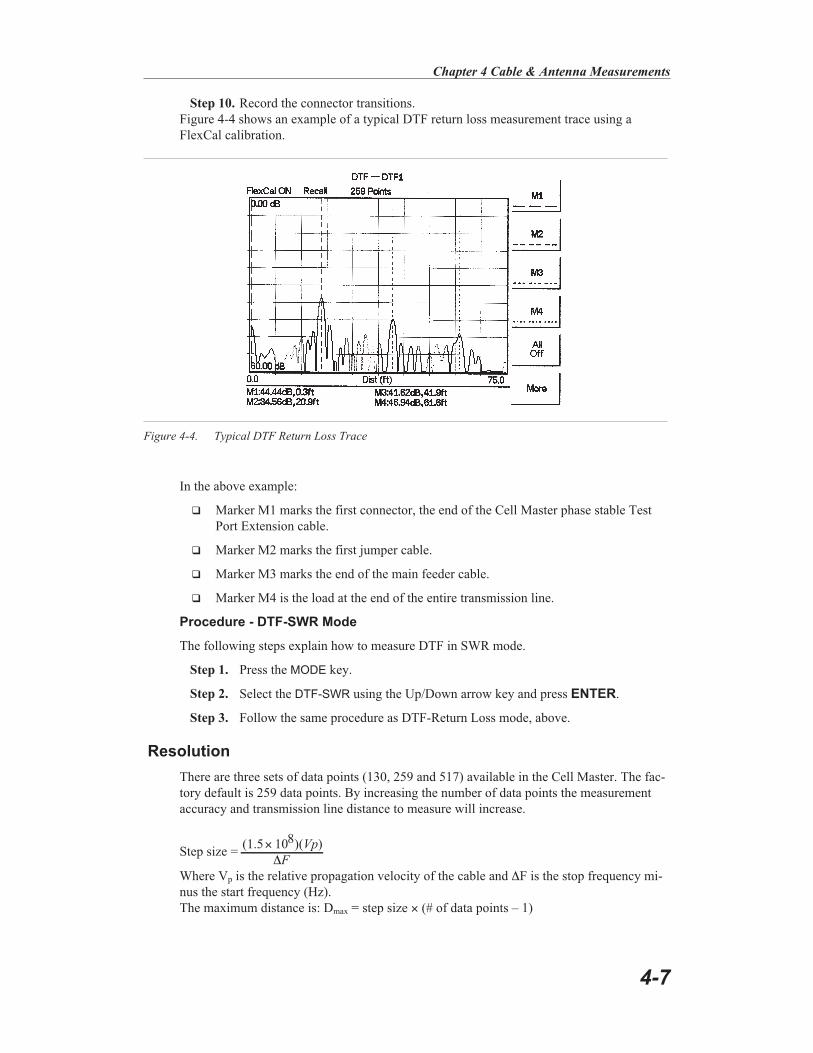
Step 10. Record the connector transitions.
Figure 4-4 shows an example of a typical DTF return loss measurement trace using a
FlexCal calibration.
In the above example:
� Marker M1 marks the first connector, the end of the Cell Master phase stable Test
Port Extension cable.
� Marker M2 marks the first jumper cable.
� Marker M3 marks the end of the main feeder cable.
� Marker M4 is the load at the end of the entire transmission line.
Procedure - DTF-SWR Mode
The following steps explain how to measure DTF in SWR mode.
Step 1. Press the MODE key.
Step 2. Select the DTF-SWR using the Up/Down arrow key and press ENTER.
Step 3. Follow the same procedure as DTF-Return Loss mode, above.
Resolution
There are three sets of data points (130, 259 and 517) available in the Cell Master. The fac-
tory default is 259 data points. By increasing the number of data points the measurement
accuracy and transmission line distance to measure will increase.
Step size =( . )( )1 5 108� Vp
F�Where Vp is the relative propagation velocity of the cable and �F is the stop frequency mi-
nus the start frequency (Hz).
The maximum distance is: Dmax = step size � (# of data points – 1)
Chapter 4 Cable & Antenna Measurements
4-7
Figure 4-4. Typical DTF Return Loss Trace

Increasing the data points increases the sweep time and increases the accuracy of the mea-
surement. CW mode On or Off can also affect sweep speed (see CW Mode, page 4-2 for
details).
Antenna Subsystem Return Loss Test
Antenna Subsystem return loss measurement verifies the performance of the transmit and
receive antennas. This measurement can be used to analyze the performance of the antenna
before installation. The antenna can be tested for the entire frequency band, or tested to a
specific frequency range. Transmit and receive frequency measurements are conducted sep-
arately. The following steps explain how to measure the antenna loss in return loss mode.
Required Equipment
� Cell Master Model MT8212B
� Precision Open/Short, Anritsu 22N50 or
Precision Open/Short/Load, Anritsu OSLN50LF or
Anritsu InstaCal Module, ICN50
� Precision Load, Anritsu SM/PL
� Test Port Extension Cable, Anritsu 15NNF50-1.5C
� Optional 510-90 Adapter, DC to 7.5 GHz, 50 ohm, 7/16(F)-N(M)
Device Under Test
� Antenna Sub Assembly
Procedure
Step 1. Press the MODE key.
Step 2. Select Freq-Return Loss using the Up/Down arrow key and press ENTER.
Step 3. Connect the Test Port Extension cable to the RF port and calibrate the Cell Mas-
ter as described on page 3-2.
Step 4. Press SAVE SETUP and save the calibration set up (page 3-14).
Step 5. Connect the Device Under Test to the Cell Master phase stable Test Port Exten-
sion cable.
Step 6. Press the MARKER key.
Step 7. Set markers M1 and M2 to the desired frequencies.
Step 8. Record the lowest return loss over the specified frequency range.
Step 9. Press SAVE DISPLAY (page 3-15) name the trace, and press ENTER.
4-8
Chapter 4 Cable & Antenna Measurements

The following trace is an example of an antenna return loss measurement trace using a
FlexCal calibration..
Calculate the threshold value and compare the recorded Lowest Return Loss to the calcu-
lated threshold value.
Maximum Return Loss =� �
� �� �
�
20 1
1
log VSWR
VSWR
NOTES:
VSWR is the antenna manufacturer’s specified VSWR.
Use Handheld Software Tools to convert VSWR to Return Loss, or Return Loss
to VSWR.
If the measured return loss is less than the calculated threshold value, the test fails and the
antenna must be replaced.
Chapter 4 Cable & Antenna Measurements
4-9
Figure 4-5. Antenna Return Loss Trace

Chapter 5
Spectrum Analyzer
Measurement Mode
Introduction
This chapter provides a description of Spectrum Analyzer measurements and procedures
when the Cell Master MT8212B is in Spectrum Analyzer Mode.
Measurement Fundamentals
Measurement fundamentals include the use of additional spectrum analyzer functions be-
yond frequency, span, amplitude and marker functions. In particular, this section focuses
on resolution bandwidth, video bandwidth, sweep, and attenuator functions.
Effect of Resolution Bandwidth
Resolution Bandwidth is determined by the intermediate frequency (IF) filter bandwidth.
The spectrum analyzer traces the shape of its IF filter as it tunes past a signal. If more than
one IF filter is used in a spectrum analyzer, the narrowest one dominates and is considered
the resolution bandwidth.
The choice of resolution bandwidth depends on several factors. Filters take time to settle.
That is, when a signal first appears at the input of the filter, it will take a while before the
signal appears at the output. Additionally, the output of the filter will take some time to set-
tle to the correct value, so that it can be measured. The narrower the filter bandwidth (reso-
lution bandwidth) the longer the settling time.
The choice of resolution bandwidth will depend on the signal being measured. If two
closely-spaced signals are to be measured individually, then a narrow bandwidth is re-
quired. If a wider bandwidth is used, then the energy of both signals will be included in the
measurement. Thus, the wider bandwidth does not have the ability to look at frequencies se-
lectively but instead simultaneously measures all signals falling within the resolution band-
width.
Therefore, a broadband measurement would aggregate all signals and noise within the mea-
surement bandwidth into a single measurement. On the other hand a narrow-band measure-
ment will separate the frequency components, resulting in a measurement that includes
separate peaks for each signal. There are advantages to each. The ultimate decision will be
dependent on the type of measurement required by the user.
There is always some amount of noise present in a measurement. Noise is often broadband
in nature; that is, it exists at a broad range of frequencies. If the noise is included in the
measurement, the measured value will be in error (too large) depending on the noise level.
5-1

With a wide bandwidth, more noise is included in the measurement. With a narrow band-
width, less noise enters the resolution bandwidth filter, and the measurement is more accu-
rate. If the resolution bandwidth is narrower, the noise floor will drop on the display of the
spectrum analyzer. This is because the IF filter of the analyzer has been made narrower in
bandwidth, which lets in less noise. As the measured noise level drops, smaller signals that
were previously obscured by the noise can now be measured.
Effect of Video Bandwidth
Spectrum analyzers typically use another type of filtering after the detector called video fil-
tering. This filter also affects the noise on the display but in a different manner than the res-
olution bandwidth. In video filtering, the average level of the noise remains the same but
the variation in the noise is reduced. Hence, the effect of video filtering is a “smoothing” of
the signal noise. The resultant effect on the analyzer’s display is that the noise floor com-
presses into a thinner trace, while the position of the trace remains the same. Thus, chang-
ing the video bandwidth (VBW) does not improve sensitivity; however, it does improve
discernability and repeatability when making low-level measurements.
As a general rule of thumb, most field spectrum analyzer measurements are made at a video
bandwidth that is a factor of 10 to 100 less than the resolution bandwidth. Thus, for a reso-
lution bandwidth of 30 kHz, the typical video bandwidth setting options are either 3 kHz or
300 Hz.
Sweep Limitations
With some spectrum analyzers, the user has control over sweep time (the elapsed time of
each sweep, sometimes called scan time). An analyzer cannot be swept arbitrarily fast while
maintaining its specified accuracy, but will have a sweep rate limitation depending on the
resolution bandwidth, video bandwidth, and frequency range selected. The sweep rate is not
usually chosen by the user but is determined by the frequency range swept divided by the
sweep time. The limitation on sweep rate comes from the settling or response time of the
resolution and video bandwidth filters. If an analyzer is swept too quickly, the filters do not
have time to respond, and the measurement is inaccurate. Under such conditions, the ana-
lyzer display tends to have a “smeared” look to it, with the spectral lines being wider than
normal and shifted to the right.
Fortunately, the Anritsu Handheld Spectrum Analyzer has mechanisms designed into it that
relieve the user from having to calculate the sweep rate. When changing the RBW and
VBW, the sweep rate will change accordingly. The sweep rate will be faster for a wide
RBW or VBW and slower for a narrow RBW or VBW. The sweep rate can also be changed
manually, by pressing the MEAS/DISP key and selecting the Min Sweep Time soft key.
Enter a sweep time from 0.05 ms to 2000 seconds. If the minimum sweep time entered by
the user is less than the value calculated by the Cell Master to assure accurate results, the
calculated value will prevail. Regardless of the minimum sweep time setting, the Cell Mas-
ter will never sweep faster than the RBW and VBW settings will allow.
Attenuator Functions
Attenuation adjusts the hand held spectrum analyzer input attenuator. In Auto mode, as the
reference level is increased, the attenuation is increased. In Manual mode, the input attenua-
tion can be adjusted using the keypad or the Up/Down arrow key. The attenuator range is 0
to 51 dB, in 1 dB steps. When Dynamic attenuation is selected, the instrument automatically
sets the input attenuation and preamplifier to achieve the best possible dynamic range.
5-2
Chapter 5 Spectrum Analyzer Measurements

IMPORTANT! Attenuation is normally a coupled function and is automatically
adjusted when the reference level changes. The reference level does not
change however, when the attenuator changes. The attenuator should be ad-
justed so that the maximum signal amplitude at the input mixer is –25 dBm or
less. For example, if the reference level is + 20 dBm, the attenuation should be
50 dB for an input signal of –25 dBm at the mixer (+20 – 45 = –25). This pre-
vents signal compression. The nominal gain of the preamplifier is +25 dB,
therefore always select attenuation values so that the input to the preamp does
not exceed –50 dBm.
NOTE: It is best to begin all measurements in AUTO attenuation mode.
Preamplifier
The MT8212B includes a built-in preamplifier which provides the MT8212B with an addi-
tional 20 dB of sensitivity. The preamplifier is a broadband preamplifier and thus the use of
discrete filters should be considered when using it. Four different bandpass filters have been
added to the list of optional accessories to accommodate this need (see Table 1-1, Optional
Accessories). This chapter provides an overview of preamplifier operation. A measurement
example is included.
Preamplifier Operation
To turn the preamplifier on or off:
Step 1. Reset the MT8212B to the factory default settings for the current mode by press-
ing the RECALL SETUP key on the data keypad. When the key is pressed, a
Recall Setup selection box appears on the display. Select setup location 0 <De-
fault> to recall the factory preset state for the currently selected mode.
Step 2. Press the AMPLITUDE function hard key.
Step 3. Select the Atten/Preamp soft key, then the Preamp Control Manual soft key.
Press the Preamp On/Off soft key to turn the preamplifier on or off. When the
preamplifier is on, the word AMP will be displayed on the left side of the dis-
play.
NOTES: The preamplifier is a broadband amplifier. It can become saturated by
a signal outside of the defined frequency span.
The dynamic attenuation feature will automatically activate the preamplifier
when the MT8212B detects that the input signal level is below a certain level.
This condition could result in the preamplifier being automatically turned back
on even after it has been manually turned off.
When dynamic attenuation is on, Atten=Dynamic appears to the left of the dis-
play.
5-3
Chapter 5 Spectrum Analyzer Measurements

Preamplifier Measurement Example
This section provides an overview of how to detect a low-level signal with the help of the
preamplifier of a MT8212B Cell Master.
Required Equipment
� MT8212B Cell Master
� Test Port extension cable, Anritsu 15NNF50 – 1.5C
� A signal source (Anritsu 69xxxB Synthesized Signal Generator or equivalent)
Procedure
Step 1. Press the MODE key and use the Up/Down arrow key to select the Spectrum
Analyzer mode. Press the ENTER key to select.
Step 2. Connect the RF output of the signal source to the RF In port of the MT8212B.
Step 3. Press the Center soft key. Enter the center frequency of the measurement using
the Up/Down arrow key or the keypad. Select the GHz, MHz, kHz, or Hz soft key
to accept the center frequency input.
Step 4. Press the Span soft key and use the Up/Down arrow key or the keypad to enter a
span of 1 MHz.
Step 5. Set the signal source output level to –120 dBm.
Step 6. Press the AMPLITUDE key and select the Ref Level soft key to set the reference
level to –80 dBm.
Step 7. Press the Scale soft key and set the scale to 10 dB/division.
Step 8. Press the Atten/Preamp soft key and set the attenuation to Auto and press the
Back soft key.
Step 9. Press the MEAS/DISP key, the Trace soft key, and the Detection soft key and
set the detection mode to Positive Peak.
Step 10. Press the Back soft key twice, then the Bandwidth soft key. Select the RBW Man-
ual soft key and set the RBW to 100 Hz.
Step 11. Select the VBW Auto soft key.
Step 12. Press the AMPLITUDE function hard key.
Step 13. Select the Atten/Preamp soft key, then the Preamp Control Manual soft key.
Press the Preamp On/Off soft key to turn the preamplifier on or off.
5-4
Chapter 5 Spectrum Analyzer Measurements

Figure 5-1 shows the measurement results with the preamplifier off.
Step 14. Turn the preamplifier on. When the preamplifier is ON, the word AMP should
appear in the lower left corner of the display.
The displayed noise level should be lowered by approximately 20 dB on the dis-
play, and the signal should appear on top of the displayed noise. The noise level
will drop further if the RBW is reduced.
Figure 5-2 shows the measurement results with the preamplifier on.
5-5
Chapter 5 Spectrum Analyzer Measurements
Figure 5-1. Preamplifier Off
Figure 5-2. Preamplifier On

Dynamic Attenuation Control
The dynamic attenuation control feature tracks the peak input signal level and automatically
adjusts the attenuator to protect the MT8212B in situations of high RF signal levels. This
feature also enhances the instrument sensitivity in situations of low-level RF signals by de-
activating and activating the internal preamplifier resulting in improved measurement accu-
racy.
When dynamic attenuation is on, the MT8212B is in control of the attenuation and preamp.
Manual settings will be overwritten based on the input signal. To manually control these
parameters, set the attenuation to Manual.
The following is an example identifying interference in a PCS 900 MHz band with the aid
of the preamplifier and dynamic attenuation control.
Required Equipment
� MT8212B Handheld Cell Master
� A PCS band Pass Filter, such as K & L Electronics 5DR30-921 or equivalent
� A PCS band antenna
Procedure
Step 1. If necessary, press the MODE key and use the Up/Down arrow key to select the
Spectrum Analyzer mode. Press the ENTER key to select.
Step 2. Reset the MT8212B to the factory default settings for the current mode by press-
ing the RECALL SETUP key on the data keypad. When the key is pressed, a
Recall Setup selection box appears on the display. Select setup location 0 <De-
fault> to recall the factory preset state for the currently selected mode.
Step 3. Connect the PCS antenna to the input of the band pass filter, and the output of
the band pass filter to the RF In connector of the MT8212B.
Step 4. Press the FREQ/DIST key.
Step 5. Press the Start soft key and enter 1.93 GHz.
Step 6. Press the Stop soft key and enter 1.935 GHz.
Step 7. Press the AMPLITUDE key and select the Scale key. Set the scale to 10 dB/di-
vision.
Step 8. Press the Atten/Preamp soft key and set the attenuation to Dynamic.
As the MT8212B sweeps, it continually monitors the overall input signal level and, as re-
quired, adjusts the input attenuation value and the preamplifier on/off state to achieve the
best possible sensitivity.
5-6
Chapter 5 Spectrum Analyzer Measurements

Selecting the Signal Standard and Channel
Before making measurements, the Cell Master must be set to the appropriate wireless net-
work air interface standard and channel number. The most common standards and channel
numbers are stored in the Cell Master and, when selected, the Cell Master automatically se-
lects the correct frequency and span. The frequency and span can also be manually entered
if necessary.
The following procedure sets the signal standard and channel number automatically by se-
lecting from the standards stored in the Cell Master.
NOTE: Refer to the chapter on Handheld Software Tools for information on cre-
ating and storing custom signal standards.
Procedure
Step 1. On the Cell Master, press the MODE key.
Step 2. Use the Up/Down arrow key to select the Spectrum Analyzer mode and press
ENTER.
Step 3. Select the Signal Standard soft key and press the Select Standard soft key. A ta-
ble of currently selected signal standards will be displayed.
NOTE: When the unit is turned on for the very first time, the table will show all
of the signal standards available in the instrument. To create a custom list of
commonly used standards, use the soft keys or the Up/Down arrow key to high-
light a standard and press the Select/Deselect soft key. The newly selected sig-
nal standard will be marked with an asterisk (*). Press the Show Selected soft
key to show only those signal standards on the custom list. To view all the sig-
nal standards in the instrument, press the Show All soft key.
Step 4. To select a signal standard, use the soft keys or the Up/Down arrow key to high-
light the standard and press ENTER.
Step 5. Select the Select Channel soft key and use the Up/Down arrow key or the nu-
meric keypad to enter a valid channel number.
Step 6. Press ENTER to accept the value, or ESCAPE to restore the previous value.
The currently selected Center Frequency, Span, Signal Standard, and Channel are displayed
at the bottom of the status window.
5-7
Chapter 5 Spectrum Analyzer Measurements

Field Strength Measurements
All antennas have loss or gain that can cause errors in measurements. The Cell Master can
correct for antenna loss or gain errors using Field Strength Measurements. The antenna fac-
tors must be uploaded to the Cell Master using the Anritsu Handheld Software Tools pro-
vided with the unit.
Step 1. For a custom antenna, enter the antenna factor information for the specific an-
tenna into the Antenna Editor of the Software Tools (see page 19-7).
Step 2. On the Cell Master, press the MODE key.
Step 3. Use the Up/Down arrow key to select the Spectrum Analyzer mode and press
ENTER.
Step 4. Select the measurement frequency by using Center and Span soft keys or Start
and Stop keys or Signal Standard and Select Channel keys
Step 5. Upload the antenna factors to the Cell Master.
Step 6. Press the MEAS/DISP key and select the Measure soft key.
Step 7. Select the Field Strength soft key from the measurement menu.
Step 8. Press the Select Standard Antenna or Select Custom Antenna soft key and use
the Up/Down arrow key to select the desired antenna factor file from the stan-
dard or custom antenna list. Press the ENTER key to select.
The Cell Master will now automatically adjust the measurement results based on the an-
tenna factors entered. Field Str appears to the left of the trace and indicates that the mea-
surement is enabled. The measurement status also appears in the lower status window along
with the name of the selected antenna.
Figure 5-3 shows the results of a measurement.
5-8
Chapter 5 Spectrum Analyzer Measurements
Figure 5-3. Field Strength Measurements

Occupied Bandwidth
A common measurement performed on radio transmitters is that of occupied bandwidth
(OBW). This measurement calculates the bandwidth containing the total integrated power
occupied in a given signal bandwidth. There are two different methods of calculation de-
pending on the technique to modulate the carrier.
Percent of Power Method
The occupied frequency bandwidth is calculated as the bandwidth containing the specified
percentage of the transmitted power.
XdB Down Method
The occupied frequency bandwidth is defined as the bandwidth between the upper and
lower frequency points at which the signal level is XdB below the peak carrier level.
Required Equipment
� Cell Master MT8212B
� Portable antenna for the selected signal frequency
Procedure
Step 1. Connect the antenna to the Spectrum Analyzer connector.
Step 2. On the Cell Master, press the MODE key, use the Up/Down arrow key to select
the Spectrum Analyzer mode and press ENTER.
Step 3. Press the FREQ/DIST key, select the frequency for the measurement by using
Center and Span soft keys, the Start and Stop soft keys or the Signal Standard
and Select Channel soft keys.
Step 4. Press the AMPLITUDE key and select the Ref Level soft key to set the appropri-
ate reference level.
Step 5. Select the Atten/Preamp soft key to set the input attenuation level to automatic,
manual or dynamic.
Step 6. Press Preamp On/Off or Preamp Auto to activate the preamplifier manually or
automatically. The default preamplifier mode is auto.
Step 7. Press the Back soft key to return to the previous menu.
Step 8. Select the Scale soft key to set the scale. Choose a value from 1dB/div to 15
dB/div and press ENTER.
Step 9. Press the MEAS/DISP key and select the Bandwidth soft key to set the resolu-
tion bandwidth and video bandwidth automatically or manually. Press the Back
soft key to return to the previous menu.
Step 10. Press the Measure soft key and press the OBW soft key. Select the measurement
method (dB Down or % of Power) by pressing the Method soft key. The cur-
rently selected method is shown in the lower left of the status window.
Step 11. Press the dBc or % soft keys to adjust the settings as appropriate.
Step 12. Press the Measure soft key to initiate the measurement.
5-9
Chapter 5 Spectrum Analyzer Measurements

Figure 5-4 shows the occupied bandwidth results using the % of power method of a CDMA
signal.
Occupied bandwidth is calculated at the end of a sweep. An hourglass is displayed as the
calculations are performed.
Markers M1 and M2 indicate the occupied band on the graph. The measurement results ap-
pear beneath the graph.
5-10
Chapter 5 Spectrum Analyzer Measurements
Figure 5-4. Occupied Bandwidth

Channel Power Measurement
Channel power measurement is one of most common measurements for a radio transmitter.
This test measures the output power, or channel power, of a transmitter over the frequency
range in a specific time interval. Out-of-specification power measurements indicate system
faults, which can be in the power amplifiers and in filter circuits. Channel Power measure-
ments can be used to:
� Validate transmitter performance
� Comply with FCC or local regulations
� Keep overall system interference at a minimum
Required Equipment
� Cell Master MT8212B
� Portable antenna for the selected signal frequency
Procedure
Step 1. On the Cell Master, press the MODE key, use the Up/Down arrow key to select
the Spectrum Analyzer mode and press ENTER.
Step 2. Press the Signal Standard soft key and press the Select Standard soft key. Use
the Up/Down arrow key to select a signal standard, and press ENTER to select
the appropriate network standard.
Step 3. Press the Select Channel soft key, enter a value and press ENTER.
Step 4. Press the AMPLITUDE key and select the Ref Level soft key to set the reference
level.
Step 5. Press the Scale soft key and set the scale to 10 dB/division.
Step 6. Press the Atten/Preamp soft key and set the attenuation to an appropriate attenu-
ation setting using automatic, manual, or dynamic.
Step 7. Press Preamp On/Off or Preamp Auto to activate the preamplifier manually or
automatically. The default preamplifier mode is automatic.
Step 8. Press the Back soft key to return to the previous menu.
Step 9. Press the MEAS/DISP key, select the Bandwidth soft key and set the resolution
bandwidth and the video bandwidth to Auto.
Step 10. Press the Back soft key to return to the previous menu.
Step 11. Press the Trace soft key and the Max Hold soft key to set max hold to ON as in-
dicated to the left of the graph.
Step 12. Press the Back soft key to return to the previous menu.
Step 13. Press the Measure soft key and press the Channel Power soft key.
Step 14. Select the Int BW soft key and enter the integration bandwidth frequency appro-
priate for the particular application and press ENTER.
Step 15. Press Center Freq and Channel Span to set the signal frequency and span if the
signal standard and channel are not selected as in steps 2 and 3.
Step 16. Make the measurement by pressing the Measure soft key. The detection method
is automatically changed to RMS. The Cell Master will display the measurement
results.
5-11
Chapter 5 Spectrum Analyzer Measurements

When the channel power measurement is on, a CH PWR icon appears to the left of the
graph. Channel power is calculated at the end of a sweep. An hourglass is displayed as the
calculations are performed.
NOTE: The channel span must be set equal to or larger than the integration
bandwidth. If not, the Cell Master will set the channel span equal to the integra-
tion bandwidth. When the integration bandwidth and channel span are set to
the same value, the Cell Master uses all the sampling points for integration,
providing the most accurate measurements. The ratio of the integration band-
width to channel span is kept constant. When the integration bandwidth is
changed, the ratio remains the same. The ratio can be changed by changing
the channel span. For example, when the integration bandwidth is doubled, the
Cell Master will double the channel span. Integration Bandwidth must be at
least one tenth of the channel span.
5-12
Chapter 5 Spectrum Analyzer Measurements
Figure 5-5. Channel Power Meassurement

Adjacent Channel Power Ratio
Another common transmitter measurement is that of adjacent channel leakage power. This
is defined as the ratio of the amount of leakage power in an adjacent channel to the total
transmitted power in the main channel. This measurement can be used to replace the tradi-
tional two-tone intermodulation distortion (IMD) test for system non-linear behavior.
The result of an ACPR measurement can be expressed either as a power ratio or a power
density. In order to calculate the upper and lower adjacent channel values, the Cell Master
requires the specification of four parameters:
� Main Channel Frequency
� Measurement Channel Bandwidth
� Adjacent Channel Bandwidth
� Channel Spacing
Required Equipment
� Cell Master MT8212B
� Portable antenna for the selected signal frequency
Procedure
Step 1. On the Cell Master, press the MODE key, use the Up/Down arrow key to select
the Spectrum Analyzer mode and press ENTER.
Step 2. Press the Signal Standard soft key and the Select Standard soft key to select the
appropriate network standard, and press ENTER.
Step 3. Press the Select Channel soft key, enter a value and press ENTER.
NOTE: For ACPR measurements, when the appropriate Channel is selected,
the Main channel bandwidth, Adjacent channel bandwidth and channel spacing
are automatically set.
Step 4. Press the AMPLITUDE key and select the Ref Level soft key to set the reference
level to an appropriate value.
Step 5. Press the Atten/Preamp soft key and set the attenuation to Auto.
Step 6. Press the MEAS/DISP key and select the Bandwidth soft key to set the resolu-
tion bandwidth and the video bandwidth to Auto.
Step 7. Press the Back soft key to return to the previous menu.
Step 8. Press the Trace soft key and the Max Hold soft key to set max hold to On as indi-
cated to the left of the graph.
Step 9. Press the Measure soft key and press the ACPR soft key.
Step 10. Make the measurement by pressing the Measure soft key. The detection method
is automatically changed to RMS Average. Solid vertical lines are drawn on the
display to indicate the main channel. Dashed vertical lines define the adjacent
channels. The Cell Master will display the measurement results.
5-13
Chapter 5 Spectrum Analyzer Measurements
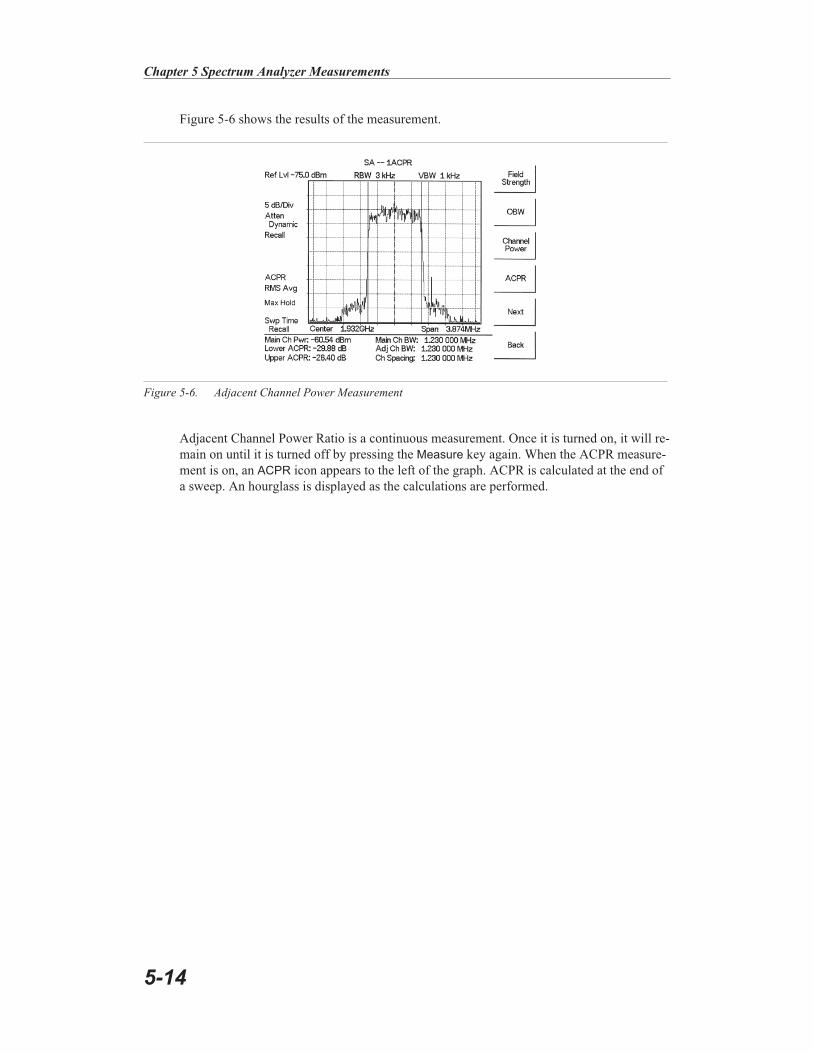
Figure 5-6 shows the results of the measurement.
Adjacent Channel Power Ratio is a continuous measurement. Once it is turned on, it will re-
main on until it is turned off by pressing the Measure key again. When the ACPR measure-
ment is on, an ACPR icon appears to the left of the graph. ACPR is calculated at the end of
a sweep. An hourglass is displayed as the calculations are performed.
5-14
Chapter 5 Spectrum Analyzer Measurements
Figure 5-6. Adjacent Channel Power Measurement

AM/FM Demodulation
The Cell Master built-in demodulator for AM, narrowband FM, wideband FM and single
sideband (selectable USB and LSB) allows a technician to hear an interfering signal for
easy identification. The demodulated signal can be heard using either the built-in speaker,
or through a monaural headset connected to the 1/8-inch jack on the test panel.
Demodulation Procedure
Step 1. Press the MEAS/DIST key followed by the Measure and More soft keys and the
AM/FM Demod soft key.
Step 2. Press the AM/FM Demod soft key and select AM, FM Wide Band, FM Narrow
Band, SSB Lower, or SSB Upper to match the modulation format of the signal.
Step 3. Press the Back soft key.
Step 4. For AM or FM signals, press the Demod Freq soft key and use the keypad to en-
ter the center frequency of the signal to be demodulated. By default, the demod-
ulation frequency is the center of the frequency span.
For SSB Upper and SSB Lower signals, press the Demod Freq soft key. By
default the demodulation frequency is the center of the frequency span. If the de-
modulation frequency needs to be changed, press the Demod Freq soft key and
enter the correct demodulation frequency. The BFO Adjust soft key allows ad-
justment of the beat frequency oscillator to fine tune the signal through a span of
�10000 Hz.
5-15
Chapter 5 Spectrum Analyzer Measurements
Figure 5-7. Select Demodulation Type
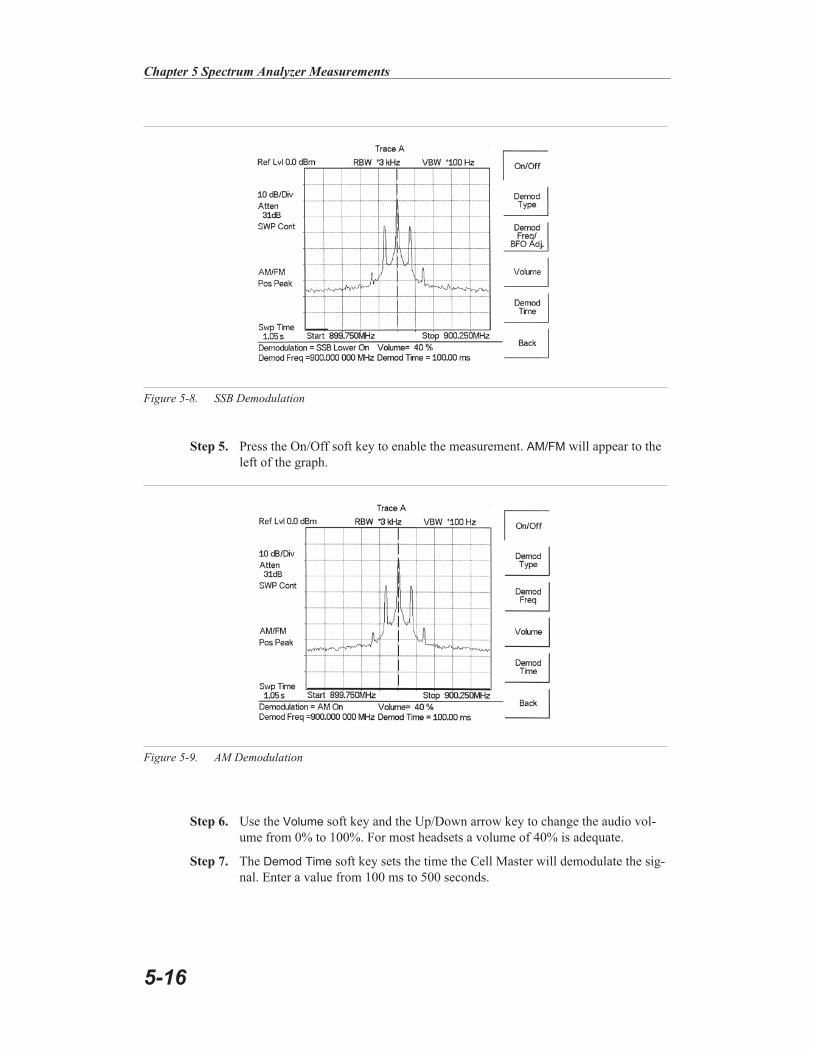
Step 5. Press the On/Off soft key to enable the measurement. AM/FM will appear to the
left of the graph.
Step 6. Use the Volume soft key and the Up/Down arrow key to change the audio vol-
ume from 0% to 100%. For most headsets a volume of 40% is adequate.
Step 7. The Demod Time soft key sets the time the Cell Master will demodulate the sig-
nal. Enter a value from 100 ms to 500 seconds.
5-16
Chapter 5 Spectrum Analyzer Measurements
Figure 5-8. SSB Demodulation
Figure 5-9. AM Demodulation

Carrier to Interference Ratio (C/I)
Carrier to Interference Ratio (C/I) Measurement is a two-step process, first measuring the
carrier level and then, with the carrier turned off, measuring the remaining signals and noise
in the band of interest. After the two measurements are complete, the ratio of the carrier
level to the noise plus interference is displayed using three assumptions:
� The interferer is a narrowband frequency hopping signal source (NB FHSS)
� The interferer is a wideband frequency hopping signal source (WB FHSS)
� The interferer is a broadband signal (BB)
The primary application for this type of measurement is determining the magnitude of inter-
ference problems for 802.11b, 802.11g and 802.11a access points (hot spots).
Procedure
Step 1. If necessary, press the MODE key and use the Up/Down arrow key to select the
Spectrum Analyzer mode. Press the ENTER key to select.
Step 2. Press the Signal Standard soft key. Select the appropriate signal standard based
on the signal to be measured and press ENTER.
Step 3. Press the Select Channel soft key, select the operating channel of the access
point being measured and press ENTER.
5-17
Chapter 5 Spectrum Analyzer Measurements
Figure 5-10. Signal Standard and Channel Selected

Step 4. Press the MEAS/DISP key followed by the Measure soft key, the More soft key
and the C/I soft key.
Step 5. Press the Signal Type soft key and select the correct carrier signal type from the
three choices, Narrow Band FHSS, Wide Band FHSS, or Broadband.
Step 6. Press the Back soft key to return to the previous menu.
Step 7. Unless a Signal Standard and Channel have already been selected, press the
Center soft key and enter the desired frequency.
Step 8. If needed, press the Span soft key and set an appropriate span width for the sig-
nal to be measured.
Step 9. If the signal environment includes slow frequency hopping signals, such as cord-
less telephones, press the Min Sweep Time soft key to set a sweep time of one
second or more to give a good chance of capturing instances of the interfering
signal.
5-18
Chapter 5 Spectrum Analyzer Measurements
Figure 5-11. Carrier to Interference Ratio Measurement Screen
Figure 5-12. Select Signal Type

Step 10. Press the Measure soft key and follow the on-screen prompts to complete the
measurement.
NOTE: Access to the transmitter is required to complete this procedure as the
transmitted carrier must be turned off for the second portion of the measure-
ment.
Step 11. After the measurement is complete, a message box will give results for the three
different signal types. Some measurement results may show as N/A, and this is
to be expected. Press the ENTER key to continue. All of the information in the
message box will still be available.
Step 12. Press the appropriate soft key for the signal type being measured to view the
measurement results. The results are shown at the bottom of the screen.
Step 13. Press the Save C/I Meas soft key to save both traces. Select the alphanumeric
characters for the trace name and press the ENTER key to save the traces. The
Cell Master will save both the carrier and interferer traces with the same name,
and automatically append a “-C” to the saved carrier trace, and a “-I” to the
saved interference trace.
Step 14. Press the C/I Done soft key to return to normal sweeping mode.
Step 15. To recall the carrier and interferer traces, select the RECALL DISPLAY key
and use the Up/Down arrow key to select either the -C or -I trace. Both traces
will be displayed, with the selected trace data shown at the bottom of the dis-
play. The selected trace is displayed as a yellow trace, and the other as a ma-
genta trace.
Step 16. To review the specific data for the measurement, select the MEAS/DISP key
followed by the Measure soft key, the More soft key and the C/I soft key. Select
either the C Data, I Data, or C/I Data soft keys to view the corresponding data at
the bottom of the display.
Step 17. Press the ESCAPE key to return to normal sweep mode.
5-19
Chapter 5 Spectrum Analyzer Measurements
Figure 5-13. Recalled C/I Trace
Chapter 6
Internal Power Meter Mode
Introduction
The Cell Master MT8212B can make power measurements based on the spectrum analyzer
measurements, and can display the measured power in dBm or Watts.
Power Measurement
Required Equipment
The following equipment is required to make a power measurement with the Cell Master.
� Cell Master Model MT8212B
� Test Port Extension Cable, Anritsu 15NNF50 – 1.5C
Procedure
The following procedure details making a power measurement with the Cell Master.
Step 1. Press the ON/OFF key on the Cell Master.
Step 2. Press the MODE key.
Step 3. Use the Up/Down arrow key to select the Power Meter mode and press ENTER.
Step 4. Press Span to activate a menu of span related choices:
Edit — Allows editing of the span to enter specific frequency.
Full — Sets the power meter to its maximum frequency span.
Min — Sets the power meter span to minimum.
Span Up 1-2-5 — Activates the span function so that the span may be
increased quickly in a 1-2-5 sequence.
Span Down 1-2-5 — Activates the span function so that the span may be
reduced quickly in a 1-2-5 sequence.
Back — Returns to the previous menu level.
Step 5. Press the Center soft key to set the power meter to the desired center frequency.
A center frequency from 4.5 MHz to 2.9985 MHz can be entered.
or
Press the Signal Standard and Select Standard soft keys and choose the appro-
priate signal standard for the network, and press the Select Channel soft key and
choose the appropriate channel for the selected standard.
Step 6. Press the MEAS/DISP key to activate the RMS Averaging menu. The RMS av-
erage is calculated by taking the log of the average power, and the power is cal-
culated from voltage. The number of points to average can be set to low,
medium or high.
6-1

Offset Calibration
One of the main contributors to measurement error when measuring the power coming out
of a base station is to assume that the combined loss of the phase stable cable and the at-
tenuator connected to the output of the instrument is exactly the same as the specified value
of the attenuator. An offset calibration can be used to measure the loss of the attenuator and
cable using a scalar measurement.
The instrument measures the loss of the phase stable cable and the attenuator and uses this
value to subtract the loss for the selected frequency range. The original characterization is
done over the entire frequency range, so there is no need to perform additional calibrations
when the frequency range is changed. The calibration automatically disappears when the in-
strument is rebooted. It is possible to recall the last calibration and it is also possible to ap-
ply this offset cal feature to other modes as well (GSM, CDMA, EVDO, SPA).
Required Equipment
� Cell Master MT8212B
� Test Port Extension Cable, Anritsu 15NNF50 – 1.5C
� 18" (46cm) Test Port Extension Cable, Anritsu 3-806-151
� 10 dB Attenuator, Anritsu 3-1010-119
� 30 dB, 50W, bi-directional, DC–18 GHz, N(m) – N(f), Attenuator, Anritsu 42N50A-30
Procedure
Step 1. Press the ON/OFF key on the Cell Master.
Step 2. Press the MODE key.
Step 3. Use the Up/Down arrow key to select the Power Meter mode and press ENTER.
Step 4. Press the START CAL (3) key.
Step 5. Connect the 10 dB Attenuator to the RF Out connector.
Step 6. Connect the 18" (46cm) Test Port Extension Cable to the RF In connector and
the 10 dB Attenuator.
6-2
Chapter 6 Power Measurement
18" Cable3-806-151
10 dB Attenuator3-1010-119
RF Out
RF In
HOLDRUN
STARTCAL
AUTOSCALE
SAVESETUP
RECALLSETUP
LIMIT MARKER
SAVEDISPLAY
RECALLDISPLAY
MODE FREQ/DIST AMPLITUDE MEAS/DISP
SYS
ENTER
CLEAR
ESCAPE
ON
OFF
/
1 2
4
5 6
7 8
9 0
3
+-
.
MT8212B CellMaster
Figure 6-1. Setup for Normalizing the Trace

Step 7. Press the ENTER key.
Step 8. Disconnect the 18" (46cm) Test Port Extension Cable from the RF In connector
and connect the phase stable cable and attenuator between the RF In connector
and the 18" (46cm) Test Port Extension Cable.
Step 9. Press the ENTER key.
Step 10. A message will appear confirming that the Offset Calibration is done and show-
ing the offset value to be applied. Press the ENTER key to accept the offset
value, or press ESCAPE to cancel. The message Offset Cal On (# dB) will show
at the bottom of the display.
6-3
Test Port Extension Cable15NNF50 – 1.5C
30 dB Attenuator42N50A-30
18" Cable3-806-151
10 dB Attenuator3-1010-119
RF Out
RF In
HOLDRUN
STARTCAL
AUTOSCALE
SAVESETUP
RECALLSETUP
LIMIT MARKER
SAVEDISPLAY
RECALLDISPLAY
MODE FREQ/DIST AMPLITUDE MEAS/DISP
SYS
ENTER
CLEAR
ESCAPE
ON
OFF
/
1 2
4
5 6
7 8
9 0
3
+-
.
MT8212B CellMaster
Figure 6-2. Measuring Insertion Loss of the Test Port Extension Cable and 30 dB Attenuator

Recall an Offset Calibration
The offset calibration will be turned off when the system is rebooted. However, the last cal-
ibration is always saved and can be recalled and applied again without performing another
calibration.
Step 1. Press the Amplitude key.
Step 2. Press the Offset dB soft key.
Step 3. Press the Recall Offset CAL soft key.
Turn Off an Offset Calibration
The Offset Calibration can be turned off by rebooting the Cell Master. To turn off the Off-
set CAL without rebooting the instrument:
Step 1. Press the Amplitude key.
Step 2. Press the Offset dB soft key.
NOTE: The Offset Calibration can be applied to the Amplitude Offset in Spec-
trum Analyzer, Interference Analyzer, CDMA, EVDO, and GSM modes as well.
For Power Meter, Spectrum Analyzer, or Interference Analyzer mode, the aver-
age insertion loss value of the span will be shown. In CDMA, EVDO, or GSM
mode, the displayed value after the offset calibration will show the loss at the
center frequency.
6-4
Chapter 6 Power Measurement

Changing the Display Units
The power reading can be displayed in dBm or Watts.
Step 1. Press the AMPLITUDE key.
Step 2. Press the Units soft key to toggle the display between Watts and dBm.
Step 3. Press the FREQ/DIST key to return to the Power Meter menu.
Displaying Relative Power
Relative power can be selected through the AMPLITUDE menu.
Step 1. With the desired base power level input to the Cell Master, press the AMPLI-
TUDE key, then the Rel soft key. The message Relative: On will show in the
lower left of the status window.
Step 2. Pressing the UNITS soft key will toggle the display between dB and %. When
the units are dBm, the Rel soft key toggles from dB to dBm. When the units are
Watts, the Rel soft key will toggle between % and nW.
Step 3. Choose Offset or Zero depending upon the measurement (see Chapter 2).
6-5
Figure 6-3. Sample Power Meter Display

Chapter 7
Power Monitor Mode
(Option 5)
Introduction
The Cell Master MT8212B with Option 5 installed can be used for making power measure-
ments with broadband RF detectors, such as the 10 MHz to 20 GHz Anritsu 560-7N50B.
See the table of available RF detectors on page 1-5. The power monitor displays the mea-
sured power results in dBm or Watts
Power Measurement
Required Equipment
� Cell Master MT8212B with Option 5
� Broadband RF detector, Anritsu P/N 560-7N50B
� 30 dB, 50 Watt, bi-directional, DC –18 GHz, N(m) – N(f), Attenuator, 42N50A-30
Procedure
Step 1. Press the ON/OFF key on the Cell Master.
Step 2. Press the MODE key.
Step 3. Use the Up/Down arrow key to select the Power Monitor mode and press
ENTER.
NOTE: If the detector is not installed, the Cell Master will display an error mes-
sage. If the detector is installed and the error message appears, check the con-
nections between the detector cable and the Cell Master connector. If the error
message persists, contact the nearest Anritsu Service Center.
Zeroing the Power Monitor
Step 4. With no power applied to the DUT, press the Zero soft key. Wait for a few sec-
onds while the Cell Master accumulates data samples of the quiescent power.
When complete, Zero Adj: On is displayed in the message area.
Zeroing subtracts the measured system noise. If the system noise is at -60 dBm
and zeroing is applied, 1 nW will be subtracted from the measurement.
Measuring High Input Power Levels
Step 5. Insert an attenuator between the DUT and the RF detector to protect the Cell
Master so that the input power level is less than or equal to 20 dBm.
Step 6. Press the Offset dB soft key.
Step 7. Enter the attenuation in dB using the keypad. Press the ENTER key to complete
the entry. The message area will show Relative: On along with the entered value
in dB.
7-1

NOTE: If the loss is not known, Option 21, Transmission Measurement, or the
Offset Calibration can be used to measure the loss of the system.
Displaying Power in dBm and Watts
Step 8. Press the Units soft key to display power in Watts.
Displaying Relative Power
Step 9. With the desired base power level input to the Cell Master, press the REL soft
key. The message area will show Relative: On and the power reading will indi-
cate 100%.
If measuring a 10 dBm signal with Rel selected and the power level drops to 7
dBm, the Relative setting will show -3 dB or 50%, depending on the units set-
ting selected.
Step 10. Press the Units soft key to display power in dBm. Since Relative is ON, the
power reading will be in dBr, relative to the base power level.
7-2
Chapter 7 Power Monitor
CELL MASTER
SYNTHESIZER
RF DETECTOR
HOLDRUN
STARTCAL
AUTOSCALE
SAVESETUP
RECALLSETUP
LIMIT MARKER
SAVEDISPLAY
RECALLDISPLAY
MODE FREQ/DIST AMPLITUDE SWEEP
SYS
ENTER
CLEAR
ESCAPE
ONOFF
/
1 2
4
5 6
7 8
9 0
3
+-
.
Site Master S820C
� � � � � � � � �
� � � � � � � �
� � � � � �
� � � �
� � � � � � � �
� � � � � �
� � � � �
� � � �
� � � � � � � �
� � �
� � � � �� � � �
� � � � � � �
! " #
$ � %
& ' (
� ) * + ,
RFDETPORT(Option 5)
Figure 7-1. MT8212B Cell Master Power Monitor Setup
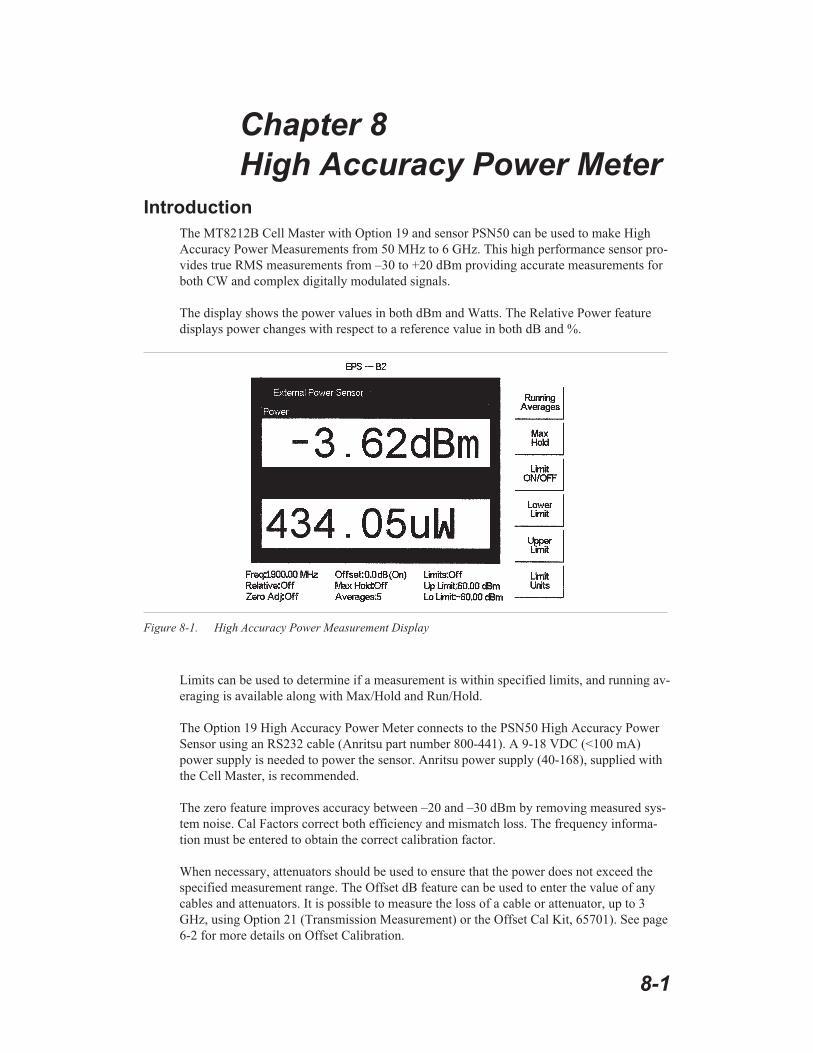
Chapter 8
High Accuracy Power Meter
Introduction
The MT8212B Cell Master with Option 19 and sensor PSN50 can be used to make High
Accuracy Power Measurements from 50 MHz to 6 GHz. This high performance sensor pro-
vides true RMS measurements from –30 to +20 dBm providing accurate measurements for
both CW and complex digitally modulated signals.
The display shows the power values in both dBm and Watts. The Relative Power feature
displays power changes with respect to a reference value in both dB and %.
Limits can be used to determine if a measurement is within specified limits, and running av-
eraging is available along with Max/Hold and Run/Hold.
The Option 19 High Accuracy Power Meter connects to the PSN50 High Accuracy Power
Sensor using an RS232 cable (Anritsu part number 800-441). A 9-18 VDC (<100 mA)
power supply is needed to power the sensor. Anritsu power supply (40-168), supplied with
the Cell Master, is recommended.
The zero feature improves accuracy between –20 and –30 dBm by removing measured sys-
tem noise. Cal Factors correct both efficiency and mismatch loss. The frequency informa-
tion must be entered to obtain the correct calibration factor.
When necessary, attenuators should be used to ensure that the power does not exceed the
specified measurement range. The Offset dB feature can be used to enter the value of any
cables and attenuators. It is possible to measure the loss of a cable or attenuator, up to 3
GHz, using Option 21 (Transmission Measurement) or the Offset Cal Kit, 65701). See page
6-2 for more details on Offset Calibration.
8-1
Figure 8-1. High Accuracy Power Measurement Display
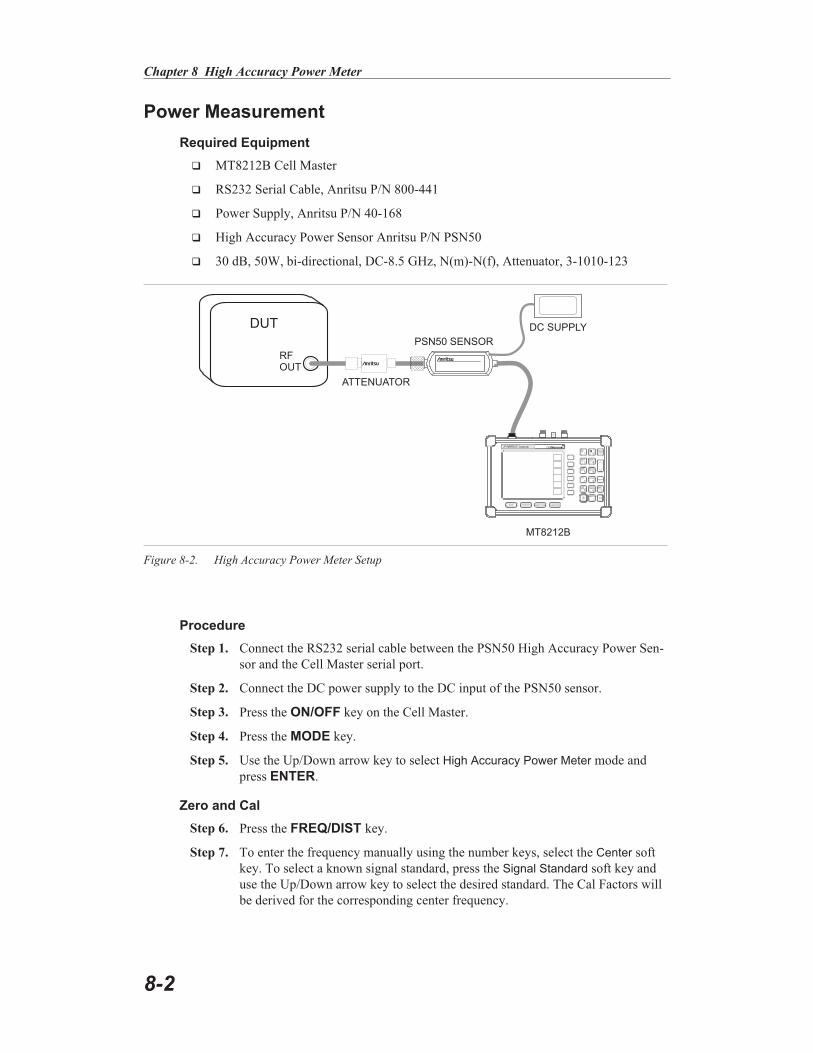
Power Measurement
Required Equipment
� MT8212B Cell Master
� RS232 Serial Cable, Anritsu P/N 800-441
� Power Supply, Anritsu P/N 40-168
� High Accuracy Power Sensor Anritsu P/N PSN50
� 30 dB, 50W, bi-directional, DC-8.5 GHz, N(m)-N(f), Attenuator, 3-1010-123
Procedure
Step 1. Connect the RS232 serial cable between the PSN50 High Accuracy Power Sen-
sor and the Cell Master serial port.
Step 2. Connect the DC power supply to the DC input of the PSN50 sensor.
Step 3. Press the ON/OFF key on the Cell Master.
Step 4. Press the MODE key.
Step 5. Use the Up/Down arrow key to select High Accuracy Power Meter mode and
press ENTER.
Zero and Cal
Step 6. Press the FREQ/DIST key.
Step 7. To enter the frequency manually using the number keys, select the Center soft
key. To select a known signal standard, press the Signal Standard soft key and
use the Up/Down arrow key to select the desired standard. The Cal Factors will
be derived for the corresponding center frequency.
8-2
Chapter 8 High Accuracy Power Meter
ATTENUATOR
MT8212B
DUT
RFOUT
PSN50 SENSOR
DC SUPPLY
HOLDRUN
STARTCAL
AUTOSCALE
SAVESETUP
RECALLSETUP
LIMIT MARKER
SAVEDISPLAY
RECALLDISPLAY
MODE FREQ/DIST AMPLITUDE MEAS/DISP
SYS
ENTER
CLEAR
ESCAPE
ON
OFF
/
1 2
4
5 6
7 8
9 0
3
+-
.
MT8212B CellMaster
Figure 8-2. High Accuracy Power Meter Setup

NOTE: The channel number is not required because the cal factor frequencies
are rounded to the nearest 500 MHz.
Step 8. With no power applied to the sensor, press the AMPLITUDE key then the Zero
soft key to zero the sensor. Zeroing the sensor is recommended when making
power measurements below –20 dBm.
Using Attenuators
Step 9. Press the AMPLITUDE key and select the Offset dB soft key.
Step 10. Connect the attenuator between the DUT and the sensor.
Step 11. Enter the offset value of the attenuator, or select the Measure Offset soft key to
use the Offset Cal Kit (65701) to measure the offset. See page 6-2 for more de-
tails.
Averaging/Max Hold/Run Hold
Step 12. Press the MEAS/DISP key.
Step 13. Press the Running Averages soft key and use the keypad to enter the number of
averages to use (up to 50).
Step 14. Press the Max Hold soft key to display the maximum value. If Averaging is se-
lected, Max/Hold will display the maximum value of the non-averaged data.
Step 15. Press the RUN/HOLD key to hold the display in the current condition.
Setting Limits
Step 16. Press the MEAS/DISP key.
Step 17. Press the Limit Units soft key to select the units.
Step 18. Press the Lower Limit soft key and enter the lower limit value in dBm or in
Watts.
Step 19. Press the Upper Limit soft key and enter the upper limit value in dBm or in
Watts.
Step 20. Press the Limit ON/OFF soft key to turn on the limits. The number display will
turn green if the measurement is passing, or red if the measurement is failing.
The word PASS or FAIL will also be displayed in between the logarithmic and
linear display windows.
Displaying Relative Power
Step 21. Press the AMPLITUDE key.
Step 22. With the desired base power level input to the sensor, press the Rel soft key. The
message area will show Relative On and the power reading will show 0 dB and
100%. If measuring a 10 dBm signal with the Rel key selected, a drop to 7 dBm
will show –3dB and 50%.
Saving the Measurement
Step 23. Press the SAVE DISPLAY key.
Step 24. Use the soft keys to enter a Trace Name.
Chapter 8 High Accuracy Power Meter
8-3

Transferring Data to Handheld Software Tools
The Cell Master has only one serial port, so it is not possible to communicate with both the
PSN50 sensor and a PC running Handheld Software Tools (HHST) at the same time. There-
fore, only saved measurements can be viewed in HHST when using the PSN50. To view
saved measurements, disconnect the serial cable from the PSN50 and connect it to the serial
port of the PC running HHST. Refer to the Handheld Software Tools chapter in this manual
for further information.
8-4
Chapter 8 High Accuracy Power Meter

Chapter 9
T1 Measurement Mode
Introduction
This chapter provides a brief description of a T1 circuit and T1 measurements, and also ex-
plains how to setup and measure T1 performance using the Anritsu Cell Master MT8212B
with Option 50 installed.
T1 Fundamentals
Wireless service providers use wired T1 circuits as the backhaul links to connect a Base
Transceiver Station (BTS) to a Mobile Switching Center (MSC). The quality of the service
provided over those T1 lines has a direct effect on the quality of service experienced by the
wireless service provider customers. Call setup failures, dropped calls, data errors and noise
can often be attributed to the T1 backhaul facilities. An example of a typical wireless net-
work backhaul T1 link is shown in the Figure 9-1.
In the United States, wireless service providers generally lease T1 lines from a Local Ex-
change Carrier (LEC), so it often requires a joint effort to analyze and troubleshoot a T1
line.
T1 is an American National Standard Institute (ANSI) standard, used mostly in North
America, parts of Japan and some Asian countries. Technically, a T1 line is a digital trans-
mission facility consisting of wire pairs and regenerators, or optical media, carrying a DS1
signal. T1 refers to the physical properties of the line, for example, 1.544 MHz with a spe-
cific pulse shape, etc. DS1 refers to the digital signal carrying the information at a rate of
1.544 Mb/s. The DS1 signal may be formatted using various framing patterns, most com-
monly (but not always) divided into 24 channels each carrying encoded voice or data.
9-1
T1 BACKHAUL
T1
BA
CK
HA
UL
T1 BACKHAUL
T1 BACKHAULT1
BACKHAUL
BTS
BTS
BTS
BTS
BTS
MSC
Figure 9-1. Typical Wireless Network T1 Backhaul Link

G.821 Measurement Definitions
Available Seconds (AS)�The count of available seconds since the beginning of the test.
Available seconds equals the total test time minus any unavailable seconds.
Degraded Minutes (DGRM)�The count of Degraded Minutes since the start of the test. A
Degraded Minute occurs when there is a 10-6 bit error rate during 60 available, non-se-
verely bit errored seconds.
Error Free Seconds (EFS)�The count of error free seconds since the beginning of the test.
Error free seconds equals the total test time minus the number of errored seconds.
Errored Second (ES)�The number of seconds with at least one error.
Severely Errored Seconds (SES)�This is the count of Severely Errored Seconds since the
beginning of the test. A second with a bit error rate of 10-3 or higher is a severely errored
second. Severely errored seconds are not counted during unavailable time. Loss of signal
(LOS), loss of frame (LOF) and loss of pattern synchronization (LOP) are treated as se-
verely errored seconds
Unavailable Seconds (UAS)�This is the count of UnAvailable Seconds that have occurred
since the beginning of the test. Unavailable time begins at the onset of 10 consecutive se-
verely errored seconds, and ends after 10 consecutive non-severely errored seconds. The
onset of unavailable seconds cause the SES count to be adjusted downward by 10. When
unavailable time ends, the UAS count is adjusted downward by 10.
Network Equipment
One possible network topology is shown in Figure 9-2.
The circuit between the MSC and BTS passes through the LEC central office, and in fact
may pass through multiple central offices. Within each office, it will in turn pass through
multiple pieces of transmission equipment. The Network Interface Unit (NIU) at the MSC
and the BTS may be a very simple device having only a remote loop back capability, or it
may provide very sophisticated performance monitoring capabilities. Its capabilities may or
may not be accessible to the wireless service provider technician. Some repeaters may exist
in the circuit when the signal is traveling long distances. Repeaters are full duplex devices
that regenerate or restore the pulse shape and amplitude.
9-2
Chapter 9 T1 Measurements
MSC
BTS
Figure 9-2. One Possible T1 Network Topology
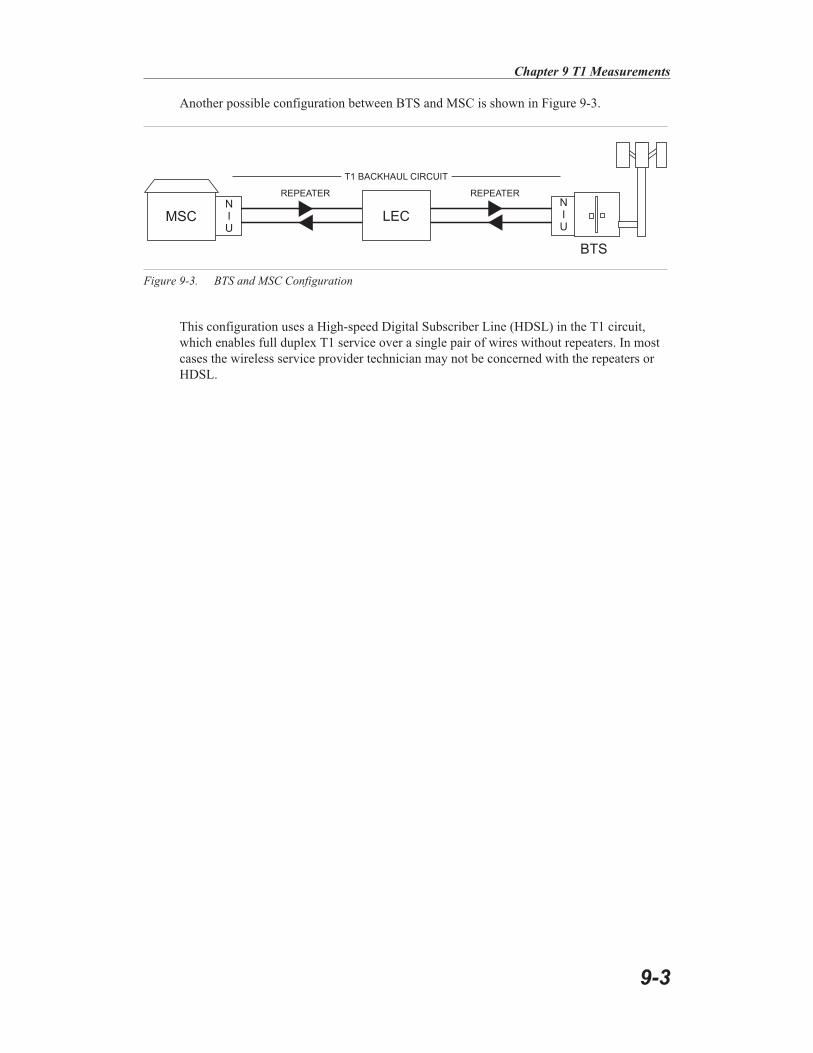
Another possible configuration between BTS and MSC is shown in Figure 9-3.
This configuration uses a High-speed Digital Subscriber Line (HDSL) in the T1 circuit,
which enables full duplex T1 service over a single pair of wires without repeaters. In most
cases the wireless service provider technician may not be concerned with the repeaters or
HDSL.
Chapter 9 T1 Measurements
9-3
MSC
REPEATER
T1 BACKHAUL CIRCUIT
REPEATER
LECNIU
NIU
BTS
Figure 9-3. BTS and MSC Configuration
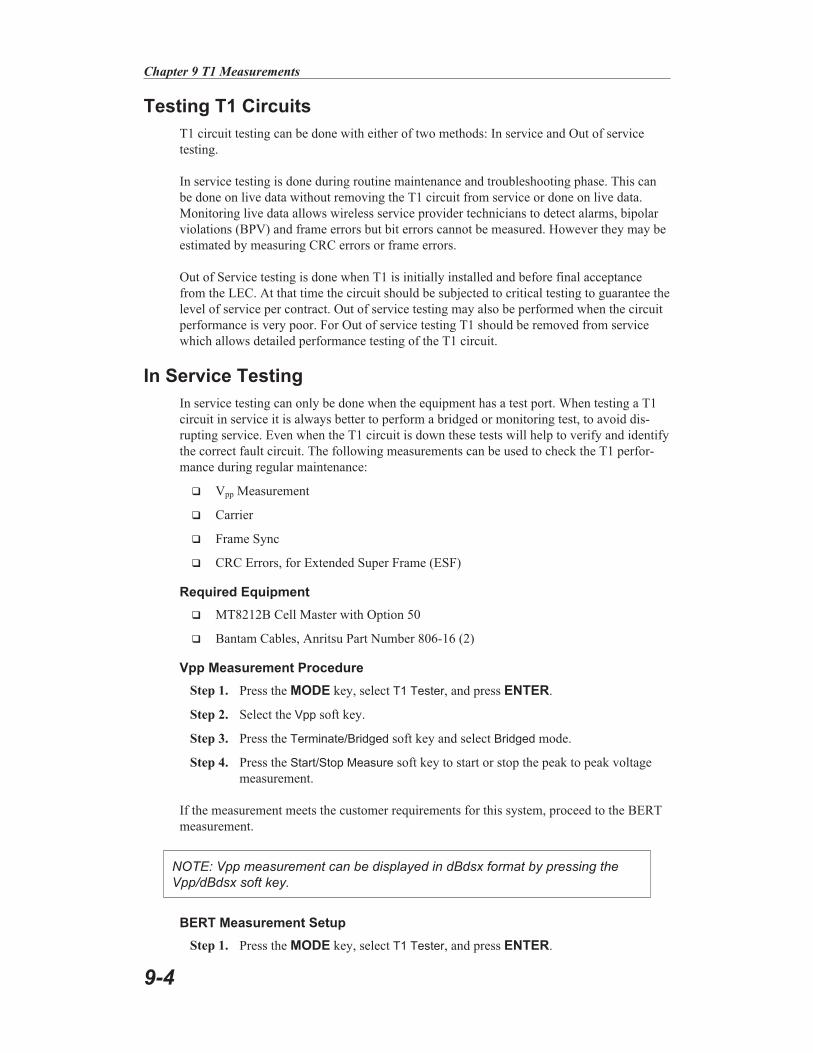
Testing T1 Circuits
T1 circuit testing can be done with either of two methods: In service and Out of service
testing.
In service testing is done during routine maintenance and troubleshooting phase. This can
be done on live data without removing the T1 circuit from service or done on live data.
Monitoring live data allows wireless service provider technicians to detect alarms, bipolar
violations (BPV) and frame errors but bit errors cannot be measured. However they may be
estimated by measuring CRC errors or frame errors.
Out of Service testing is done when T1 is initially installed and before final acceptance
from the LEC. At that time the circuit should be subjected to critical testing to guarantee the
level of service per contract. Out of service testing may also be performed when the circuit
performance is very poor. For Out of service testing T1 should be removed from service
which allows detailed performance testing of the T1 circuit.
In Service Testing
In service testing can only be done when the equipment has a test port. When testing a T1
circuit in service it is always better to perform a bridged or monitoring test, to avoid dis-
rupting service. Even when the T1 circuit is down these tests will help to verify and identify
the correct fault circuit. The following measurements can be used to check the T1 perfor-
mance during regular maintenance:
� Vpp Measurement
� Carrier
� Frame Sync
� CRC Errors, for Extended Super Frame (ESF)
Required Equipment
� MT8212B Cell Master with Option 50
� Bantam Cables, Anritsu Part Number 806-16 (2)
Vpp Measurement Procedure
Step 1. Press the MODE key, select T1 Tester, and press ENTER.
Step 2. Select the Vpp soft key.
Step 3. Press the Terminate/Bridged soft key and select Bridged mode.
Step 4. Press the Start/Stop Measure soft key to start or stop the peak to peak voltage
measurement.
If the measurement meets the customer requirements for this system, proceed to the BERT
measurement.
NOTE: Vpp measurement can be displayed in dBdsx format by pressing the
Vpp/dBdsx soft key.
BERT Measurement Setup
Step 1. Press the MODE key, select T1 Tester, and press ENTER.
9-4
Chapter 9 T1 Measurements
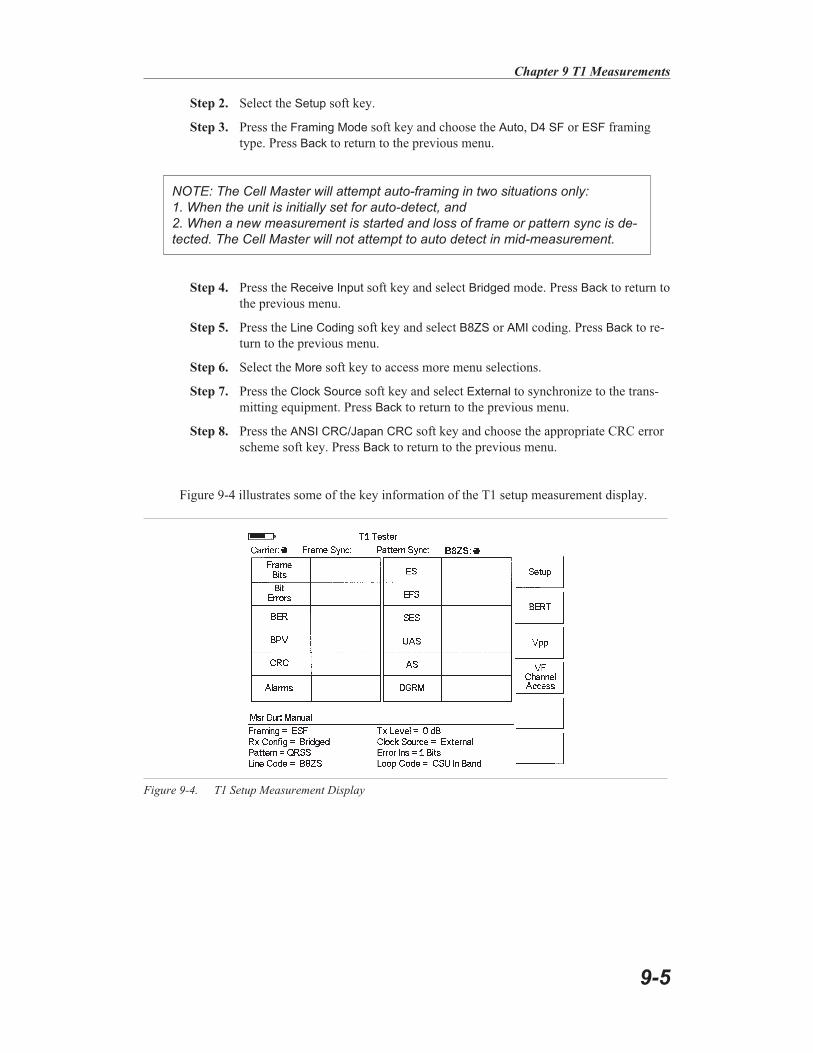
Step 2. Select the Setup soft key.
Step 3. Press the Framing Mode soft key and choose the Auto, D4 SF or ESF framing
type. Press Back to return to the previous menu.
NOTE: The Cell Master will attempt auto-framing in two situations only:
1. When the unit is initially set for auto-detect, and
2. When a new measurement is started and loss of frame or pattern sync is de-
tected. The Cell Master will not attempt to auto detect in mid-measurement.
Step 4. Press the Receive Input soft key and select Bridged mode. Press Back to return to
the previous menu.
Step 5. Press the Line Coding soft key and select B8ZS or AMI coding. Press Back to re-
turn to the previous menu.
Step 6. Select the More soft key to access more menu selections.
Step 7. Press the Clock Source soft key and select External to synchronize to the trans-
mitting equipment. Press Back to return to the previous menu.
Step 8. Press the ANSI CRC/Japan CRC soft key and choose the appropriate CRC error
scheme soft key. Press Back to return to the previous menu.
Figure 9-4 illustrates some of the key information of the T1 setup measurement display.
Chapter 9 T1 Measurements
9-5
Figure 9-4. T1 Setup Measurement Display

BERT Measurement
Step 1. Press the MEAS/DISP key and then the BERT soft key.
Step 2. Press the Measure Duration soft key and use the Up/Down arrow key to select
the duration of the measurement, and press ENTER. Figure 7-5 shows the T1
measurement display.
Step 3. To display the measurement data in a histogram format, press the Display Raw
Data/Histogram soft key.
Step 4. Press the Measure Duration soft key to set the duration of the measurement, and
press ENTER. The maximum measurement duration is two days.
Step 5. Press the Time Scale soft key and use the Up/Down arrow key to select the histo-
gram resolution, and press ENTER. The maximum time scale is 60 minutes.
NOTE: The unit sets the histogram display and collects and displays the data
based on the selected time scale. For example, if the time scale is set to 30
minutes, the unit collects and updates the histogram display data every 30 min-
utes. When the time scale is set to Auto, the unit automatically sets the histo-
gram display to collect the data based on the selected measurement duration.
Step 6. Press the Start/Stop Measure soft key to begin the measurement.
Step 7. Press the SYS key, then the Application Options and Log Data soft keys to save
the data. A message window will display if there is insufficient memory to log
the complete duration. Adjust the Measurement Duration and Time Scale as nec-
essary to log the data.
NOTE: The RUN/HOLD key can also be used to start or stop the measurement.
9-6
Chapter 9 T1 Measurements
Figure 9-5. T1 BERT Measurement Display

Figure 7-6 displays the T1 measurement data in Histogram mode.
Out-Of-Service Testing
Out-of-service measurements are performed when the T1 circuit is not in service or inac-
tive. Typically these tests are done during initial installation, during circuit acceptance by
the wireless service provider or when the results of the in-service measurements indicate er-
rors. These measurements provide detailed information on the T1 circuit.
There are two methods of performing out-of-service testing: end-to-end and loopback test-
ing. End-to-end testing requires a technician and a unit at each end of the circuit. Loopback
testing requires a loopback at one end of the circuit and a unit and technician at the other
end to measure the round trip of the T1 performance.
The ANSI T1 standard defines in-band and out-of-band loop codes. In-band codes are
transmitted in place of payload data and are repeated continuously for a period of five sec-
onds. They can be used either with D4 SF or ESF. Out-of-band loop codes can only be used
with the ESF framing format as an out of band communication link does not exist for D4
SF.
The following measurements can be used to check T1 performance during out of service
testing:
� Vpp
� Carrier
� Insert Errors/Alarms
� Frame Sync
� Pattern Sync
� Remote/Self Loop Codes
Required Equipment
� MT8212B Cell Master with Option 50
� Bantam Cables, Anritsu Part Number 806-16 (2)
Chapter 9 T1 Measurements
9-7
Figure 9-6. T1 BERT Measurement Display with Histogram

Vpp Measurement Procedure
Step 1. Press the MODE key, select T1 Tester, and press ENTER.
Step 2. Select the Vp-p soft key.
Step 3. Press the Terminate/Bridged soft key and select Terminate mode.
Step 4. Press the Start/Stop Measure soft key to start or stop the peak to peak voltage
measurement.
NOTE: The Vpp measurement can be displayed in dBdsx format by pressing
the Vpp/dBdsx soft key.
BERT Setup Procedure
Step 1. Press the MODE key, select T1 Tester, and press ENTER.
Step 2. Select the Setup soft key.
Step 3. Press the Framing Mode soft key and choose the Auto, D4 SF or ESF framing
type. Press Back to return to the previous menu.
NOTE: The Cell Master will attempt auto-framing in two situations only:
1. When the unit is initially set for auto-detect, and
2. When a new measurement is started and loss of frame or pattern sync is de-
tected. The Cell Master will not attempt to auto detect in mid-measurement.
Step 4. Press the Receive Input soft key and select Terminate. Press Back to return to
the previous menu.
Step 5. Press the Pattern soft key and select Auto, or the appropriate pattern for this test,
and press ENTER.
Step 6. Press the Line Coding soft key and select either the B8ZS or AMI soft key, as ap-
propriate. Press Back to return to the previous menu.
Step 7. Press the Transmit Level soft key and select either the 0 dB, –7.5 dB or –15 dB
transmitter signal level soft key as appropriate for this measurement. Press Back
to return to the previous menu.
Step 8. Select the More soft key to access more menu selections.
Step 9. Press the Clock Source soft key and select External for an external clock source
or Internal to use the internal clock. Press Back to return to the previous menu.
Step 10. Press the Setup Error Insert soft key and set the appropriate error or alarm type
by selecting the Bit, BPV, Framing Bits, RAI or AIS soft key. Press Back to return
to the previous menu.
Step 11. Press the Loop Code soft key and select the appropriate loop code by selecting
the CSU, NIU, User defined or In-Band/Data Link soft key. Press Back to return
to the previous menu.
Step 12. Press the ANSI CRC/Japan CRC soft key and choose the appropriate CRC error
scheme soft key. Press Back to return to the previous menu.
9-8
Chapter 9 T1 Measurements

Figure 9-7 illustrates some of the key information of the T1 measurement setup.
Chapter 9 T1 Measurements
9-9
Figure 9-7. T1 Out-of-Service Measurement

BERT Measurement Procedure
Step 1. Press the MEAS/DISP key and then the BERT soft key.
Step 2. Press the Measure Duration soft key and use the Up/Down arrow key to select
the duration of the measurement, and press ENTER. Figure 7-8 displays the T1
measurement in raw data mode.
Step 3. To display the measurement data in a histogram format, press the Display Raw
Data/Histogram soft key.
Step 4. Press the Measure Duration soft key to set the duration of the measurement, and
press ENTER. The maximum measurement duration is two days.
Step 5. Press the Time Scale soft key and use the Up/Down arrow key to select the histo-
gram resolution, and press ENTER. The maximum time scale is 60 minutes.
NOTE: The unit sets the histogram display and collects and displays the data
based on the selected time scale. For example, if the time scale is set to 30
minutes, the unit collects and updates the histogram display data every 30 min-
utes. When the time scale is set to Auto, the unit automatically sets the histo-
gram display to collect the data based on the selected measurement duration.
Step 6. Press the Start/Stop Measure soft key to begin the measurement.
Step 7. Press the SYS key, then the Application Options and Log Data soft keys to save
the data. A message window will display if there is insufficient memory to log
the complete duration. Adjust the Measurement Duration and Time Scale as nec-
essary to log the data.
Step 8. Press the Start/Stop Measure soft key to begin the measurement.
NOTE: The RUN/HOLD key can also be used to start or stop the measurement.
9-10
Chapter 9 T1 Measurements
Figure 9-8. T1 BERT Measurement Display
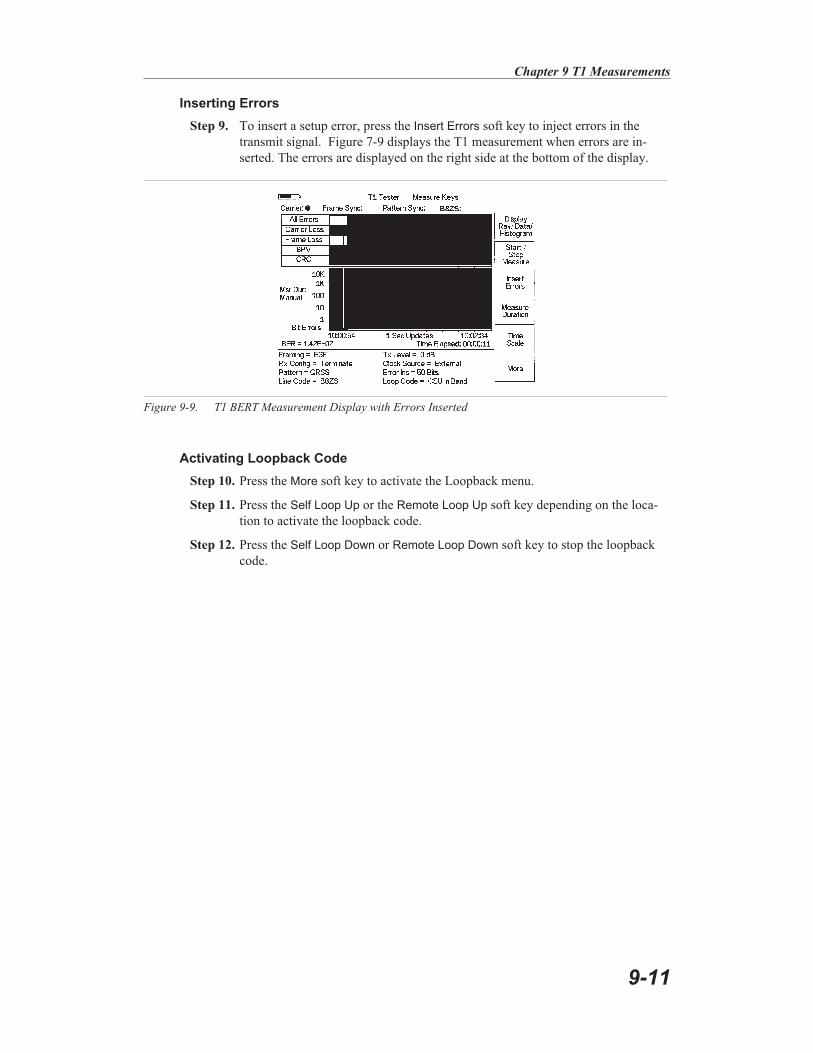
Inserting Errors
Step 9. To insert a setup error, press the Insert Errors soft key to inject errors in the
transmit signal. Figure 7-9 displays the T1 measurement when errors are in-
serted. The errors are displayed on the right side at the bottom of the display.
Activating Loopback Code
Step 10. Press the More soft key to activate the Loopback menu.
Step 11. Press the Self Loop Up or the Remote Loop Up soft key depending on the loca-
tion to activate the loopback code.
Step 12. Press the Self Loop Down or Remote Loop Down soft key to stop the loopback
code.
Chapter 9 T1 Measurements
9-11
Figure 9-9. T1 BERT Measurement Display with Errors Inserted

DS0 Testing
The DS0 test feature enables testing on each of the 24 channels of the T1 line. The receive
channel is decoded and the VF level and frequency are measured and displayed. The signal
is also connected to a speaker, enabling the tester to make an audible assessment of the sig-
nal quality of the circuit. If the circuit is out of service, the tester can insert a test tone on
the transmit channel for measurement at a remote location with another test set, or locally
with a loopback.
Configuration
Before conducting channel tests, the T1 interface must be properly configured. From the
Setup menu, select the correct Framing Mode, Line Coding and Clock Source. If the testing
is in-service, the Receive Input must be configured for either Bridged or Monitor modes. The
receive mode should be set up before connecting to the circuit to avoid creating a "hit" on
the customer data. If the testing is in-service, the Cell Master transmit pair should not be
connected to the circuit.
If the measurement is out-of-service, the Receive Input mode should be Terminate, and the
Cell Master transmitter can be connected to the circuit. The current configuration of the T1
interface is displayed in the status window at the bottom of the screen.
Channel Tests
Once the unit is correctly configured, press the VF Channel Access soft key and select the
DS0 menu to perform tests at the channel level. Press the Select Channel soft key to select
specific channels. Either enter a specific channel number from the keypad, or scroll through
the channels with the Up/Down arrow keys. The received VF level and frequency on the se-
lected channel are displayed, and the decoded signal is connected to a speaker for audio
monitoring. When a test tone is present on the channel, the level and frequency report will
indicate whether the channel is healthy. If speech is present on the channel, the channel per-
formance can be judged from the audio quality. A picture of channel utilization can also be
formed by quickly scrolling through the channels.
If the circuit is out-of-service, the user can also connect to the transmit pair and insert a test
tone on the selected channel (note that transmit and receive must be on the same channel).
Two menus enable selection of transmit level and frequency. The frequency can be entered
from the keypad, or scrolled to common test frequencies (404 Hz, 1004 Hz, 1804 Hz, 2713
Hz, and 2804 Hz) with the Up/Down arrow keys. To check the performance of channel
level equipment, the test tone can be measured at a remote location with another VF chan-
nel test set, or locally with a loopback. To establish a loopback, use the loopback menus in
the BERT test suite.
9-12
Chapter 9 T1 Measurements
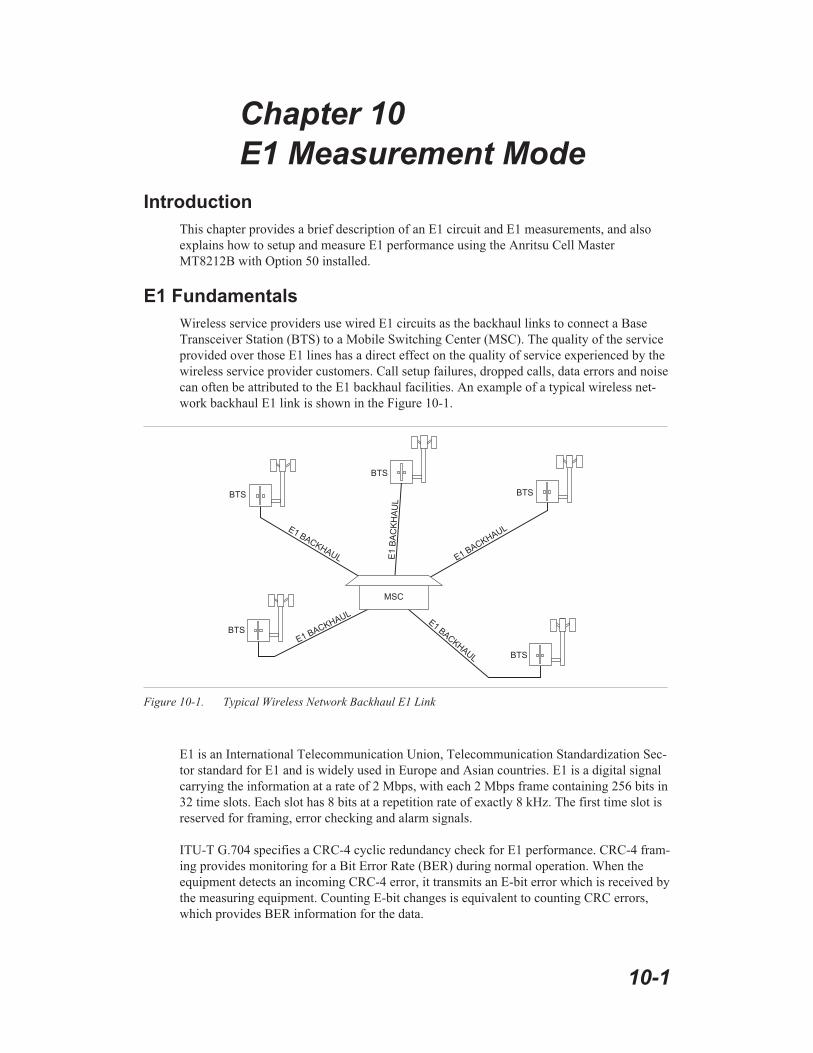
Chapter 10
E1 Measurement Mode
Introduction
This chapter provides a brief description of an E1 circuit and E1 measurements, and also
explains how to setup and measure E1 performance using the Anritsu Cell Master
MT8212B with Option 50 installed.
E1 Fundamentals
Wireless service providers use wired E1 circuits as the backhaul links to connect a Base
Transceiver Station (BTS) to a Mobile Switching Center (MSC). The quality of the service
provided over those E1 lines has a direct effect on the quality of service experienced by the
wireless service provider customers. Call setup failures, dropped calls, data errors and noise
can often be attributed to the E1 backhaul facilities. An example of a typical wireless net-
work backhaul E1 link is shown in the Figure 10-1.
E1 is an International Telecommunication Union, Telecommunication Standardization Sec-
tor standard for E1 and is widely used in Europe and Asian countries. E1 is a digital signal
carrying the information at a rate of 2 Mbps, with each 2 Mbps frame containing 256 bits in
32 time slots. Each slot has 8 bits at a repetition rate of exactly 8 kHz. The first time slot is
reserved for framing, error checking and alarm signals.
ITU-T G.704 specifies a CRC-4 cyclic redundancy check for E1 performance. CRC-4 fram-
ing provides monitoring for a Bit Error Rate (BER) during normal operation. When the
equipment detects an incoming CRC-4 error, it transmits an E-bit error which is received by
the measuring equipment. Counting E-bit changes is equivalent to counting CRC errors,
which provides BER information for the data.
10-1
E1 BACKHAUL
E1
BA
CK
HA
UL
E1 BACKHAUL
E1 BACKHAULE1
BACKHAUL
BTS
BTS
BTS
BTS
BTS
MSC
Figure 10-1. Typical Wireless Network Backhaul E1 Link

G.821 Measurement Definitions
Available Seconds (AS)�The count of available seconds since the beginning of the test.
Available seconds equals the total test time minus any unavailable seconds.
Degraded Minutes (DGRM)�The count of Degraded Minutes since the start of the test. A
Degraded Minute occurs when there is a 10-6 bit error rate during 60 available, non-se-
verely bit errored seconds.
Error Free Seconds (EFS)�The count of error free seconds since the beginning of the test.
Error free seconds equals the total test time minus the number of errored seconds.
Errored Second (ES)�The number of seconds with at least one error.
Severely Errored Seconds (SES)�This is the count of Severely Errored Seconds since the
beginning of the test. A second with a bit error rate of 10-3 or higher is a severely errored
second. Severely errored seconds are not counted during unavailable time. Loss of signal
(LOS), loss of frame (LOF) and loss of pattern synchronization (LOP) are treated as se-
verely errored seconds
Unavailable Seconds (UAS)�This is the count of UnAvailable Seconds that have occurred
since the beginning of the test. Unavailable time begins at the onset of 10 consecutive se-
verely errored seconds, and ends after 10 consecutive non-severely errored seconds. The
onset of unavailable seconds cause the SES count to be adjusted downward by 10. When
unavailable time ends, the UAS count is adjusted downward by 10.
Network Equipment
One possible network topology is shown in Figure 10-2.
The circuit between the MSC and BTS passes through the central office, or through multi-
ple central offices. Within each office it may in turn pass through multiple pieces of trans-
mission equipment. An interface unit is located at the MSC and the BTS. The interface unit
may be a very simple device having only a remote loop back capability, or it may provide
very sophisticated performance monitoring capabilities. Its capabilities may or may not be
accessible to the wireless service provider technician.
10-2
Chapter 10 E1 Measurements
MSC
BTS
E1 BACKHAUL
Figure 10-2. One Possible E1 Network Topology

Testing E1 Circuits
E1 circuit testing can be done with either of two methods: In Service and Out of Service
testing.
In Service testing is done during a routine maintenance and troubleshooting phase. This can
be accomplished without removing the E1 circuit from service on live data. Monitoring live
data allows the wireless service provider technician to detect alarms, bipolar violations
(BPV) and frame errors, but bit errors cannot be measured. However, bit errors may be esti-
mated by measuring CRC errors and E-bit errors.
Out of Service testing is done when the E1 is initially installed and before final acceptance
from the service provider. At that time the circuit should be subjected to critical testing to
guarantee the level of service per contract. Out of service testing may also be performed
when the circuit performance is very poor. For Out of service testing, the E1 circuit should
be removed from service to allow detailed performance testing.
In Service Testing
The Bridged mode must be used when testing a E1 circuit in service to avoid disrupting ser-
vice. Even when the E1 circuit is down, these tests will help to verify and identify the cor-
rect fault circuit. E-bits and CRC are very useful for in service testing to monitor E1
performance. When the equipment detects an incoming CRC-4 error, it will transmit an
E-bit error toward the equipment at other end which will be seen by the test unit. E-bits de-
termine the trouble location of the circuit. Without E-bits, the entire circuit will be deter-
mined as failure by loss of signal or alarm indication, so E-bits are critical to analyze the
performance of the circuit and point to the trouble locations.
The following measurements are used to check the E1 performance during regular mainte-
nance:
� Vpp measurement
� Carrier
� Frame Sync
� CRC errors and E-bits
Required Equipment
� MT8212B Cell Master with Option 50
� Bantam Cables, Anritsu Part Number 806-16 (2)
Vpp Measurement Procedure
Step 1. Press the MODE key, select E1 Tester, and press ENTER.
Step 2. Select the Vpp soft key.
Step 3. Press the Terminate/Bridged soft key and select Bridged mode, as indicated on
the bottom left of the status window.
Step 4. Press the 75 � or 120 � soft key, depending on the requirements for the system
impedance value. The selection will be indicated at the bottom left of the status
window.
Chapter 10 E1 Measurements
10-3
NOTE: The Vpp measurement can be displayed in dBdsx format by pressing
the Vpp/dBdsx soft key.
Step 5. Press the Start/Stop Measure soft key to start or stop the peak to peak voltage
measurement.
BERT Measurement Setup
Step1. Press the MODE key, select E1 Tester, and press ENTER.
Step2. Select the Setup soft key.
Step3. Press the Framing Mode soft key and choose Auto, PCM30, PCM30CRC, PCM31
or PCM31CRC framing type. Press Back to return to the previous menu.
NOTE: The Cell Master will attempt auto-framing in two situations only:
1. When the unit is initially set for auto-detect, and
2. When a new measurement is started and loss of frame or pattern sync is de-
tected. The Cell Master will not attempt to auto detect in mid-measurement.
Step4. Press the Receive Input soft key and select Bridged mode. Press Back to return
to the previous menu.
Step5. Press the Line Coding soft key and select HDB3 or AMI coding. Press Back to re-
turn to the previous menu.
Step6. Select the More soft key to access more menu selections.
Step7. Press the Clock Source soft key and select External clock. Press Back to return
to the previous menu.
Step8. Press the Impedance soft key and choose 75� or 120�. Press Back to return to
the previous menu.
10-4
Chapter 10 E1 Measurements

Figure 10-3 illustrates some of the key information of the E1 setup measurement display.
Chapter 10 E1 Measurements
10-5
Figure 10-3. E1 BERT Setup Measurement Display

BERT Measurement
Step 1. Press the MEAS/DISP key and then the BERT soft key.
Step 2. Press the Measure Duration soft key and use the Up/Down arrow key to select
the duration of the measurement, and press ENTER. Figure 9-4 displays the E1
measurement display in raw data mode.
Step 3. To display the measurement data in a histogram format, press the Display Raw
Data/Histogram soft key.
Step 4. Press the Measure Duration soft key to set the duration of the measurement, and
press ENTER. The maximum measurement duration is two days.
Step 5. Press the Time Scale soft key and use the Up/Down arrow key to select the histo-
gram resolution, and press ENTER. The maximum time scale is 60 minutes.
NOTE: The unit sets the histogram display and collects and displays the data
based on the selected time scale. For example, if the time scale is set to 30
minutes, the unit collects and updates the histogram display data every 30 min-
utes. When the time scale is set to Auto, the unit automatically sets the histo-
gram display to collect the data based on the selected measurement duration.
Step 6. Press the Start/Stop Measure soft key to begin the measurement.
Step 7. Press the SYS key, then the Application Options and Log Data soft keys to save
the data. A message window will display if there is insufficient memory to log
the complete duration. Adjust the Measurement Duration and Time Scale as nec-
essary to log the data.
10-6
Chapter 10 E1 Measurements
Figure 10-4. E1 BERT Measurement Display

Figure 9-5 shows the E1 measurement display in histogram mode.
Chapter 10 E1 Measurements
10-7
Figure 10-5. E1 BERT Measurement Display with Histogram
Out-Of-Service Testing
Out-of-service measurements are performed when the E1 circuit is not in service or inac-
tive. Typically these tests are done during initial installation, during circuit acceptance by
the wireless service provider or when the performance of the in service measurements indi-
cates extensive errors. These measurements provide detailed information about the E1 cir-
cuit.
Out-of-service testing is performed using end-to-end testing, which requires a technician
and a unit at each end of the circuit.
The following measurements are used to check the E1 performance during out of service
testing:
� Vpp
� Carrier
� CRC Errors
� Frame Sync
� Pattern Sync
� E-Bits
� Insert Errors/Alarms
� Self Loop Code
Required Equipment
� MT8212B Cell Master with Option 50
� Bantam Cables, Anritsu Part Number 806-16 (2)
Procedure
Step 1. Press the MODE key, select E1 Tester, and press ENTER.
Step 2. Select the BERT soft key.
Step 3. Press the Framing Mode soft key and choose Auto, PCM30, PCM30CRC, PCM31
or PCM31CRC framing type. Press Back to return to the previous menu.
Step 4. Press the Receive Input soft key and select Terminate. Press Back to return to
the previous menu.
Step 5. Press the Pattern soft key and select Auto, or use the Up/Down arrow key to se-
lect the appropriate pattern for the test.
NOTE: The Cell Master will attempt auto-framing in two situations only:
1. When the unit is initially set for auto-detect, and
2. When a new measurement is started and loss of frame or pattern sync is de-
tected. The Cell Master will not attempt to auto detect in mid-measurement.
Step 6. Press the Line Coding soft key and select HDB3 or AMI coding. Press Back to re-
turn to the previous menu.
10-8
Chapter 10 E1 Measurements

Step 7. Press the Impedance soft key and choose 75� or 120�. Press Back to return to
the previous menu.
Step 8. Select the More soft key to access more menu selections.
Step 9. Press the Clock Source soft key and select External clock. Press Back to return
to the previous menu.
Step 10. Press the Setup Error Insert soft key and select Bit, BPV, Framing Bits, RAI or
AIS as appropriate for the measurement.
Figure 10-6 illustrates some of the key information of the E1 measurement Setup.
BERT Measurement
Step 1. Press the MEAS/DISP key and then the BERT soft key.
Step 2. Press the Measure Duration soft key and use the Up/Down arrow key to select
the duration of the measurement, and press ENTER. Figure 9-7 illustrates an E1
measurement in raw data mode.
NOTE: The RUN/HOLD key can also be used to start or stop the measurement.
Chapter 10 E1 Measurements
10-9
Figure 10-6. Key Information of the E1 Measurement Setup
Figure 10-7. E1 Measurement Display

Step 3. To display the measurement data in a histogram format, press the Display Raw
Data/Histogram soft key.
Step 4. Press the Measure Duration soft key to set the duration of the measurement, and
press ENTER. The maximum measurement duration is two days.
Step 5. Press the Time Scale soft key and use the Up/Down arrow key to select the histo-
gram resolution, and press ENTER. The maximum time scale is 60 minutes.
NOTE: The unit sets the histogram display and collects and displays the data
based on the selected time scale. For example, if the time scale is set to 30
minutes, the unit collects and updates the histogram display data every 30 min-
utes. When the time scale is set to Auto, the unit automatically sets the histo-
gram display to collect the data based on the selected measurement duration.
Step 6. Press the Start/Stop Measure soft key to begin the measurement.
Step 7. Press the SYS key, then the Application Options and Log Data soft keys to save
the data. A message window will display if there is insufficient memory to log
the complete duration. Adjust the Measurement Duration and Time Scale as nec-
essary to log the data.
Step 8. Press the Start/Stop Measure soft key to begin the measurement.
NOTE: The RUN/HOLD key can also be used to start or stop the measurement.
To Insert Setup Errors
Press the Insert Errors soft key to inject errors in the transmit signal while performing the is
E1 measurements. Figure 10-8 illustrates the E1 measurement when the errors are inserted
and it is displayed on the right side at the bottom of the display.
10-10
Chapter 10 E1 Measurements
Figure 10-8. E1 Measurement Display with Errors Inserted

VF Channel Access Testing
The VF Channel Access test feature enables testing on each of the 32 channels of the E1
line. The receive channel is decoded and the VF level and frequency are measured and dis-
played. The signal is also connected to a speaker, enabling the tester to make an audible as-
sessment of the signal quality of the circuit. If the circuit is out of service, the tester can
insert a test tone on the transmit channel for measurement at a remote location with another
test set, or locally with a loopback.
Configuration
Before conducting channel tests, the E1 interface must be properly configured. From the
Setup menu, select the correct Framing Mode, Line Coding and Clock Source. If the testing
is in-service, the Receive Input must be configured for either Bridged or Monitor modes. The
receive mode should be set up before connecting to the circuit to avoid creating a "hit" on
the customer data. If the testing is in-service, the Cell Master transmit pair should not be
connected to the circuit.
If the measurement is out-of-service, the Receive Input mode should be Terminate, and the
Cell Master transmitter can be connected to the circuit. The current configuration of the E1
interface is displayed in the status window at the bottom of the screen.
Channel Tests
Once the unit is correctly configured, select the VF Channel Access menu to perform tests
at the channel level. Press the Select Channel soft key to select specific channels. Either en-
ter a specific channel number from the keypad, or scroll through the channels with the
Up/Down arrow keys. The received VF level and frequency on the selected channel are dis-
played, and the decoded signal is connected to a speaker for audio monitoring. When a test
tone is present on the channel, the level and frequency report will indicate whether the
channel is healthy. If speech is present on the channel, the channel performance can be
judged from the audio quality. A picture of channel utilization can also be formed by
quickly scrolling through the channels.
If the circuit is out-of-service, the user can also connect to the transmit pair and insert a test
tone on the selected channel (note that transmit and receive must be on the same channel).
Two menus enable selection of transmit level and frequency. The frequency can be entered
from the keypad, or scrolled to common test frequencies (404 Hz, 1004 Hz, 1804 Hz, 2713
Hz, and 2804 Hz) with the Up/Down arrow keys. To check the performance of channel
level equipment, the test tone can be measured at a remote location with another VF chan-
nel test set.
Chapter 10 E1 Measurements
10-11
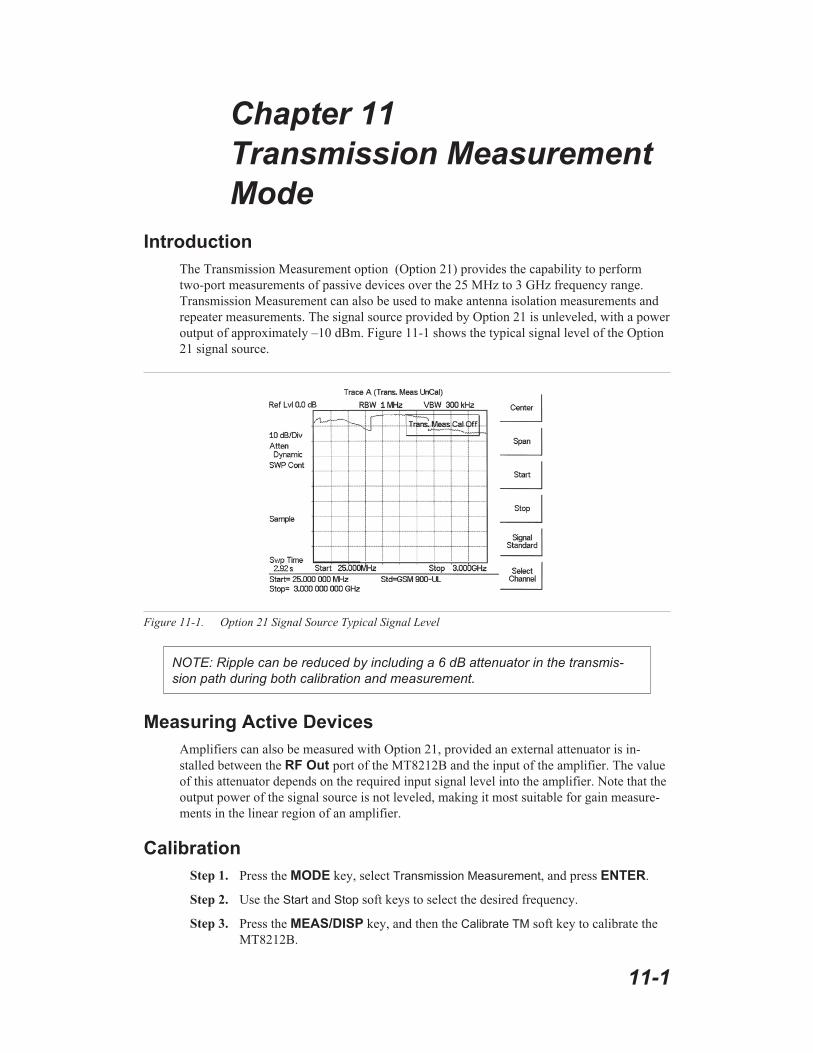
Chapter 11
Transmission Measurement
Mode
Introduction
The Transmission Measurement option (Option 21) provides the capability to perform
two-port measurements of passive devices over the 25 MHz to 3 GHz frequency range.
Transmission Measurement can also be used to make antenna isolation measurements and
repeater measurements. The signal source provided by Option 21 is unleveled, with a power
output of approximately –10 dBm. Figure 11-1 shows the typical signal level of the Option
21 signal source.
NOTE: Ripple can be reduced by including a 6 dB attenuator in the transmis-
sion path during both calibration and measurement.
Measuring Active Devices
Amplifiers can also be measured with Option 21, provided an external attenuator is in-
stalled between the RF Out port of the MT8212B and the input of the amplifier. The value
of this attenuator depends on the required input signal level into the amplifier. Note that the
output power of the signal source is not leveled, making it most suitable for gain measure-
ments in the linear region of an amplifier.
Calibration
Step 1. Press the MODE key, select Transmission Measurement, and press ENTER.
Step 2. Use the Start and Stop soft keys to select the desired frequency.
Step 3. Press the MEAS/DISP key, and then the Calibrate TM soft key to calibrate the
MT8212B.
11-1
Figure 11-1. Option 21 Signal Source Typical Signal Level

NOTE: The START CAL key (number 3 on the keypad) does not start calibra-
tion when the unit is in Transmission Measurement mode.
Step 4. Following the on-screen prompt, connect a phase-stable cable between the RF
Out port and the RF In port. If an attenuator is required for the measurement,
connect it directly to the RF Out port and connect the cable to the attenuator
output.
Step 5. Press the ENTER key.
The unit will sweep once and store transmission correction information. On the next sweep,
the trace should be flat at the zero dB reference line and ready for measurements. The cali-
bration information is lost when the instrument is turned off.
11-2
Chapter 11 Transmission Measurement
Figure 11-2. Uncalibrated Narrowband Trace

Transmission Measurement Procedure
Step 1. Connect the duplexer between the Cell Master RF In and RF Out ports.
Step 2. Connect a load to the other end.
Step 3. Set the start and stop frequencies to cover the frequency range of the duplexer.
Step 4. Disconnect the duplexer and connect a cable to the Cell Master RF In and RF
Out ports.
Step 5. Calibrate the Cell Master for transmission measurements as described in the pre-
vious section.
Step 6. Connect the duplexer and make the measurements.
Chapter 11 Transmission Measurement
11-3
DUPLEXER
HOLDRUN
STARTCAL
AUTOSCALE
SAVESETUP
RECALLSETUP
LIMIT MARKER
SAVEDISPLAY
RECALLDISPLAY
MODE FREQ/DIST AMPLITUDE MEAS/DISP
SYS
ENTER
CLEAR
ESCAPE
ON
OFF
/
1 2
4
5 6
7 8
9 0
3
+-
.
S332D
Figure 11-3. Transmission Measurement Connections
Figure 11-4. Transmission Measurement

Bias Tee (Option 10A)
Option 10A provides a bias tee installed inside the MT8212B Cell Master. The bias arm is
connected to a 12-24 Vdc (variable in 1V increments) power source that can be turned on as
needed to place the voltage on the center conductor of the RF In port. This voltage can be
used to provide power to block down-converters in satellite receivers, and to power some
tower mounted amplifiers.
The bias can be turned on when the instrument is in either Spectrum Analyzer or Transmis-
sion Measurement (Option 21) mode. When bias is turned on, the bias voltage and current
are displayed in the upper left corner of the display. The 12-24 Vdc power supply is de-
signed to deliver 6 Watts maximum, continuously.
Procedure
Step 1. Press the SYS key, then the Application Options soft key.
Step 2. Select the Bias Tee soft key.
Step 3. Select the Bias Tee Voltage soft key and use the number keys or the Up/Down
arrow keys to set the bias tee voltage between 12 and 24 Vdc, in 1V increments.
Step 4. Select the Bias Tee On/Off soft key to turn the bias voltage on. The state of the
bias tee will be saved with the runtime setup.
Step 5. Press the Bias Tee On/Off soft key again to turn the bias tee voltage off.
NOTE: If power to the Bias Tee exceeds 6 Watts maximum continuous opera-
tion, the Bias Tee relay will open and a fault message will be displayed.
11-4
Chapter 11 Transmission Measurement

Chapter 12
GPS Feature
Introduction
The MT8212B Cell Master is available with a built-in GPS receiver feature (Option 31) that
can provide latitude, longitude and altitude information and UTC timing. The following
GPS antennas and accessories are available from Anritsu:
� 2000-1410 Magnet Mount GPS Antenna with 15-foot cable
Activating the GPS Feature
To activate the GPS feature:
Step1. Install the Anritsu GPS antenna to the GPS antenna connection on the Cell Mas-
ter connector panel.
NOTE: The GPS antenna connection on the Cell Master is fitted with a reverse
BNC connector to help prevent damage to the GPS circuitry. There is a DC
voltage present on this connector. Do not connect anything other than the
Anritsu GPS antenna to this port.
Step2. Press the SYS key.
Step3. Select the GPS soft key.
Step4. Press the GPS On/Off soft key to turn the GPS feature on or off. When GPS is
first turned on, the GPS icon below will be displayed in red:
When the GPS receiver has tracked at least three satellites, the GPS icon will
change to:
Step5. Press the Location soft key to view the latitude, longitude and altitude informa-
tion and UTC timing.
Step6. Press the Quality soft key to display the number of tracked satellites and the GPS
quality.
NOTE: Press the Reset soft key to reset the GPS.
12-1
GPS
GPS

NOTE: The Cell Master retains the current GPS location information until the
unit is turned off. This feature allows measurement traces to be saved with the
retained GPS location information even when the GPS is inactive or the instru-
ment is indoors.
12-2
Chapter 12 GPS Feature
Figure 12-1. GPS Location Display
Figure 12-2. GPS Quality Display
Saving with GPS Information
Cell Master measurement traces can be saved with the GPS coordinates of the location
where the measurement was taken. The following procedure saves a display to memory.
Step1. Press the SAVE DISPLAY key to activate the alphanumeric menu for trace
storage.
Step2. Use the soft keys to enter a label for the saved trace.
For example, to save a display with the name “TX1 GPS” press the soft key
group that contains the letter “T” then press the “T” soft key. Press the soft key
group that contains the letter “X” then press the “X” soft key. Press the number
“1” key on the numeric keypad. Use the soft keys and keypad as necessary to
enter the entire name, then press ENTER to complete the process.
NOTES: More than one trace can be saved using the same alphanumeric
name, as traces are stored chronologically, using the time/date stamp.
Pressing the SAVE DISPLAY key will bring up the last saved trace name on
the input line. Pressing the Delete soft key will erase the entire trace name. To
erase only one character of a trace name, press the Up/Down arrow key to se-
lect the character, then press the Delete soft key. This feature can be useful
when naming traces sequentially, such as: Trace 1, Trace 2, etc.
The measurement traces will be saved with the GPS coordinates when GPS is active. GPS
data is also automatically saved in the instrument memory until the unit is turned off, so
measurement traces can be saved with the saved GPS coordinates even when the GPS is in-
active. The GPS icon on the display will stay green to indicate that the GPS data is saved.
Recalling GPS Information
The following procedure recalls a previously saved display from memory.
Step1. Press the RECALL DISPLAY key.
Step2. Select the desired display using the Up/Down arrow key.
Step3. Press ENTER to recall the display.
To view the GPS information associated with the recalled display:
Step1. Press the SYS key.
Step2. Select the GPS soft key. The GPS coordinates will be displayed at the bottom of
the trace.
Step3. Press the ESCAPE key to return to normal sweeping.
Chapter 12 GPS Feature
12-3

12-4
Chapter 12 GPS Feature
Figure 12-3. Saved GPS Location Information

Chapter 13
CDMA Measurement Mode
Introduction
This chapter presents information and procedures to make cdmaOne and CDMA2000
1xRTT measurements. Option 33, cdmaOne and CDMA2000 1xRTT (OTA), requires Op-
tions 31 and 43.
CDMA Measurements
The Cell Master can measure CDMA performance over the air with an antenna, or by con-
necting the base station directly to the Cell Master.
To measure a CDMA signal over the air, connect the appropriate frequency band antenna to
the Cell Master RF Input and an Anritsu GPS antenna to the Cell Master GPS connector.
To connect the base station to the Cell Master, connect the power amplifier of the base sta-
tion to the RF In port of the Cell Master using a coupler or attenuator.
CAUTION: The maximum input power without damage is +43 dBm on the RF
In port, and +23 dBm on the RF Out port. To prevent damage, always use a
coupler or high power attenuator.
External Reference Frequency
In order to get good frequency accuracy measurements, it is important to use an external
reference frequency attached to the Cell Master Ext Ref Freq input. Most base stations have
a reference frequency available on a BNC connector. The Cell Master is able to lock to dif-
ferent frequencies. To configure the Cell Master to use an external reference frequency:
Step 1. On the Cell Master, press the MODE key, use the Up/Down arrow key to select
the CDMA mode and press ENTER.
Step 2. Press the SYS key followed by the Application Options soft key.
Step 3. Select the External Ref Freq soft key and use the keypad or Up/Down arrow
keys to enter the frequency. Press ENTER to select.
As the Cell Master locks to the source, the message Ext Ref Unlocked may briefly flash on
the display. If this message stays on, check that the Cell Master is set to the correct external
frequency. If the message External reference unavailable. Using internal reference. displays,
then there is no reference frequency present on the Ext Ref Freq input.
NOTE: Frequency error measurements are only as accurate as the reference
frequency. Frequency error measurements without an external reference fre-
quency are not as accurate.
13-1

Setting the Frequency
Press the FREQ/DIST key to set and change frequencies for the CDMA measurements.
The Cell Master must be configured to tune to the frequency being output by the base sta-
tion. The Cell Master contains a table of common signal standards.
NOTE: Refer to the chapter on Handheld Software Tools for information on cre-
ating and storing custom signal standards.
To choose a standard for your application:
Step 1. Press the FREQ/DIST key.
Step 2. Press the Signal Standard soft key and the Select Standard soft key. A table of
currently selected signal standards will be displayed. To view all the signal stan-
dards in the instrument, press the Show All soft key. The currently selected sig-
nal standards will be marked on that list with an asterisk.
Step 3. To select a signal standard, use the soft keys or the Up/Down arrow key to high-
light the standard and press ENTER. The newly selected signal standard will be
marked with an asterisk.
Step 4. To deselect a signal standard, press the Select/Deselect soft key.
Step 5. To view only the selected signal standards, press the Show Selected soft key.
The list will show only the selected standards.
Step 6. Press the Select Channel soft key to choose the appropriate channel for the se-
lected standard. The Cell Master will automatically adjust the span for the
CDMA signal.
Amplitude
Press the AMPLITUDE key to change amplitude configurations.
Select the dBm/Watts soft key to choose to display the measurement results in either dBm
or Watts.
Press the Power Offset soft key and enter a power offset to have the Cell Master automati-
cally adjust for the loss through any external cables, attenuators, and couplers.
NOTE: If the loss is not known, Option 21, Transmission Measurement, or the
Offset Calibration can be used to measure the loss of the system.
The CDP Scale soft key can be used to change the range of the Code Domain Power screen.
The Cell Master will automatically change attenuation, preamplifier and digital gain set-
tings to make the best CDMA measurements.
Measurement and Display
The following is the Setup menu available through the MEAS/DISP key:
PN Search — To determine PN Numbers and timing errors, the Cell Master needs a timing
reference. The timing can come from the base station when the Cell Master is connected to
13-2
Chapter 13 CDMA Measurement

the base station or it can be recovered from GPS when a GPS antenna is connected to the
Cell Master.
� GPS Auto — The Cell Master uses GPS as the timing reference, and automat-
ically detects the strongest pilot. The Anritsu GPS antenna must be connected
to the Cell Master GPS antenna connector. GPS must be turned on under
Sys|GPS|GPS On/Off and the GPS must be locked to the satellites before
GPS Auto can be used.
NOTE: Refer to Chapter 12 for more information on GPS.
� GPS Manual — The Cell Master uses GPS as the timing reference, but it
searches only for the specified PN. The GPS antenna must be connected to
the Cell Master GPS antenna. GPS must be turned on under Sys|GPS|GPS
On/Off and the GPS must be locked to the satellites before GPS Manual can
be used.
� External Auto — The Cell Master uses an external even second time mark as
the timing reference. The time mark is usually available at the base station on
a BNC connector labeled as "ESTM" or "PP2S." The ESTM must be con-
nected to the CDMA Timing Input connector on the Cell Master. The Cell
Master will automatically detect the strongest pilot.
� External Manual — The Cell Master uses an external even second time mark
as the timing reference. This is usually available at the base station on a BNC
connector labeled as "ESTM" or "PP2S". This ESTM must be connected to
the CDMA Timing Input on the Cell Master. The Cell Master will search only
for the specified PN.
� No Trigger — If both GPS and external timing are unavailable, you may
choose No Trigger for the PN search.
Walsh Codes — The user may select 64 or 128 Walsh codes for display. A cdmaOne trans-
mitter displays 64 walsh codes and CDMA2000 1xRTT transmits 128 walsh codes. In 128
Walsh codes mode the Cell Master displays code domain power in bit reversed order. This
is useful with CDMA2000 signals, where a single user may use several codes (supplemen-
tal channels) which appear adjacent in the bit reversed order, but not in the standard order.
In that case, the Cell Master draws them as a single bar with no spaces in between.
PN Increment — The PN Increment determines how close together PNs can be. For in-
stance, if the PN increment is chosen as 4, a measured PN of 9 will be displayed as a PN of
8 with a larger timing error (Tau). PN Increment is useful in over the air testing, where the
propagation delay can shift a PN. Most networks have a PN increment they use to space out
the PNs of their base stations. For conducted measurements, the PN increment is usually set
to 1.
Advanced Settings — Advanced settings include the measurement length and the external
trigger polarity.
� Meas Length — Sets the length of the measurement. Longer measurement
lengths take longer, but are more stable. Shorter measurement lengths may
produce less stable results.
� Ext Trigger Polarity — The CDMA timing input can use the rising edge or the
falling edge of the ESTM as the zero point in time.
Chapter 13 CDMA Measurement
13-3

The following display selections are available through the MEAS/DISP key:
CDP — When CDP is selected, the display shows Code Domain Power as 64 or 128 bit re-
versed Walsh codes in graphical format. Pilot power, Channel Power, Frequency Error,
Rho, and Noise Floor will be displayed and three strong pilots will be displayed in OTA
measurement.
Text Only — Displays Pilot Power, Channel Power, Ec/Io, Rho, Tau, Frequency Error and
Carrier Feed Through in a text format.
Over The Air Meas — Available only with Option 33, OTA can display the six strongest pi-
lots with Tau and Ec/Io or the two strongest multipaths with Ec/Io related to the strongest
pilot. Pilot power, Noise floor, Channel Power, Pilot Dominance, delta Sync, delta Page,
delta Quick Page and Multipath Power will be displayed as a numerical format.
RF Meas — Available only with Option 42, RF measurements displays the selected channel
spectrum and Channel Power, Freq Error, Measured Occupied Bandwidth and Noise Floor
in a numerical format.
Measurements
Code Domain Power
Code Domain Power displays how much of the channel power is in each Walsh code.
Power is normalized to the channel power, so if a code reads –10dB, it means that the
power in that code is 1/10th of the channel power. Colors are applied according to the fol-
lowing table:
Pilot Red
Sync Blue
Page Green
Quick Page Purple
IS95 Traffic Yellow
CDMA2000 Traffic Orange
Noise Grey
Unknown Light Blue
Pilot Power
Pilot power is the total power in the pilot channel. This is normally a constant for a base
station. When the Cell Master is connected to the base station, if the measured power is un-
expected, check that the entered power offset is correct and that the connections are tight.
Unexpected readings may indicate an incorrect power setting at the base station.
For Over The Air (OTA) measurements, the pilot power will vary as the signal path from
the transmitter to receiver varies.
Ch Power RMS
Channel power is the total power broadcast in the 1.25 MHz wide CDMA channel speci-
fied.
13-4
Chapter 13 CDMA Measurement

For Over The Air (OTA) measurements, the channel power will vary as the signal path
from the transmitter to receiver varies.
Freq Error
Frequency error is the difference between the received center frequency and the specified
center frequency. This is only as accurate as the frequency reference used and is typically
only useful with a good external frequency reference.
Rho
Estimated rho is a measure of modulation quality and measures the amount of power cor-
rectly transmitted. An estimated rho of 1.0 indicates a perfect signal. The standard requires
>0.912, and common measurements are >0.94. Due to environmental factors, estimated rho
values are typically poor (<0.9) when measured over the air, and are usually useful only
when connected to a base station.
Noise Floor
The average power in the unused Walsh codes displayed in CDP and OTA measurement
displays.
Tau
The timing offset, or the difference in time between when the PN sequence (or short code)
restarts, and when the PN sequence should restart. A base station needs to be aligned in
time to an absolute reference such as GPS. This cannot be measured if the PN search is set
to No Trigger.
Note that during OTA measurement, Tau increases as the Cell Master gets farther from the
transmitter due to the finite speed of light. If the Cell Master is connected to the base sta-
tion, Tau of 10�s or less is specified, and 5�s is typical. If the timing error becomes too
large, mobiles may have trouble when being handed off to this particular base station.
Ec/Io
The pilot power compared to the total channel power. Displayed in text only and OTA mea-
surement displays.
Carrier FT
Carrier Feedthrough measures the amount of unmodulated signal that is leaking through the
transmitter and is displayed in a text only display.
PN Scan (available only with Option 33)
The strongest six PNs received are displayed. The length of the bar represents the relative
strength in the channel. To the right of the bar is displayed the power of that pilot compared
to the total channel power (Ec/Io). To the left of the bar is displayed the PN number of that
pilot. This graph is not meaningful if the PN search is set to No Trigger.
Multipath (available only with OTA- Option 33)
The length of the bar represents the relative strength in the channel. To the right of the bar
is displayed the power of that signal compared to the total channel power. To the left of the
bar is displayed the timing error (Tau).
Pilot Dominance (available only with OTA - Option 33)
The strength of the strongest pilot compared to the next strongest pilot in the same channel.
This should be >10 dB to make good measurements.
Chapter 13 CDMA Measurement
13-5

Multipath Power (available only with OTA - Option 33)
The amount of power in the dominant signal which is being spread in time due to multipath
echoes. This should be <0.4 dB to make good measurements.
�Sync (available only with OTA - Option 33)
Sync Walsh code power relative to the pilot power.
�Page (available only with OTA - Option 33)
Page Walsh code power relative to the pilot power.
�QPage (available only with OTA - Option 33)
Quick Page Walsh code 80 power relative to the pilot power.
CDMA RF Measurements
To make CDMA RF measurements, connect the Cell Master to the base station following
the setup instructions.
Step 1. On the Cell Master, press the MODE key, use the Up/Down arrow key to select
the CDMA mode and press ENTER.
Step 2. Select the Signal Standard soft key and press the Select Standard soft key. Use
the soft keys or the Up/Down arrow key to highlight the appropriate standard,
such as CDMA US PCS, and press ENTER.
Step 3. Press the Select Channel soft key and use the Up/Down arrow key or the nu-
meric keypad to enter the appropriate channel, such as 50, and press ENTER.
Step 4. Press the MEAS/DISP key and select the RF Meas soft key to display the RF
Measurements screen.
13-6
Chapter 13 CDMA Measurement
Figure 13-1. CDMA RF Measurements Screen
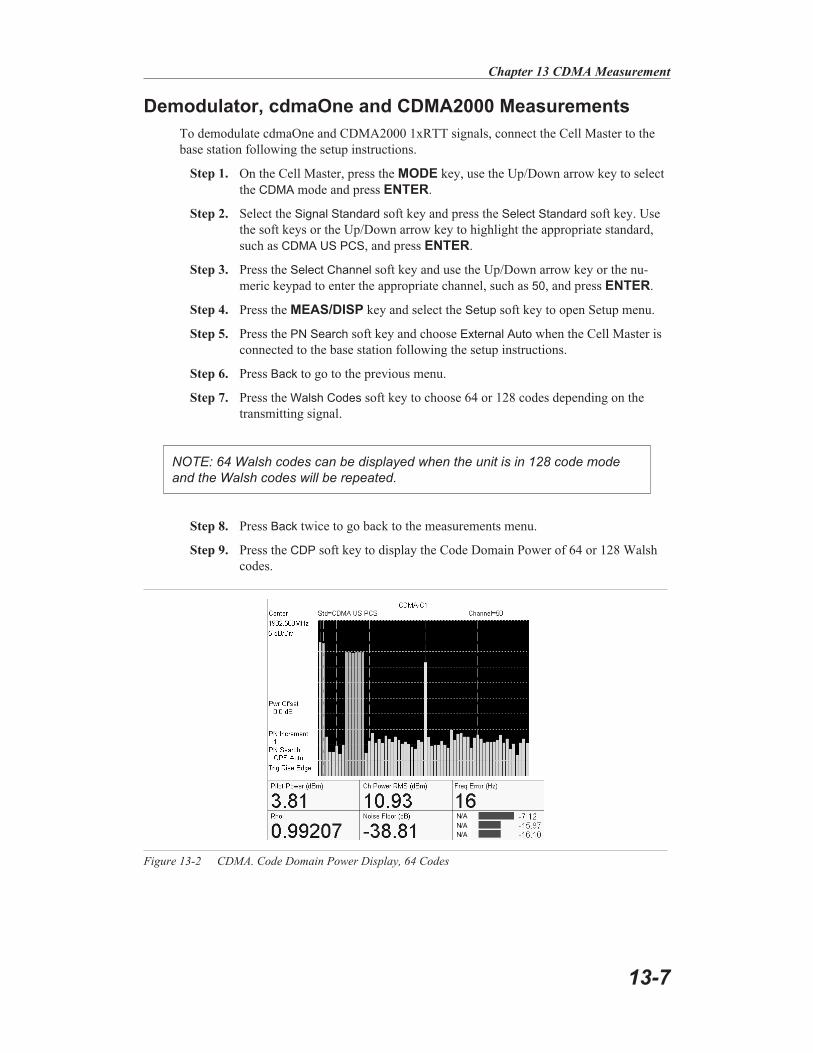
Demodulator, cdmaOne and CDMA2000 Measurements
To demodulate cdmaOne and CDMA2000 1xRTT signals, connect the Cell Master to the
base station following the setup instructions.
Step 1. On the Cell Master, press the MODE key, use the Up/Down arrow key to select
the CDMA mode and press ENTER.
Step 2. Select the Signal Standard soft key and press the Select Standard soft key. Use
the soft keys or the Up/Down arrow key to highlight the appropriate standard,
such as CDMA US PCS, and press ENTER.
Step 3. Press the Select Channel soft key and use the Up/Down arrow key or the nu-
meric keypad to enter the appropriate channel, such as 50, and press ENTER.
Step 4. Press the MEAS/DISP key and select the Setup soft key to open Setup menu.
Step 5. Press the PN Search soft key and choose External Auto when the Cell Master is
connected to the base station following the setup instructions.
Step 6. Press Back to go to the previous menu.
Step 7. Press the Walsh Codes soft key to choose 64 or 128 codes depending on the
transmitting signal.
NOTE: 64 Walsh codes can be displayed when the unit is in 128 code mode
and the Walsh codes will be repeated.
Step 8. Press Back twice to go back to the measurements menu.
Step 9. Press the CDP soft key to display the Code Domain Power of 64 or 128 Walsh
codes.
Chapter 13 CDMA Measurement
13-7
Figure 13-2 CDMA. Code Domain Power Display, 64 Codes

Step 10. Press the Text Only soft key to display the text screen.
NOTE: Markers can be used to read the individual code power and type of code
like traffic, pilot, paging or sync (see Figure 13-5).
13-8
Chapter 13 CDMA Measurement
Figure 13-3. CDMA Code Domain Power Display,124 bit Reversed Codes
Figure 13-4. CDMA Text Only Display

Chapter 13 CDMA Measurement
13-9
Figure 13-5. CDMA Display with Markers
Over The Air Measurements
To make Over The Air measurements:
Step 1. On the Cell Master, press the MODE key, use the Up/Down arrow key to select
the CDMA mode and press ENTER.
Step 2. Select the Signal Standard soft key and press the Select Standard soft key. Use
the soft keys or the Up/Down arrow key to highlight the appropriate standard,
such as CDMA US PCS, and press ENTER.
Step 3. Press the Select Channel soft key and use the Up/Down arrow key or the nu-
meric keypad to enter the appropriate channel, such as 50, and press ENTER.
Setting up GPS
To set up the GPS feature:
Step 1. Connect an Anritsu GPS antenna to the Cell Master GPS Antenna connector.
Step 2. Press the SYS key to open the system menu.
Step 3. Press the GPS soft key to open the GPS menu.
Step 4. Press the GPS On/Off soft key to activate the GPS feature.
Step 5. Press the Quality soft key to display the number of tracked satellites. When at
least three satellites are being tracked, the GPS icon will change.
NOTE: Press the Reset soft key when activating the GPS for the first time.
Step 6. Press the MEAS/DISP key to open the CDMA measurements and setup menu.
Step 7. Press the Setup soft key, select PN Search and press the GPS Auto soft key.
NOTE: If the GPS satellites are not being tracked, then GPS cannot be acti-
vated in CDMA mode.
Step 8. Press Back to return to the previous menu.
Step 9. Press the Walsh Codes soft key and choose 64 or 128 codes.
NOTE: Signals encoded with Walsh 64 will be displayed as a double bar when
the unit is in 128 code mode.
Step 10. Press the Pilot Scan soft key for a multiple pilots screen.
Step 11. Press the Multipath soft key for multipath information.
Step 12. Press Back to return to the measurement menu.
13-10
Chapter 13 CDMA Measurement

Step 13. Press the Over The Air Meas. soft key to display the OTA readings.
Chapter 13 CDMA Measurement
13-11
Figure 13-6. CDMA OTA Display
Figure 13-7. CDMA Multipath Display

Step 14. Press the CDP soft key to display the Code Domain Power of the demodulated
CDMA signal.
13-12
Chapter 13 CDMA Measurement
Figure 13-8. CDMA Code Domain Power Display.

Chapter 14
GSM Measurement Mode
Introduction
This chapter presents GSM information and procedures.
Configuration
To begin GSM measurements:
Step1. Press the MODE key.
Step2. Use the Up/Down arrow keys to highlight GSM and press ENTER to select.
Step3. Connect the base station to the Cell Master by connecting the power amplifier of
the base station to the RF In port of the Cell Master using a coupler or attenu-
ator.
CAUTION: The maximum power without damage is +43 dBm on the RF In
port, and +23 dBm on the RF Out port. To prevent damage, use a coupler or
high power attenuator.
The following keys are available in GSM mode:
FREQ/DIST Press the FREQ/DIST key to set and change frequencies for the GSM measure-
ments. The Cell Master must be configured to tune to the frequency of the base
station.
� Center – Enter the center frequency of the channel. The Cell Master will au-
tomatically adjust the span for GSM signal.
� Signal Standard – Select the signal standard and channel (Chapter 3, page
3-14).
NOTE: Refer to the chapter on Handheld Software Tools for information on cre-
ating and storing custom signal standards.
� External Ref Freq – Most base stations have a frequency reference available
on a BNC connector. Connect the Cell Master to the base station and enter
the external reference frequency. For accurate frequency measurements, it is
important to use an external frequency reference attached to the Cell Master
Ext Freq Ref input.
As the Cell Master locks to the source, Ext Ref Unlocked may briefly flash on
the display. If this message stays on, check that the Cell Master is set to the
correct external frequency. If the message External reference unavailable.
Using internal reference displays, then there is no frequency reference on the
Ext Freq Ref input.
14-1

NOTE: Frequency error measurements are only as accurate as the reference
frequency. Frequency error measurements without an external reference fre-
quency are not accurate.
AMPLITUDE Press the AMPLITUDE key to change amplitude configurations.
� dBm/Watts – Choose to display the measurement results in either dBm or
Watts.
� Power Offset – Choose Power Offset to have the Cell Master automatically
adjust for the loss through any external cables, attenuators, and couplers.
NOTE: If the loss is not known, Option 21, Transmission Measurement, or the
Offset Calibration can be used to measure the loss of the system.
By default, the Cell Master will automatically change attenuation, preamplifier and digital
gain settings to make the best GSM measurements.
MEAS/DISP Press the MEAS/DISP key to change measurement and display settings.
� Spectrum – Display the GSM spectrum
14-2
Chapter 14 GSM Measurement
Figure 14-1. GSM Spectrum Display

� Power vs. Time (Frame) – Display the frame.
� Power vs. Time (Slot) – Display the slot.
Chapter 14 GSM Measurement
14-3
Figure 14-2. GMS Power vs. Time Frame with Eight Slots
Figure 14-3. GSM Power vs. Time with One Slot

Measurement Results
Channel
Power
Channel power measures the output power of the transmitter in the frequency
specified. Out of specification power indicates system faults. Channel power is
expressed in dBm. To change the units to Watts, press the AMPLITUDE key
and the dBm/Watts soft key.
Freq Error The difference between the received frequency and the specified frequency is
the frequency error. This number is only as accurate as the frequency reference
used, and is typically only useful with a good external frequency reference. Fre-
quency error is displayed in both Hz and ppm.
Meas Occ BW The occupied bandwidth is calculated as the bandwidth containing 99% of the
transmitted power.
Burst Power Burst power is the average power of one GSM slot. A GSM signal has eight
time slots in a frame.
TSC The Cell Master displays which Training Sequence Code the base station is us-
ing. GSM base stations may use Training Sequence Codes 0-7.
14-4
Chapter 14 GSM Measurement

Chapter 15
Interference Analyzer Mode
Introduction
This chapter presents Interference Analyzer (Option 25) information and procedures.
Interference Analysis
Multiple wireless networks often operate in complicated signal environments. Three or four
base station antennas may be located on the same tower, and can create interference prob-
lems. Interference is one of the most common problems affecting wireless network systems
capacity and coverage. The Cell Master captures and analyzes a received signal and dis-
plays the air interface standard and estimated bandwidth of the received signal, which is
critical in recognizing and analyzing the interfering signals.
The Interference Analyzer option adds four measurements to the capability of the
MT8212B:
� Spectrogram
� Signal Strength
� RSSI
� Signal ID
Spectrogram
Spectrogram is a three dimensional representation of frequency, time and power useful for
identifying intermittent interference.
Procedure
The following procedure demonstrates common Interference Analyzer Spectrogram setup
options. To select Interference Analyzer mode:
Step1. On the Cell Master, press the MODE key, use the Up/Down arrow key to select
the Interference Analyzer mode and press ENTER.
Step2. Press the MEAS/DISP key followed by the Spectrogram soft key.
Step3. Press the FREQ/DIST key to set up the desired frequency sweep. Choose the
appropriate soft keys and enter the start and stop frequency, the center frequency
and the span, or select the Signal Standard soft key and select the channel and
Uplink or Downlink.
Step4. To get the most effective spectrogram display, press the AMPLITUDE key, se-
lect the Ref Level soft key and set the reference level such that the largest signal
to be displayed will be near the top of the spectrum analyzer area of the screen.
The reference value required can be determined by observing the color of the
highest signal and changing the reference level to place that value near the top of
the spectrum analyzer area.
Step5. Select the Scale soft key and set the scale value to place the lowest signal near
the bottom of the screen. In general, 4 or 5 dB/division will be good values.
15-1

Step6. Press the MEAS/DISP key followed by the Spectrogram soft key to set the
spectrogram sweep parameters. There are two ways to set up spectrogram time
parameters: set the time between sweeps or set the total time for a full spectro-
gram display.
Step7. To change the time between sweeps, press the Sweep Interval soft key and use
the keypad to set the time from 0 seconds to 660 seconds. Entering the time in-
terval value causes the corresponding time span value to be automatically com-
puted. The time span can be viewed or changed by selecting the Time Span soft
key and using the keypad to set the span. As expected, changing the time span
will automatically change the sweep interval. If the sweep interval is > 0, then a
max hold detection is in place so that no signals will be missed.
Step8. To set the total time span for a complete display, press the Time Span soft key
and use the keypad to enter a time between 0 and 4320 minutes (72 hours.) En-
tering a time span value causes the corresponding sweep interval value to be au-
tomatically computed and shown when the Sweep Interval soft key is pressed.
Step9. Spectrogram plots may be automatically saved when the waterfall display is full
by pressing the Auto Save soft key, which toggles between OFF and ON as
shown at the bottom of the screen. The sweeping will stop in Auto Save mode
after five waterfall spectrogram traces have been captured. All five captures of
80 traces (400 sweeps) can be downloaded with HHST. If the sweep is restarted,
these five captures will be overwritten by new data and the original data will be
lost if not extracted from the unit with HHST.
Step10. There are two cursors that can be used to investigate the frequency and time of
any spot in the spectrogram display. Before using the cursors, press the
RUN/HOLD key to suspend the acquisition of new data to avoid having the
point of interest scroll off the top of the screen. Press the Cursor soft key to turn
on the time cursor and frequency cursor.
Step11. Press the Time Cursor soft key to turn on the horizontal time cursor. Use the
Up/Down arrow key to move the cursor vertically through the spectrogram. The
date and time that the measurement at the cursor position was taken is displayed
in the message area below the graph.
Step12. Press the Freq Cursor soft key to turn on the vertical frequency cursor. Use the
Up/Down arrow key to move the cursor through the spectrogram. The frequency
and corresponding amplitude level of the measurement at the cursor position is
displayed in the message area below the graph.
15-2
Chapter 15 Interference Analysis
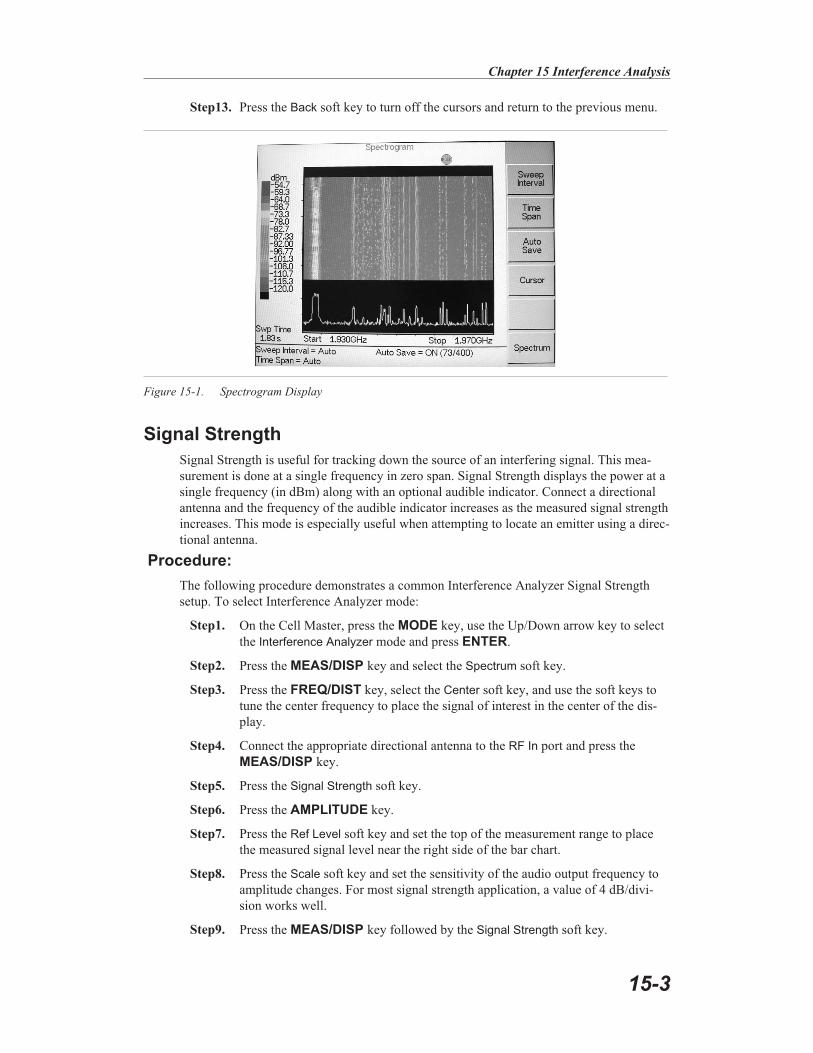
Step13. Press the Back soft key to turn off the cursors and return to the previous menu.
Signal Strength
Signal Strength is useful for tracking down the source of an interfering signal. This mea-
surement is done at a single frequency in zero span. Signal Strength displays the power at a
single frequency (in dBm) along with an optional audible indicator. Connect a directional
antenna and the frequency of the audible indicator increases as the measured signal strength
increases. This mode is especially useful when attempting to locate an emitter using a direc-
tional antenna.
Procedure:
The following procedure demonstrates a common Interference Analyzer Signal Strength
setup. To select Interference Analyzer mode:
Step1. On the Cell Master, press the MODE key, use the Up/Down arrow key to select
the Interference Analyzer mode and press ENTER.
Step2. Press the MEAS/DISP key and select the Spectrum soft key.
Step3. Press the FREQ/DIST key, select the Center soft key, and use the soft keys to
tune the center frequency to place the signal of interest in the center of the dis-
play.
Step4. Connect the appropriate directional antenna to the RF In port and press the
MEAS/DISP key.
Step5. Press the Signal Strength soft key.
Step6. Press the AMPLITUDE key.
Step7. Press the Ref Level soft key and set the top of the measurement range to place
the measured signal level near the right side of the bar chart.
Step8. Press the Scale soft key and set the sensitivity of the audio output frequency to
amplitude changes. For most signal strength application, a value of 4 dB/divi-
sion works well.
Step9. Press the MEAS/DISP key followed by the Signal Strength soft key.
Chapter 15 Interference Analysis
15-3
Figure 15-1. Spectrogram Display

Step10. Press the Speaker Tone On/Off soft key to turn on the audio output.
Step11. If necessary, press the Volume soft key to set the speaker or headphone volume
to a comfortable level. Use the Up/Down arrow keys to adjust the volume.
RSSI
RSSI is useful to observe signal strength at a single frequency over time.
Procedure:
The following procedure demonstrates a common Interference Analyzer RSSI setup. To se-
lect Interference Analyzer mode:
Step1. On the Cell Master, press the MODE key, use the Up/Down arrow key to select
the Interference Analyzer mode and press ENTER.
Step2. Press the MEAS/DISP key and select the Spectrum soft key.
Step3. Press the FREQ/DIST key, select the Center soft key, and use the soft keys to
tune the center frequency to place the signal of interest in the center of the dis-
play.
Step4. Press the MEAS/DISP key and select the RSSI soft key.
Step5. Press the Time Interval soft key to set the time between adjacent measurement
points. This time may be set from 150 ms to 1 minute.
Step6. Press the Time Span soft key to set the overall time span for the RSSI measure-
ment. This time can be set from zero, to give manual control of the time span, to
a maximum of seven days. After the specified time span, measurement is halted.
Depending on the time interval selected, the data will scroll to the left once the
trace fills the screen.
Step7. Press the AMPLITUDE key to set the reference level and scale factor to place
the trace on the screen. Alternatively, the data may be scaled to place it all on
screen by pressing the MEAS/DISP key, the RSSI soft key then the Auto Scale
Data soft key.
Step8. To store the RSSI data, press the Log Data On/Off soft key to turn on data log-
ging. The data is named Log - followed by the time at which the data was stored.
15-4
Chapter 15 Interference Analysis
Figure 15-2. Signal Strength Displ.ay

Each screen full of 401 data points will be stored as a separate display, and can
be saved for up to seven days.
Signal ID
Signal Identification is used to determine, if possible, the air interface standard of a signal.
If the instrument is unable to determine the modulation format, it will display the estimated
bandwidth of the signal.
Procedure:
The following procedure demonstrates a common Interference Analyzer Signal ID setup.
To select Interference Analyzer mode:
Step1. On the Cell Master, press the MODE key, use the Up/Down arrow key to select
the Interference Analyzer mode and press ENTER.
Step2. Press the MEAS/DISP key and select the Signal ID soft key.
Step3. Press the Set IA Freq soft key, enter the appropriate frequency to analyze the in-
terfering signal, and press ENTER. Alternatively, if marker M1 is on, press the
IA Frequency as Marker M1 soft key to set the IA frequency to the current M1
frequency.
Step4. Press the Measure soft key to start the measurement. A message box on the
screen states that the analysis is in process, then, when the measurement is com-
Chapter 15 Interference Analysis
15-5
Figure 15-3. RSSI Display

plete, displays the cell standard and estimated bandwidth of the interfering sig-
nal.
NOTE: Use IA Freq To Center to center the frequency on the display.
15-6
Chapter 15 Interference Analysis
Figure 15-4. Signal ID Display

Chapter 16
Channel Scanner Mode
Introduction
This chapter presents Channel Scanner (Option 27) information and procedures.
Channel Scanner
The Channel Scanner option measures the output power of multiple transmitted signals.
The output power can be displayed as a bar graph or a text display showing the amplitude
of selected channels for a given air interface standard. Up to 20 channels can be measured.
The operating frequency range for Channel Scanner mode can either be set manually, or the
desired air interface standard can be selected from the Signal Standard list in the instru-
ment. When the frequency range is selected from the Signal Standard list, all frequency re-
lated parameters are automatically set to the appropriate values for the selected standard.
The Channel Scanner option provides the choice of a bar graph or a text display showing
the amplitude of selected channels for a given air interface standard. The interface settings
can be manually entered if none of the available air interface standards meet the measure-
ment need.
Procedure
The following procedure demonstrates a common channel scanner setup. To select Channel
Scanner mode:
Step1. Press the MODE key and use the up and down arrows to highlight Channel
Scanner and press ENTER.
Step2. Press the Signal Standard soft key, the Select Standard soft key, and use the
Up/Down arrow key to highlight the CDMA US PCS standard. Press the
ENTER key to select.
Step3. Press the Start Channel soft key, use the keypad to enter 50 and press the
ENTER key.
16-1

Step1. Press the MEAS/DISP key and select the Number of Channels soft key. Use the
keypad to enter 20 and press the ENTER key. The channels will be displayed as
bar graphs.
Step2. Press the Display/Graph Text soft key and the data will be displayed in text for-
mat.
NOTE: The measurement can be made when the base station is either in ser-
vice, out of service, or over the air.
16-2
Chapter 16 Channel Scanner
Figure 16-1. Example of Channels Displayed as Bar Graphs
Figure 16-2. Example of Channels Displayed in Text Format

Step1. To set up the channel step size, press the FREQ/DIST key and select the Chan-
nel Step Size soft key. Use the keypad to enter 5 and press the ENTER key.
Step2. Press the MEAS/DISP key and select the Display/Graph Text soft key and the
data will be displayed in text format.
NOTE: Follow the same procedure for frequency step size as used for channel
step size.
Chapter 16 Channel Scanner
16-3
Figure 16-3. Example of Channels Displayed as Bar Graphs with Channel Step Size = 5
Figure 16-4. Example of Channels Displayed in Text Format with Channel Step Size = 5

Chapter 17
Signal Generator Mode
Introduction
This chapter presents information and procedures to make measurements using the optional
CW signal generator mode (Option 28). The CW Signal Generator provides a CW signal
from the RF Out port of the instrument. The CW signal is primarily used for sensitivity test-
ing of receivers. To test receiver sensitivity, connect the signal directly to the receiver being
measured, and then reduce the output amplitude until the receiver drops the signal. The ex-
ternal splitter feeds the signal into the RF input of the instrument. The display shows the
output power and frequency.
Required Equipment
� Cell Master MT8212B with Option 28
� Attenuator
� Splitter
Procedure
Step 1. On the Cell Master, press the MODE key, use the Up/Down arrow key to select
the CW Signal Generator mode and press ENTER.
Step 2. Press the Freq soft key, use the Up/Down arrow key to change the desired fre-
quency, or use the keypad to enter the desired frequency and select the MHz soft
key.
Step 3. Connect the attenuator to the RF Out port and the splitter to the RF IN port.
17-1
ATTENUATORSPLITTER
TO RECEIVER
Figure 17-1. CW Signal Generator Mode Setup
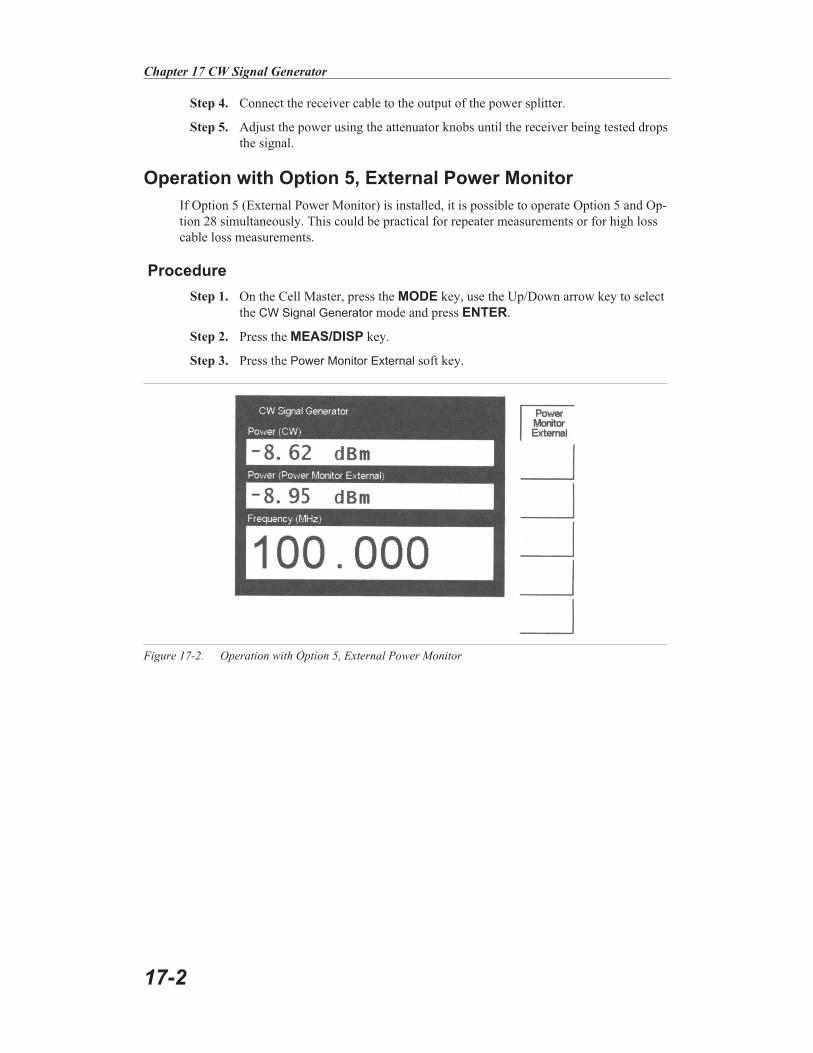
Step 4. Connect the receiver cable to the output of the power splitter.
Step 5. Adjust the power using the attenuator knobs until the receiver being tested drops
the signal.
Operation with Option 5, External Power Monitor
If Option 5 (External Power Monitor) is installed, it is possible to operate Option 5 and Op-
tion 28 simultaneously. This could be practical for repeater measurements or for high loss
cable loss measurements.
Procedure
Step 1. On the Cell Master, press the MODE key, use the Up/Down arrow key to select
the CW Signal Generator mode and press ENTER.
Step 2. Press the MEAS/DISP key.
Step 3. Press the Power Monitor External soft key.
17-2
Chapter 17 CW Signal Generator
Figure 17-2. Operation with Option 5, External Power Monitor

Softkeys
The following soft keys are available in CW Signal Generator mode:
� Freq — Enter a CW frequency from 25 MHz to 3000 MHz using the
Up/Down arrow key, or the keypad and the appropriate soft key for Hz, kHz,
MHz or GHz. Press ENTER to accept the input.
� Display Setup Help — Selecting this soft key displays a diagram of the rec-
ommended setup to use this option.
Negative Offset
The negative offset in CW Signal Generator Mode allows the connection of an attenuator
after the divider to obtain the level after the attenuator. For instance, if the pad before the
divider is set to 70 dB, and the instrument reads about -73 dBm, and a 40 dB pad is placed
between the divider and the DUT, the instrument would still read -73 dB even though the
level to the DUT is -113 dB. Setting the offset to -40 dB will set the instrument to -113
dBm, the same as the level the DUT is seeing.
Chapter 17 CW Signal Generator
17-3

Chapter 18
EVDO Mode
Introduction
This chapter presents information and procedures to make CDMA2000 EVDO measure-
ments. Option 34, EVDO Over The Air (OTA) requires Option 31 (GPS) and Option 63
(EVDO Demodulator).
CDMA EVDO has a chip rate of 1.2288MHz, the same as cdmaOne and CDMA2000
1xRTT. Each chip lasts for a duration of 0.8138 microseconds. In downlink, an EVDO sig-
nal can be time-divided into "half slots." Each half slot has 1024 chips.
The 1024 chips in a half slot can be further time-divided into three different channels: Pilot,
MAC and Data. The Pilot Channel provides synchronization for the EVDO Access Termi-
nals (for example, cell phones, laptops, etc.). The MAC (Medium Access Control) Channel
controls the overall EVDO traffic. The Data Channel transmits data to various users.
The Pilot and MAC Channels are always active in an EVDO signal, but the Data Channel
may sometimes transmit no data. When no data is transmitted, the half slot is considered
idle. Otherwise, it is called an active slot.
Cell Master Setup
The Cell Master can measure EVDO performance over the air with an antenna, or by con-
necting the base station directly to the Cell Master.
To measure an EVDO signal over the air, connect the appropriate frequency band antenna
to the Cell Master RF In connector, and an Anritsu GPS antenna to the Cell Master GPS
connector.
To connect the base station to the Cell Master, connect the power amplifier of the base sta-
tion to the RF In connector of the Cell Master using a coupler or attenuator.
CAUTION: The maximum input power without damage is +43 dBm on the RF
In port, and +23 dBm on the RF Out port. To prevent damage, always use a
coupler or high power attenuator.
External Reference Frequency
In order to get good frequency accuracy measurements, it is important to use an external
reference frequency attached to the Cell Master Ext Ref Freq input. Most base stations have
a reference frequency available on a BNC connector. The Cell Master is able to lock to dif-
ferent frequencies. To configure the Cell Master to use an external reference frequency:
Step 1. On the Cell Master, press the MODE key, use the Up/Down arrow key to select
the EVDO mode and press ENTER.
Step 2. Press the FREQ/DIST key.
18-1

Step 3. Select the External Ref Freq soft key and use the keypad or Up/Down arrow
keys to enter the frequency. Press ENTER to select.
As the Cell Master locks to the source, the message Ext Ref Unlocked may briefly flash
on the display. If this message stays on, check that the Cell Master is set to the correct ex-
ternal frequency. If the message External reference unavailable. Using internal ref-
erence. displays, then there is no reference frequency present on the Ext Ref Freq input.
NOTE: Frequency error measurements are only as accurate as the reference
frequency. Frequency error measurements without an external reference fre-
quency are not as accurate, and may carry a large constant offset.
Setting the Frequency
Press the FREQ/DIST key to set and change frequencies for the EVDO measurements. The
Cell Master must be configured to tune to the frequency being output by the base station.
The Cell Master contains a table of common signal standards.
NOTE: Refer to the chapter on Handheld Software Tools for information on cre-
ating and storing custom signal standards.
To choose a standard for your application:
Step 1. Press the FREQ/DIST key.
Step 2. Press the Signal Standard soft key and the Select Standard soft key. A table of
currently selected signal standards will be displayed. To view all the signal stan-
dards in the instrument, press the Show All soft key. The currently selected sig-
nal standards will be marked on that list with an asterisk.
Step 3. To select a signal standard, use the soft keys or the Up/Down arrow key to high-
light the standard and press ENTER. The newly selected signal standard will be
marked with an asterisk.
Step 4. To deselect a signal standard, press the Select/Deselect soft key.
Step 5. To view only the selected signal standards, press the Show Selected soft key.
The list will show only the selected standards.
Step 6. Press the Select Channel soft key to choose the appropriate channel for the se-
lected standard. The Cell Master will automatically adjust the span for the
EVDO signal.
Amplitude
Press the AMPLITUDE key to change amplitude configurations.
Select the dBm/Watts soft key to choose to display the measurement results in either dBm
or Watts.
Press the Power Offset soft key and enter a power offset to have the Cell Master automati-
cally adjust for the loss through any external cables, attenuators, and couplers.
NOTE: If the loss is not known, Option 21, Transmission Measurement, or the
Offset Calibration can be used to measure the loss of the system.
18-2
Chapter 18 EVDO Mode

The CDP Scale soft key can be used to change the range of the Code Domain Power screen.
The Cell Master will automatically change attenuation, preamplifier and digital gain set-
tings to make the best EVDO measurements.
Measurement and Display
The following is the Setup menu available through the MEAS/DISP key:
PN Search — To determine PN Numbers and timing errors, the Cell Master needs a timing
reference. The timing can come from the base station when the Cell Master is connected to
the base station or it can be recovered from GPS when a GPS antenna is connected to the
Cell Master.
� GPS Auto — The Cell Master uses GPS as the timing reference, and automat-
ically detects the strongest pilot. The Anritsu GPS antenna must be connected
to the Cell Master GPS antenna connector. GPS must be turned on under
Sys|GPS|GPS On/Off and the GPS must be locked to the satellites before
GPS Auto can be used.
NOTE: Refer to Chapter 12 for more information on using the GPS feature.
� GPS Manual — The Cell Master uses GPS as the timing reference, but it
searches only for the specified PN. The GPS antenna must be connected to
the Cell Master GPS antenna. GPS must be turned on under Sys|GPS|GPS
On/Off and the GPS must be locked to the satellites before GPS Manual can
be used.
� External Auto — The Cell Master uses an external even second time mark as
the timing reference. The time mark is usually available at the base station on
a BNC connector labeled as "ESTM" or "PP2S." The ESTM must be con-
nected to the CDMA Timing Input connector on the Cell Master. The Cell
Master will automatically detect the strongest pilot.
� External Manual — The Cell Master uses an external even second time mark
as the timing reference. This is usually available at the base station on a BNC
connector labeled as "ESTM" or "PP2S". This ESTM must be connected to
the CDMA Timing Input on the Cell Master. The Cell Master will search only
for the specified PN.
� No Trigger — If both GPS and external timing are unavailable, choose No
Trigger for the PN search.
Data Modulation Type — In EVDO, the modulation can vary depending upon the data rate.
QPSK, 8-PSK and 16-QAM modulation types are supported. Select Auto to demodulate any
type of modulation. To demodulate a specific option, press the appropriate modulation type
soft key.
Advanced Settings — Advanced settings include the measurement speed and the external
trigger polarity.
� Meas Speed — Sets the speed of the measurement to Normal, Fast, or Slow.
� Ext Trigger Polarity — The EVDO timing input can use the rising edge or the
falling edge of the ESTM as the zero point in time.
Chapter 18 EVDO Mode
18-3

� See Mask — Creates a mask for the Power vs. Time graph. The mask will be
green if the sampled signal is within the mask, and red if it is outside the
mask.
� Mask On/Off — Turns the mask funcion on or off.
The following display sections are available through the MEAS/DISP key:
CDP - When CDP is selected, the data can be displayed as a MAC Code power screen or
Data Code Power screen. In a MAC Code Power screen, Pilot & MAC power, Rho Overall
1, Rho Pilot, Data Modulation type and Noise Floor will be displayed, and the three stron-
gest pilots will be displayed in Over The Air (OTA) measurement mode available with Op-
tion 63 only. In a Data Code Power screen, Active Data Power, Rho Overall 1, Data Code
Max, Data Code Min and Data Modulation will be displayed, and the three strongest pilots
will be displayed in Over The Air (OTA) measurement mode available with Option 63
only.
Text Only - When Text Only is selected, the measurement results are dispalyed in a table
format.
Over The Air Measurement - Displays the Over The Air measurements, six strongest pilots,
Tau, Ec/Io, multipath related to the strongest pilot, Pilot Dominance, Pilot&Mac power,
Noise Floor, Rho Overall 1, Rho Pilot and Multipath power. Over The Air measurements
are available with Option 34 only.
RF Measurements - Can display idle/active slot in the time domain and frequency domain,
Pilot&Mac power, Frequency Error, Measured Occupied Bandwidth, Channel Power,
Idle/Active Activity and Idle/Active Data Power. RF Measurements are availabe with Op-
tion 62 only.
Measurements
The following measurement results are displayed on the Text Only screen.
Pilot & MAC Power - The Pilot & MAC power shows the average power of the Pilot and
MAC Channels. It is an absolute number expressed in dBm or Watts.
Data Power - Data Power is the average power of the Data Channel. When the slot is active,
the data power should be very similar to the MAC & Pilot power (less than 2.5 dB differ-
ence). When the slot is idle, the Data Power should be at least 7 dB below the MAC & Pilot
power if connected directly to a base station.
Channel Power - During an active slot, Channel Power should be similar to Pilot & MAC
power and also similar to Data Power. During an idle slot, channel power should be some-
where between the Pilot & MAC power and Data Power, since it is a weighted average of
the two.
Noise Floor - In the text box below the CDP diagram, the MAC CDP noise floor is re-
ported. It is the average power of the inactive MAC channels, relative to the total MAC
channel power, expressed in dB. When connected to a good EVDO source, the noise floor
should be –31.5 dB or below. When noise or distortion is present, for example in an
over-the-air measurement, the noise floor can be considerably higher.
18-4
Chapter 18 EVDO Mode

Chapter 18 EVDO Mode
18-5
The following measurements are displayed on the CDP screens.
Data Code Power - The Data Channel in EVDO consists of 16 "I" sub channels and 16 "Q"
sub channels. Each of these channels should have a power around –15.05 dB, relative to the
total Data Channel power. When connected to a good signal source, the Data Code Min is
usually larger than –15.5 dB and the Data Code Max is usually less than –14.6 dB. The
smaller the difference between the two, the better the signal quality.
MAC Code Power - MAC channels are Walsh despreaded into 64 sub-channels (physical
layer Subtype 0 or 1) or 128 sub-channels (physical layer Subtype 2).
For Subtype 0 and 1 physical layers:
� Channel 0~3 (white bars) are reserved.
� Channel 4 (blue bar) is the RA (Reverse Activity) channel.
� Channel 5~63 (alternate orange and yellow if active, grey if inactive) are channels that
control each individual "Access Terminal" (for example, cell phones, laptops). The
more active channels there are in channels 5~63, the more EVDO users are communi-
cating with the base station.
For Subtype 2 physical layer:
� Channel 0~3, 5, 64~71 and reserved (white bars)
� Channel 4 (blue bar) is an RA channel
� Channel 6~63 and 72~127 are channels that control each individual access terminal
The following additional measurements are displayed on the Over-the-air measurements
screen:
Pilot Scan - The strongest six PNs received are displayed. The length of the bar represents
the absolute power of the signal in dBm. To the left of the bar is displayed the PN number
of the pilot. To the right of the bar Tau and Ec/Io are dispalyed. This graph is not meaning-
ful if the PN search is set to No Trigger.
Multipath - The length of the bar represents the absolute power of the signal path in dBm.
To the left of the bar, the timing error (Tau) is displayed, to the right of the bar, Ec/Io is dis-
played.
Pilot Dominance - The strength of the strongest pilot compared to the next strongest pilot in
the same channel. This should be >9 dB to make good measurements.
Multipath Power (available only with OTA - Option 33)
The amount of power in the dominant signal which is being spread in time due to multipath
echoes. This should be <0.4 dB to make good measurements.
The following measurements are displayed on the RF screens:
Meas Occ BW - The measured occupied bandwidth is calculated as the bandwidth contain-
ing 99% of the transmitted power.
Idle Data Power -The average power of the data channel portion of the idle EVDO slot that
is captured. If no idle slots are captured, then the unit will display N/A.
18-6
Chapter 18 EVDO Mode

Active Data Power - The average power of the data channel portion of the active EVDO
slot that is captured. If no active slots are captured, then the unit will display N/A.
Power vs. Time Graph - In the lower part of the RF screen, a power versus time graph is
shown for an EVDO slot. The horizontal axis is time. The vertical axis is power in dB rela-
tive to the Pilot & MAC power reading (Pilot & MAC power is equated to 0 dB).
In an active slot, the averaged power fluctuation should be within �2.5 dB.
In an idle slot, the Pilot & MAC power should be at least 7dB above the data power.
The Cell Master provides an adjustable mask test function in Power vs. Time graphs. The
mask will be green if the sampled signal is within the mask envelope, and red if it is outside
the mask.
Idle or Active Activity % - This shows the estimated percentage of idle or active slots in the
total number of slots captured. This is calculated using a moving average window. Expect
the idle % to be low and the active % to be high when there are lots of EVDO users con-
nected to a base station.
EVDO RF Measurements
To make EVDO RF measurements, connect the Cell Master to the base station.
Step 1. On the Cell Master, press the MODE key, use the Up/Down arrow key to select
the EVDO mode and press ENTER.
Step 2. Select the Signal Standard soft key and press the Select Standard soft key. Use
the soft keys or the Up/Down arrow key to highlight the appropriate standard,
such as CDMA US PCS, and press ENTER.
Step 3. Press the Select Channel soft key and use the Up/Down arrow key or the nu-
meric keypad to enter the appropriate channel, such as 50, and press ENTER.
Step 4. Press the MEAS/DISP key and select the RF Meas soft key to display the RF
Measurements screen.
Chapter 18 EVDO Mode
18-7

NOTE: To get the best EvDO pilot scan results, adjust the center frequency of
the Cell Master until the frequency error measurement reading is within �100
Hz.
NOTE: When using masking, if the mask lines above and below the signal are
green, the signal is within the mask. If the mask lines are red, the signal is out-
side the lines.
18-8
Chapter 18 EVDO Mode
Figure 18-1. EVDO RF Measurement Screen, Idle
Figure 18-2. EVDO RF Measurement Screen, Active

EVDO Demodulator
To demodulate CDMA2000 EVDO signals, connect the Cell Master to the base station.
Step 1. On the Cell Master, press the MODE key, use the Up/Down arrow key to select
the EVDO mode and press ENTER.
Step 2. Select the Signal Standard soft key and press the Select Standard soft key. Use
the soft keys or the Up/Down arrow key to highlight the appropriate standard,
such as CDMA US PCS, and press ENTER.
Step 3. Press the Select Channel soft key and use the Up/Down arrow key or the nu-
meric keypad to enter the appropriate channel, such as 50, and press ENTER.
Step 4. Press the MEAS/DISP key and select the Setup soft key.
Step 5. Press the PN Search soft key and choose External Auto when the Cell Master is
connected to the base station.
NOTE: With GPS OTA measurements, select the GPS Auto soft key after the
GPS is synchronized.
Step 6. Press Back to return to the previous menu.
Step 7. Press the Data Modulation Type soft key and select Auto or, to select a particular
modulation type, select the appropriate soft key.
Step 8. Press Back twice to return to the measurements menu.
Step 9. Press the CDP soft key and select the MAC Code Power or Data Code Power
soft key to display the MAC Code Power or Data Code Power screens.
Chapter 18 EVDO Mode
18-9
Figure 18-3. MAC Code Power Screen

NOTE: Cell Master also supports 1xEVDO, Physical Layer subtype 2. When us-
ing subtype 2, select 64 codes (default) unless otherwise instructed.
18-10
Chapter 18 EVDO Mode
Figure 18-4. RF Measurement Screen with Markers
Figure 18-5. Data Code Power Screen

EVDO Over The Air Measurements
To make EVDO over the air measurements:
Step 1. On the Cell Master, press the MODE key, use the Up/Down arrow key to select
the EVDO mode and press ENTER.
Step 2. Select the Signal Standard soft key and press the Select Standard soft key. Use
the soft keys or the Up/Down arrow key to highlight the appropriate standard,
such as CDMA US PCS, and press ENTER.
Step 3. Press the Select Channel soft key and use the Up/Down arrow key or the nu-
meric keypad to enter the appropriate channel, such as 50, and press ENTER.
Activating the GPS Feature
To activate the GPS feature:
Step 1. Install the Anritsu GPS antenna to the GPS antenna connection on the Cell Mas-
ter connector panel.
NOTE: The GPS antenna connection on the Cell Master is fitted with a reverse
BNC connector to help prevent damage to the GPS circuitry. There is a DC
voltage present on this connector. Do not connect anything other than the
Anritsu GPS antenna to this port.
Step 2. Press the SYS key.
Step 3. Select the GPS soft key.
Step 4. Press the GPS On/Off soft key to turn the GPS feature on or off. When GPS is
first turned on, the GPS icon below will be displayed in red:
Step 5. When the GPS receiver has tracked at least three satellites, the GPS icon will
change to:
Step 6. Press the Location soft key to view the latitude, longitude and altitude informa-
tion and UTC timing.
Step 7. Press the Quality soft key to display the number of tracked satellites and the GPS
quality. When at least three satellites are being tracked, the GPS icon will
change.
NOTE: Press the Reset soft key when activating the GPS for the first time.
Step 8. Press the MEAS/DISP key and select the Setup soft key.
Step 9. Select PN Search and press the GPS Auto soft key.
Chapter 18 EVDO Mode
18-11
GPS
GPS
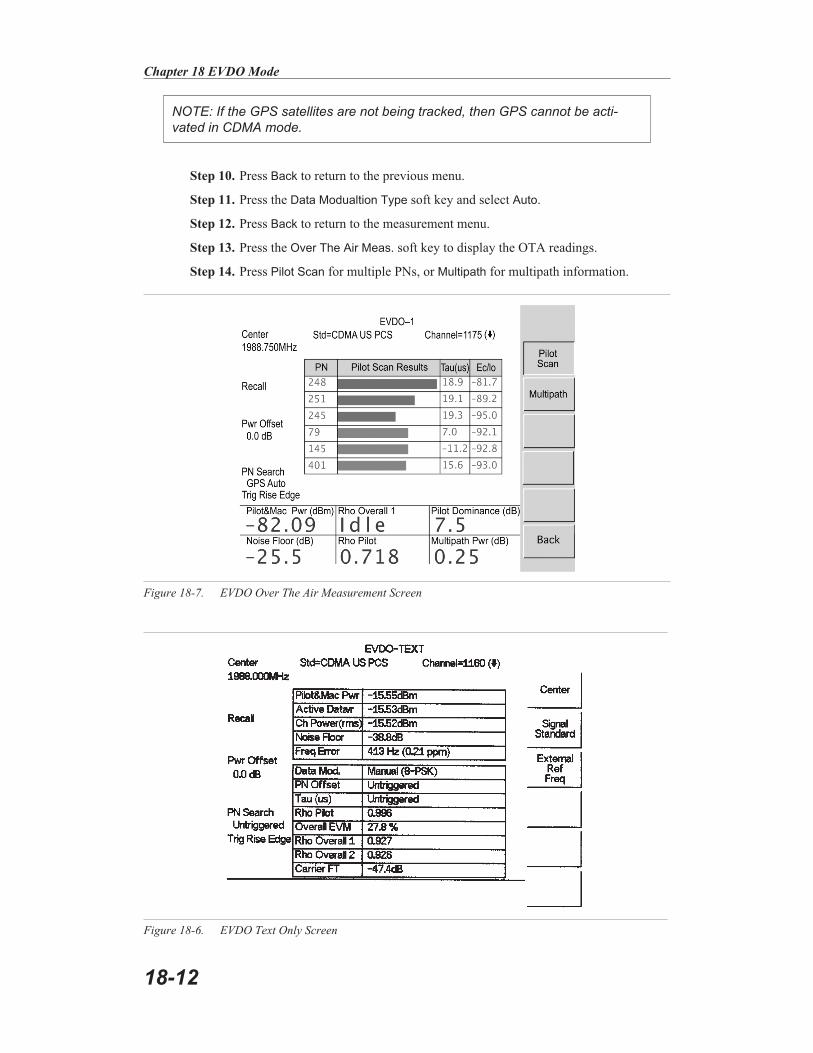
NOTE: If the GPS satellites are not being tracked, then GPS cannot be acti-
vated in CDMA mode.
Step 10. Press Back to return to the previous menu.
Step 11. Press the Data Modualtion Type soft key and select Auto.
Step 12. Press Back to return to the measurement menu.
Step 13. Press the Over The Air Meas. soft key to display the OTA readings.
Step 14. Press Pilot Scan for multiple PNs, or Multipath for multipath information.
18-12
Chapter 18 EVDO Mode
Figure 18-6. EVDO Text Only Screen
Figure 18-7. EVDO Over The Air Measurement Screen
Chapter 19
Handheld Software Tools
Introduction
This chapter provides a description of the Anritsu Handheld Software Tools program.
Handheld Software Tools is a Windows 95/98/NT4/2000/ME/XP program for transferring
measured traces, along with markers and limit lines, to the PC display. The program help
function provides on screen instructions on display modification, trace overlay, uploading
and downloading traces, and multiple plot printing.
Features
Handheld Software Tools provides the following features:
� Download traces saved in the instrument memory to the PC for storage and
analysis
� Upload traces from the PC to the instrument memory
� Trace Overlay allows the viewing of three plots simultaneously
� Ability to save captured plots as data files (.dat file format) or as records repre-
senting site information in a database file
� Ability to export plot data as text files for use in a spreadsheet (.txt file format)
� Ability to save captured plots as graphic files (.wmf file format)
� Ability to zoom in or out to analyze a particular region of the plot
� Ability to modify Plot Properties
� Ability to output plots to a printer for hard copy records
� Capture the current trace on the unit
� Create antenna factor files to be uploaded to the instrument
� Create custom cables to be uploaded to the instrument
� Create new signal standards to be uploaded to the instrument
� Create new waveguides to be uploaded to the instrument
System Requirements
The Handheld Software Tools program will run on most any computer running Windows
95/98/NT4/2000/ME/XP. Minimum requirements and recommendations are:
� Intel Pentium 100 MHz microprocessor (Pentium II 350 MHz or better recom-
mended)
� 16 MB of RAM (64 MB or above recommended)
� Hard disk drive with approximately 15 MB of available space (An additional
20 MB free space for storage of captured plots is recommended.)
� A serial (COM) port or a USB port and USB power adapter cable for communi-
cation with the instrument
19-1
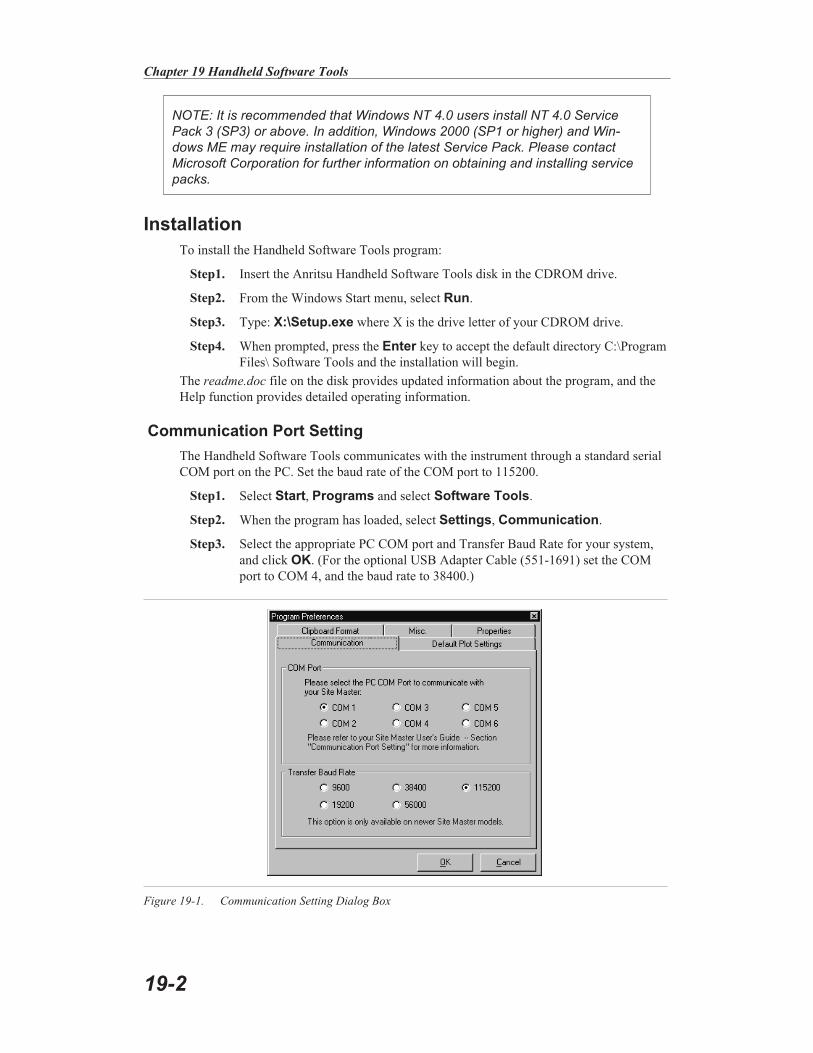
NOTE: It is recommended that Windows NT 4.0 users install NT 4.0 Service
Pack 3 (SP3) or above. In addition, Windows 2000 (SP1 or higher) and Win-
dows ME may require installation of the latest Service Pack. Please contact
Microsoft Corporation for further information on obtaining and installing service
packs.
Installation
To install the Handheld Software Tools program:
Step1. Insert the Anritsu Handheld Software Tools disk in the CDROM drive.
Step2. From the Windows Start menu, select Run.
Step3. Type: X:\Setup.exe where X is the drive letter of your CDROM drive.
Step4. When prompted, press the Enter key to accept the default directory C:\Program
Files\ Software Tools and the installation will begin.
The readme.doc file on the disk provides updated information about the program, and the
Help function provides detailed operating information.
Communication Port Setting
The Handheld Software Tools communicates with the instrument through a standard serial
COM port on the PC. Set the baud rate of the COM port to 115200.
Step1. Select Start, Programs and select Software Tools.
Step2. When the program has loaded, select Settings, Communication.
Step3. Select the appropriate PC COM port and Transfer Baud Rate for your system,
and click OK. (For the optional USB Adapter Cable (551-1691) set the COM
port to COM 4, and the baud rate to 38400.)
19-2
Chapter 19 Handheld Software Tools
Figure 19-1. Communication Setting Dialog Box
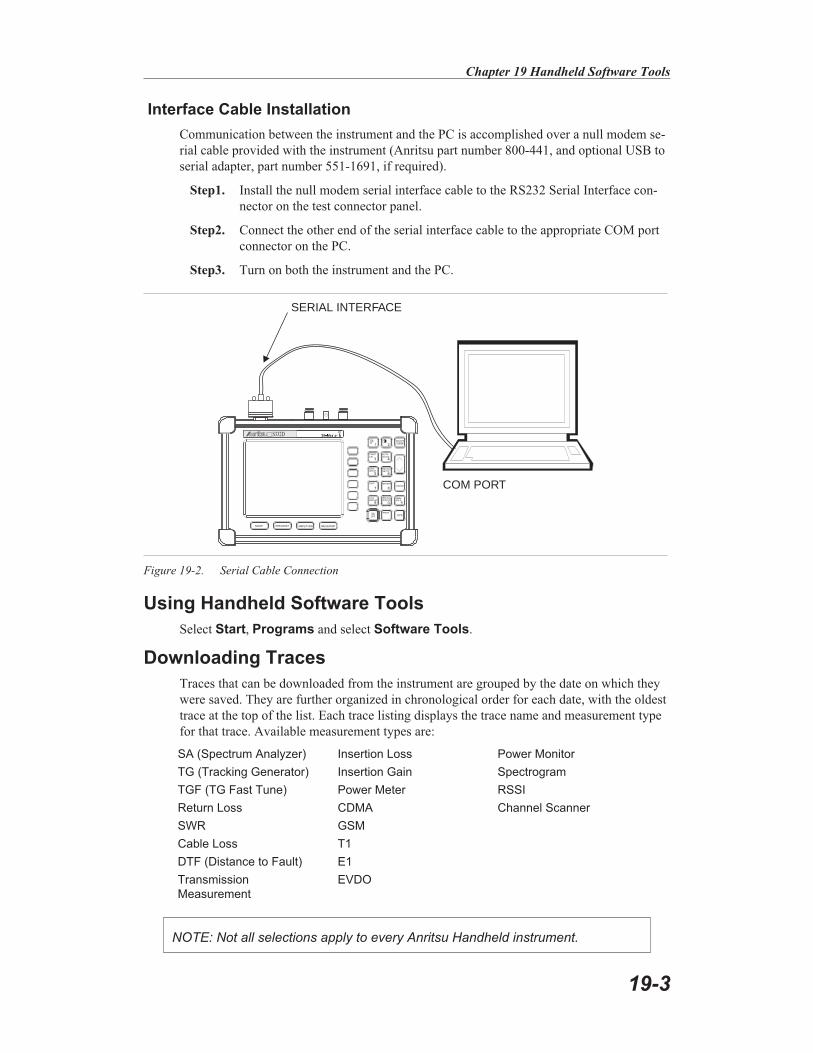
Interface Cable Installation
Communication between the instrument and the PC is accomplished over a null modem se-
rial cable provided with the instrument (Anritsu part number 800-441, and optional USB to
serial adapter, part number 551-1691, if required).
Step1. Install the null modem serial interface cable to the RS232 Serial Interface con-
nector on the test connector panel.
Step2. Connect the other end of the serial interface cable to the appropriate COM port
connector on the PC.
Step3. Turn on both the instrument and the PC.
Using Handheld Software Tools
Select Start, Programs and select Software Tools.
Downloading Traces
Traces that can be downloaded from the instrument are grouped by the date on which they
were saved. They are further organized in chronological order for each date, with the oldest
trace at the top of the list. Each trace listing displays the trace name and measurement type
for that trace. Available measurement types are:
SA (Spectrum Analyzer) Insertion Loss Power Monitor
TG (Tracking Generator) Insertion Gain Spectrogram
TGF (TG Fast Tune) Power Meter RSSI
Return Loss CDMA Channel Scanner
SWR GSM
Cable Loss T1
DTF (Distance to Fault) E1
Transmission
Measurement
EVDO
NOTE: Not all selections apply to every Anritsu Handheld instrument.
Chapter 19 Handheld Software Tools
19-3
HOLDRUN
STARTCAL
AUTOSCALE
SAVESETUP
RECALLSETUP
LIMIT MARKER
SAVEDISPLAY
RECALLDISPLAY
MODE FREQ/DIST AMPLITUDE MEAS/DISP
SYS
ENTER
CLEAR
ESCAPE
ON
OFF
/
1 2
4
5 6
7 8
9 0
3
+-
.
S332D
COM PORT
SERIAL INTERFACE
Figure 19-2. Serial Cable Connection

Plot Capture to the PC
To open the plot capture menus, select the capture icon on the button bar, or select the
Capture drop down menu from the menu bar.
Select Capture to Screen to download traces to the PC.
Select a folder, or individual traces within a folder, to be downloaded to the PC. The traces
will appear on the PC display as they are downloaded.
When Software Tools is communicating with the instrument, REMOTE will be displayed
to the left of the graph.
Plot Upload to the Instrument
Open a plot to be uploaded to the instrument. Plot properties can be modified on the PC be-
fore it is uploaded if desired.
Select the Capture drop down menu from the menu bar.
Select Upload the Current Plot to upload the plot to the instrument. The plot will be
stored in the instrument non-volatile memory with the original date and time that the plot
was saved. The uploaded trace can be viewed on the instrument by pressing the RECALL
DISPLAY button on the instrument keypad.
Plot Properties
After downloading, certain plot properties and information can be modified. Select the Plot
Properties or Plot Information icon.
Plot Properties that can be changed include:
Graph Titles
Display Mode
Scale/Limit
Markers
Misc. (Plot Display Parameters)
Graph Titles
After downloading the plot, the Main Title can be changed to reflect the site name or other
descriptive information. The Sub Title field can be used to describe the specifics of the
measurement and configuration.
Display Mode
Display Mode allows changing the display type without having to retest. Measurements can
be changed to dBm, dBV, dBmV, dB�V, V or W with a single click of mouse button.
Scale/Limit
The scale of the displayed plot can be modified to help analyze whether the plot meets
pass/fail criteria. The Scale/Limit sub menu activates options to manually enter the scale
limits, or to use the Auto Scale mode.
19-4
Chapter 19 Handheld Software Tools

Manual adjustment sets the upper and lower limits of the display under the
Scale/Limit Submenu.
Auto Scale automatically adjusts the scale for maximum and minimum mea-
surement readings.
Limit Line Off turns off all limit lines.
Single Limit Line can be activated to help identify faults.
Multi-Segment Limit Lines can be activated to set different limits within the
same measurement display for specification requirements.
Markers
Markers M1 through M6 can be activated from the Plot Properties menu.
The six active markers can be displayed on the plot to help identify faults from the line
sweep data.
Misc.
The Miscellaneous tab allows adjustment of the Plot/Limit Line Width, the setting of the
Plot Footer, and the date format.
Plot/Limit Line Width can be used when preparing reports for the carrier, ser-
vice providers, and network operators where the trace data must be visible and
legible for documentation. The line density of the trace can be set to Normal
(Thin Line) or Thick Line to make the data appear easily when copies are
made.
Plot Footer allows selection of information to be displayed in the trace display.
Selections are:
� Time/Date � Impedance
� Model and Serial Number � Measurements
� Bias Tee � DTF Parameters
� Date Format:
mm/dd/yyy
dd/mm/yyyy
yyyy/mm/dd
NOTE: While all possible selections are displayed, some of these selections ap-
ply only to specific models of Anritsu hand held instruments.
Trace Overlay or Plot Overlay
Trace Overlay is activated by the Mouse Function icon. Single-click on the Mouse Function
icon to toggle. Toggling this icon switches the mouse function between Marker/Limit/Zoom
and Plot Overlaying.
To overlay two plots, click-and-drag from one plot to the other plot. The final display will
be the two plots superimposed on one another.
Chapter 19 Handheld Software Tools
19-5

Refer to the Handheld Software Tools HELP function for more information on the steps
necessary to perform a trace overlay.
Saving Traces
Once the plots are captured to the PC they can be saved as individual files or as a block of
files to a database.
Saving a Plot as a Windows Metafile or to a Spreadsheet
Plots can be saved as a Windows metafile (.wmf), a Handheld Software Tools .dat file, a
text file (.txt) or an .mdb database. The metafile may be imported into graphic programs
and the text file can be imported into a spreadsheet. The .dat and .mdb files are used exclu-
sively by Handheld Software Tools.
To save a plot as a Windows metafile, click on the File menu and select Export to
Metafile from the pull down menu. Once the trace is saved as a metafile, it can be copied
and transferred into other applications as a picture or graphic file.
To copy a metafile:
Step1. Select the trace to be copied with the mouse cursor.
Step2. Select Edit and then Copy. The file will copied to the clipboard, or select File
and then Export to a Windows metafile.
Step3. Open the target application (Microsoft Word, etc.).
Step4. Select Edit and then Paste. The file will be inserted as a graphic file or a
bitmap.
Saving a Plot to a Spreadsheet
Plots can be saved as a text file (.txt) which can then be imported into a spreadsheet pro-
gram.
To save a plot as a text file:
Step1. Select the trace to be copied with the mouse cursor.
Step2. Click on the File menu and select Export to Text File for a Spreadsheet
from the pull down menu.
Step3. Save the file to a local directory.
Step4. Exit the Handheld Software Tools program and open the spreadsheet applica-
tion.
Step5. Import the .txt file into the spreadsheet program.
19-6
Chapter 19 Handheld Software Tools

Creating a Database
A single trace or a block of traces can be transferred from the instrument to the PC. A sepa-
rate database can be created for each cellular site. The site name can be used as the database
name.
Step1. Select the File menu and select the Database.
Step2. Open an existing database or create a new database with a descriptive filename
that represents the site name.
Once the database has been created, files can be saved and site information can be added,
such as Plot Description, Date/Time, Operator, record/trace number and session description
(transmitter type, etc.)
Individual plots will be labeled with the Database Cell Name. Each record has its own plot
description and measurement type.
Printing Formats
One to multiple plots per page can be set up under the print format in Handheld Software
Tools. Orientation of how the plots are printed on the page can be changed from vertical to
horizontal.
Entering Antenna Factors in Handheld Software Tools
NOTE: The Antenna Factor parameter is only applicable to Anritsu Hand Held
Spectrum Analyzers.
The Antenna Factor (AF) is a fundamental parameter of an antenna used in field measure-
ments. AF is used in the calculation of field strength during radiated emissions measure-
ments, and relates the value of the incident electric or electromagnetic field to the voltage at
the output of the antenna. For an electric field antenna, this is expressed as:
AF EVl
�
Where AF = Antenna Factor, m-1
E = Electric field in Volts per meter
Vl = Voltage at the antenna terminals in Volts
It also can be shown that in a 50 ohm system:
AFGr
� 9 73.
�
Where Gr = the gain of the receiving antenna in dB
� = wave length in meters
Chapter 19 Handheld Software Tools
19-7

Antenna used for radiated emissions testing are individually calibrated (the antenna factors
can be measured directly) at all appropriate distances. The calibrations produce values that
are defined the “equivalent free space antenna factor.” The calibration procedure corrects
for the presence of the reflection of the antenna in the ground plane, giving the value that
would be measured if the antenna were in “free space.”
Antenna Editor
Step1. Once Software Tools has been opened, select Antenna Editor from the Tools
menu on the tool bar. A pop-up box will appear on the screen of the PC.
Step2. Click on “Edit Antenna” to enter an antenna name, description, frequencies, and
antenna factors. Enter the frequencies in ascending order, starting with lowest
frequency first. A maximum of 60 antenna factors may be entered. Use the ar-
row keys on the keyboard to move between entries. Enter an antenna frequency
and gain only, and Software Tools will automatically calculate the antenna fac-
tor.
NOTE: Only one input of frequency and antenna factor is allowed per row. Mul-
tiple antenna factors for a single antenna must be entered individually. For ex-
ample, an antenna having an antenna factor of 5 from 2.0 to 2.25 GHz and an
antenna factor of 4 from 2.25 to 2.5 GHz should be entered as follows:
If necessary, an antenna factor of zero (0) may be entered.
Step3. Select Save from the File menu to save the antenna factors to the hard disk.
Uploading Antenna Factors
All 10 available antennas are transferred to the instrument at the same time. To modify only
a single antenna in the instrument, first download the current antennas (see below) then
modify the appropriate antenna, then re-upload the antennas to the instrument.
To upload antenna information from Handheld Software Tools to the instrument:
Step1. Connect the RS232 cable between the PC and the instrument.
Step2. Click on the Upload button on the tool bar (or select Upload from the Tools
menu). It is important to note that the instrument must sweep very quickly dur-
ing the data transfer, at least every 5 seconds, or the Handheld Software Tools
program may “time-out.” To improve the chances of a successful upload, in-
crease the RBW and VBW settings to the maximum, or set the span to 0, tempo-
rarily.
Step3. The antennas available can be viewed by pressing the MEAS/DISP key, then
the Measure, Field Strength and Select Custom Antenna soft keys.
19-8
Chapter 19 Handheld Software Tools
Frequency (MHz) Antenna Factor
2000 5
2251 4
2500 4

Downloading Antennas
All ten antennas can be downloaded to the PC from the instrument. This allows for modifi-
cations to the antenna factors of an antenna or the addition or deletion of available antennas
from the list. The antennas can then be uploaded to the instrument.
To download the antennas:
Step1. Connect the RS232 cable between the PC and the instrument.
Step2. Verify that the instrument is sweeping at a minimum sweep rate of 5 sec-
onds/sweep.
Step3. Select the Query Antenna Factors button in the Antenna Editor.
Step4. Modify the desired antenna(s), then upload again as required.
Cable List
A custom cable list can be created in Software Tools and uploaded to the Cell Master.
Some standard 1000 MHz, 2000 MHz, and 2500 MHz cables are stored in the Cell Master
and are listed in Appendix A of this User’s Guide.
The cable list contains vital information such as propagation velocity (Vp) and insertion
loss (dB/m or dB/ft). These parameters are important when identifying faults and disconti-
nuities of transmission lines.
NOTE: Values for the cable list are taken from manufacturers specifications.
Complex digital communications systems may require adjustment to attenua-
tion values at the higher frequencies. Contact the manufacturer for the appropri-
ate cable losses.
The Cable Editor is specifically designed to provide contractors, service providers, and net-
work operators with a list of cable types that are tailored to their use.
To open the Cable Editor, select the Tools menu and select Cable Editor.
To open an existing cable list file, select File and Open. Select the desired cable list and
press Enter.
Creating a Custom Cable List
To create a custom cable list:
Step1. Select the File menu and select New.
Step2. Type in or cut and paste the cable types and specifications for the desired cables.
Uploading a Cable List
After custom cable list has be created in Handheld Software Tools, it can be uploaded to the
Cell Master. The serial communication null modem cable must be connected from the Cell
Master to the PC.
In the Cable Editor, select Tools and Upload Cable List. The software will confirm the up-
load with a message "Upload Complete" when the operation is finished.
Chapter 19 Handheld Software Tools
19-9

Querying the Cell Master Cable List
Query Cable List allows the user to check and review the contents of the custom cable list
in the Cell Master.
In the Cable Editor, select Tools and Query Cable List. The software will download the ca-
ble list from the Cell Master to the PC.
DTF Plots
Handheld Software Tools can convert Return Loss in Frequency Domain (Freq-RL) plots
and SWR in Frequency Domain (Freq-SWR) plots to DTF plots.
To convert from Frequency Domain to Distance to Fault, follow these steps:
Step1. Capture a plot or load a previously saved plot.
Step2. Click the Distance-to-fault button on the toolbar (or choose Distance-to-Fault
from the Tools menu). A dialog will open allowing you to specify the cable pa-
rameters, start distance, and stop distance. The cable type may be selected from
the pull-down list. Selecting a cable from the list automatically sets the propaga-
tion velocity and insertion loss. To manually enter the dielectric constant and in-
sertion loss, select the Custom cable type from the top of the list. Click OK when
finished. A new window will open showing the converted plot.
Step3. Use the cursor to read out values shown in the bottom tray of the PC screen, at
each point along the DTF trace. Maximize the plot window for best cursor reso-
lution.
NOTES: The distance units (meters or feet) can be changed by selecting De-
fault Plot Settings from the Settings menu.
The stop distance entry must be less than or equal to the maximum un-aliased
range (D-Max), and the start distance must be less than the stop distance.
Smith Chart
The Smith Chart is a commonly used graphical format for the analysis of the impedance of
transmission lines. It can be a useful tool for fine tuning an antenna system.
Handheld Software Tools can convert the following types of plots to Smith Charts:
� Return Loss (Frequency Domain)
� VSWR (Frequency Domain)
To convert a plot to a Smith Chart:
Step1. Capture a plot or load a previously saved Return Loss or VSWR plot.
Step2. Click the Smith Chart button on the toolbar (or choose Convert to Smith Chart
from the Tools menu). A new window will open showing the plot in Smith Chart
form.
Step3. To read values from a Smith Chart, move the mouse pointer over a data point.
When the mouse pointer turns into a hand, click once with the left button. A
pop-up window will appear with various measurement data.
19-10
Chapter 19 Handheld Software Tools

Signal Standards Editor
The Signal Standards Editor is a software application for viewing, editing and creating sig-
nal standards files. Select a signal standard entry from the list to make it active.
The Signal Standards Editor can:
� Create new signal standards files
� View and edit the signal standard definitions
� Copy and paste signal standard definitions
� Retrieve the signal standards file from a test unit
� Store an updated signal standards file back onto the test unit
� Generate a report of the signal standards file
Creating a New Signal Standards File
To create a new signal standards file, select New Signal Standards File from the File
drop-down menu. An empty signal standards file will be displayed. To add a signal stan-
dard, select Add Signal Standard from the Edit menu.
To add an existing signal standard from a different signal standards file, use the Cut, Copy
and Paste icons, or select Cut, Copy and Paste from the Edit menu.
Editing a Signal Standard
A signal standard definition can be changed by editing the name and parameters. The active
line of the current signal standard is displayed in the text entry box under the main toolbar.
If this box is disabled, the selected signal standard can not be edited.
All changes are temporary until saved as a disk file. To save the signal standards file on the
local PC, select Save from the File menu.
Cut, Copy and Paste
Use the Cut, Copy and Paste icons, or select Cut, Copy and Paste from the Edit menu to
add, copy or remove signal standards.
Cut moves the currently selected signal standard onto the clipboard and the signal standard
is deleted from the Signal Standards list. If the signal standards file is saved, the cut signal
standard will be permanately deleted from that list.
Copy puts a copy of the signal standard on the clipboard, but does not delete it from the
current Signal Standards list.
Paste copies a signal standard from the clipboard into the current Signal Standards list.
Retrieving Signal Standards Files
Connection Manager must be connected to a test unit before retrieving a Signal Standards
file. An active connection is indicated in the Status Bar at the bottom right corner of the ap-
plication window.
Chapter 19 Handheld Software Tools
19-11

To retrieve a Signal Standards file, select Retreive Signal Standards from the Connection
menu, or use the short-cut icon on the button bar. The retrieved Signal Standards data will
replace all existing Signal Standards data in the Signal Standards Editor. To store the cur-
rent Signal Standards data locally, select Save from the File menu and save the current Sig-
nal Standards file before retrieving another the Signal Standards file from a test unit.
Storing Signal Standards Files
To upload the Signal Standards file to a test unit, select Upload Signal Standards from the
Connection menu, or press the short-cut icon on the button bar. This will upload the current
Signal Standards file to the test unit, overwriting any data already on the test unit.
Signal Standards Reports
A signal standards report is generated by selecting the Report function from the File menu.
A signal standards report is an HTML file and can be opened inside the default
web-browser of the PC, where it can be printed if desired.
19-12
Chapter 19 Handheld Software Tools
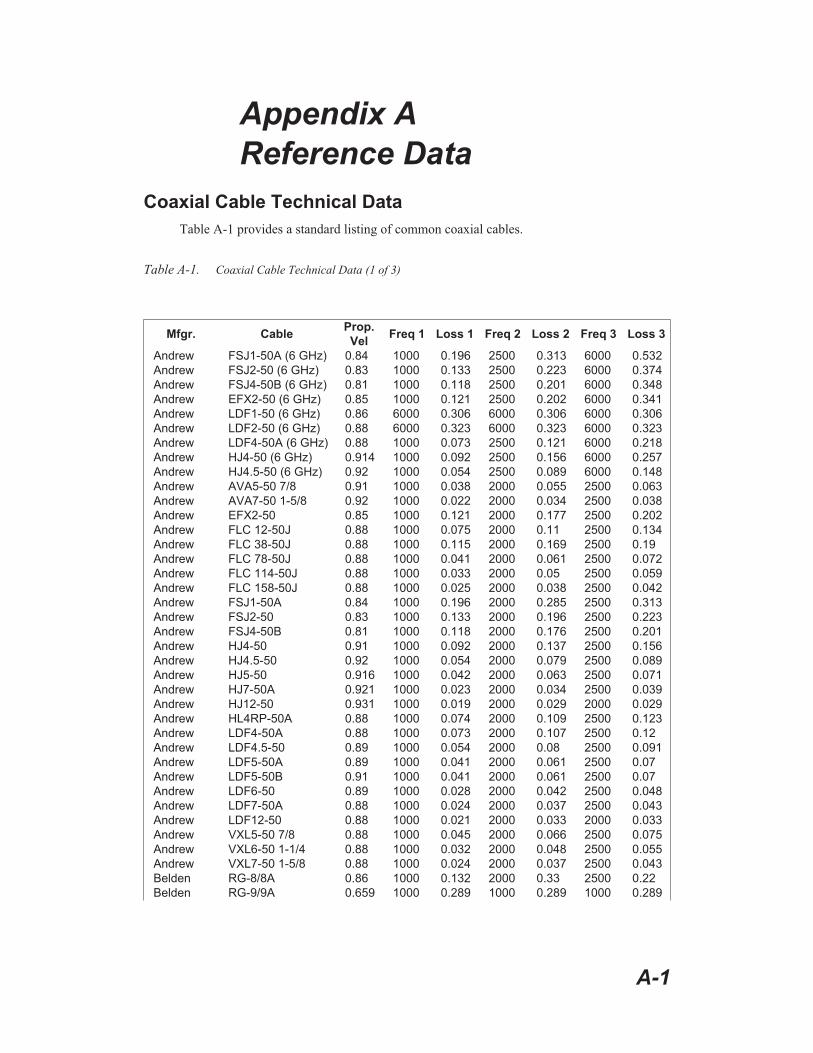
Appendix A
Reference Data
Coaxial Cable Technical Data
Table A-1 provides a standard listing of common coaxial cables.
A-1
Mfgr. CableProp.
VelFreq 1 Loss 1 Freq 2 Loss 2 Freq 3 Loss 3
Andrew FSJ1-50A (6 GHz) 0.84 1000 0.196 2500 0.313 6000 0.532
Andrew FSJ2-50 (6 GHz) 0.83 1000 0.133 2500 0.223 6000 0.374
Andrew FSJ4-50B (6 GHz) 0.81 1000 0.118 2500 0.201 6000 0.348
Andrew EFX2-50 (6 GHz) 0.85 1000 0.121 2500 0.202 6000 0.341
Andrew LDF1-50 (6 GHz) 0.86 6000 0.306 6000 0.306 6000 0.306
Andrew LDF2-50 (6 GHz) 0.88 6000 0.323 6000 0.323 6000 0.323
Andrew LDF4-50A (6 GHz) 0.88 1000 0.073 2500 0.121 6000 0.218
Andrew HJ4-50 (6 GHz) 0.914 1000 0.092 2500 0.156 6000 0.257
Andrew HJ4.5-50 (6 GHz) 0.92 1000 0.054 2500 0.089 6000 0.148
Andrew AVA5-50 7/8 0.91 1000 0.038 2000 0.055 2500 0.063
Andrew AVA7-50 1-5/8 0.92 1000 0.022 2000 0.034 2500 0.038
Andrew EFX2-50 0.85 1000 0.121 2000 0.177 2500 0.202
Andrew FLC 12-50J 0.88 1000 0.075 2000 0.11 2500 0.134
Andrew FLC 38-50J 0.88 1000 0.115 2000 0.169 2500 0.19
Andrew FLC 78-50J 0.88 1000 0.041 2000 0.061 2500 0.072
Andrew FLC 114-50J 0.88 1000 0.033 2000 0.05 2500 0.059
Andrew FLC 158-50J 0.88 1000 0.025 2000 0.038 2500 0.042
Andrew FSJ1-50A 0.84 1000 0.196 2000 0.285 2500 0.313
Andrew FSJ2-50 0.83 1000 0.133 2000 0.196 2500 0.223
Andrew FSJ4-50B 0.81 1000 0.118 2000 0.176 2500 0.201
Andrew HJ4-50 0.91 1000 0.092 2000 0.137 2500 0.156
Andrew HJ4.5-50 0.92 1000 0.054 2000 0.079 2500 0.089
Andrew HJ5-50 0.916 1000 0.042 2000 0.063 2500 0.071
Andrew HJ7-50A 0.921 1000 0.023 2000 0.034 2500 0.039
Andrew HJ12-50 0.931 1000 0.019 2000 0.029 2000 0.029
Andrew HL4RP-50A 0.88 1000 0.074 2000 0.109 2500 0.123
Andrew LDF4-50A 0.88 1000 0.073 2000 0.107 2500 0.12
Andrew LDF4.5-50 0.89 1000 0.054 2000 0.08 2500 0.091
Andrew LDF5-50A 0.89 1000 0.041 2000 0.061 2500 0.07
Andrew LDF5-50B 0.91 1000 0.041 2000 0.061 2500 0.07
Andrew LDF6-50 0.89 1000 0.028 2000 0.042 2500 0.048
Andrew LDF7-50A 0.88 1000 0.024 2000 0.037 2500 0.043
Andrew LDF12-50 0.88 1000 0.021 2000 0.033 2000 0.033
Andrew VXL5-50 7/8 0.88 1000 0.045 2000 0.066 2500 0.075
Andrew VXL6-50 1-1/4 0.88 1000 0.032 2000 0.048 2500 0.055
Andrew VXL7-50 1-5/8 0.88 1000 0.024 2000 0.037 2500 0.043
Belden RG-8/8A 0.86 1000 0.132 2000 0.33 2500 0.22
Belden RG-9/9A 0.659 1000 0.289 1000 0.289 1000 0.289
Table A-1. Coaxial Cable Technical Data (1 of 3)

A-2
Appendix A Reference Data
Mfgr. CableProp.
VelFreq 1 Loss 1 Freq 2 Loss 2 Freq 3 Loss 3
Belden RG-17/17A 0.659 1000 0.18 1000 0.18 1000 0.18
Belden RG-55/55A/55B 0.659 1000 0.541 1000 0.541 1000 0.541
Belden RG-58/58B 0.77 1000 0.356 2000 0.528 2500 0.6
Belden RG-58A/58C 0.73 1000 0.594 1000 0.594 1000 0.594
Belden RG-142 0.7 1000 0.43 2000 0.663 2500 0.713
Belden RG-174 0.66 1000 1.115 1000 1.115 1000 1.115
Belden RG-178B 0.695 1000 1.509 1000 1.509 1000 1.509
Belden RG-188 0.69 1000 0.951 1000 0.951 1000 0.951
Belden RG-213 0.66 1000 0.262 1000 0.269 1000 0.269
Belden RG-214 0.659 1000 0.229 1000 0.292 1000 0.292
Belden RG-223 0.66 1000 0.476 1000 0.478 1000 0.478
Cablewave HCC 12-50J 0.915 1000 0.087 2000 0.126 2500 0.137
Cablewave HCC 78-50J 0.915 1000 0.041 2000 0.061 2500 0.066
Cablewave HCC 158-50J 0.95 1000 0.022 2000 0.031 2500 0.033
Cablewave HCC 300-50J 0.96 1000 0.015 1000 0.015 1000 0.015
Cablewave HCC 312-50J 0.96 1000 0.013 1000 0.013 1000 0.013
Cablewave HF 4 1/8 Cu2Y 0.97 1000 0.01 1000 0.01 1000 0.01
Cablewave HF 5 Cu2Y 0.96 1000 0.007 1000 0.007 1000 0.007
Cablewave HF 6 1/8 Cu2Y 0.97 1000 0.006 1000 0.006 1000 0.006
Cellflex LCF78-50JA 0.9 1000 0.039 2000 0.058 2500 0.066
Cellflex LCFS114-50JA 0.9 1000 0.029 2000 0.044 2500 0.051
Cellflex LCF158-50JA 0.9 1000 0.024 2000 0.036 2500 0.042
Cellflex LCF214-50JA 0.88 1000 0.021 2000 0.033 2000 0.033
Cellflex UCF114-50JA 0.89 1000 0.031 2000 0.047 2000 0.047
Comscope CR50 540PE 0.88 1000 0.069 2000 0.103 2500 0.116
Comscope CR50 1070PE 0.88 1000 0.037 2000 0.055 2500 0.064
Comscope CR50 1873PE 0.88 1000 0.022 2000 0.034 2500 0.04
Eupen EC4-50-HF 1/2 0.82 1000 0.108 2000 0.161 2500 0.183
Eupen EC4-50 1/2 0.88 1000 0.074 2000 0.109 2500 0.121
Eupen EC4.5-50 5/8 0.88 1000 0.056 2000 0.083 2500 0.094
Eupen EC5-50 7/8 0.88 1000 0.04 2000 0.058 2500 0.066
Eupen EC6-50 1-1/4 0.88 1000 0.028 2000 0.043 2500 0.048
Eupen EC7-50 1-5/8 0.88 1000 0.024 2000 0.037 2500 0.042
Eupen EC7-50A 1-5/8 0.89 1000 0.023 2000 0.035 2500 0.039
Eupen EC12-50 2-1/4 0.88 1000 0.022 2000 0.034 2500 0.039
Nk Cables RF1/2-50 0.88 1000 0.073 2000 0.107 2500 0.127
Nk Cables RF1/2-50GHF 0.88 1000 0.073 2000 0.107 2500 0.127
Nk Cables RF1/2-50BHF 0.88 1000 0.073 2000 0.107 2500 0.127
Nk Cables RF5/8-50 0.88 1000 0.051 2000 0.075 2500 0.087
Nk Cables RF5/8-50GHF 0.88 1000 0.051 2000 0.075 2500 0.087
Nk Cables RF5/8-50BHF 0.88 1000 0.051 2000 0.075 2500 0.087
Nk Cables RF7/8-50 0.88 1000 0.04 2000 0.059 2500 0.07
Nk Cables RF7/8-50GHF 0.88 1000 0.04 2000 0.059 2500 0.07
Nk Cables RF7/8-50BHF 0.88 1000 0.04 2000 0.059 2500 0.07
Nk Cables RF1 5/8-50 0.88 1000 0.024 2000 0.036 2500 0.042
Nk Cables RF1 5/8-50GHF 0.88 1000 0.024 2000 0.036 2500 0.042
Nk Cables RF1 5/8-50BHF 0.88 1000 0.024 2000 0.036 2500 0.042
Nk Cables RF2 1/4-50 0.88 1000 0.021 2000 0.032 2500 0.041
Nk Cables RF2 1/4-50GHF 0.88 1000 0.021 2000 0.032 2500 0.041
Nk Cables RF2 1/4-50BHF 0.88 1000 0.021 2000 0.032 2500 0.041
Nk Cables RFF3/8-50 0.81 1000 0.147 2000 0.218 2500 0.25
Table A-1. Coaxial Cable Technical Data (2 of 3)

A-3
Appendix A Reference Data
Mfgr. CableProp.
VelFreq 1 Loss 1 Freq 2 Loss 2 Freq 3 Loss 3
Nk Cables RFF3/8-50GHF 0.81 1000 0.147 2000 0.218 2500 0.25
Nk Cables RFF3/8-50BHF 0.81 1000 0.147 2000 0.218 2500 0.25
Nk Cables RFF1/2-50 0.82 1000 0.112 2000 0.167 2500 0.19
Nk Cables RFF1/2-50GHF 0.82 1000 0.112 2000 0.167 2500 0.19
Nk Cables RFF1/2-50BHF 0.82 1000 0.112 2000 0.167 2500 0.19
Nk Cables RFF7/8-50 0.88 1000 0.04 2000 0.066 2500 0.076
Nk Cables RFF7/8-50GHF 0.88 1000 0.04 2000 0.066 2500 0.076
Nk Cables RFF7/8-50BHF 0.88 1000 0.04 2000 0.066 2500 0.076
Times LMR100 0.66 1000 0.789 2000 1.15 2500 1.31
Times LMR200 0.83 1000 0.342 2000 0.49 2500 0.554
Times LMR240 0.84 1000 0.261 2000 0.377 2500 0.424
Times LMR400 0.85 1000 0.135 2000 0.196 2500 0.222
Times LMR500 0.86 1000 0.109 2000 0.159 2500 0.18
Times LMR600 0.87 1000 0.087 2000 0.128 2500 0.145
Times LMR900 0.87 1000 0.059 2000 0.086 2500 0.098
Times LMR1200 0.88 1000 0.044 2000 0.065 2500 0.074
Times LMR1700 0.89 1000 0.033 2000 0.049 2500 0.057
310801 0.821 1000 0.115 1000 0.115 1000 0.115
311201 0.82 1000 0.18 1000 0.18 1000 0.18
311501 0.8 1000 0.23 1000 0.23 1000 0.23
311601 0.8 1000 0.262 1000 0.262 1000 0.262
311901 0.8 1000 0.377 1000 0.377 1000 0.377
352001 0.8 1000 0.377 1000 0.377 1000 0.377
Table A-1. Coaxial Cable Technical Data (3 of 3)

Antenna Technical Data
Table A-2 provides a listing of common antennas.
A-4
Appendix A Reference Data
Anritsu part number: 2000-1030
MAXRAD MPA1750 Antenna, 1710-1880 MHz
Antenex DXCN1795SM
Freqency (MHz) Antenna Gain (dBi) Antenna Factor (dB)
1710 2 32.88
1715 2 32.91
1720 2 32.93
1725 2 32.96
1730 2 32.98
1735 2 33.01
1740 2 33.03
1745 2 33.06
1750 2 33.08
1755 2 33.11
1760 2 33.13
1765 2 33.15
1770 2 33.18
1775 2 33.20
1780 2 33.23
1785 2 33.25
1790 2 33.28
1795 2 33.30
1800 2 33.33
1805 2 33.35
1810 2 33.37
1815 2 33.40
1820 2 33.42
1825 2 33.45
1830 2 33.47
1835 2 33.49
1840 2 33.52
1845 2 33.54
1850 2 33.56
1855 2 33.59
1860 2 33.61
1865 2 33.63
1870 2 33.66
1875 2 33.68
1880 2 33.70
Anritsu part number: 2000-1031
MAXRAD MPA1850 Antenna - 1850-1990 MHz
Antenex DXCN1920SM
Freqency (MHz) Antenna Gain (dBi) Antenna Factor (dB)
1850 2 33.56
1855 2 33.59
Table A-2. Antenna Technical Data (1 of 7)
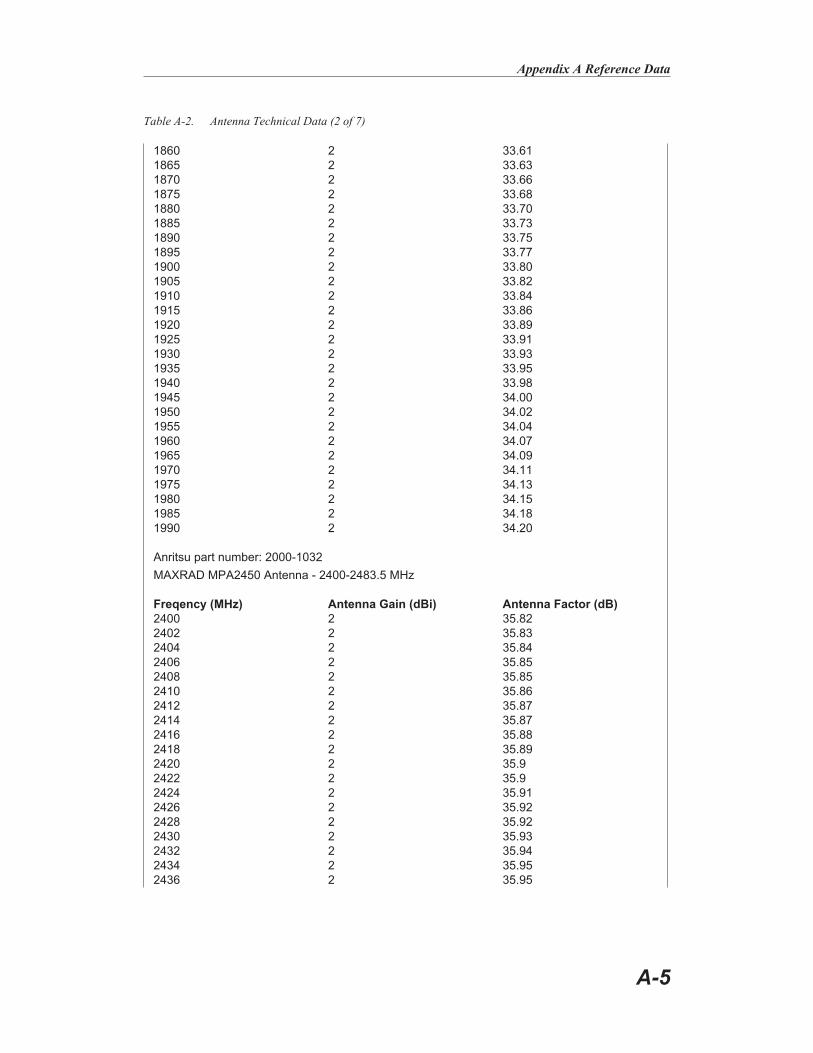
A-5
Appendix A Reference Data
1860 2 33.61
1865 2 33.63
1870 2 33.66
1875 2 33.68
1880 2 33.70
1885 2 33.73
1890 2 33.75
1895 2 33.77
1900 2 33.80
1905 2 33.82
1910 2 33.84
1915 2 33.86
1920 2 33.89
1925 2 33.91
1930 2 33.93
1935 2 33.95
1940 2 33.98
1945 2 34.00
1950 2 34.02
1955 2 34.04
1960 2 34.07
1965 2 34.09
1970 2 34.11
1975 2 34.13
1980 2 34.15
1985 2 34.18
1990 2 34.20
Anritsu part number: 2000-1032
MAXRAD MPA2450 Antenna - 2400-2483.5 MHz
Freqency (MHz) Antenna Gain (dBi) Antenna Factor (dB)
2400 2 35.82
2402 2 35.83
2404 2 35.84
2406 2 35.85
2408 2 35.85
2410 2 35.86
2412 2 35.87
2414 2 35.87
2416 2 35.88
2418 2 35.89
2420 2 35.9
2422 2 35.9
2424 2 35.91
2426 2 35.92
2428 2 35.92
2430 2 35.93
2432 2 35.94
2434 2 35.95
2436 2 35.95
Table A-2. Antenna Technical Data (2 of 7)

A-6
Appendix A Reference Data
2438 2 35.96
2440 2 35.97
2442 2 35.97
2444 2 35.98
2446 2 35.99
2448 2 36
2450 2 36
2452 2 36.01
2454 2 36.02
2456 2 36.02
2458 2 36.03
2460 2 36.04
2462 2 36.05
2464 2 36.05
2466 2 36.06
2468 2 36.07
2470 2 36.07
2472 2 36.08
2474 2 36.09
2476 2 36.1
2478 2 36.1
2480 2 36.11
2482 2 36.12
2483.5 2 36.12
Anritsu part number: 2000-1200
Centurion EXCSM806 Antenna - 806-869 MHz
Freqency (MHz) Antenna Gain (dBi) Antenna Factor (dB)
806 2.15 26.2
809 2.15 26.23
812 2.15 26.26
815 2.15 26.29
818 2.15 26.33
821 2.15 26.36
824 2.15 26.39
827 2.15 26.42
830 2.15 26.45
833 2.15 26.48
836 2.15 26.51
839 2.15 26.55
842 2.15 26.58
845 2.15 26.61
848 2.15 26.64
851 2.15 26.67
854 2.15 26.7
857 2.15 26.73
860 2.15 26.76
863 2.15 26.79
866 2.15 26.82
869 2.15 26.85
Table A-2. Antenna Technical Data (3 of 7)
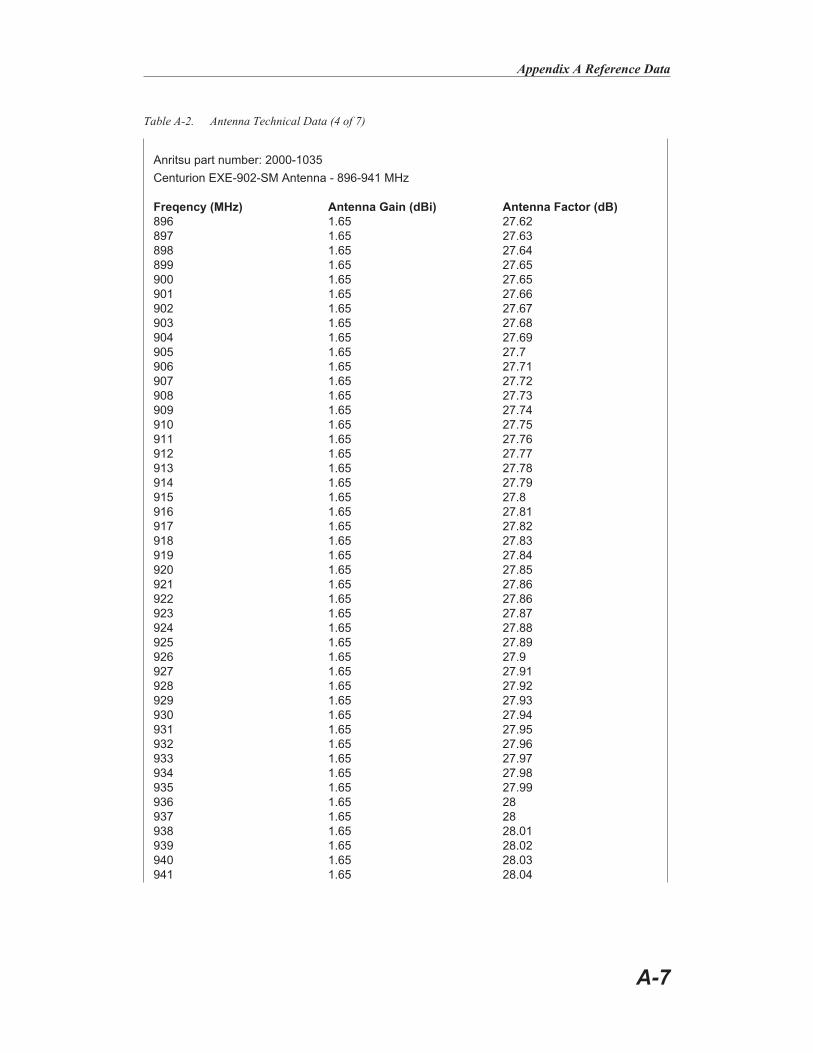
A-7
Appendix A Reference Data
Anritsu part number: 2000-1035
Centurion EXE-902-SM Antenna - 896-941 MHz
Freqency (MHz) Antenna Gain (dBi) Antenna Factor (dB)
896 1.65 27.62
897 1.65 27.63
898 1.65 27.64
899 1.65 27.65
900 1.65 27.65
901 1.65 27.66
902 1.65 27.67
903 1.65 27.68
904 1.65 27.69
905 1.65 27.7
906 1.65 27.71
907 1.65 27.72
908 1.65 27.73
909 1.65 27.74
910 1.65 27.75
911 1.65 27.76
912 1.65 27.77
913 1.65 27.78
914 1.65 27.79
915 1.65 27.8
916 1.65 27.81
917 1.65 27.82
918 1.65 27.83
919 1.65 27.84
920 1.65 27.85
921 1.65 27.86
922 1.65 27.86
923 1.65 27.87
924 1.65 27.88
925 1.65 27.89
926 1.65 27.9
927 1.65 27.91
928 1.65 27.92
929 1.65 27.93
930 1.65 27.94
931 1.65 27.95
932 1.65 27.96
933 1.65 27.97
934 1.65 27.98
935 1.65 27.99
936 1.65 28
937 1.65 28
938 1.65 28.01
939 1.65 28.02
940 1.65 28.03
941 1.65 28.04
Table A-2. Antenna Technical Data (4 of 7)

A-8
Appendix A Reference Data
Anritsu part number: 2000-1361
Anritsu #2000-1361 (MAXRAD MHWS5800MSMA) Antenna - 5725-5825 MHz
Freqency (MHz) Antenna Gain (dBi) Antenna Factor (dB)
5725 2 43.38
5727 2 43.38
5729 2 43.38
5731 2 43.38
5733 2 43.39
5735 2 43.39
5737 2 43.39
5739 2 43.4
5741 2 43.4
5743 2 43.4
5745 2 43.41
5747 2 43.41
5749 2 43.41
5751 2 43.41
5753 2 43.42
5755 2 43.42
5757 2 43.42
5759 2 43.43
5761 2 43.43
5763 2 43.43
5765 2 43.44
5767 2 43.44
5769 2 43.44
5771 2 43.45
5773 2 43.45
5775 2 43.45
5777 2 43.45
5779 2 43.46
5781 2 43.46
5783 2 43.46
5785 2 43.47
5787 2 43.47
5789 2 43.47
5791 2 43.48
5793 2 43.48
5795 2 43.48
5797 2 43.48
5799 2 43.49
5801 2 43.49
5803 2 43.49
5805 2 43.5
5807 2 43.5
5809 2 43.5
5811 2 43.51
5813 2 43.51
5815 2 43.51
Table A-2. Antenna Technical Data (5 of 7)

A-9
Appendix A Reference Data
5817 2 43.51
5819 2 43.52
5821 2 43.52
5823 2 43.52
5825 2 43.53
Anritsu part number: 2000-1473
Anritsu #2000-1473 (Mobile Mark PSKN3-925S) Antenna - 870-960 MHz
Freqency (MHz) Antenna Gain (dBi) Antenna Factor (dB)
870 2.3 26.71
875 2.3 26.76
880 2.3 26.81
885 2.3 26.86
890 2.3 26.91
895 2.3 26.96
900 2.3 27.00
905 2.3 27.05
910 2.3 27.10
915 2.3 27.15
920 2.3 27.20
925 2.3 27.24
930 2.3 27.29
935 2.3 27.34
940 2.3 27.38
945 2.3 27.43
950 2.3 27.47
955 2.3 27.52
960 2.3 27.57
Anritsu part numbert: 2000-1474
Anritsu #2000-1474 (Mobile Mark PSKN3-1800S) Antenna - 1710-1880 MHz
Freqency (MHz) Antenna Gain (dBi) Antenna Factor (dB)
1710 2.3 32.58
1720 2.3 32.63
1730 2.3 32.68
1740 2.3 32.73
1750 2.3 32.78
1760 2.3 32.83
1770 2.3 32.88
1780 2.3 32.93
1790 2.3 32.98
1800 2.3 33.03
1810 2.3 33.07
1820 2.3 33.12
1830 2.3 33.17
1840 2.3 33.22
1850 2.3 33.26
1860 2.3 33.31
1870 2.3 33.36
1880 2.3 33.40
Table A-2. Antenna Technical Data (6 of 7)
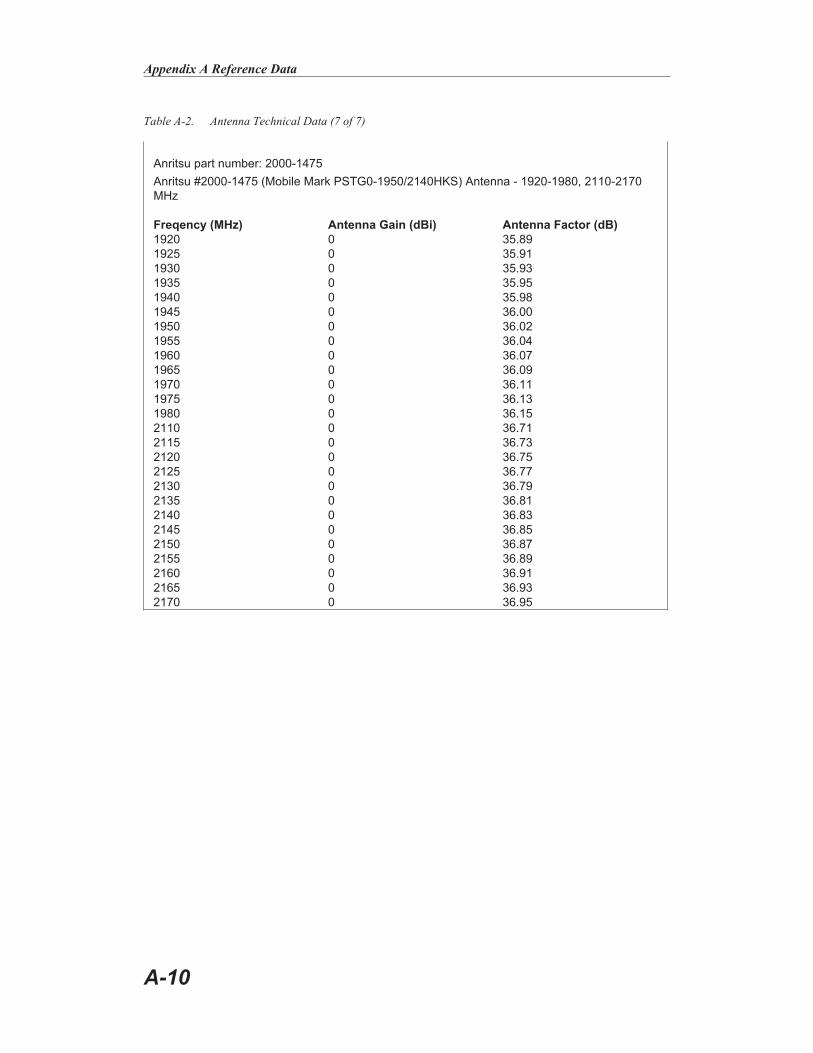
A-10
Appendix A Reference Data
Anritsu part number: 2000-1475
Anritsu #2000-1475 (Mobile Mark PSTG0-1950/2140HKS) Antenna - 1920-1980, 2110-2170
MHz
Freqency (MHz) Antenna Gain (dBi) Antenna Factor (dB)
1920 0 35.89
1925 0 35.91
1930 0 35.93
1935 0 35.95
1940 0 35.98
1945 0 36.00
1950 0 36.02
1955 0 36.04
1960 0 36.07
1965 0 36.09
1970 0 36.11
1975 0 36.13
1980 0 36.15
2110 0 36.71
2115 0 36.73
2120 0 36.75
2125 0 36.77
2130 0 36.79
2135 0 36.81
2140 0 36.83
2145 0 36.85
2150 0 36.87
2155 0 36.89
2160 0 36.91
2165 0 36.93
2170 0 36.95
Table A-2. Antenna Technical Data (7 of 7)
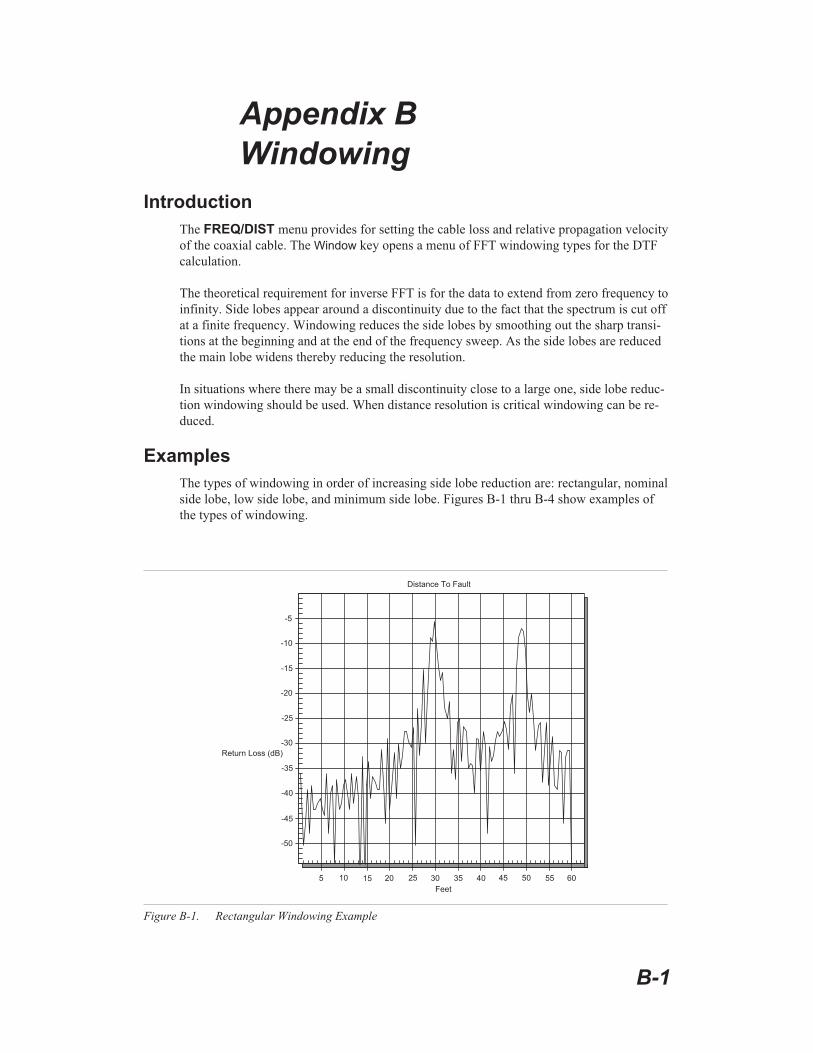
Appendix B
Windowing
Introduction
The FREQ/DIST menu provides for setting the cable loss and relative propagation velocity
of the coaxial cable. The Window key opens a menu of FFT windowing types for the DTF
calculation.
The theoretical requirement for inverse FFT is for the data to extend from zero frequency to
infinity. Side lobes appear around a discontinuity due to the fact that the spectrum is cut off
at a finite frequency. Windowing reduces the side lobes by smoothing out the sharp transi-
tions at the beginning and at the end of the frequency sweep. As the side lobes are reduced
the main lobe widens thereby reducing the resolution.
In situations where there may be a small discontinuity close to a large one, side lobe reduc-
tion windowing should be used. When distance resolution is critical windowing can be re-
duced.
Examples
The types of windowing in order of increasing side lobe reduction are: rectangular, nominal
side lobe, low side lobe, and minimum side lobe. Figures B-1 thru B-4 show examples of
the types of windowing.
B-1
� � � �
� � � � � � � � � � � � � � � � � � � �
� �
� � �
� � �
� � �
� � �
� � �
� � �
� �
� �
� � �
� � � � � � � � � � � � � � �
� � � � � � � � � � � � � � � �
Figure B-1. Rectangular Windowing Example

B-2
Appendix B Windowing
� � � � � � � � � � � � � � � �
� � � � � � � � � � �
� � � �
� � � � � � � � �
� �
� � �
� � �
� � �
� � �
� � �
� � �
� �
� �
� � �
� � � � � � � � � � � � � � �
Figure B-2. Nominal Side Lobe Windowing Example
� � � � � � � � � � � � � � � �
� � � � � � � � � � �
� � � �
� � � � � � � � �
� �
� � �
� � �
� � �
� � �
� � �
� � �
� �
� �
� � �
� � � � � � � � � � � � � � �
Figure B-3. Low Side Lobe Windowing Example

B-3
Appendix B Windowing
� � � � � � � � � � � � � � � �
� � � � � � � � � � � � � � � � � � � �
� � � �
� �
� � �
� � �
� � �
� � �
� � �
� � �
� �
� �
� � �
� � � � � � � � � � � � � � �
Figure B-4. Minimum Side Lobe Windowing Example

Appendix C
Signal Standards
Introduction
Table C-1 provides a listing of common signal standards supported by the Cell Master.
C-1
AMPS / EIA 553 - Uplink
C-450(P) - Uplink
C-450(P) - Downlink
C-450(SA) - Uplink
C-450(SA) - Downlink
CDMA China 1 - Uplink
CDMA China 1 - Downlink
CDMA China 2 - Uplink
CDMA China 2 - Downlink
CDMA Japan - Uplink
CDMA Japan - Downlink
CDMA Korea PCS - Uplink
CDMA Korea PCS - Downlink
CDMA US Cellular - Uplink
CDMA US Cellular - Downlink
CDMA US PCS - Uplink
CDMA US PCS - Downlink
CDMA2000 Class 0 Korea Cellular - Uplink
CDMA2000 Class 0 Korea Cellular - Downlink
CDMA2000 Class 0 N.A. Cellular - Uplink
CDMA2000 Class 0 N.A. Cellular - Downlink
CDMA2000 Class 1 N.A. PCS - Uplink
CDMA2000 Class 1 N.A. PCS - Downlink
CDMA2000 Class 2 (TACS Band) - Uplink
CDMA2000 Class 2 (TACS Band) - Downlink
CDMA2000 Class 3 (JTACS Band) - Uplink
CDMA2000 Class 3 (JTACS Band) - Downlink
CDMA2000 Class 4 Korea PCS - Uplink
CDMA2000 Class 4 Korea PCS - Downlink
CDMA2000 Class 5 (NMT-450-20 kHz)- Uplink
CDMA2000 Class 5 (NMT-450-20 kHz)- Downlink
CDMA2000 Class 5 (NMT-450-25 kHz)- Uplink
CDMA2000 Class 5 (NMT-450-25 kHz)- Downlink
CDMA2000 Class 6 IMT-2000- Uplink
CDMA2000 Class 6 IMT-2000- Downlink
CDMA2000 Class 7 N.A. 700 MHz Cellular - Uplink
CDMA2000 Class 7 N.A. 700 MHz Cellular - Downlink
DCS 1800 - Uplink
DCS 1800 - Downlink
Digital Multimedia Broadcasting
ETACS - Uplink
ETACS - Downlink
Table C-1. Signal Standards
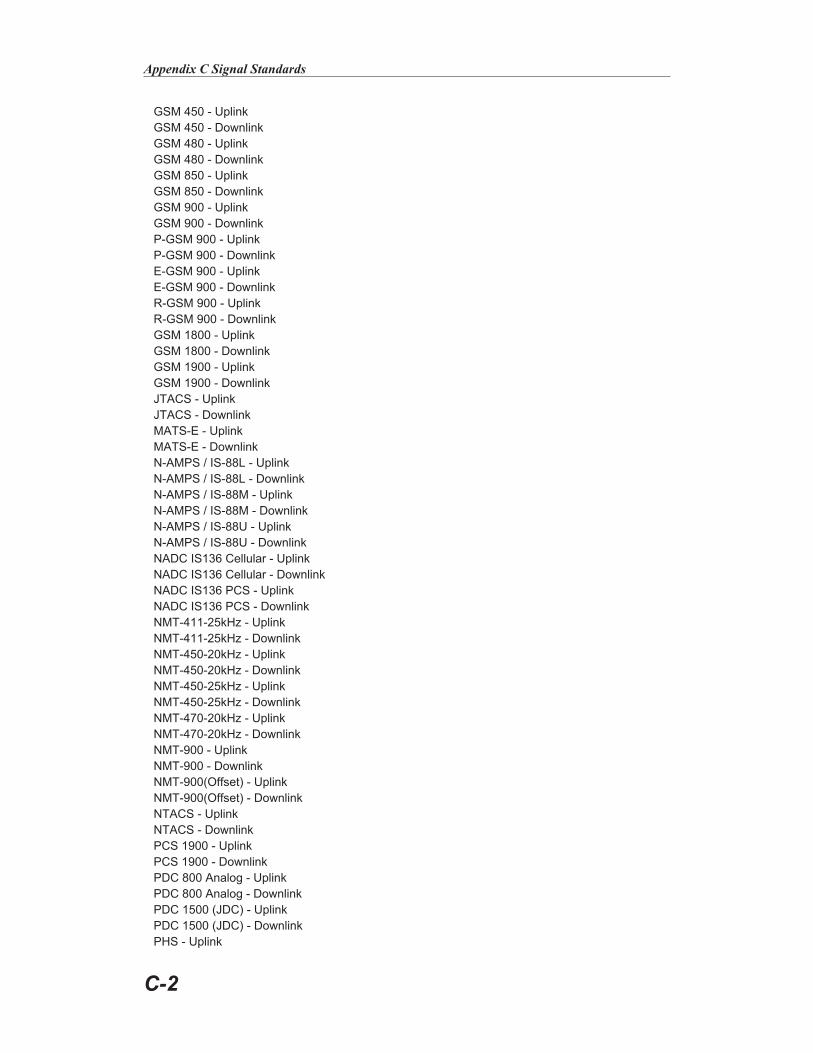
C-2
Appendix C Signal Standards
GSM 450 - Uplink
GSM 450 - Downlink
GSM 480 - Uplink
GSM 480 - Downlink
GSM 850 - Uplink
GSM 850 - Downlink
GSM 900 - Uplink
GSM 900 - Downlink
P-GSM 900 - Uplink
P-GSM 900 - Downlink
E-GSM 900 - Uplink
E-GSM 900 - Downlink
R-GSM 900 - Uplink
R-GSM 900 - Downlink
GSM 1800 - Uplink
GSM 1800 - Downlink
GSM 1900 - Uplink
GSM 1900 - Downlink
JTACS - Uplink
JTACS - Downlink
MATS-E - Uplink
MATS-E - Downlink
N-AMPS / IS-88L - Uplink
N-AMPS / IS-88L - Downlink
N-AMPS / IS-88M - Uplink
N-AMPS / IS-88M - Downlink
N-AMPS / IS-88U - Uplink
N-AMPS / IS-88U - Downlink
NADC IS136 Cellular - Uplink
NADC IS136 Cellular - Downlink
NADC IS136 PCS - Uplink
NADC IS136 PCS - Downlink
NMT-411-25kHz - Uplink
NMT-411-25kHz - Downlink
NMT-450-20kHz - Uplink
NMT-450-20kHz - Downlink
NMT-450-25kHz - Uplink
NMT-450-25kHz - Downlink
NMT-470-20kHz - Uplink
NMT-470-20kHz - Downlink
NMT-900 - Uplink
NMT-900 - Downlink
NMT-900(Offset) - Uplink
NMT-900(Offset) - Downlink
NTACS - Uplink
NTACS - Downlink
PCS 1900 - Uplink
PCS 1900 - Downlink
PDC 800 Analog - Uplink
PDC 800 Analog - Downlink
PDC 1500 (JDC) - Uplink
PDC 1500 (JDC) - Downlink
PHS - Uplink

C-3
Appendix C Signal Standards
PHS - Downlink
SMR 800 - 12.5 kHz - Uplink
SMR 800 - 12.5 kHz - Downlink
SMR 800 - 25 kHz - Uplink
SMR 800 - 25 kHz - Downlink
SMR 1500 - Uplink
SMR 1500 - Downlink
TACS - Uplink
TACS - Downlink
Digital Terrestrial TV Japan
Terrestrial TV Japan
Terrestrial TV USA
Terrestrial TV Eur. UHF-8MHz
UMTS Band I Uplink 9612-9888 Europe
UMTS Band I Downlink 10562-10838 Europe
UMTS Band II Uplink(General) 9262-9538 US
UMTS Band II Uplink(Additional) 12-287 US
UMTS Band II Downlink(General) 9662-9938 US
UMTS Band II Downlink(Additional) 412-687 US
UMTS Band III Uplink 8562-8913 Europe
UMTS Band III Downlink 9037-9388 Europe
UMTS Band IV Uplink(General) 8562-8763
UMTS Band IV Uplink(Additional) 1162-1362
UMTS Band IV Downlink(General) 10562-10763
UMTS Band IV Downlink(Additional) 1462-1662
UMTS Band V Uplink(General) 4132-4233 US
UMTS Band V Uplink(Additional) 782-782 US
UMTS Band V Downlink(General) 4357-4458 US
UMTS Band V Downlink(Additional) 1007-1007 US
UMTS Band VI Uplink(General) 4162-4188 Japan
UMTS Band VI Uplink(Additional) 812-837 Japan
UMTS Band VI Downlink(General) 4387-4413 Japan
UMTS Band VI Downlink(Additional) 1037-1062 Japan
802.11a
802.11b
802.11 FH
802.11 DS
802.11g
Index
!1xRTT . . . . . . . . . 1-1, 1-10, 2-76, 13-1
Aaccessories . . . . . . . . . . . . . . 1-2 - 1-3
ACPR . . . . . . . . . . . . . . . 2-21, 5-13
aging . . . . . . . . . . . . . . . . . . . . 1-6
AIS . . . . . . . . . . . . . . . . . . . . 2-82
AM/FM. . . . . . . . . . . . . . . . . . 5-15
AMI . . . . . . . . . . . . . . . . 2-81, 2-87
amplitude . . . . . . . . . . . . . . . . . 3-11
ANSI. . . . . . . . . . . . . . . . . . . . 9-1
antenna factors
downloading . . . . . . . . . . . . 19-9
entering . . . . . . . . . . . . . . . 19-7
uploading . . . . . . . . . . . . . . 19-8
attenuation . . . . . . . . . . . . . . . . 3-12
dynamic . . . . . . . . . . . . . 5-3, 5-6
attenuator . 2-19, 2-51, 3-11 - 3-12, 5-2, 13-1,18-1
average
noise level . . . . . . . . . . . . . . 1-7
power . . . . . . . . . . . . . 13-5, 14-4
RMS 2-20, 2-24, 2-30, 2-55, 3-12 - 5-13
sweep. . . . . . . . . . 2-20, 2-42, 3-12
BB8ZS . . . . . . . . . . . . . . . . 2-81, 9-5
bandwidth . . . . . . . 2-19, 2-42, 2-54, 3-11
battery . . . . . . . . . . . . . . . . . . 2-105
BER . . . . . . . . . . . . . . . . . . . 10-1
bias tee . . . . . . . . . 1-1, 1-8, 2-103, 11-4
blue alarm . . . . . . . . . . . . . . . . 2-82
BPV . . . . . . . . . . . 2-82, 2-87, 9-4, 10-3
bridged . . . . . . . . . . . . . . . 2-81, 2-87
brightness. . . . . . . . . . . . . . . . . 3-18
BTS . . . . . . . . . . . . . . . . . 9-1, 10-1
burst power . . . . . . . . . . . . . . . . 14-4
CC/I . . . . . . . . . . . . . . . . . 2-22, 5-17
cable loss . . . . . . . . . . . . . . . 4-2, 4-4
calibration . . . . . . . . . . . . . . 1-13, 3-2
carrier to interference ratio . . . . . . . . 5-17
case . . . . . . . . . . . . . . . . . . . . 3-20
CDMA . . . . . . . . . . . . . . . . . . 13-1
cdma2000 . . . . . . . . 1-1, 1-9, 2-76, 13-1
cdmaOne . . . . . . . . . 1-1, 1-9, 2-76, 13-1
CDP . . . . . . . . . . . . . 13-2, 13-4, 18-3
channel. 2-18, 2-37, 2-51, 2-62, 3-11, 5-7, 6-1
power . . . . . . . . . . . . . . . . 5-11
scanner. . . . . . . . . . 1-1, 2-61, 16-1
spacing . . . . . . . . . . . . . . . 2-21
span. . . . . . . . . . . . . . 2-21, 5-11
clock . . . . . . . . . . . . . . . . . . . 2-14
clock source . . . . . . . . . . . . . . . 2-81
connectors . . . . . . . . . . . . . . . . . 2-1
CRC . . . . . . . . . . . 2-82, 2-87, 9-5, 10-3
CRC-4 . . . . . . . . . . . . . . . . . . 10-1
CSU . . . . . . . . . . . . . . . . . . . 2-82
CW
fixed . . . . . . . . . . . . . . . . 2-11
mode . . . . . . . . . . . . . . . . . 4-2
signal generator . . . . . 1-1, 2-66, 17-1
DD4 . . . . . . . . . . . . . . . . . . . . . 9-7
D4 SF. . . . . . . . . . . . . . . . . . . 2-81
date format . . . . . . . . . . . . . . . . 2-15
demodulation. . . . . . . . . . . . 5-15, 13-7
detection . . . . . . . . . . . . . . . . . 3-12
detector . . . . . . . . . . . . . . . . . . 2-20
RF . . . . . . . . . . . . . . . . . . 1-5
DS1 . . . . . . . . . . . . . . . . . . . . 9-1
DTF . . . . . 2-10, 3-8, 4-2, 4-6, 19-3, 19-10
DTF Aid . . . . . . . . . . . 2-10 - 2-11, 3-8
duplexer . . . . . . . . . . . . . . . . . 11-3
Index-1

dynamic attenuation . . . . . . . . . . . . 5-6
EE1 . . . . . . . . . 1-2, 1-11, 2-2, 2-86, 10-1
Ec/Io . . . . . . . . . . . . . . . . . . . 13-4
error insertion . . . . . . . . . . . . . . 2-82
error messages . . . . . . . . . . . . . 2-100
ESD . . . . . . . . . . . . . . . . . . . 1-14
ESF . . . . . . . . . . . . . . . 2-81, 9-4, 9-7
ESTM . . . . . . . . . . . . . . . 13-3, 18-3
EVDO . . . . . . . . . . . . . . . . . . . 1-1
EV-DO . . . . . . . . . . . . . . . . . . 18-1
external
attenuator . . . . . . . . . . . . . . 11-1
reference . . . . . . . . 13-1, 14-1, 18-1
Ffeedthrough. . . . . . . . . . . . . . . . 13-5
FFT . . . . . . . . . . . . . . . . . . . . B-1
field strength. . . . . . . . . . . . . . . . 5-8
fixed CW . . . . . . . . . . . . . . . . . 2-11
FlexCal . . . . . . . . . . . . . . 2-15, 2-104
framing . . . . . . . . . . . . . . . 2-81, 2-87
frequency . . . . . . . . . . . . . . . . . 2-10
error. . . . . . . . . . . . . . . . . 14-4
range . . . . . . . . . . . . . . . . . 1-1
GG.821 . . . . . . . . . . . . . . . . 9-2, 10-2
GPS . . . . . . . . . . . . . . . . . . . . 1-1
grounding . . . . . . . . . . . . . . . . . 2-1
GSM . . . . . . . . . . . . . . . . . . . 14-1
Hhard keys. . . . . . . . . . . . . . . . . . 2-5
HDB3. . . . . . . . . . . . . . . . . . . 2-87
HDSL . . . . . . . . . . . . . . . . . . . 9-3
histogram . . . . . . . . . . . . . . . . . 2-82
hold . . . . . 2-7, 2-20, 2-38, 2-42, 2-98, 3-12
IIn Service Testing
E1 . . . . . . . . . . . . . . . . . . 10-3
T1 . . . . . . . . . . . . . . . . . . 9-4
InstaCal . . . . . . . . . . . 1-14, 2-103, 3-2
integration bandwidth . . . . . . . 2-21, 5-12
interference analysis . . . . . . . . 2-21, 15-1
interference analyzer . . . . . . . . . . . 15-1
isolation . . . . . . . . . . . . . . . . . 11-1
ITU-T. . . . . . . . . . . . . . . . . . . 10-1
Kkeys
hard . . . . . . . . . . . . . . . . . 2-5
soft . . . . . . . . . . . . . . . . . . 2-7
Llanguage . . . . . . . . . . . . . . 2-15 - 3-16
LEC . . . . . . . . . . . . . . . . . . . . 9-1
limits . . . . . . . . . . . . . . . . 2-13, 3-17
line sweep . . . . . . . . . . . . . . . . . 4-1
loopback . . . . . . . . . . . . . . 2-83, 9-11
Mmaintenance . . . . . . . . . . . . . . . 1-13
markers. . . . . . . . . . . . . . . 3-16, 19-5
mask . . . . . . . . . . . . . . . . 18-4, 18-7
measurements
cable and antenna . . . . . . . . . . 4-1
channel power . . . . . . . . . . . 5-11
E1. . . . . . . . . . . . . . . . . . 10-1
field strength . . . . . . . . . . . . . 5-8
power. . . . . . . . . . . . 6-1, 7-1, 8-1
Spectrum Analyzer . . . . . . . . . 3-10
T1 . . . . . . . . . . . . . . . . . . 9-1
memory . . . . . . . . . . . . . . . . . . 2-7
metafile . . . . . . . . . . . . . . . . . . 19-6
MSC . . . . . . . . . . . . . . . . . 9-1, 10-1
NNIU . . . . . . . . . . . . . . . . . 2-82, 9-2
Index-2

OOBW. . . . . . . . . . . . . . . . . . . . 5-9
occupied bandwidth . . . . . . . . . 5-9, 14-4
offset . . . . . . . 2-19, 2-30, 2-38, 2-52, 3-6
OSL . . . . . . . . . . . . . . . . . 2-15, 3-2
OTA . . . . . . . . . . . . . . 1-1, 2-76, 13-1
Out-Of-Service Testing
E1 . . . . . . . . . . . . . . . . . . 10-8
T1 . . . . . . . . . . . . . . . . . . 9-7
Ppattern
BERT . . . . . . . . . . . . . . . . 2-81
sync . . . . . . . . . . . . 9-2, 9-7, 10-2
PCM30 . . . . . . . . . . . . . . . . . . 2-87
PCM30 CRC . . . . . . . . . . . . . . . 2-87
PCM31 . . . . . . . . . . . . . . . . . . 2-87
PCM31 CRC . . . . . . . . . . . . . . . 2-87
pilot . . . . . . . . . . . . . . . . 13-3, 18-3
plot overlay. . . . . . . . . . . . . . . . 19-5
PN . . . . . . . . . . . . . . . . . 13-2 - 18-3
power meter
high accuracy . . . . 1-1, 1-8, 2-104, 8-1
power monitor . . . . . . . . . . . . . . . 1-1
power sensor. . . . . . . . . . . . . . . . 1-5
PP2S . . . . . . . . . . . . . . . . 13-3, 18-3
preamplifier . . . 2-19, 2-52, 5-3, 13-2 - 18-3
printers . . . . . . . . . . . . . . . 1-2, 3-19
propagation velocity . . . . . . . . . . . 2-10
Qquick page . . . . . . . . . . . . . . . . 13-4
RRAI . . . . . . . . . . . . . . . . . . . . 2-82
RBW. . . . . . . . . . 2-19, 2-42, 2-54, 3-11
reference level . . . . . 2-19, 2-41, 2-51, 5-2
relative power . . . . . . . . . 2-30, 2-38, 6-5
repeater . . . . . . . . . . . . . . . . . . 11-1
resolution . . . . . . . . . . . . . . 2-11, 4-7
resolution bandwidth . 2-19, 2-42, 2-54, 3-11,5-1
return loss . . . . . . . . . . . . . . . 4-2, 4-8
RF detector . . . . . . . . . . . . . . . . 1-5
rho . . . . . . . . . . . . . . . . . . . . 13-5
RMS. . . . . . . . . . . 2-30, 3-12, 5-11, 6-1
RS232 . . . . . . . . . . . . . . . 2-2 - 19-3
Ssampling . . . . . . . . . . . . . . . . . 2-20
scale . . . . . . . . . . . . . . . . . . . . 3-8
self test . . . . . . . . . . . . 2-15, 2-99, 3-1
serial interface . . . . . . . . . . . . . . 19-3
service centers . . . . . . . . . . . . . . 1-15
signal generator . . . . . . . . . . . . . 17-1
signal standard . 2-18, 2-37, 2-51, 2-62, 3-11,5-7, 6-1 - 13-2, 18-2
Smith Chart . . . . . . . . . . . . . . . 19-10
soft keys . . . . . . . . . . . . . . . . . . 2-7
Software Tools . . . . . . . . . . . . . . 19-1
span . . . . . . . . . . . 2-18, 3-10, 5-12, 6-1
specifications . . . . . . . . . . . . . . . 1-6
spectrogram . . . . . . . . . . . . 2-52, 15-1
spreadsheet . . . . . . . . . . . . . . . . 19-1
SSB. . . . . . . . . . . . . . . . . . . . 5-15
static . . . . . . . . . . . . . . . . . . . 1-14
sweep . . . . . . . . . . . . . . . . 3-12, 5-2
SWR. . . . . . 1-1, 2-101, 3-8, 4-2, 4-6, 19-3
symbols. . . . . . . . . . . . . . . . . . 2-98
sync
delta. . . . . . . . . . . . . . . . . 13-4
frame . . . . . . . . . . . 9-4, 9-7, 10-3
pattern . . . . . . . . . . . . . . 9-5, 9-7
TT1 . . . . . . . . . . 1-2, 1-10, 2-2, 2-80, 9-1
Tau . . . . . . . . . . . . . . . . . . . . 13-3
timing . . . . . . . . . . . . . . . 13-2 - 18-3
trace overlay . . . . . . . . . 2-11, 19-1, 19-5
transmission measurement . . . . . . . . 11-1
trigger . . . . . . . . . . . . . . . . . . 2-22
external . . . . . . . . . . . . . . . 2-2
Index-3

single sweep . . . . . . . . . . . . . 2-7
video . . . . . . . . . . . . 2-22, 2-102
TSC. . . . . . . . . . . . . . . . . . . . 14-4
Uunits . . . . . . . . . . . 2-19, 2-52, 3-15, 6-5
USB . . . . . . . . . . . . . . . . . . . 19-1
UTC . . . . . . . . . . . . . . . . . . . 12-1
VVBW. . . . . . . . . . 2-19, 2-42, 2-54, 3-11
See video bandwidth
verification . . . . . . . . . . . . . . . . 1-14
video bandwidth . 2-19, 2-42, 2-54, 3-11, 5-2
volume . . 2-22, 2-53, 2-83, 2-88, 5-16, 15-4
Vpp . . . . . . . . . . . . . . . . . 9-4, 10-3
WWalsh codes . . . . . . . . . . . . . . . 13-3
windowing . . . . . . . . . . . . . 2-11, B-1
Windows . . . . . . . . . . . . . 19-1 - 19-2
XXdB . . . . . . . . . . . . . . . . . . . . 5-9
Yyellow alarm . . . . . . . . . . . . . . . 2-82
Zzero span . . . . . . . . . . . 1-6, 2-18, 2-102
zoom . . . . . . . . . . . . . . . . . . . 2-21
Index-4


