

Economic Freedom of the World: 2012 Annual Report
James Gwartney, Florida State UniversityRobert Lawson, Southern Methodist UniversityJoshua Hall, Beloit College
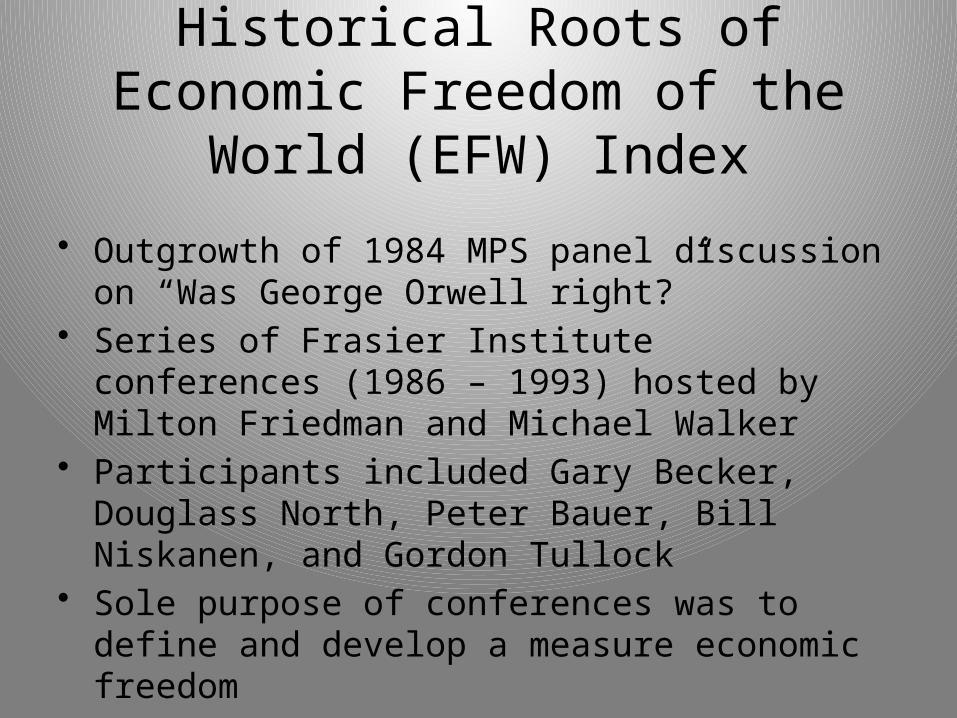
Historical Roots of Economic Freedom of the World (EFW) Index
• Outgrowth of 1984 MPS panel discussion on “Was George Orwell right?”
• Series of Frasier Institute conferences (1986 – 1993) hosted by Milton Friedman and Michael Walker
• Participants included Gary Becker, Douglass North, Peter Bauer, Bill Niskanen, and Gordon Tullock
• Sole purpose of conferences was to define and develop a measure economic freedom


Why will freer economies be more prosperous?
• Growth is the result of gains from trade, entrepreneurship, and investment.
• In a market economy, profit and loss provide people with a strong incentive to engage in productive activities and refrain from counterproductive ones
• Politically-directed economies do not have anything like profit and loss. Political allocation will lead to favoritism, cronyism and lots of counterproductive activities.

Methodology• 144 countries• 42 variables grouped into 5 areas• Time Series: 1970, 75, 80, 85, 90, 95, and 2000-2010• 0-10 rating scale with 10 indicating more economic
freedom• Data-driven index
– World Bank– IMF– World Economic Forum– WTO
• Transparency throughout
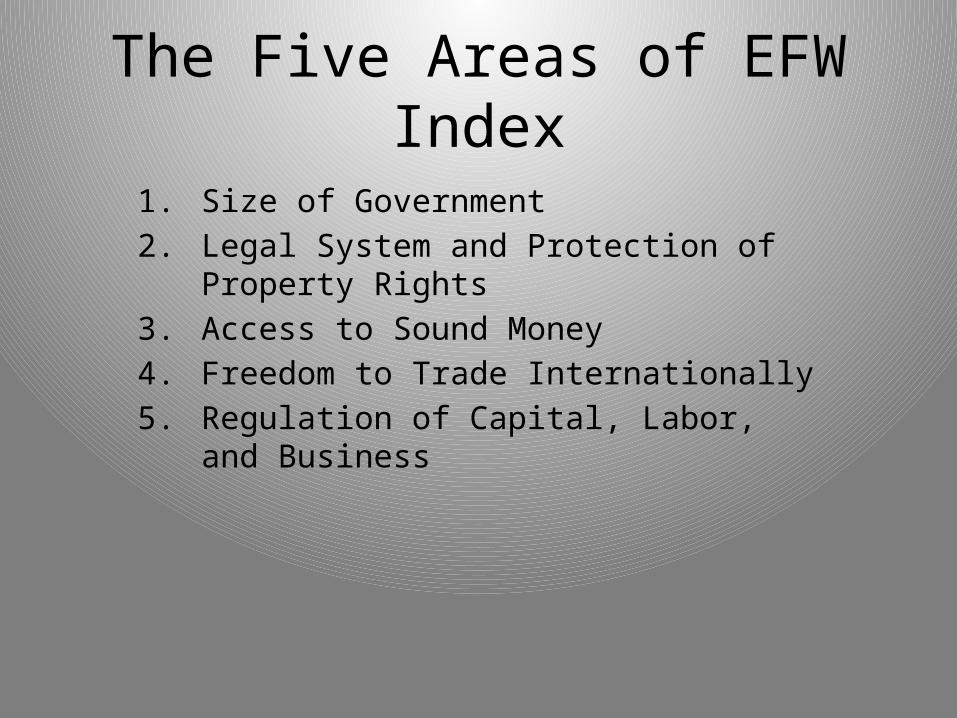
The Five Areas of EFW Index
1. Size of Government2. Legal System and Protection of Property
Rights3. Access to Sound Money4. Freedom to Trade Internationally5. Regulation of Capital, Labor, and Business

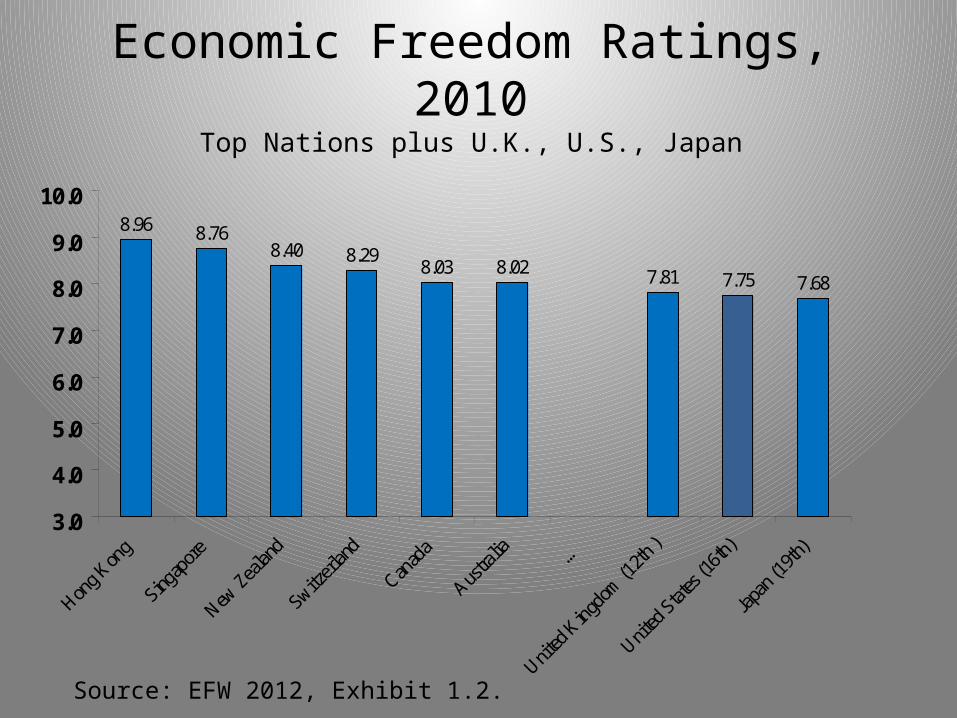
8.96 8.768.40 8.29 8.03 8.02 7.81 7.75 7.68
3.0
4.0
5.0
6.0
7.0
8.0
9.0
10.0
Hong K
ong
Singap
ore
New Zeal
and
Switzerl
and
Canad
a
Austral
ia …
United
King
dom (1
2th )
United
States
(16th)
Japan
(19th
)
Source: EFW 2012, Exhibit 1.2.
Economic Freedom Ratings, 2010Top Nations plus U.K., U.S., Japan

7.75 7.57 7.406.81 6.79
6.49 6.37 6.37 6.25
3.0
4.0
5.0
6.0
7.0
8.0
9.0
10.0
United
States
(16th)
German
y (28
th)
France
(47th)
Italy
(81st)
Greece
(82nd
)
Russia
(97th)
Brazil (
105th
)
China (
105th)
India (1
11th)
Source: EFW 2012, Exhibit 1.2.
Economic Freedom Ratings, 2010Select Nations

7.93 7.79 7.75 7.63 7.60
3.0
4.0
5.0
6.0
7.0
8.0
9.0
10.0
Finlan
d (8th
)
Denmark
(15th
)
United
States
(16th)
Norway
(23th
)
Sweden
(27th
)
Source: EFW 2012, Exhibit 1.2.
Economic Freedom Ratings, 2010Scandinavian Nations plus U.S.

7.85 7.61 7.46 7.36
6.395.81 5.80
3.98
3.0
4.0
5.0
6.0
7.0
8.0
9.0
10.0
Chile (
11th)
Peru (2
6th)
Panam
a (34
th)
Costa R
ica (4
4nd) …
Bolivia
(103
th)
Argentin
a (12
5th)
Ecuad
or (12
6th )
Venezu
ela (1
44th)
Source: EFW 2012, Exhibit 1.2. For more information on Latin America, see Chapter 3.
Economic Freedom Ratings, 2010Select Latin American Nations

Economic Freedom, 1980-2010*
Canada v. U.S.
7.9
8.1
8.4
8.5
8.7
8.2
7.7 7.87.7
7.8
8.1 8.1
8.4 8.3
8.1 8.1
7.0
7.5
8.0
8.5
9.0
1980 1985 1990 1995 2000 2005 2009 2010
United StatesCanada
Source: EFW 2012, pp. 52, 166. *Chain-linked data.

The Rise and Fall of Economic Freedom in the U.S.
1980 1990 2000 2008 20105
6
7
8
9
10
1. Govt2. Legal3. Money4. Trade5. Regulation
Source: EFW 2012, page 166.

The Rise and Fall…Selected Components of Areas 1 &2
2000 2005 20100
1
2
3
4
5
6
7
8
9
10
1A. Govertment Cons.1B. Transfers/Subsidies2A. Judicial Independence2B. Impartial Courts2C. Property Rights2D. Military Influence2E. Legal Integrity
Source: EFW 2012, page 166.

The Rise and Fall…Selected Components of Areas 4 &5
2000 2005 20100
1
2
3
4
5
6
7
8
9
10
4B. Non-tariffs4D. Capital Controls5Aii. Private Credit5Cii. Bureaucracy5Civ. Extra Payments
Source: EFW 2012, page 166.

Forecasting Growth• According to our empirical estimates, a decline in the EFW
index is associated with a reduction in average annual per capita GDP growth.
• The decline in the U.S.’s EFW rating between 2000 and 2010 was 0.89 units.
• We estimate the annual U.S. growth rate will be 1.25 – 1.75 percentage points lower during 2000-2020.
• Growth during 1980-2000 was 2.2%. Therefore, we estimate that during 2000-2020 the annual growth rate will be 0.45 - 0.95%.– Interestingly, actual growth from 2000-2010 was 0.7%.
Source: Gwartney et al. 2006. “Institutions and the Impact of Investment on Growth.” Kyklos 59(2): 255-273.
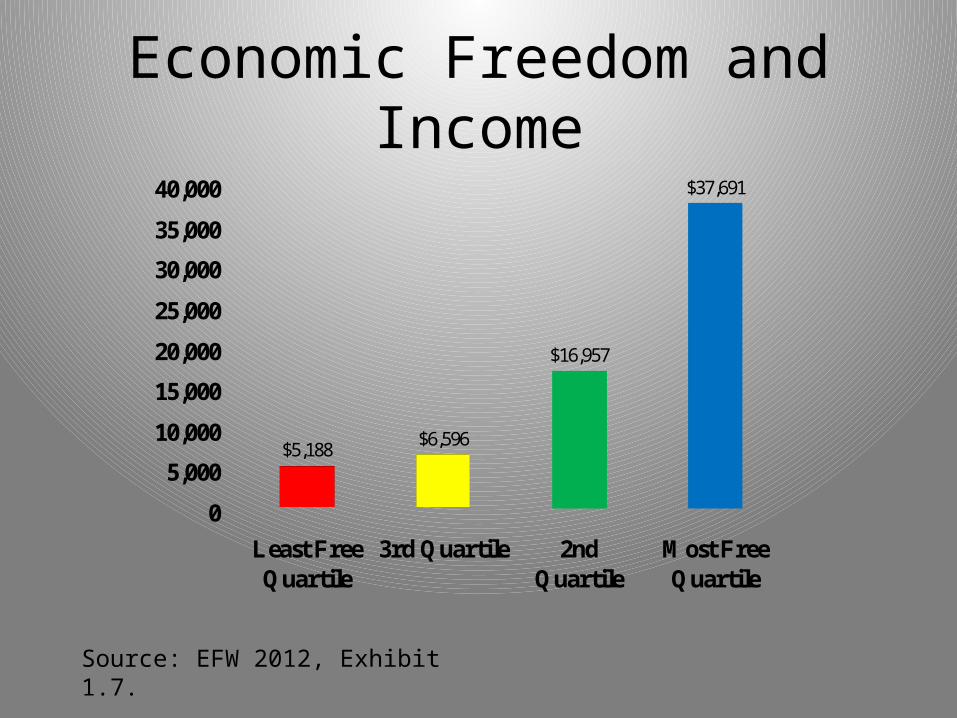
Economic Freedom and Income
Source: EFW 2012, Exhibit 1.7.
$6,596
$16,957
$37,691
$5,188
0
5,000
10,000
15,000
20,000
25,000
30,000
35,000
40,000
Least FreeQuartile
3rd Quartile 2ndQuartile
Most FreeQuartile

Economic Freedom and Growth
Source: EFW 2012, Exhibit 1.8.

Economic Freedom and Income Level of Poorest 10%
Source: EFW 2012, Exhibit 1.10.

Economic Freedom and Life Expectancy
Source: EFW 2012, Exhibit 1.11.

Economic Freedom and Infant Mortality Rate
Source: World Bank World Development Indicators 2011.
Least Free Quartile
3rd Quar-tile
2nd Quar-tile
Most Free Quartile
0.0
10.0
20.0
30.0
40.0
50.0
60.0
70.060.6
21.217.2
5.8
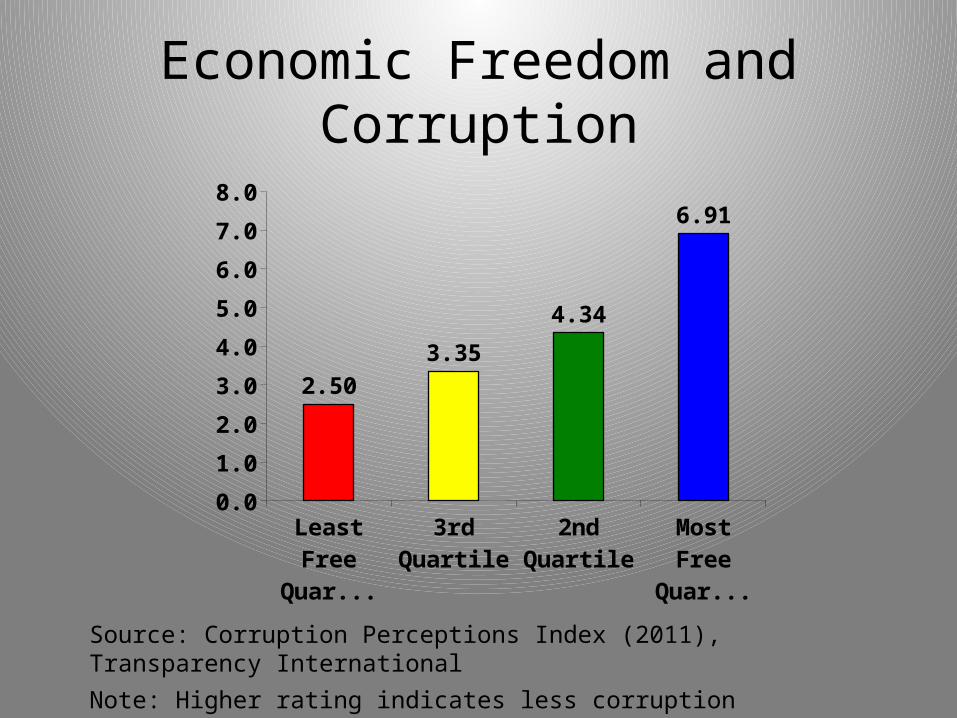
Economic Freedom and Corruption
Source: Corruption Perceptions Index (2011), Transparency InternationalNote: Higher rating indicates less corruption
Least Free Quartile
3rd Quar-tile
2nd Quar-tile
Most Free Quartile
0.0
1.0
2.0
3.0
4.0
5.0
6.0
7.0
8.0
2.503.35
4.34
6.91


