

APPROVED: John W. Kensinger, Major Professor Imre Karafiath, Committee Member Don MacDonald, Committee Member Margie A. Tieslau, Committee Member Niranjan Tripathy, Committee Member James Conover, Chair of Department of
Finance, Insurance, Real Estate, and Law
O. Finley Graves, Interim Dean of the College of Business
Sandra L. Terrell, Dean of the Robert B. Toulouse School of Graduate Studies
CHANGES IN TRADING VOLUME AND RETURN VOLATILITY ASSOCIATED
WITH S&P 500 INDEX ADDITIONS AND DELETIONS
Cheng-I Eric Lin, B.S.B.A., M.B.A
Dissertation Prepared for the Degree of
DOCTOR OF PHILOSOPHY
UNIVERSITY OF NORTH TEXAS
December 2007
Lin, Cheng-I Eric, Changes in Trading Volume and Return Volatility Associated
with S&P 500 Index Additions and Deletions, Doctor of Philosophy (Finance), December
2007, 73 pp., 14 tables, 12 figures, references, 53 titles.
When a stock is added into the S&P 500 Index, it is automatically “cross-listed” in
the index derivative markets (i.e., S&P 500 Index futures and Index options). I examined
the effects of such cross-listing on the trading volume and return volatility of the
underlying component stocks. Traditional finance theory asserts that futures and “cash”
markets are connected by arbitrage mechanism that brings both markets to equilibrium.
When arbitrage opportunities arise, arbitrageurs buy (sell) the index portfolio and take
short (long) positions in the corresponding index derivative contracts until prices return
to theoretical levels. Such mechanical arbitrage trading tends to create large order
flows that could be difficult for the market to absorb, resulting in price changes.
Utilizing a list of S&P 500 index composition changes occurring over the period
September 1976 to December 2005, I investigated the market-adjusted volume turnover
ratios and return variances of the stocks being added to and deleted from the S&P 500,
surrounding the effective day of index membership changes. My primary finding is that,
after the introduction of the S&P 500 index futures and options contracts, stocks added
to the S&P 500 experience significant increase in both trading volume and return
volatility. However, deleted stocks experience no significant change in either trading
volume or return volatility. Both daily and monthly return variances increase following
index inclusion, consistent with the hypothesis that derivative transactions
“fundamentally” destabilize the underlying securities.
I argue that the increase in trading volume and return volatility may be attributed

to index arbitrage transactions as derivative markets provide more routes for index
arbitrageurs to trade. Other index trading strategies such as portfolio insurance and
program trading may also contribute to the results. On the other hand, a deleted stock is
not associated with changes in trading volume and volatility since it represents an
extremely small fraction of the market value-weighted index portfolio, and the influence
of index trading strategies becomes slight for these shares. Furthermore, evidence is
provided that trading volume and return volatility are positively related.

ii
Copyright 2007
by
Cheng-I Eric Lin

iii
TABLE OF CONTENTS
Page
LIST OF TABLES............................................................................................................iv
LIST OF FIGURES.......................................................................................................... v
Chapters 1. INTROCUTION.......................................................................................... 1 2. S&P 500 INDEX CHANGES AND INDEX TRADING STRATEGIES......... 8 3. LITERATURE REVIEW ........................................................................... 19
Price Pressure............................................................................... 20 Imperfect Substitutes .................................................................... 21 Liquidity and Trading Costs........................................................... 23 Information Content....................................................................... 24 Market Segmentation and Investor Awareness............................. 26 Index Derivatives and Underlying Security Volatility ..................... 28
4. HYPOTHESES DEVELOPMENT ............................................................ 33
Trading Volume Effect................................................................... 34 Volatility Effect............................................................................... 35 Systematic Risk Effect .................................................................. 35
5. SAMPLE AND DATA ............................................................................... 37 6. METHODOLOGY ................................................................................... .42
Abnormal Volume Measurement................................................... 42 Volatility Measurement.................................................................. 43 Systematic Risk............................................................................. 46
7. RESULTS ................................................................................................ 48
Trading Volume Effect................................................................... 48 Volatility Effect............................................................................... 51 Systematic Risk Measures............................................................ 56
8. CONCLUSION......................................................................................... 68
REFERENCES.............................................................................................................. 70
iv
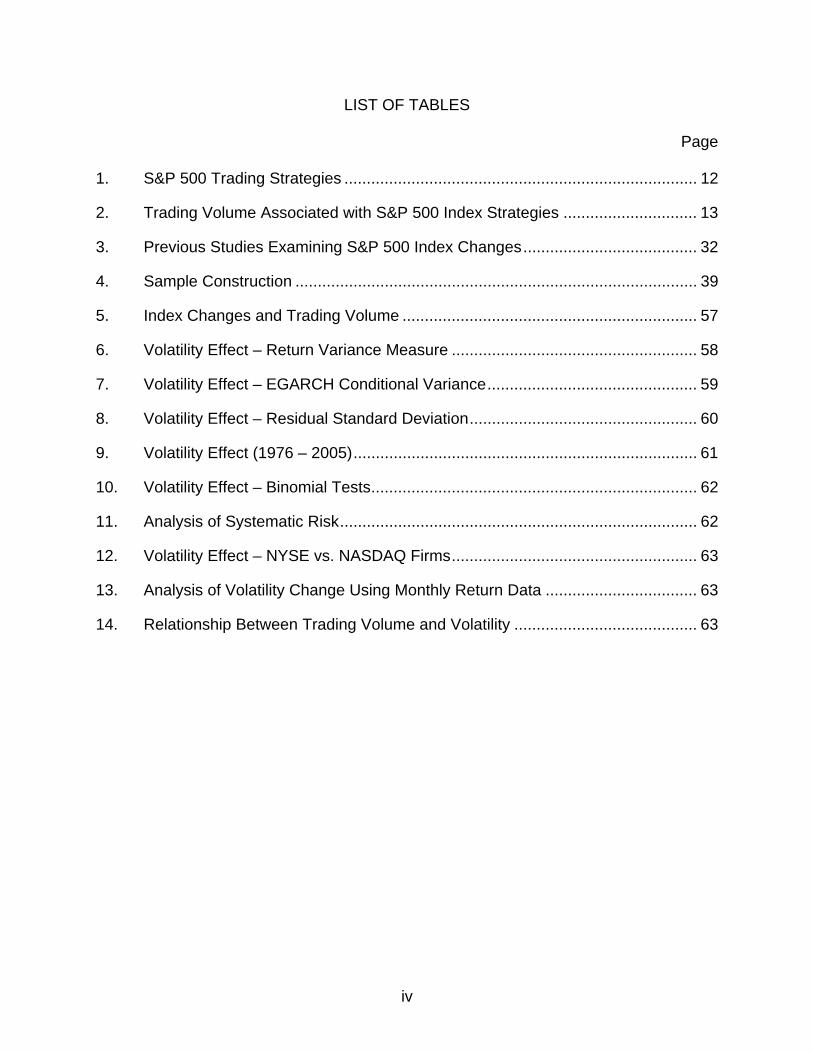
LIST OF TABLES
Page
1. S&P 500 Trading Strategies ............................................................................... 12
2. Trading Volume Associated with S&P 500 Index Strategies .............................. 13
3. Previous Studies Examining S&P 500 Index Changes....................................... 32
4. Sample Construction .......................................................................................... 39
5. Index Changes and Trading Volume .................................................................. 57
6. Volatility Effect – Return Variance Measure ....................................................... 58
7. Volatility Effect – EGARCH Conditional Variance............................................... 59
8. Volatility Effect – Residual Standard Deviation................................................... 60
9. Volatility Effect (1976 – 2005)............................................................................. 61
10. Volatility Effect – Binomial Tests......................................................................... 62
11. Analysis of Systematic Risk................................................................................ 62
12. Volatility Effect – NYSE vs. NASDAQ Firms....................................................... 63
13. Analysis of Volatility Change Using Monthly Return Data .................................. 63
14. Relationship Between Trading Volume and Volatility ......................................... 63

v
LIST OF FIGURES
Page
1. Index Additions – Mean Abnormal Returns around Effective Day (1986-2005) ........................................................................................................................... 14
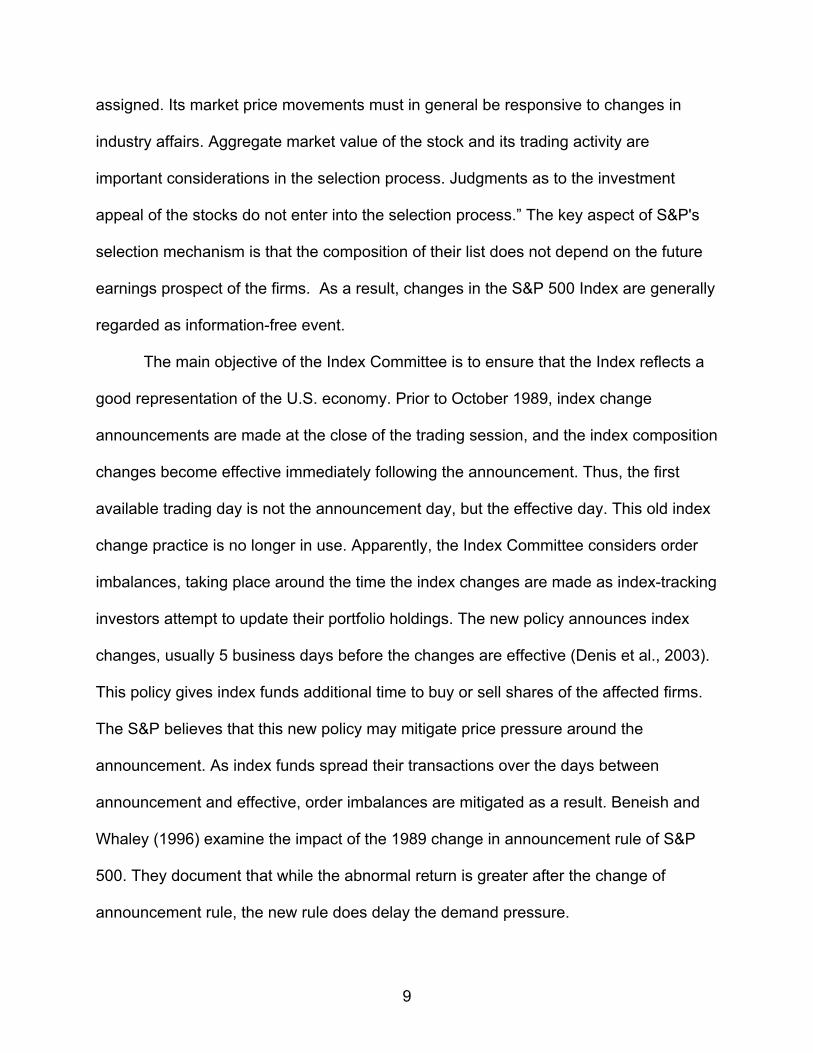
2. Index Additions – Mean Abnormal Returns around Effective Day (1976-1985) ........................................................................................................................... 15
3. Index Deletions – Mean Abnormal Returns around Effective Day (1986-2005) ........................................................................................................................... 16
4. Index Deletions – Mean Abnormal Returns around Effective Day (1976-1985) ........................................................................................................................... 17
5. Index Changes Announcement and Effective Dates .......................................... 18
6. Hypotheses Development Roadmap .................................................................. 36
7. Number of Annual Index Changes (1976-1985) ................................................. 40
8. Number of Annual Index Changes (1986-2005) ................................................. 41
9. Index Additions – Scatter Plot of MSDR (1976-1985)......................................... 64
10. Index Additions – Scatter Plot of MSDR (1986-2005)......................................... 65
11. Index Deletions – Scatter Plot of MSDR (1976-1985) ........................................ 66
12. Index Deletions – Scatter Plot of MSDR (1986-2005) ........................................ 67

CHAPTER 1
INTRODUCTION
Previous studies investigating the effects of index composition changes suggest
that the risk of the added or deleted firm does not change around the announcement,
and thus, the observed price response to the event of index changes cannot be
attributed to change in risk.1 Dhillon and Johnson (1991) study the prices of options for
companies added to the S&P 500 index, during the period 1984–1988. The results
indicate that, around the announcement date, call prices increase but put prices decline,
leading to inconclusive evidence as to whether return variances for the added firms
change. Studies in index composition changes following Dhillon and Johnson (1991)
have generally regarded index change announcements as non-volatility-induced events.
Trading in S&P 500 futures and options were introduced in 1982 and 1983,
respectively. The popularity of these contracts soared soon after their introductions [see
Vijh (1994)]. The implied dollar trading volume in these contracts exceeded that in the
cash securities. Harris (1989, p. 1155) reported that “by 1987, the average daily dollar
volume in the S&P 500 futures contracts alone exceeded the dollar volume of cash S&P
500 trade by a factor of about two, while the dollar value of the daily net change in total
open interest is about 8% of S&P 500 stock dollar volume.“
When a stock is added into an index such as the S&P 500, it is automatically
“cross-listed” in the index derivative markets such as the S&P 500 index futures and
index options markets. Prices of index futures and options are co-integrated with the
1 Change in risk is not found to be linked to the excess returns around index changes. There are several competing hypotheses explaining the market reactions to the announcement (effective) of index compositions. They include price pressure, imperfect substitutes, liquidity, information content, and investor recognition. A recent analytical review of the related studies can be found in Elliott, Van Ness, Walker, and Warr (2006).
1

stock market. They are linked to the prices of underlying securities by index arbitrage.
Grossman (1988) contends that when cash markets are overpriced (underpriced)
relative to the derivative markets, arbitrageurs would sell (buy) the cash assets and long
(short) the index derivatives. The execution of such index arbitrage transactions
continue until both markets reach equilibrium. The existence of index derivatives
contracts creates more routes for arbitrageurs to trade. The persistent order flows from
arbitrage transactions are likely to have a permanent effect on the trading volume and
return variability of the component stocks as arbitrage trading takes place. This
suggests that the event of “cross-listing” itself implies that a stock is more likely to be
involved in index arbitrage trades. On the other hand, the effect of index arbitrage has
little of no effect on non-basket shares.
There is, in general, a positive relationship between trading volume and the
magnitude of price changes in the financial markets [see, for example, Karpoor (1987)
and Gallant et al. (1992)]. Stoll and Whaley (1987) point out the cash settlement feature
of index futures contracts, requiring index arbitrageurs to unwind positions in the spot
index securities. The “unwinding” of index arbitrage positions, instead of the traditional
delivery settlement method, tends to induce price pressure that temporarily causes price
movements in the component shares. Short-term price changes, resulted from program
trading2 transactions that buy or sell a large portfolio of component stocks (block
trades), are inevitable in the presence of index-based trading programs.
Stoll and Whaley (1987) look at market-wide trading activities and stock price
changes around derivative expiration days. They find that trading volume and volatility
2 The introduction of the S&P 500 ETF in 1993 allows index arbitrageurs to trade the index portfolio more easily. Before 1993, most index arbitrage transactions are carried out using program trading.
2
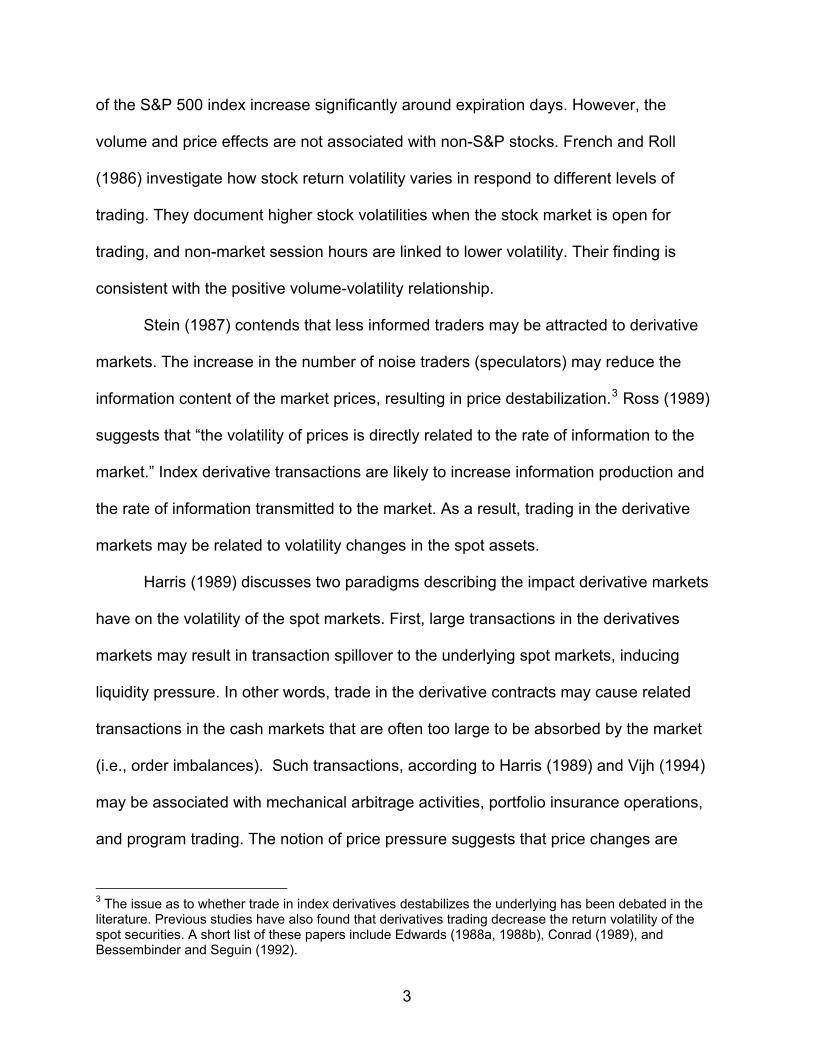
of the S&P 500 index increase significantly around expiration days. However, the
volume and price effects are not associated with non-S&P stocks. French and Roll
(1986) investigate how stock return volatility varies in respond to different levels of
trading. They document higher stock volatilities when the stock market is open for
trading, and non-market session hours are linked to lower volatility. Their finding is
consistent with the positive volume-volatility relationship.
Stein (1987) contends that less informed traders may be attracted to derivative
markets. The increase in the number of noise traders (speculators) may reduce the
information content of the market prices, resulting in price destabilization.3 Ross (1989)
suggests that “the volatility of prices is directly related to the rate of information to the
market.” Index derivative transactions are likely to increase information production and
the rate of information transmitted to the market. As a result, trading in the derivative
markets may be related to volatility changes in the spot assets.
Harris (1989) discusses two paradigms describing the impact derivative markets
have on the volatility of the spot markets. First, large transactions in the derivatives
markets may result in transaction spillover to the underlying spot markets, inducing
liquidity pressure. In other words, trade in the derivative contracts may cause related
transactions in the cash markets that are often too large to be absorbed by the market
(i.e., order imbalances). Such transactions, according to Harris (1989) and Vijh (1994)
may be associated with mechanical arbitrage activities, portfolio insurance operations,
and program trading. The notion of price pressure suggests that price changes are
3 The issue as to whether trade in index derivatives destabilizes the underlying has been debated in the literature. Previous studies have also found that derivatives trading decrease the return volatility of the spot securities. A short list of these papers include Edwards (1988a, 1988b), Conrad (1989), and Bessembinder and Seguin (1992).
3

transitory and may be attributed to temporary trading imbalances, induced by index-
based trading programs. This argument implies that return volatility measured over
short intervals (such as daily) will be greater for the added stocks subsequent to the
effective day, but that return volatility estimated over longer intervals (i.e., weekly and
monthly) will be the same. This prediction is consistent with the price pressure
hypothesis in that stock prices revert close to pre-announcement levels (see Harris and
Gurel, 1986).
The second paradigm, according to Harris (1989), asserts that “trading in futures
and options markets fundamentally destabilizes the value formation process in cash
markets.” Under this framework, both short and long interval measures of return
volatility should be larger after a stock is officially included in the index portfolio. In other
words, large ongoing transactions, resulting from arbitrage, program trading, and
portfolio insurance operations, cause permanent changes in prices of the underlying
securities. The change in long interval volatility measures may be associated with long-
run demand shift of the component stocks4 [see Shleifer (1986)].
In this study, I examine trading volume and security return volatility for firms that
are added to or deleted from the S&P 500 index from September 1976 to December
2005. I am particularly interested in the trading volume and volatility of index additions
and deletions around the effective date (the first day when the actual change is reflected
in the index composition). To investigate the impact of index derivatives, the full sample
period is partitioned into two subperiods, covering the period September 1976 through
December 1985 and 1986 to 2005. This first subperiod is related to a period of relative
4 Almost all previous studies support the long-term downward sloping demand curves for stock hypothesis.
4

lower index derivative dollar volume since the S&P index futures (options) were not
available until 1982 (1983). Subsequent to the first subperiod, the dollar volume on the
index derivatives contracts reached record highs. Thus, the second subperiod focuses
on the effects of transactions such as index arbitrage, portfolio insurance, and program
trading. Our main goal is to determine whether the trading volume and volatility of the
added or deleted stocks are significantly different between the two subperiods.
Our approach is different from Harris’s (1989) in that our study does not require a
matching5 procedure which could induce potential measurement errors. Our study does
not require a comparable sample of non-S&P 500 companies. Instead, I directly
compare the volatilities of the same stocks before and after their index membership
changes. I can gauge the effects of index derivatives contracts without constructing a
sample of comparable non-S&P companies.
The key results of our empirical analysis include the following. First, I show that
stocks being added to the S&P 500 Index experience significantly higher trading volume
and return volatility (in both daily and monthly stock return series) following the effective
date. The increase in volume and return volatility is observed only during the second
subperiod (1986–2005). This finding suggests that the increase in volatility may be
related to heavy trading in the derivatives contracts. Second, for index deletions, there
is no significant change in either trading activity or return volatility in both subperiods.
Third, the increase in variance became significant starting in 1986 and remained
significant in most of the following years thereafter. This result is similar to that of Harris
(1989), who documents a positive difference between S&P 500 stock and non-S&P 500
5 Harris (1989) compares S&P 500 stock return volatilities to the volatilities of a matched set of stocks, after controlling for cross-sectional differences in firm attributes such as size, beta, and liquidity.
5

stock return volatilities, beginning in the year 1985. Fourth, I find strong evidence that
turnover changes are positively related to volatility changes. Finally, I find weak
evidence that a very small beta increase is associated with the added firms during the
second subperiods. The small shift in beta of 0.04 is statistically, but not economically,
significant. Furthermore, our results are independent of the methodologies I employ in
estimating return volatility.
I thus offer the following explanations for the empirical results. Trade in index
derivatives contracts has a fundamental effect (not a temporary effect) on the stock
return distribution of a security being included in the S&P 500 index. This is consistent
with the downward-sloping demand curves hypothesis. Firms removed from the index
experience no significant change in trading volume and return variance because the
market capitalization of these stocks generally becomes extremely small as they exit the
index. As a result, they are not (or perhaps minimally) affected by index trading.
Our study contributes to two groups of literature. First, I show that index additions
are associated with changes in risk. This result is particularly useful to option traders
and risk management programs. In additional, I provide further evidence in support of
the imperfect substitute hypothesis [Shleifer (1986)]. Second, our study adds additional
support that derivatives trading may “fundamentally” destabilize the underlying cash
securities.
The remainder of the dissertation is organized as follows: Chapter 2 provides
background information about S&P 500 Index composition changes as well as S&P 500
trading strategies. Chapter 3 reviews previous work related to S&P 500 Index changes
and the effect index trading strategies have on the volume and volatility of the
6

underlying securities. Chapter 4 develops hypotheses to be tested. Chapter 5
discusses the sample and data. Chapter 6 describes the empirical methodologies.
Chapter 7 presents the results, and finally Chapter 8 concludes.
7
CHAPTER 2
S&P500 INDEX CHANGES AND INDEX TRADING STRATEGIES
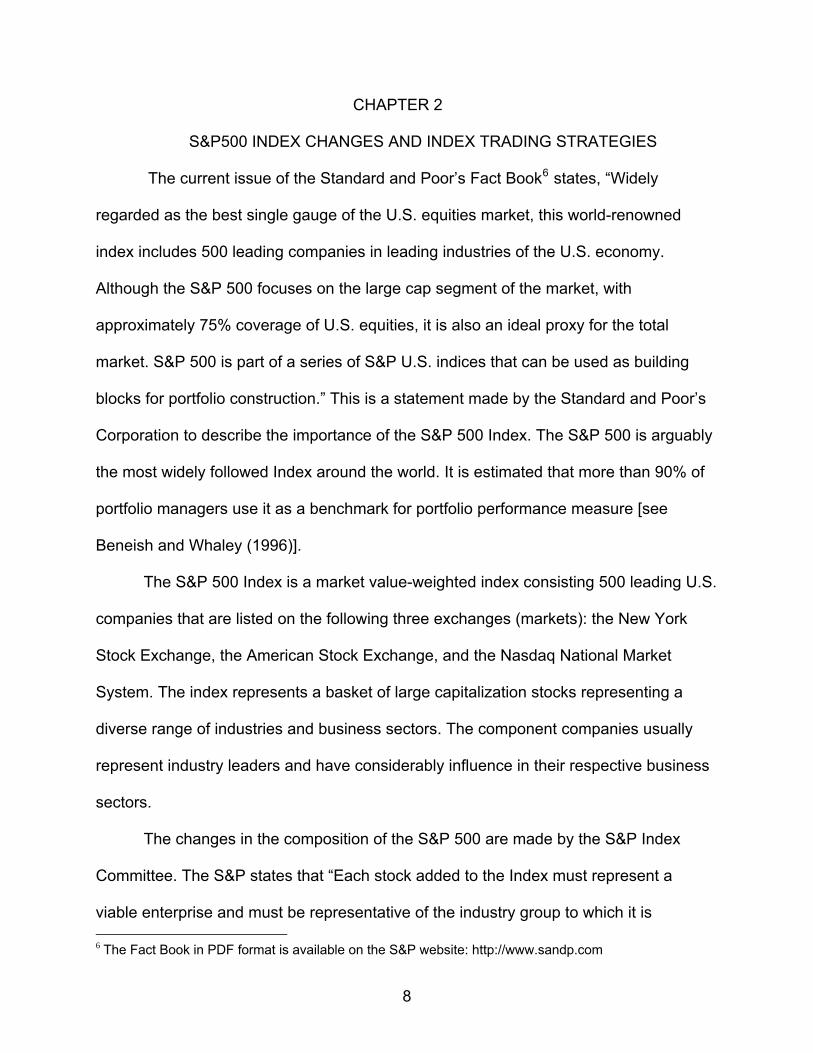
The current issue of the Standard and Poor’s Fact Book6 states, “Widely
regarded as the best single gauge of the U.S. equities market, this world-renowned
index includes 500 leading companies in leading industries of the U.S. economy.
Although the S&P 500 focuses on the large cap segment of the market, with
approximately 75% coverage of U.S. equities, it is also an ideal proxy for the total
market. S&P 500 is part of a series of S&P U.S. indices that can be used as building
blocks for portfolio construction.” This is a statement made by the Standard and Poor’s
Corporation to describe the importance of the S&P 500 Index. The S&P 500 is arguably
the most widely followed Index around the world. It is estimated that more than 90% of
portfolio managers use it as a benchmark for portfolio performance measure [see
Beneish and Whaley (1996)].
The S&P 500 Index is a market value-weighted index consisting 500 leading U.S.
companies that are listed on the following three exchanges (markets): the New York
Stock Exchange, the American Stock Exchange, and the Nasdaq National Market
System. The index represents a basket of large capitalization stocks representing a
diverse range of industries and business sectors. The component companies usually
represent industry leaders and have considerably influence in their respective business
sectors.
The changes in the composition of the S&P 500 are made by the S&P Index
Committee. The S&P states that “Each stock added to the Index must represent a
viable enterprise and must be representative of the industry group to which it is 6 The Fact Book in PDF format is available on the S&P website: http://www.sandp.com
8
assigned. Its market price movements must in general be responsive to changes in
industry affairs. Aggregate market value of the stock and its trading activity are
important considerations in the selection process. Judgments as to the investment
appeal of the stocks do not enter into the selection process.” The key aspect of S&P's
selection mechanism is that the composition of their list does not depend on the future
earnings prospect of the firms. As a result, changes in the S&P 500 Index are generally
regarded as information-free event.
The main objective of the Index Committee is to ensure that the Index reflects a
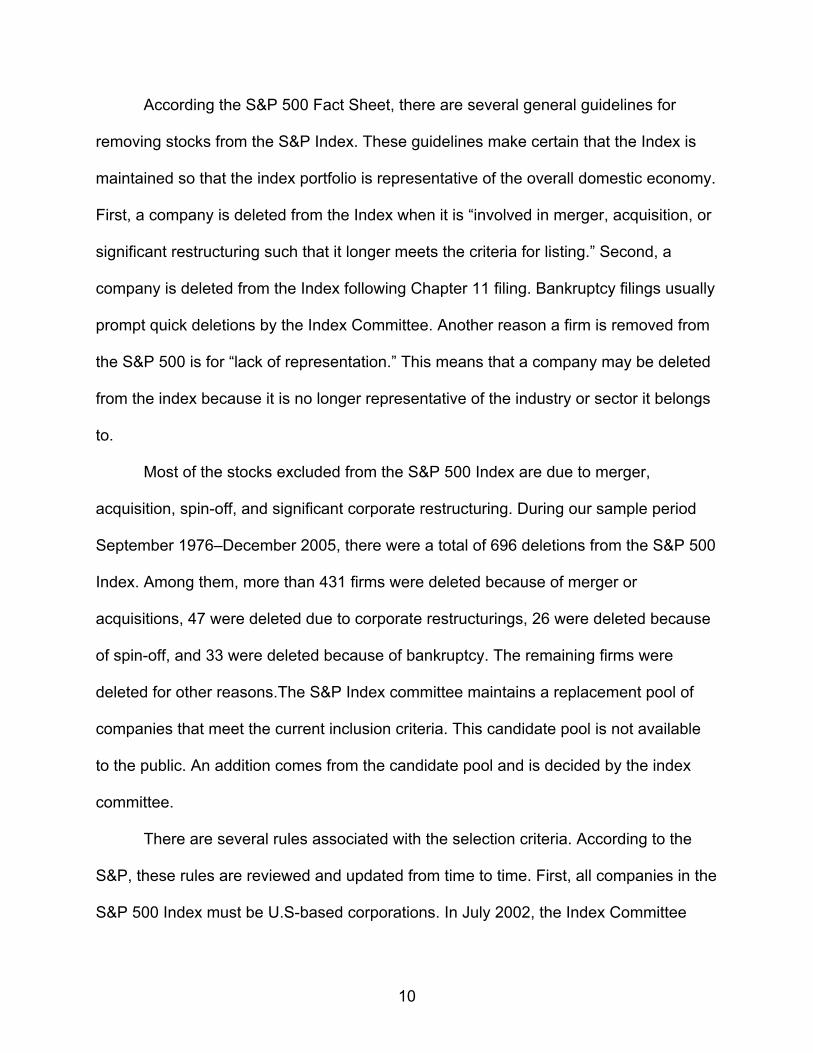
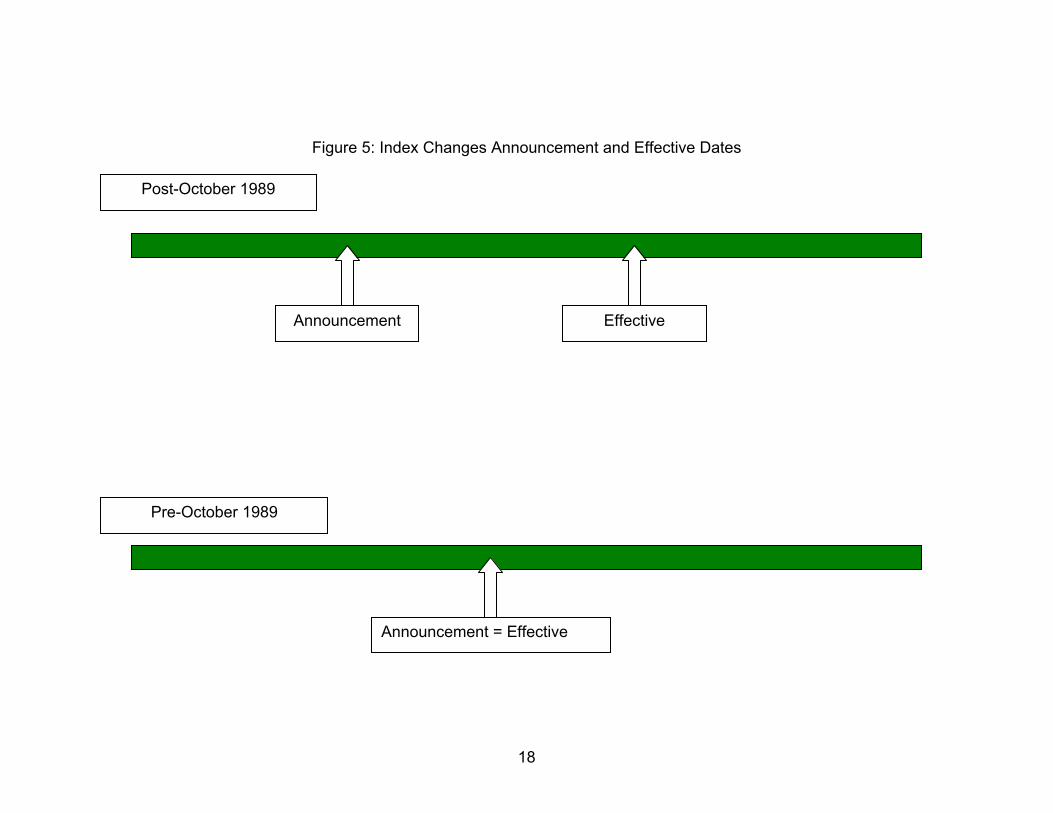
good representation of the U.S. economy. Prior to October 1989, index change
announcements are made at the close of the trading session, and the index composition
changes become effective immediately following the announcement. Thus, the first
available trading day is not the announcement day, but the effective day. This old index
change practice is no longer in use. Apparently, the Index Committee considers order
imbalances, taking place around the time the index changes are made as index-tracking
investors attempt to update their portfolio holdings. The new policy announces index
changes, usually 5 business days before the changes are effective (Denis et al., 2003).
This policy gives index funds additional time to buy or sell shares of the affected firms.
The S&P believes that this new policy may mitigate price pressure around the
announcement. As index funds spread their transactions over the days between
announcement and effective, order imbalances are mitigated as a result. Beneish and
Whaley (1996) examine the impact of the 1989 change in announcement rule of S&P
500. They document that while the abnormal return is greater after the change of
announcement rule, the new rule does delay the demand pressure.
9
According the S&P 500 Fact Sheet, there are several general guidelines for
removing stocks from the S&P Index. These guidelines make certain that the Index is
maintained so that the index portfolio is representative of the overall domestic economy.
First, a company is deleted from the Index when it is “involved in merger, acquisition, or
significant restructuring such that it longer meets the criteria for listing.” Second, a
company is deleted from the Index following Chapter 11 filing. Bankruptcy filings usually
prompt quick deletions by the Index Committee. Another reason a firm is removed from
the S&P 500 is for “lack of representation.” This means that a company may be deleted
from the index because it is no longer representative of the industry or sector it belongs
to.
Most of the stocks excluded from the S&P 500 Index are due to merger,
acquisition, spin-off, and significant corporate restructuring. During our sample period
September 1976–December 2005, there were a total of 696 deletions from the S&P 500
Index. Among them, more than 431 firms were deleted because of merger or
acquisitions, 47 were deleted due to corporate restructurings, 26 were deleted because
of spin-off, and 33 were deleted because of bankruptcy. The remaining firms were
deleted for other reasons.The S&P Index committee maintains a replacement pool of
companies that meet the current inclusion criteria. This candidate pool is not available
to the public. An addition comes from the candidate pool and is decided by the index
committee.
There are several rules associated with the selection criteria. According to the
S&P, these rules are reviewed and updated from time to time. First, all companies in the
S&P 500 Index must be U.S-based corporations. In July 2002, the Index Committee
10

removed all seven of the non-US companies from the S&P 500 Index. Second, the S&P
500 is a value-weighted (based on market capitalization) index. The minimum size
requirement is $4 billion. Third, S&P 500 index includes leading firms in leading
companies. Index additions usually come from leaders of an industry experiencing high
growth and growth potential.
Forth, closely-held companies are not included in the index. The public float
requirement is at least 50%. This ensures that shares are readily available to market
participants for trading. Fifth, liquidity measure as “the ratio of annual dollar value traded
to market capitalization for the company” should be at least 0.30. S&P Corporation
argues that liquidity is important as index trading strategies often create liquidity
burdens in the component stock trading. Lastly, component stocks must be operating
companies. “Close-end funds, holding companies, partnerships, investment vehicles
and royalty trusts are not eligible. Real Estate Investment Trusts (REITs) are eligible for
inclusion.”
I define S&P index-based trading strategies in a way similar to Vijh (1994). I also
include exchange-traded funds (ETFs) in our discussion of index trading. Previous
studies have documented the effect of index derivative products on the underlying asset
returns.
S&P 500 index futures (options) contracts started trading in April 1982 (March
1983). The S&P 100 index options also became available in 1983. According to the
S&P Corporation, the S&P 100 index consisting of the100 largest U.S. stocks captures
approximately “two-thirds of the market value of the S&P 500 index.” In 1993, Standard
and Poor’s introduces the S&P 500 exchange-trade funds (ETFs), also known as the
11

12
SPDR. This innovative security enables investors to buy and sell the index portfolio
more effectively. Before the introduction of the SPY, program trading had been the
feasible alternative. These index-based securities have become an important part of
U.S. financial markets. Vijh (1994) reported that the (implied) “trading volume in futures
and options exceeds the trading volume in stocks during every year since 1983.”
In the current issue of S&P 500 index fact book, there are more than a dozen
exchange-traded products with S&P 500 being the primary index. A sample of the S&P
500 index-based products that are exchanged-trade include: SPDR (American Stock
Exchange: SPY), iShare S&P 500 Index Fund (New York Stock Exchange: IVV), S&P
500 Index futures/options, S&P 500 sector SPDRs, S&P 500 sector futures/options.
Table 1: S&P 500 Index Trading Strategies
S&P 500 Index
Trading Strategy
Products
Name/Ticker
Exchange Traded Inception Date(s)
Index Futures S&P 500 Index
futures ®, E-Mini
S&P 500 Index
futures ®
CME
April 21, 1982
Index Options S&P 500 Index
options (SPX) ®,
S&P 100 Index
options (OEX) ®
CBOE, CME
March 11, 1983
Exchange Traded
Funds
SPDR (SPY) ®,
iShares SP 500
(IVV) ®
AMEX, NYSE,
CBOE
January 29, 1993
May 15, 2000,
Index Mutual Funds Vanguard 500
(VFINX) ®
Not Exchange
Traded
August 31, 1976

Table 2: Trading Volume Associated with S&P 500 Index Strategies Trading Volume Associated with S&P 500 Index Strategies Vijh (Review of Financial Studies, 1994, p. 220)
S&P 500 trading volumeS&P 500 trading volume S&P 100 trading
volume NYSE trading
volume
Index futures Index options Futures options Total Dollars
Index Options Stocks
Year Contracts Dollars Contracts Dollars Contracts Dollars Contracts Dollars Round lots
Dollars
1982 2935 161 − − − − 161 − − 16670 4951983 8069 678 14 1 281 24 703 10595 177 21845 7751984 12364 947 12 1 673 52 1000 64288 977 23309 7731985 15056 1444 8 1 1090 105 1550 90805 1686 27774 9811986 19505 2446 1683 42 1886 237 2725 113151 2684 36010 13891987 19045 2895 6205 187 1877 285 3367 101827 3044 48143 18891988 11354 1553 4817 132 735 101 1786 57433 1503 41118 13661989 10560 1679 6274 199 1162 185 2063 58371 1721 42022 1556
13

Figure 1: Additions – Mean Abnormal Returns around Effective Day (1986-2005)
-5 -4 -3 -2 -1 0 1 2 3 4 5 6 7 8 9 10 11 12 13 14 15
Day
-1.00
-0.50
0.00
0.50
1.00
1.50
2.00
Mean
Mean
_Abn
ormal_
Retur
n
14
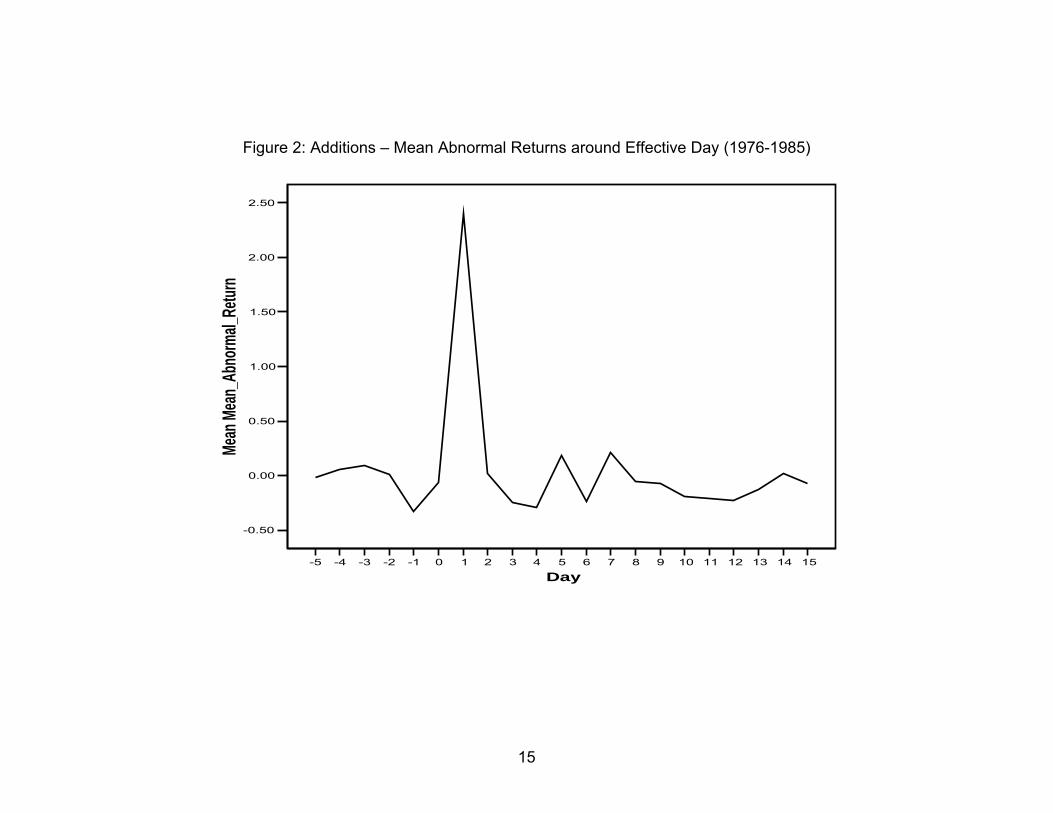
Figure 2: Additions – Mean Abnormal Returns around Effective Day (1976-1985)
-5 -4 -3 -2 -1 0 1 2 3 4 5 6 7 8 9 10 11 12 13 14 15
Day
-0.50
0.00
0.50
1.00
1.50
2.00
2.50
Mean
Mea
n_Ab
norm
al_Re
turn
15

Figure 3: Deletions – Mean Abnormal Returns around Effective Day (1986-2005)
-5 -4 -3 -2 -1 0 1 2 3 4 5 6 7 8 9 10 11 12 13 14 15
Day
-3.00
-2.00
-1.00
0.00
1.00
2.00
3.00
Mean
Mea
n_Ab
norm
al_Re
turn
16

Figure 4: Deletions – Mean Abnormal Returns around Effective Day (1976-1985)
-5 -4 -3 -2 -1 0 1 2 3 4 5 6 7 8 9 10 11 12 13 14 15
Day
-0.50
0.00
0.50
1.00
Mean
Mean
_Abn
ormal_
Retur
n
17
Effective Announcement
Announcement = Effective
Post-October 1989
Pre-October 1989
18
Figure 5: Index Changes Announcement and Effective Dates

CHAPTER 3
LITERATURE REVIEW Previous studies examining S&P 500 membership changes, in general, find that
inclusions (deletions) are associated with significant positive (negative) excess returns.
In a recent study, Chen et al. (2004) document permanent increase in stock price after a
stock is listed in the Index and no permanent decline following removals. Reconciliation
of empirical results in previous papers suggests that the announcement day positive
excess return is approximately 3% to 5% for index additions. The increase in stock price
continues and remains at a higher level. In general, earlier studies find no reversals in
stock prices. On the other hand, results for deletions show negative abnormal returns
between 7% and 10% around the announcement day. Share prices of deleted stocks
typically slide further between announcement and effective, but recoup most of the lost
over several trading days following the completion day.
Additionally, empirical research investigating Index changes find abnormal
trading activities around the announcement and effective for both added and removed
stocks. Trading volume around the announcement and effective is substantially higher
than that for a typical reading day before the announcement day. According to Chen et
al. (2004), the added firm’s trading volume on the effective (announcement) day is 11
times (4 times) higher than normal. Similar results are found when companies exit the
Index.
Although there is consensus in the literature regarding the price and volume
effects of Index changes, researchers disagree about the explanation(s) for such market
reactions. Several competing hypotheses have been proposed to explain the observed
19

market reactions to Index composition changes. These hypotheses include temporary
downward sloping demand curves (price pressure), long-run downward-sloping demand
curves (imperfect substitutes), liquidity (trading costs), information content (operating
performance and earnings), and investor awareness (market segmentation). 7
Price Pressure
The first two hypotheses are closely related in that they both deal with the issue
of demand shifts for stocks. Under these hypotheses, it is assumed that index changes
do not have information content and are pure events to determine the shape of demand
curves for stocks. The price pressure hypothesis suggests that Index changes are
associated with demand shocks that temporarily drive up or down share prices as large
order flows from index-tracking investors are fulfilled. Excess demand from indexing
drains the existing market liquidity. Buying (selling) pressure causes the price of a stock
to deviate from its equilibrium level. The effect of excess demand is quickly mitigated as
stock prices rise (drop) to attract sellers (buyers), providing immediate liquidity. As Elliott
et al. (2006) point out when facing with large order flows, market makers could incur
higher costs to maintain sufficient inventory (sub-optimal holding choice) and search
costs resulting from aligning buy and sell orders. These costs are reflected in a
security’s bid-ask spread as market makers revise prices in accordance to the
perceived change in the riskiness of their inventory. When the demand shock is
overcome, security prices return to an equilibrium level. Thus, the price pressure
7 Vijh (1994) and Barberis et al. (2005) find significant increase in stock beta after a company is added to the S&P 500 Index. However, they do not claim that change in beta is linked to the price effects.
20

hypothesis predicts a short-run increase (decrease) in share prices of added (deleted)
stocks.
The pioneering work of Harris and Gurel (1986) finds evidence in support of the
price pressure effect. In a sample of 84 companies added to the Index covering the
period 1978–1983, they document a 3.13% (mean) abnormal return on the
announcement day. The initial increase in price is nearly erased within the next few
trading weeks. Harris and Gurel conclude that S&P 500 inclusions are associated the
effect of price pressure. Subsequent research by Lynch and Mendenhall (1997) also
confirm the price pressure hypothesis. In post October 1989 period, the authors find
significant price reversal following the effective day for both additions and deletions. The
result of significant negative excess return indicates that the price effect resulting from
the announcement is transitory and most of the initial gains (losses) are reverted within
several trading sessions. Lynch and Mendenhall contend that the temporary price effect
is linked to index fund transactions, tracking the Index composition changes. Once
index-tracking investors complete their portfolio rebalancing, the demand shock
dissipated and stock prices return to the pre-announcement levels.
Imperfect Substitutes
In contrast to the price pressure effect, the hypothesis of long-term demand
curve posits that stocks do not have perfect substitutes, and thus, that any shift in
demand curve caused by a composition change reflects a new permanent equilibrium
price level. To minimize tracking errors, the majority of index funds follow a full
21

replication strategy.8 The notion of imperfect substitutes implies that the initial price
change after an index change announcement is not reversed and leads to a higher
equilibrium price. Additionally, index fund rebalancing in response to composition
changes would affect the supply of the added or deleted shares. As index funds
purchase (sell) a newly included (deleted) stock, they remove (offer) a significant
amount of outstanding shares of the addition (deletion). As a result, index changes are
associated with permanent price change.
Shleifer (1986) was among the first to provide evidence supporting the downward
sloping demand curves. He documents a positive (permanent) abnormal return of
approximately 3% for newly added stocks in the S&P 500 Index. His work attracted a
large number of studies investigating the demand curve issue. For example, Kaul,
Mehrotra, and Morck (2000) examine the re-weighting of the TSE (Toranto Stock
Exchange) in 1996. The weights adjustment of the TSE is arguably an information-free
event, and hence, any excess returns detected for stocks involving in the adjustment
would be due to downward sloping demand curves. Kaul et al. (2000) document
significant abnormal return of 2.34% for the companies that experience significant
increase in their index weights. In addition, Kaul et al. find that the excess returns are
not reversed in the weeks following the index weights adjustment and that there is no
change in bid-ask spreads of the re-weighted stocks, ruling out a liquidity effect.
Wurgler and Zhuravskaya (2002) examine the issue as to whether stocks
have close substitutes. If stocks have close substitutes, the demand curves for stocks
are flatten by arbitrage transactions, even in the event of large demand shock. In their
arbitrage risk model, it is predicted that price reactions to demand shift are related to the 8 See Beneish and Whaley (1996)
22

magnitude of the shock as well as the arbitrage risk of the stock. Wurgler and
Zhuravskaya (2002) find that arbitrage risk is positively related to price response to
index inclusion. That is, for a stock without perfect substitutes (with high arbitrage risk)
experiencing strong demand shock, the abnormal return around the demand shift will be
higher than for a stock with close substitutes. This is because arbitrageurs facing with
the difficulty to hedge the stock would be less likely to engage in arbitrage transactions
upon the actual inclusion, resulting in higher price jumps (mispricing). Furthermore, the
empirical results also indicate that less than a quarter of the median stock’s daily return
variance could be hedged away. Wurgler and Zhuravskaya conclude that demand
curves for stocks are indeed downward-sloping and stocks do not have close
substitutes.
Liquidity/Trading Costs
Amihud and Mendelson (1986) contend that trading costs affect the price of a
security. The required rate of return for a stock is lower when the liquidity measure such
as bid-ask spreads of the stock improves. The reduced required rate of return for a
stock translates into a price increase. The liquidity hypothesis predicts a permanent
increase in stock price for companies being added to the S&P 500 Index. In the case of
index additions, previous studies [e.g., Harris and Gurel (1986), Dillon and Johnson
(1991), and Beneish and Whaley (1996)] have documented abnormal volume following
the effective day, which may improve the liquidity of the added stocks.
In general, empirical studies document a liquidity effect associated with index
additions. Using quoted bid-ask spread, Beneish and Whaley (1996) document a
23

transitory decline in trading costs following index inclusion although trading volume
increases on a permanent basis. In a comprehensive study of the liquidity effects,
Hedge and McDermott (2003) examine whether change in liquidity is directly related to
the observed cumulative excess returns associated with index changes. First, they
utilize several measures of liquidity costs (e.g., time-weighted quoted spread, effective
spread) and show that the increase (decline) in liquidity measures is permanent for
added (deleted) firms. Although Hedge and McDermott (2003) find significant
(permanent) change in liquidity following index additions and deletions, their analysis
shows that the documented improvement in liquidity cannot fully explain the abnormal
returns due to index addition.
Information Content
Standard and Poor’s explicit states that index composition changes do not
provide any indication about the future performance of the added or deleted companies.
“Each stock added to the Index must represent a viable enterprise and must be
representative of the industry group to which it is assigned. Its market price movements
must in general be responsive to changes in industry affairs. Aggregate market value of
the stock and its trading activity are important considerations in the selection process.
Judgments as to the investment appeal of the stocks do not enter into the selection
process.” The key aspect of S&P's selection mechanism for this study is that the
composition of their list does not depend on forecast security returns. Since changes
are based only on publicly available information and on well-known criteria, they should
not reveal new information about future return distributions. As a result, changes in the
24
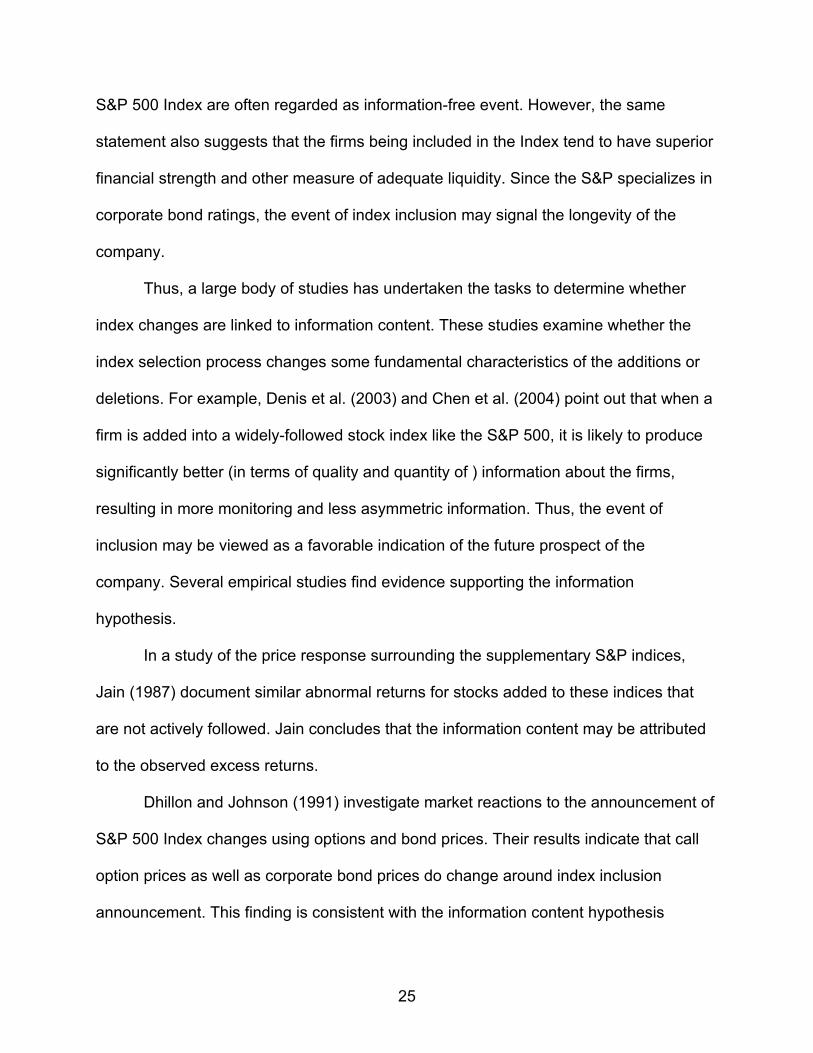
S&P 500 Index are often regarded as information-free event. However, the same
statement also suggests that the firms being included in the Index tend to have superior
financial strength and other measure of adequate liquidity. Since the S&P specializes in
corporate bond ratings, the event of index inclusion may signal the longevity of the
company.
Thus, a large body of studies has undertaken the tasks to determine whether
index changes are linked to information content. These studies examine whether the
index selection process changes some fundamental characteristics of the additions or
deletions. For example, Denis et al. (2003) and Chen et al. (2004) point out that when a
firm is added into a widely-followed stock index like the S&P 500, it is likely to produce
significantly better (in terms of quality and quantity of ) information about the firms,
resulting in more monitoring and less asymmetric information. Thus, the event of
inclusion may be viewed as a favorable indication of the future prospect of the
company. Several empirical studies find evidence supporting the information
hypothesis.
In a study of the price response surrounding the supplementary S&P indices,
Jain (1987) document similar abnormal returns for stocks added to these indices that
are not actively followed. Jain concludes that the information content may be attributed
to the observed excess returns.
Dhillon and Johnson (1991) investigate market reactions to the announcement of
S&P 500 Index changes using options and bond prices. Their results indicate that call
option prices as well as corporate bond prices do change around index inclusion
announcement. This finding is consistent with the information content hypothesis
25

because if the inclusion event contains no information, there should be no movement in
the prices of the added stocks’ options and bonds.
In a more recent study, Denis, McConnell, Ovtchinnikov, and Yu (2003) analyze
analysts’ earnings estimates and actual (realized) earnings around index inclusions. A
study of firm earnings surround these announcements allow researchers to directly test
whether the Index changes convey information that is current unavailable in the market.
The empirical results indicate that relative to matched firms, companies included to the
S&P 500 experience an increase in both realized earnings and earnings forecasts.
Moreover, the study documents that, after a firm is added to the index, analysts are
more optimistic about the prospect of the company; the analysts tend to revise their
earnings estimates upward after the addition. Denis et al. (2003) thus argue that the
S&P Index inclusion is not an information-free event.
Goetzmann and Garry (1986) look at a small group of companies that exited the
Index due to the breakups of AT&T. These deleted firms were replaced by the spin-offs
(baby bells) of the parent company, AT&T. The authors find that the deleted firms
experience permanent negative abnormal returns following the removals. Goetzmann
and Garry (1986) contend that the market revises the prices of the deleted shares due
to the likelihood of less information production and lower quality of information.
Market Segmentation/Investor Awareness
In Merton’s (1987) shadow costs model of market segmentation, a “neglected”
stock is associated with higher idiosyncratic risk and as a result, an investor would
require a risk premium for owning that stock. If a stock’s addition to the S&P 500 index
26

leads higher investor recognition of the stock, the required rate of return on that stock
should fall due to a reduction in the shadow cost (or firm-specific risk). The market
segmentation model assumes that investors do not hold adequately diversified
portfolios; they invest in a subset of all stocks available. The evidence of how Merton’s
shadow cost is directly linked to the discount rate has been provided in many studies
investigating dual-country listings and changes in exchange listings. In general,
empirical findings are consistent with the shadow cost framework; a reduction in
showdown cost corresponds to a fall in the required rate of return. Merton’s market
segmentation model is related to a body of studies examining “neglected” stocks. The
fundamental idea underlying these studies is the effect of an increase in investor
recognition of a stock.
Chen et al. (2004) present new evidence about the price reactions of index
additions and deletions. Unlike the prediction of symmetric price response, Chen et al.
(2004) find permanent increase in stock price after a stock is listed in the Index and no
permanent decline following removals. They attribute the findings to changes in investor
recognition of the added or deleted stocks. Shares of the included companies soar
because the company has entered into a new segment of the stock universe (S&P 500),
leading to higher greater investor awareness and lower shadow costs. Similar logic
follows for stocks removed from the index. There is only a temporary decline in price for
deleted stocks because investor awareness of such firms does not suddenly disappear,
and following the effective day, share prices rebound.
In an analytical survey, Elliott and Warr (2006) provide additional evidence
confirming the market segmentation hypothesis. Their cross sectional analysis of the
27

abnormal announcement return shows that increased investor recognition is an
important factor in explaining the excess returns.
Using two Dow Jones indexes that are not subject to active indexing, Polonchek
and Krehbiel (1994) examine the market segmentation hypothesis. Their event study
shows significant (permanent) increase in share prices for additions to these indices.
The results are consistent with Merton’s (1987) investor attention hypothesis.
Index Derivatives and Underlying Security Volatility
Our study is also closely related to a body of literature investigating the impact of
index trading strategies on the volatility of the underlying securities.
Traditional finance theory suggests that derivative markets are linked to the underlying
spot market by mechanical arbitrage trading [see Grossman (1988)]. When cash
securities are overpriced (underpriced) relative to the derivative markets, arbitrageurs
could sell (buy) the cash assets and take long (short) positions in the derivatives. These
arbitrage transactions continue to take place until both markets converge to equilibrium.
Arbitrage transactions tend to create additional large order flows in the underlying
market as the arbitrage mechanism works to correct prices. Previous empirical studies
have examined the relationship between trading volume and volatility. Karpoor (1987)
and Gallant et al. (1992) have shown a positive relation between volume and the
absolute value of price changes. Thus, it can be argued that arbitrage transactions may
result in abnormal trading, which in turn causes price movements.
There are two main lines of reasoning to account for the change in volume and
volatility, resulting from index derivatives transactions. One interpretation is that stock
28

return variability is positively related to the information arrivals accompanied by trading
volume. This argument is based on how information is incorporated into security prices.
As the market digests new information, prices are adjusted to reflect a new set of
available information. The other is based on how market makers respond to large block
trades caused by arbitrage. This is a market microstructure perspective, looking at the
volatility of price changes as market makers adjust prices based on their portfolio risk
and inventory risk. Prices may also changes in response to liquidity demand requiring
market makers to provide immediate transactions when large transactions come to the
marketplace. Both interpretation suggest also a positive relationship between trading
volume and return volatility.
In the information framework, an increase in trading is typically accompanied by
additional information that is being priced in the marketplace.
Ross (1989) suggests that “the volatility of prices is directly related to the rate of
information to the market.” Similarly, Cox (1976), Copeland (1976), Epps and Epps
(1976), Taucben and Pitts (1983), and Jennings et al. (1981) provide insights as to
whether prices changes are linked to information arrivals. These models provide
insights as to how information production is related to price volatility. Derivative markets
offer additional channels for information to be disseminated, implying that information is
more likely to be discovered and transmitted between the markets. Security prices are
adjusted to reflect new information, and thus, price movements may directly correspond
to information arrivals.
Cox (1976) investigates the information effect of futures trading and whether
there is a relationship between information production and the prices of the spot assets.
29

Cox demonstrates that futures trading activitiies is associated with an increase in
information production of the underlying securities and prices of the spot assets respond
quickly to the updated information set. Vijh (1994) points out that the large trading in
S&P 500 products may affect prices because “simply by chance the buy orders will
dominate sell orders on certain days while the sell orders will dominate buy orders on
other days.” He contends that
In addition, Duffie, Kupiec, and White (1990) argue that index arbitrage may
cause price changes as large transactions are executed in the spot markets, resulting in
reduced liquidity. Stoll and Whaley (1987) and French and Roll (1986) show that stock
variance is strongly related to trading activities. Moreover, derivative trading is also
subject to margin calls that at times of order imbalance may trigger additional price
pressure.
Pruitt and Wei (1989) provide further evidence supporting the short-term price
effect (price pressure). Their study shows that institutional ownership increases
following a firm’s inclusion in the S&P 500 index. As institutional investors are
associated with larger trading transactions, it is more likely to cause temporary order
imbalances, which in turn lead to higher price changes. Jones et al. (1994) decomposes
daily trading volume into number of trades and average trade size and examines their
impact on the volatility of stocks traded in the NASDAQ national market. They find that
number of transactions is the most important measure of trading activity that explains
volatility changes although size of trade is also an influencing factor.
Ho and Macris (1984) suggest that the market makers adjust bid-ask spreads
when they face large order flows. Market makers, in response to liquidity constraints,
30

often carry additional “inventory” to cope with possible order imbalances, resulting in
suboptimal inventory holdings. This inventory cost is then reflected in security prices
resulting in short-term price changes. Several other studies have also argue that large
transactions tend to increase costs associated with market making services and these
costs are associated with stock prices being deviated from their intrinsic (fundamental)
values.
On the contrary, Santoni (1987) documents an inverse relation between S&P 500
index futures trading volume and volatility of the S&P 500 market index, suggesting that
an increase in futures trading activities leads to a reduction in spot market volatility.
Moreover, Bessembinder and Seguin (1992) provide evidence that stock market
volatility is negatively correlated to (total) trading volume in the cash markets. Trades in
the futures markets are directly related to the trading volume in the underlying spot
securities. However, when the authors decompose trading activities, they find that only
“unexpected” trading volume in the spot securities is positively correlated with volatility.
Expected changes in volume do not affect volatility. Moreover, Edwards (1988a, 1988b)
finds that the introduction of futures contracts is not related to volatility changes in the
underlying cash markets.
31

Table 3: Previous Studies in S&P 500 Index Changes
S&P 500 Index Effect Major Studies Supported
Price Pressure Harris and Gurel (1986), Pruitt and Wei (1989), Lynch
and Mendenhall (1997), Kaul et al. (2000), Elliott and
Warr (2003)
Long-term Downward Sloping
Demand Curves
Shleifer (1986), Dhillon and Johnson (1991), Beneish
and Whaley (1996), Lynch and Mendenhall (1997),
Wurgler and Zhuravskaya (2002)
Liquidity Beneish and Whaley (1996), Hedge and McDermott
(2003)
Operating
Performance/Information
Jain (1987), Dhillon and Johnson (1991), Denis et al.
(2003)
Investor Awareness Chen et. al. (2004), Elliott et al. (2006)
32
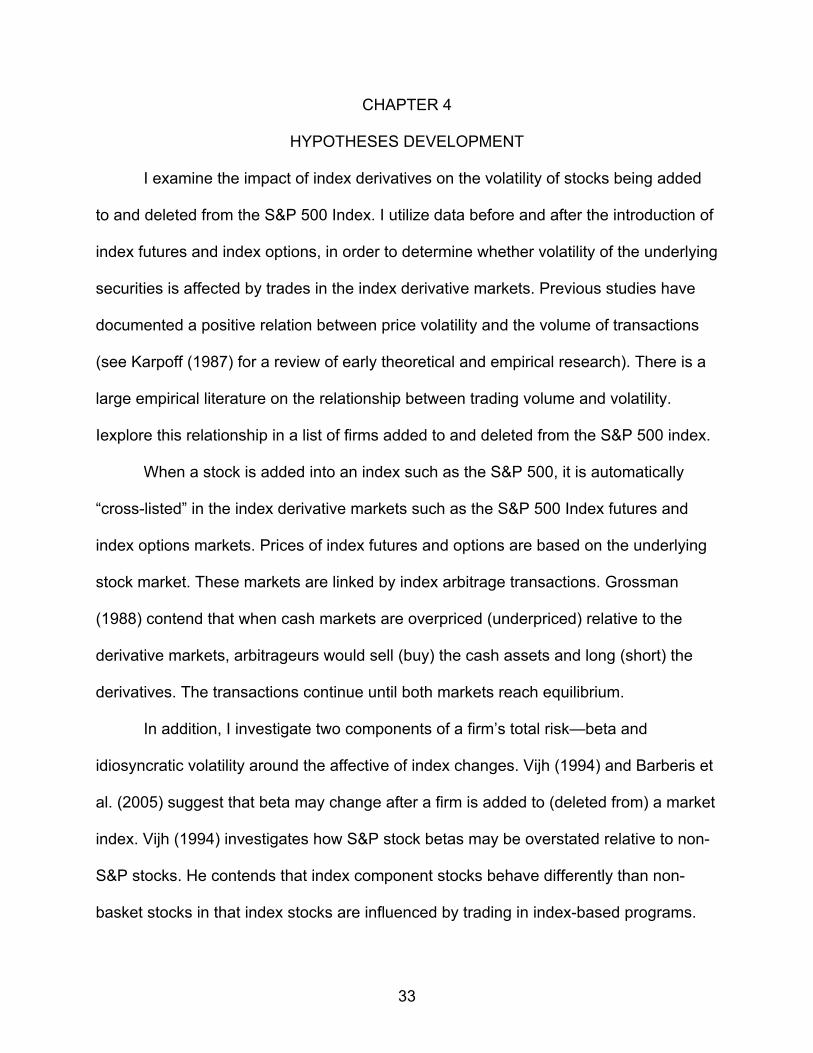
CHAPTER 4
HYPOTHESES DEVELOPMENT
I examine the impact of index derivatives on the volatility of stocks being added
to and deleted from the S&P 500 Index. I utilize data before and after the introduction of
index futures and index options, in order to determine whether volatility of the underlying
securities is affected by trades in the index derivative markets. Previous studies have
documented a positive relation between price volatility and the volume of transactions
(see Karpoff (1987) for a review of early theoretical and empirical research). There is a
large empirical literature on the relationship between trading volume and volatility.
Iexplore this relationship in a list of firms added to and deleted from the S&P 500 index.
When a stock is added into an index such as the S&P 500, it is automatically
“cross-listed” in the index derivative markets such as the S&P 500 Index futures and
index options markets. Prices of index futures and options are based on the underlying
stock market. These markets are linked by index arbitrage transactions. Grossman
(1988) contend that when cash markets are overpriced (underpriced) relative to the
derivative markets, arbitrageurs would sell (buy) the cash assets and long (short) the
derivatives. The transactions continue until both markets reach equilibrium.
In addition, I investigate two components of a firm’s total risk—beta and
idiosyncratic volatility around the affective of index changes. Vijh (1994) and Barberis et
al. (2005) suggest that beta may change after a firm is added to (deleted from) a market
index. Vijh (1994) investigates how S&P stock betas may be overstated relative to non-
S&P stocks. He contends that index component stocks behave differently than non-
basket stocks in that index stocks are influenced by trading in index-based programs.
33

Harris (1989) argues that index trading strategies may result in systematic risk change
of the component stocks because “index strategies operate on all (or most) index stocks
at the same time.”
To investigate the impact of index derivatives, the full sample period is partitioned
into two subperiods, covering the period September 1976–1985 and 1986–2005. This
first subperiod is related to a period of relative lower index derivative dollar volume since
the S&P index futures (options) were not available until 1982 (1983). Subsequent to the
first subperiod, the dollar volume on the index derivatives contracts reached record
highs. Thus, the second subperiod focuses on the effects of transactions (such as index
arbitrage, portfolio insurance, and program trading). Our main goal is to determine
whether the trading volume and volatility of the added or deleted stocks are significantly
different between the two subperiods.
Our hypotheses are based on the existing literature concerning trading volume
and volatility. They can be stated as follows.
Trading Volume Effect
H1: During the period, 1976-1985, an addition will not be associated with higher abnormal trading volume.
H2: During the period after 1985 (1986–2005) when the implied dollar trading volume in the S&P 500 Index derivative markets significantly exceeds the dollar trading volume of the cash S&P 500 stocks, an addition will lead to higher abnormal trading volume.
H3: In both subperiods, deletions will not lead to abnormal trading volume around the effective dates.
34

35
Volatility Effect
H4: There is no significant change in stock return volatility around an addition or deletion in the S&P 500 Index during the period, 1976-1985.
H5: There is significant change in stock return volatility around an addition after the period when the implied dollar trading volume in the S&P 500 Index derivative markets significantly exceeds the dollar trading volume of the cash S&P 500 companies (1986-2005).
H6: There is no significant change in stock return volatility around a deletion after the implied dollar trading volume in the S&P 500 Index derivative markets significantly exceeds the dollar trading volume of the cash S&P 500 companies (1986-2005).
H7: The increased in return variance measured using monthly data will yield similar results using daily data. I do not know whether the volatility is caused by price pressure or imperfect substitutes.
H8: Both NYSE® and Nasdaq ® stocks added to the Index will experience increase in return variance.
H9: There is a positive relationship between percentage change in turnover and volatility change
Systematic Risk Effect
H10: Over the period, 1976-1985, stock beta should not change for both additions and deletions.
H11: During the period when the implied dollar trading volume in the S&P 500 Index derivative markets significantly exceeds the dollar trading volume of the cash S&P 500 companies (1986-2005), stock beta increase for additions.
H12: During the period when the implied dollar trading volume in the S&P 500 Index derivative markets significantly exceeds the dollar trading volume of the cash S&P 500 companies (1986-2005), stock beta should not change for deletions.

S&P 500
Index Changes
Additions
Deletions
Post-Index Trading Period
(1986-2005)
Pre-Index Trading Period
(1976-1985)
Pre-Index Trading Period
(1976-1985)
Post-Index Trading Period
(1986-2005)
Volume
No Change
Volatility & Beta
No Change
Volume
Increases
Volatility & Beta
Increases
Volume
No Change
Volatility & Beta
No Change
Volume
No Change
Volatility & Beta
No Change
Figure 6: Hypothesis Development Roadmap
36

CHAPTER 5
SAMPLE AND DATA
The initial sample consists of all additions and deletions occurring between
September 1976 and December 2005. I gathered information about these changes from
two sources. First, I obtained index changes for the period September 1976 through
December 2000 from Jeffrey Wurgler. This dataset was used in two earlier S&P Index
studies—Wurgler and Zhuravskaya (2002) and Barberis, Shleifer, and Wurgler (2005).
The remaining data on index changes were collected from the Standard and Poor’s
company website9. The sample period begins in September 1976 because prior to that
time, S&P did not publicly announce index changes.
The initial sample consists of 181 additions for the September 1976 to December
1985 period and 515 additions for the January 1986 to December 2005 period. For the
entire sample period September 1976 – December 2005), there are 696 additions and
696 deletions. There are, on average, between 20 and 25 stocks added to (deleted
from) the S&P 500 Index each year.
Since S&P index additions and deletions are often associated with other
contemporaneous corporate events (e.g., spin-offs, merger and acquisition, and
restructuring), I use the following set of criteria to screen out firms that are not pure
cases of inclusion or deletion. First, I exclude index changes resulted from merger,
acquisition, or restructuring. Second, I remove index additions involving
merger/acquisition transactions that do not actually include a new company to the index
9 The index changes data are available on http://www.sandp.com. Follow the equity indices link to find index changes specifically for the S&P 500 Index.
37

portfolio. For instance, when a non-index company acquires an S&P 500 firm and is
subsequently added to the index, I exclude such addition from our sample.
To make certain that I have a clean sample in the analysis of trading volume and
return volatility, I search the LexisNexis Academic database for confounding events
(such as earnings, dividend, split, financing/investment announcements during the
period from 3 days before the announcement date to 7 days subsequent to the effective
date [see Denis et al., 2003].
In addition, I require that the there must be sufficient stock returns, trading volume, and
shares outstanding data around the effective day. For the trading volume analysis, the
post-change (event) period covers the interval [+61, +120].
I also extend the post-inclusion turnover ratio up to 150 trading days after the effective.
No index additions in our sample survive less than 150 days. For our volatility and
market risk tests, the required daily returns span 300 trading day surround the effective
day. The final (clean) sample includes 364 additions and 90 deletions. Table 4 reports
the detailed breakdown of the sample screening results.
The Center for Research in Security Prices (CRSP) database is used to obtain
daily returns, daily trading volume, and shares outstanding for the firms used in the
analysis. I obtain NYSE trading volume from the historical data archive library on its
website.
38

Table 4: Sample Construction
S&P 500 Index Changes Sample
9/76-12/85
1/86-12/05
9/76-12/85
1/86-12/05
9/76-12/05
Additions Additions Deletions Deletions Total Initial Sample 181 515 181 515 1392 Merger/takeover 9 50 129 302 490Earnings Announcement 22 54 1 17 94Spin-off/disventure 2 43 2 26 73Dividend announcement 2 8 0 3 13Litigations 0 1 0 0 1Financing (bond and stock offerings)
4 16 0 4 24
Reorganization 0 2 1 4 7Investment; Acquisitions; Tender offers
21 26 0 2 49
Management change 5 6 0 0 11Layoff announcement 0 1 0 1 2Bankruptcy/liquidation 0 0 8 25 33LBO or MBO 0 0 11 19 30Restructuring; corporate change
11 41 3 44 99
Changed exchange 0 2 0 0 2Insufficient data 3 3 1 3 7Final Sample 102 262 25 65 455
39

Figure 7: Number of Annual Index Changes (1976-1985)
1976 1977 1978 1979 1980 1981 1982 1983 1984 1985
Year
0
5
10
15
20
25
30
Mea
n N
umbe
r_of
_Add
ition
s
40

Figure 8: Number of Annual Index Changes (1986-2005)
1986
1987
1988
1989
1990
1991
1992
1993
1994
1995
1996
1997
1998
1999
2000
2001
2002
2003
2004
2005
Year
0
10
20
30
40
50
60
Mea
n Nu
mbe
r_of
_Add
ition
s
41

CHAPTER 6
METHODOLOGY
Abnormal Volume Measurement
I analyze trading volume around the effective date of S&P 500 index changes
using procedure similar to those in Harris and Gurel (1986), Elliott and Warr (2003), and
Chen et al. (2004). Our purpose is to determine whether excess turnover is associated
with index changes, before and after the introduction of S&P 500 index-based trading
strategies. Following Chen et al. (2004, p. 1907), I use “turnover (trading volume divided
by shares outstanding) instead of trading volume, so that unusually high volume in a
few large stocks does not disproportionately affect the market volume.”
The volume turnover is calculated by equation (2). The denominator is the
market-adjusted volume during the “estimation” period. The estimation period covers
the interval, [-61, -120]. The market-adjusted turnover is the ratio of individual stock
volume divided by market volume. The numerator is the “event” period turnover
adjusted by total market volume during the post-change interval of [+61, +120]. In
equation (2), Tit is the volume turnover for stock i at time t, the subscript m refers to the
market index. Consistent with previous studies, I use the NYSE trading volume as a
proxy for market level volume. The pre- (post-change) turnover ratio is the 60-day
average trading turnover (with a minimum of 30 days) beginning 61 trading days before
(after) the effective date. Thus, trading before (after) the effective date must last for at
least 90 days. I calculate the pre- and post-change turnover ratio for each index change
in our sample and test whether the mean turnover ratio (MTR) across all index changes
is significantly different from unity.
42

,SV(Turnover)T
it
itit = (1)
,
120
∑
∑−
−=
+
== 120ED
61t mt
it
ED
61t mt
it
i
TTTT
Ratio)(TurnoverTR (2)
∑=
=N
1ii .TRMTR (3)
Volatility Measurement
I investigate four measures of stock return volatility surrounding the event—
variance of daily stock returns, residual standard deviation, squared daily returns, and
exponential GARCH (EGARCH) conditional variance. For each index change, I
calculate variance of stock returns from the period prior to (subsequent) the effective
day R2 (R1). I use Elliott et al’s (2006) idiosyncratic expression to measure residual
variance: “the residual standard deviation measures the stock's idiosyncratic risk and is
the standard deviation of the difference between the return on the firm's stock and the
return on the CRSP Equally-weighted portfolio.” For the pre-change (normal) period I
measure this difference over the [-61, -120] window, and for the post-change period I
use the period [+61, +120]. I then compare each pair of pre- and post-change return
variances in our sample.
Ohlson and Penman (1985), Dravid (1987), and Dubofsky (1991) among others,
have proposed a binomial proportionality methodology to test the statistical significance
of changes in volatility. This approach assumes independence across N squared daily
returns. The test statistic is computed by matching post- and pre-inclusion (pre-deletion)
43

returns for each index change and tallying the proportion of squared daily return
observations, pooled across index changes and dates, in which post-inclusion squared
daily return exceeds pre-inclusion squared daily return.
The matching procedure used is as follows. For each index change, the squared
return for day +61 is matched with that for day -61. The process continues until the
squared return for day +120 is matched with that for day -120. Thus, I obtain 120
squared returns observations (60 pairs) for each index change. As noted in previous
research, there are a non-trivial number of observations in which the difference between
pre-change and post-change squared returns is zero. Following Dravid (1987) and
Peterson and Peterson (1992), these observations are split equally between the null
and alternative hypotheses.
The autoregressive conditional heteroscedasticity (ARCH) was first developed by
Engle (1982). Later, the generalized (GARCH) form of ARCH, proposed by Bollerslev
(1986), allows for “lagged variances and the further lagging of the error term.” Nelson
(1991) further extends the GARCH form to incorporate “volatility clustering” and the
“leverage effect” that exists in financial data. The specification proposed, known as
exponential GARCH (EGARCH), allows for an asymmetric response to positive and
negative price changes.
The general EGARCH model begins with a simple univariate framework where
no other variables (except past values of returns) can be used in predicting mean
returns. The mean return process can generally be expressed as
( ) T,1,pt,εrLΦμr t1tt K+=++= − (4)
44

where is a polynomial in the lag operator L, i.e., ( )LΦ ( ) 1pp21 LΦLΦΦLΦ −+++= K . The
error term tε describes the unpredictable component of the returns. A common
assumption about its behavior is that it follows a GARCH-type process, namely that
( )2t1tt σ0,N~Iε − ,
where is the information available at time t-1 and follows a process 1−tI 2tσ
21t1
21t10
2t σβεαασ −− ++= ,
in the GARCH (1, 1) representation (Bollerslev, 1986), and
( ) ( )1t
1t
1t
1t21t
2t σ
εγπ2
σεασβlogωσlog
−
−
−
−− +−++= (5)
in the Nelson (1991) exponential GARCH [EGARCH(1, 1)] representation. The variance
equation shows that the model is basically a “weighted moving average” of past volatility
(one-period lag) and residuals from the mean regression estimations.
“A typical characteristic of asset returns is volatility clustering where one period of
high volatility is followed by more of the same and then successive periods of low
volatility ensue” (Bollerslev et al., 1992, 1994). The EGARCH model offers several
advantages over other ARCH models. First, the EGARCH model can deal with volatility
clustering and the leverage effect. Second, unlike GARCH, the EGARCH model
“imposes no positive constraints on estimated parameters and explicitly accounts for
asymmetry in asset return volatility, thereby avoiding possible misspecification in the
volatility process” (Glosten et al., 1993).
Furthermore, Nelson (1991) points out that the “EGARCH model also allows for a
general probability density function (i.e., generalized error distribution, GED), which
allows for distributions involving non-normality.” This approach makes fewer
45

assumptions about the distribution of the measured volatility series. As Bollerslev et al.
(1992) and several others suggest “imposing the normality assumption could bias the
estimates.”
I use both the Berndt-Hall-Hall-Hausman (hereafter, BHHH) and Marquardt
optimization algorithms in the iteration process. The BHHH method outperforms the
Marquardt approach, in terms of the percentage of processes that were successfully
converged. In our experiments, all of our EGARCH conditional variances converged
using the BHHH approach, however, less than 75% successfully converged under the
Marquardt algorithm. However, our significance level for the documented increase in
variance does not change using
either procedure. I thus report only the results of the BHHH optimization
algorithms.
Systematic Risk
Following Scholes and Williams (1977), I estimate stock betas by adjusting for
nonsynchronous trading (infrequent trading). This methodology has been shown to
outperform the conventional Ordinary Least Squares (OLS) technique. Scholes and
Williams (1997) propose a model to incorporate nonsynchronous trading. Infrequent
trading may cause a bias in beta estimation procedure. Lo and MacKinlay (1990)
contend that “thin trading induces a negative autocorrelation in stock returns, an
overstatement of the return variance, and a downward bias in the systematic risk.” To
deal with the problems, Scholes and Williams (1977) derive a consistent estimate for
beta:
46

,ρ21
bbbβm
iiii ˆ
ˆˆˆˆ+
++=
−+
(6)
where and respectively are the OLS estimates of the slopes of regression of
asset i's returns on one-period lag, concurrent, and one-period ahead of the market
index; is the first-order autocorrelation of the index return.
,ˆ,ˆii bb+ −
ib̂
mρ̂
47

CHAPTER 7
EMPIRICAL RESULTS
The empirical results are divided into three parts. In the first section, I present
tests of abnormal trading volume; the second section deals with tests of volatility effect
associated with Index additions and deletions. The last section provides the results
regarding systematic risk.
Trading Volume Effect
I use the abnormal turnover ratio methodology similar to Harris and Gurel (1986)
and Chen et al. (2004). In the turnover ratio approach, volume turnover is simply
individual firm trading volume divided by total shares outstanding. The ratio is then
divided by overall market volume measured by the total trading volume of the NYSE
(New York Stock Exchange). The market-adjusted turnover ratio tests whether post-
inclusion (deletion) volume is different from pre-inclusion (deletion) volume. If there is
abnormal trading around Index changes, the mean turnover ratio will deviate
significantly from unity.
For stocks added to the Index, the turnover ratios in post-1986 periods are
significantly different from those prior to the year 1986. I use the year 1986 as the cutoff
point as Vijh (1994) shows that the total (implied) dollar volume related to S&P 500
Index-based trading strategies for the year 1986 is almost twice as much as that for the
year 1985. As a result, I compare the turnover ratios of two distinct periods: (1)
September 1976 – December 1985, when Index-based trading is less important and (2)
January 1986 – December 2005.
48

For the first period, the mean turnover around the effective day of inclusion is not
significantly different from the “normal” turnover, which is measure using trading volume
prior to the actual event day. In fact, our result indicates that during this time period
when Index-component stocks are less likely to be affected by trading in the derivative
markets, there is no abnormal trading volume associated with the company being
included in the S&P 500. In other words, an entry to the Index portfolio does not
change the trading volume of the addition during this period. Earlier studies, such as
Dhillon and Johnson (1991) and Chen et al. (2004), document that on the effective day,
the turnover is more than 10 times higher than normal.
In the period 1986–2005, the mean turnover around the effective day is 1.093.
The p-value of the t-test is less than 0.001, indicating that the post-inclusion volume is
significantly higher than the volume during normal trading days. This finding supports
our hypothesis that index additions are likely to experience an increase in trading
volume following their entry into the Index portfolio as the underlying cash securities are
directly linked to the trading in the Index-derivative products. I obtain similar abnormal
volume results when I extend our “event” period longer, up to 150 trading days after the
effective. The result suggests that there is permanent change in volume during 1986 to
2005. Our results are generally in line with those reported in previous studies although I
find a slightly higher turnover ratio in the period 1986–2005. For example, Dillion and
Johnson (1991) and Chen et. al (2004) document that the post-inclusion turnover ratio
is 1.084 and 1.080 for the periods 1984 through 1988 and 1989 through 2000,
respectively.
49

Next, I examine the trading volume around the time when an S&P 500
component stock is removed from the Index. Our hypotheses suggest that there should
be no abnormal volume around the deletion event, even during the period of heavy
index-based trading. This is due to the fact that the deletions typically represent an
extremely small fraction of the Index at the time of removal. Most of the deletions
survived our sample-screening procedure are removed for lack of representation.
These stocks are usually the smallest firms in the S&P 500, in terms of market
capitalization. As a result, derivatives trading would have little or no impact on the
volume of these “beaten-down” shares. Hence, there should be no abnormal volume
surrounding the removal day.
In Table 5, the mean turnover ratios during both periods are not significantly
different from one, which means that subsequent to the removal, the trading volumes of
the deleted stocks are close to the normal volume (pre-deletion volume). In the period
1976–1985, the mean turnover ratio is 0.935 or 93.5% of the normal volume. Although
the volume is lower following the deletion, the decrease in volume is not statistically or
economically different than the trading volume in the pre-removal period of (-31, -91).
Similarly, for the period covering 1986 to 2005, the mean turnover ratio of 0.974 is close
to unity and is not statistically different from unity. Our results remain unchanged if I
extend the event period up to 150 trading days after the effective day. This indicates
that there is no abnormal trading volume around the time a company is taken out of the
S&P 500 Index in the full sample period September 1975 to December 2005 or in the
subperiods—September 1975 to December 1985 as well as January 1986 through
December 2005.
50
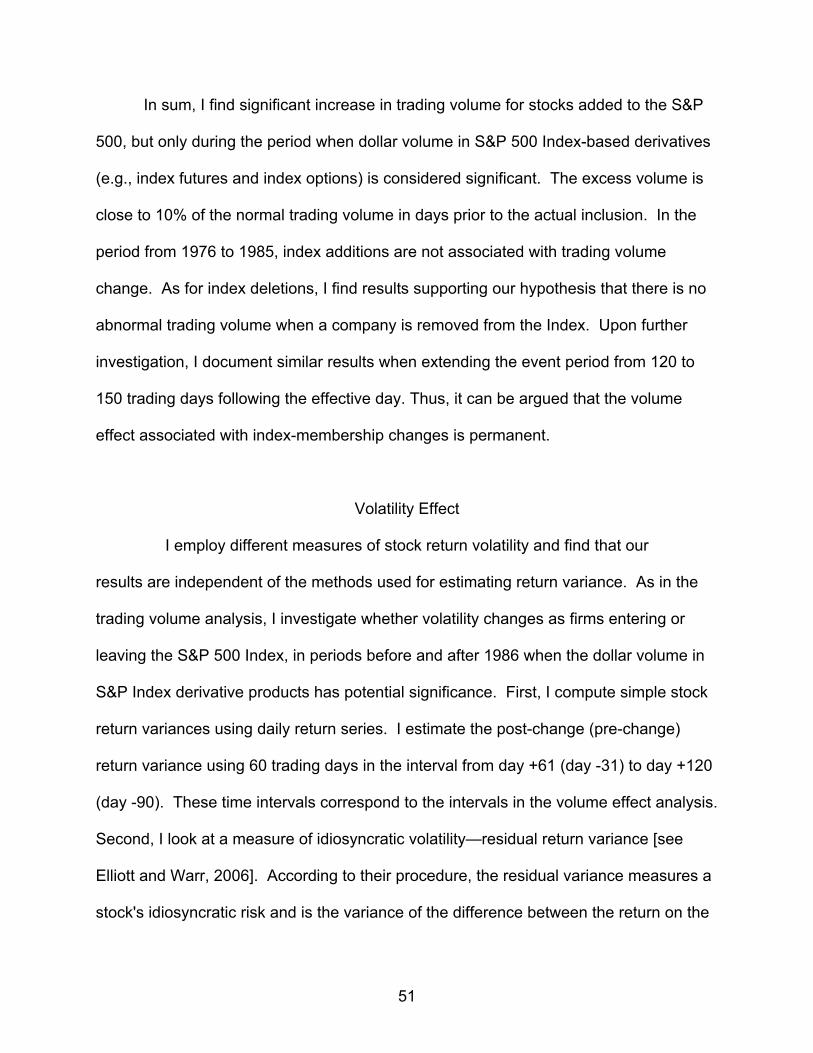
In sum, I find significant increase in trading volume for stocks added to the S&P
500, but only during the period when dollar volume in S&P 500 Index-based derivatives
(e.g., index futures and index options) is considered significant. The excess volume is
close to 10% of the normal trading volume in days prior to the actual inclusion. In the
period from 1976 to 1985, index additions are not associated with trading volume
change. As for index deletions, I find results supporting our hypothesis that there is no
abnormal trading volume when a company is removed from the Index. Upon further
investigation, I document similar results when extending the event period from 120 to
150 trading days following the effective day. Thus, it can be argued that the volume
effect associated with index-membership changes is permanent.
Volatility Effect
I employ different measures of stock return volatility and find that our
results are independent of the methods used for estimating return variance. As in the
trading volume analysis, I investigate whether volatility changes as firms entering or
leaving the S&P 500 Index, in periods before and after 1986 when the dollar volume in
S&P Index derivative products has potential significance. First, I compute simple stock
return variances using daily return series. I estimate the post-change (pre-change)
return variance using 60 trading days in the interval from day +61 (day -31) to day +120
(day -90). These time intervals correspond to the intervals in the volume effect analysis.
Second, I look at a measure of idiosyncratic volatility—residual return variance [see
Elliott and Warr, 2006]. According to their procedure, the residual variance measures a
stock's idiosyncratic risk and is the variance of the difference between the return on the
51

firm's stock and the return on the market portfolio. The CRSP AMEX-NYSE-Nasdaq
equally-weighted index is used as a proxy of the market index. The final measure of
volatility is based on Nelson’s (1991) exponential GARCH model. I estimate the
conditional variances for each addition and deletion using stock returns from day -150 to
day +150. After the return variances are calculated, I compare the distribution of
variances before and after the actual S&P 500 Index changes. The Wilcoxon Signed-
Ranks test and paired t-test are used to determine whether there is a change in return
variance around the time a company is included in or removed from the Index.
Tables 6-8 assess the volatility of additions around the effective day. I obtain the
same results regardless of the methods I use to estimate volatilities. The daily return
variances for added firms average 0.00088 and 0.0011 before and after the S&P 500
changes for the period 1986–2005, and average 0.00051 and 0.00046 before and after
the effective day during 1976–1985. Both Wilcoxon Signed test and paired t-test
indicate that added companies experience significant increase in return variance
[Wilcoxon Z-statistic (p-value) 4.87 (<0.01); paired t-statistic (p-value) 4.41 (<0.01)], but
only over the period when index-based trading achieves record volume in 1986. Similar
results are obtained in the analysis of residual return variance and EGARCH conditional
variance. Both residual return variance and EGARCH conditional variance are
significantly higher after a stock is added to the S&P 500 over the period 1986 to 2005.
Tables 6-8 also report the percentage of stocks that experience higher volatility. The
percentage ranges from over 60% to about two-thirds of the additions. Thus, our results
do not appear to be driven by a few outliers. In the period from September 1976 to
December 1985, both Wilcoxon Signed test and paired t-test fail to reject the null
52
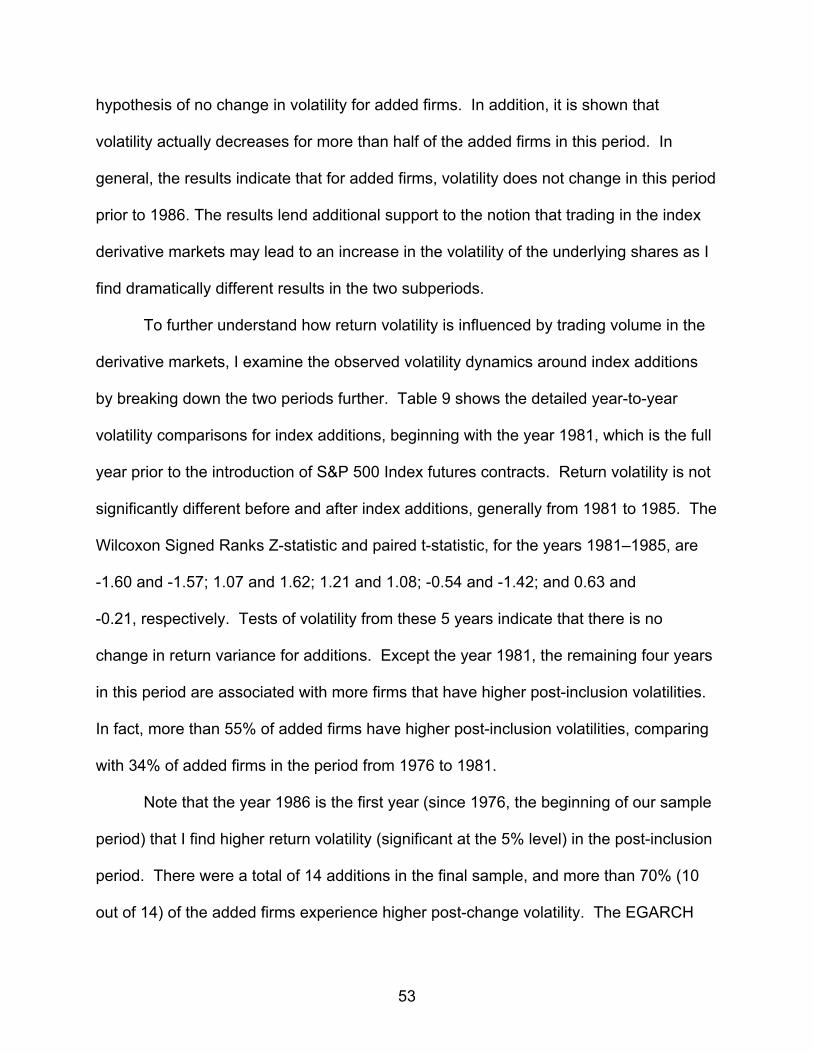
hypothesis of no change in volatility for added firms. In addition, it is shown that
volatility actually decreases for more than half of the added firms in this period. In
general, the results indicate that for added firms, volatility does not change in this period
prior to 1986. The results lend additional support to the notion that trading in the index
derivative markets may lead to an increase in the volatility of the underlying shares as I
find dramatically different results in the two subperiods.
To further understand how return volatility is influenced by trading volume in the
derivative markets, I examine the observed volatility dynamics around index additions
by breaking down the two periods further. Table 9 shows the detailed year-to-year
volatility comparisons for index additions, beginning with the year 1981, which is the full
year prior to the introduction of S&P 500 Index futures contracts. Return volatility is not
significantly different before and after index additions, generally from 1981 to 1985. The
Wilcoxon Signed Ranks Z-statistic and paired t-statistic, for the years 1981–1985, are
-1.60 and -1.57; 1.07 and 1.62; 1.21 and 1.08; -0.54 and -1.42; and 0.63 and
-0.21, respectively. Tests of volatility from these 5 years indicate that there is no
change in return variance for additions. Except the year 1981, the remaining four years
in this period are associated with more firms that have higher post-inclusion volatilities.
In fact, more than 55% of added firms have higher post-inclusion volatilities, comparing
with 34% of added firms in the period from 1976 to 1981.
Note that the year 1986 is the first year (since 1976, the beginning of our sample
period) that I find higher return volatility (significant at the 5% level) in the post-inclusion
period. There were a total of 14 additions in the final sample, and more than 70% (10
out of 14) of the added firms experience higher post-change volatility. The EGARCH
53

conditional variances for included stocks average 0.000483 and 0.0006 before and after
the S&P 500 changes for the year.
To examine years immediately following 1986, I must deal with the crash of
1987. Consistent with previous research, I remove firms with effective day that is 120
trading days around the crash (there are 14 index additions excluded from our sample
for this reason). For the year 1987, there were only four added firms available for
statistical analysis. I still report Wilcoxon singed test and paired t-statistic results, but I
must interpret the results with caution. In 1987, three of the four added stocks show
higher post-change volatility. The average pre- and post-inclusion variances are
0.00056 and 0.00085; however, the change in volatility is not statistically significant,
perhaps due to small sample size. I did not find volatility changes in 1988, but find
significant increases in return variance in 1989 and 1990. For the period 1986–1990,
the post-inclusion volatility of 0.000488 is significantly higher that the pre-inclusion
volatility of 0.000398 at the 1% significance level. The result supports our hypothesis
that post-inclusion volatility is higher for index addition in this period. It is interesting to
note that in the period preceding 1982, the post-inclusion volatility is actually lower than
the pre-inclusion volatility. The Wilcoxon test and paired t-test show that the negative
change in volatility is statistically significant. Table 9 also indicates significantly higher
post-change volatility for added firms in periods following 1990. Both periods 1991–
1995 and 1996–2005 show increases in conditional variances with the later period
providing more significant increase. Despite the activation of circuit breakers and other
forms of exchange trading curbs following the crash of 1987, I continue to find higher
post-inclusion volatility in our sample of S&P 500 additions.
54

For companies deleted from the Index, I find evidence in support of our
hypothesis that no change in volatility is associated with deletions. As I expect, in a
market value-weighted index like the S&P 500, firms being excluded from the Index
typically represent an extremely small fraction of the Index, as a result volatility should
not change around removal days regardless of whether there is significant trading in the
index-derivative markets or not.
The results support our hypotheses as I find no significant change in volatility of
the firms deleted from the S&P 500. Less than 50% (ranging from 28.57% in the period
1976–1985 to 47.27% in the 1986–2005 period) of the deleted firms experience an
increase in return volatility although the average post-deletion volatilities are generally
higher than pre-deletion volatilities.
Furthermore, I examine the relationship between turnover change and change in
volatility. I calculate percentage turnover change by subtracting pre-inclusion turnover
from post-inclusion turnover and divide this ratio by the pre-inclusion turnover. The
"most active" group consists of the top decile of firms experiencing highest turnover
change. The second group includes firms that experience no change in turnover, and
the third group includes firms that experience the strongest turnover decline. The results
indicate that there is a positive relationship between turnover and return variance.
Lastly, the volatility tests for the NYSE and Nasdaq stocks show that both groups of
stocks experience significant increase in return volatility following inclusion. A closer
look at the results show that Nasdaq-listed firms experience even higher increase in
volatility than NYSE-listed companies.
55

Systematic Risk Measure
Following the results of total risk of returns, I turn to the investigation of
systematic risk surrounding Index composition changes. I estimate stock betas around
the effective day using the methodology specified in Scholes and Williams (1977), in
order to cope with the issue of nonsynchronous trading. Scholes and Williams beta has
been shown to outperform OLS beta in a number of empirical studies. For additions, I
estimate pre- and post-change betas using daily returns in the [-31, -150] and [+31,
+150] windows around the effective day. For deletions, though, I begin with day -16 and
day +16 and estimate betas using 120 trading day returns, due to data limitations of the
deleted companies. The Wilcoxon Signed test is used to determine whether there is
beta shift around the actual Index inclusion or deletion.
Table 14 presents the results regarding beta. The mean pre-inclusion beta is not
significantly different from the post-inclusion beta for the addition sample in the period
covering 1976–1985, consistent with our hypothesis. Over the period 1986–2005,
however, I find a small increase in beta, statistically (not economically significant)
significant at the 10% level. This finding is similar to results documented in Vijh (1994)
and Barberis (2005). The analysis of beta adds to our understanding of risk change
associated with index additions. On the other hand, I find no change in beta around the
event of index removals. Again the results support the hypotheses.
56
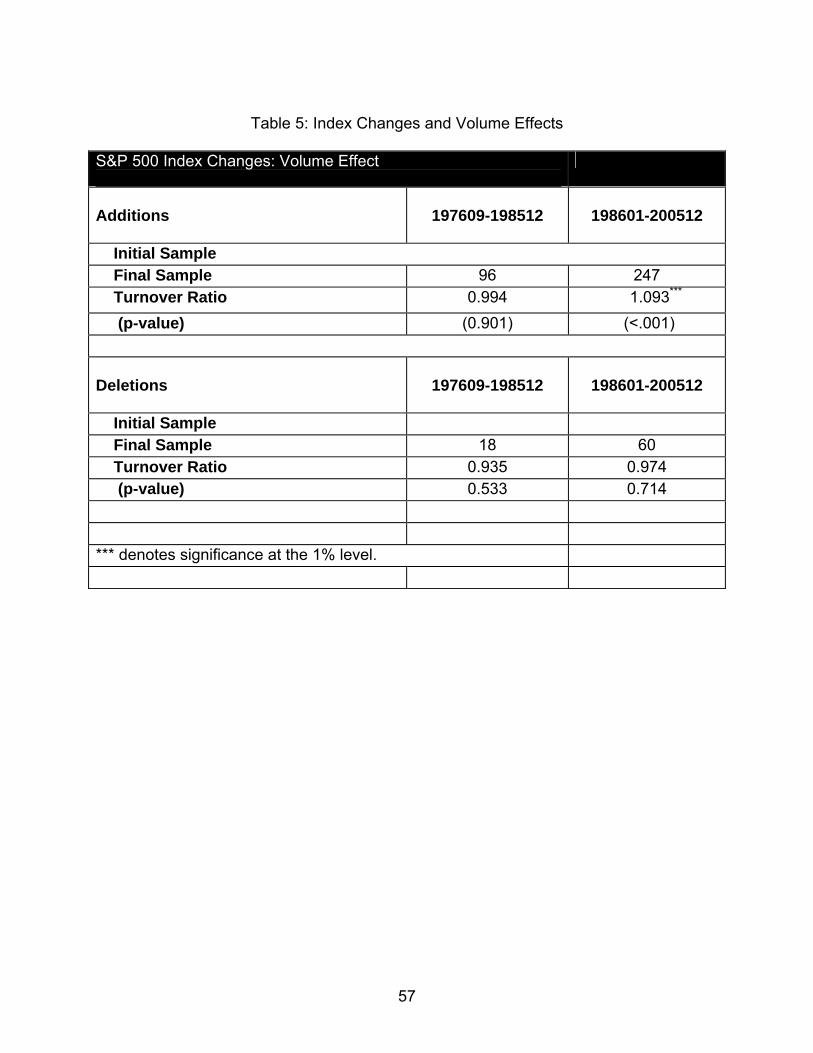
Table 5: Index Changes and Volume Effects
S&P 500 Index Changes: Volume Effect
Additions
197609-198512
198601-200512
Initial Sample Final Sample 96 247 Turnover Ratio 0.994 1.093***
(p-value) (0.901) (<.001) Deletions
197609-198512
198601-200512
Initial Sample Final Sample 18 60 Turnover Ratio 0.935 0.974 (p-value) 0.533 0.714 *** denotes significance at the 1% level.
57

Table 6: Volatility Effect–Return Variance Measure S&P 500 Index Changes: Volatility Effect
Additions Sample
Return Variance Pre-Inclusion Post-inclusion Paired t Wilcoxon Signed Ranks
(Z) 9/76-12/85
0.000514 0.000459 -1.09 -1.527
[% positive = 44.12%]
1/86-12/05
0.000875 0.00114 4.41*** 4.873***
[% positive = 63.75%] Deletions Sample
Return Variance Pre-Inclusion Post-inclusion Paired t Wilcoxon Signed Ranks
(Z) 9/76-12/85
0.000611 0.00090 0.584 -1.527
[% positive = 28.57%]
1/86-12/05
0.00135 0.00132 -0.196 -0.31
[% positive = 47.27%]
58
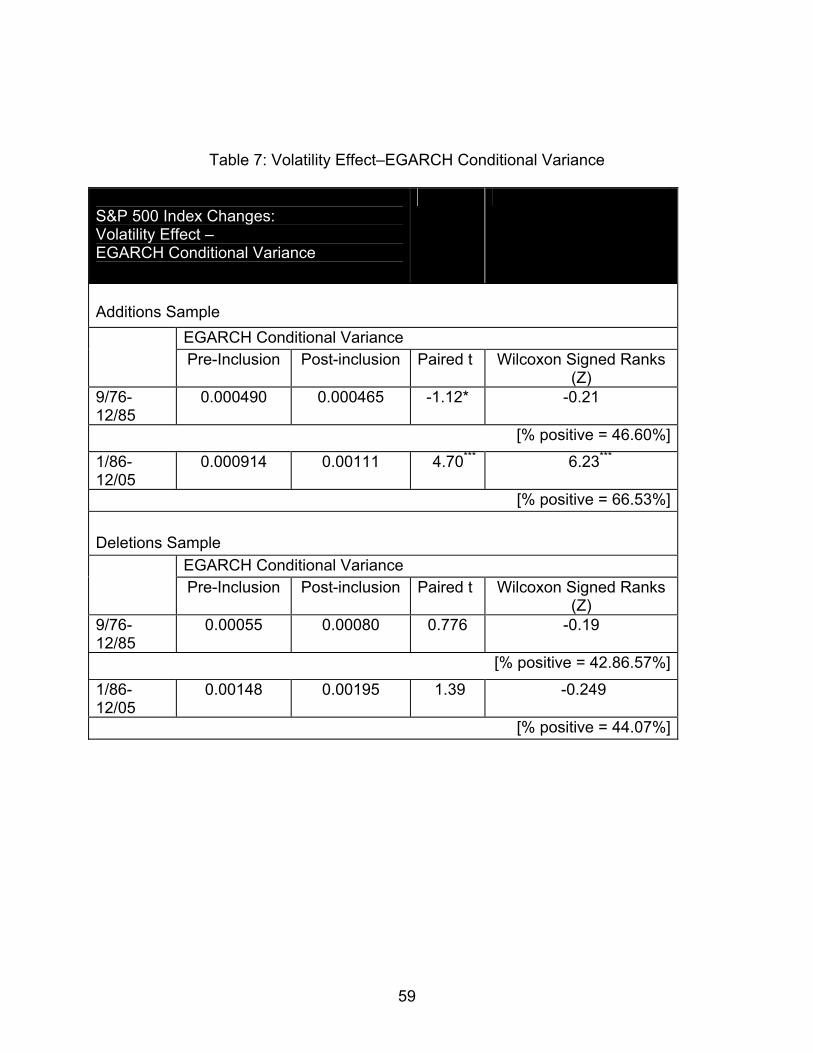
Table 7: Volatility Effect–EGARCH Conditional Variance S&P 500 Index Changes: Volatility Effect – EGARCH Conditional Variance
Additions Sample
EGARCH Conditional Variance Pre-Inclusion Post-inclusion Paired t Wilcoxon Signed Ranks
(Z) 9/76-12/85
0.000490 0.000465 -1.12* -0.21
[% positive = 46.60%]
1/86-12/05
0.000914 0.00111 4.70*** 6.23***
[% positive = 66.53%] Deletions Sample
EGARCH Conditional Variance Pre-Inclusion Post-inclusion Paired t Wilcoxon Signed Ranks
(Z) 9/76-12/85
0.00055 0.00080 0.776 -0.19
[% positive = 42.86.57%]
1/86-12/05
0.00148 0.00195 1.39 -0.249
[% positive = 44.07%]
59

60
Table 8: Volatility Effect–Residual Return Variance S&P 500 Index Changes: Volatility Effect– Idiosyncratic Risk
Additions Sample
Residual Return Variance Pre-Inclusion Post-inclusion Paired t Wilcoxon Signed Ranks
(Z) 9/76-12/85
0.00044 0.00041 -0.62 -0.986
[% positive = 43.14%]
1/86-12/05
0.000766 0.000985 4.24*** 4.450 ***
[% positive = 60.58%] Deletions Sample
Residual Return Variance Pre-Inclusion Post-inclusion Paired t Wilcoxon Signed Ranks
(Z) 9/76-12/85
0.000505 0.000883 0.809 -0.678
[% positive = 38.10%]
1/86-12/05
0.00121 0.00153 1.15 -0.375
[% positive = 46.67%]

Table 9: Volatility Effect from 1976 to 2005 S&P 500 Index Additions Year (Positive/Negative)
Pre-inclusion Volatility
Post-inclusion Volatility
Change in Volatility
Paired t-statistics
Wilcoxon Signed Ranks
1976-1980 (14/22) 0.000491 0.000407 -0.000084 -2.17** -1.82** 1981 (3/11) 0.000446 0.000401 -0.000045 -1.57 -1.60 1982 (10/8) 0.000509 0.000600 0.000091 1.62 1.07 1983 (3/2) 0.000580 0.000612 0.000032 1.08 1.21 1984 (9/9) 0.000540 0.000500 -0.000040 -1.42 -0.54 1985 (9/6) 0.000411 0.000405 -0.000006 -0.21 0.63 1986 (10/4) 0.000483 0.000600 0.000117 1.79** 1.92** 1987 (3/1) 0.000560 0.000850 0.000290 1.29 1.10 1988 (4/5) 0.000267 0.000234 -0.000033 -1.15 -1.00 1989 (14/4) 0.000320 0.000362 0.000042 1.19 1.98** 1990 (6/3) 0.000478 0.000662 0.000184 2.26** 1.84** 1986-1990 (37/17) 0.000398 0.000488 0.000090 2.94*** 3.00*** 1991-1995 (17/15) 0.000490 0.000571 0.000081 1.80** 1.57* 1996-2005 (107/53) 0.001150 0.001400 0.000250 4.13*** 5.13***
61

Table 10: Volatility Effect – Binomial Tests S&P 500 Index Additions Binomial Tests Time Period Number of Firms )RR(Pr 2
122
~~> Z-statistic
197609 – 198512 102 0.497 -0.58 198601 – 200512 251 0.533 9.92***
*** denotes significant at the 1% level ** denotes significant at the 5 % level
Table 11: Analysis of Systematic Risk S&P 500 Index Changes Stock Beta
Additions
Pre-inclusion
Beta
Post-inclusion
Beta
Change in
Beta
Wilcoxon Signed Ranks
1976-1985 1.28 1.23 -0.05 -0.705 1986-2005 1.25 1.29 0.04 1.35*
Deletions
Pre-deletion
Beta
Post-deletion
Beta
Change in Beta
Wilcoxon Signed Ranks
1976-1985 0.72 0.65 -0.07 -0.487 1986-2005 1.05 0.89 -0.16 -0.715
* denotes significantly different from zero at the 10 percent level.
62

63
Table 12: Volatility Effect – NYSE vs. NASDAQ Firms
Index Additions Exchange or Market
No. of Firms
Pre-inclusion Volatility
Post-inclusion Volatility
Paired t-statistic
Wilcoxon Z
NYSE 153 0.00058 0.00071 3.63*** 3.79***
Percentage positive =63.40% Nasdaq 74 0.0014 0.00194 5.53*** 5.26***
Percentage positive =77.03%
Table 13: Monthly Return Variance Index Additions Monthly Return Variance Period
Pre-inclusion Volatility
Post-inclusion Volatility
Paired t-statistic
Wilcoxon Z
197609 | 198512
0.0111 0.0106 -0.54 -0.29
198601 | 200512
0.0177 0.0210 2.47*** 3.31***
*** Significantly different from zero at the 1 percent level.
Table 14: Relationship Between Turnover and Volatility S&P 500 Index Changes Portfolio Group
Mean % TurnoverChange
Pre-inclusion Volatility
Post-inclusion Volatility
Paired t-statistic
Group 1 - Turnover increase 114.60 0.001047 0.001953 4.04***Group 2 - Turnover no change
3.53 0.000688 0.000794 1.13**
Group 3 - Turnover decrease
-25.84 0.00116 0.00124 0.64
*** (**) significantly different from zero at the 1 (5) percent level

Figure 9: Index Additions – Scatter Plot of MSDR (1976-1985)
-150 -100 -50 0 50 100 150
Day
0E0
2E-4
4E-4
6E-4
8E-4
MSDR
64

Figure 10: Index Additions – Scatter Plot of MSDR (1986-2005)
-150 -100 -50 0 50 100 150
Day
1E-4
2E-4
3E-4
4E-4
5E-4
MSDR
65

Figure 11: Index Deletions – Scatter Plot of MSDR (1976-1985)
-150 -100 -50 0 50 100 150
Day
0E0
1E-4
2E-4
3E-4
4E-4
MSDR
66

Figure 12: Index Deletions – Scatter Plot of MSDR (1986-2005)
67
-150 -100 -50 0 50 100 150
Day
0E0
2E-4
4E-4
6E-4
8E-4
MSDR

CHAPTER 8
CONCLUSION In the period following the introduction of S&P 500 index futures and options
(1986–2005), I find significant increase in trading volume and return volatility after a firm
is included in the index. The result is not found during the period prior to the introduction
of index derivative securities. This suggests that the change in risk may be tied to the
observed abnormal returns surrounding the effective date. Upon further investigation, I
find that both daily and monthly return variances increase for the added firms, indicating
that the price effect due to index changes is not due to short-term price pressure. The
empirical evidence supports a downward sloping demand curve for the shares. I ascribe
the change in risk to index arbitrage transactions, although I cannot rule out other
factors (such as portfolio insurance operations and program trading) influencing the
volatility of the added firms.
Furthermore, I confirm a positive relationship between turnover change and
volatility change—the greater the change in turnover, the higher the change in return
volatility following inclusion. This demonstrates that the volatility of the added firms is
affected by trading volume resulting from index trading. Our result is consistent with
Karpoor (1987).
On the other hand, no significant changes in trading volume and return volatility
are found for deleted firms. I argue that the market values of these firms relative to the
market value of the index become extremely small at the time they are removed. Hence,
I did not find a symmetric decrease in trading volume and variance. This provides
68

additional evidence that index trading strategies affect the volatility of the component
shares.
It should be noted that the objective of this study is not to distinguish whether the
trading-volume-induced volatility results from liquidity constraints and/or information
content associated with index changes announcements. This may be further examined
using intraday data, but I focus the linkage between turnover and volatility, instead.
Moreover, this study does not investigate whether the observed positive (negative)
abnormal returns around the inclusion (removal) day are (partially) induced by risk
adjustment. In the future, efforts can be made to determine the excess return
performance in light of event-induced volatility.
69
REFERENCES
Amihud, Yakov and Haim Mendelson, 1986, Asset pricing and bid-ask spread, Journal of Financial Economics 17, 223-249.
Barberis, N., A. Shleifer, and J. Wurgler, 2005, Comovement. Journal of Financial Economics 75, 283-317.
Beneish, Messod D. and Robert E. Whaley, 1996, An anatomy of the "S&P Game": The effects of changing the rules, Journal of Finance 51, 1909-1930.
Bessembinder, H., & Seguin, P. J., 1992, Futures trading activity and stock price volatility, Journal of Finance 47, 2015-2034.
Bollerslev, T., 1986, Generalized autoregressive conditional heteroscedasticity, Journal of Econometrics, 31, 307-327.
Bollerslev, T., R. Y. Chou, and K. F. Kroner, 1992, ARCH Modeling in Finance, Journal of Econometrics 52, 5-59.
Bollerslev, T., Engle, R. F. and Nelson, D., 1994, ARCH models, Handbook of Econometrics, Vol. 4, Chapter 49.
Chen H., Gregory Noronha, and Vijay Singal, 2004, The price response to S&P 500 Index additions and deletions: Evidence of asymmetry and a new explanation, Journal of Finance, LIX, 1901-1929.
Conrad, J., 1989, The price effect of option introduction, Journal of Finance 44, 487-498.
Copeland, T., 1976, A model of asset trading under the assumption of sequential information arrival, Journal of Finance, 31, 1149-1168.
Cox, C.C.,1976, Futures trading and market information, Journal of Political Economy, 48, 1215-1237.
Denis, Diane K., John J. McConnell, Alexei V. Ovtchinnikov, and Yun Yu, 2003, S&P 500 index additions and earnings expectations. Journal of Finance 58, 1821-1840.
Dhillon, Upinder, and Herb Johnson, 1991, Changes in the Standard and Poor's 500 list, Journal of Business 64, 75-85.
Dravid, A., 1987, A note on the behavior of stock returns around ex-dates of stock distributions, Journal of Finance 42, 163-168.
Dubovsky, David, 1991, Volatility increases subject to NYSE and AMEX stock splits, Journal of Finance 46, 421-432.
70
Duffee, G., P. Kupiec, and A. P. White, 1990, A primer on program trading and stock price volatility: A survey of the issues and the evidence, working paper, Board of Governors of the Federal Reserve System.
Edwards. F. R., 1988a, Futures trading and cash market volatility: Stock index and interest rate futures. Journal of Futures Markets 8, 421-439.
Edwards. F. R., 1988b, Does futures trading increase stock market volatility? Financial Analysts Journal 44, 63-69.
Elliott, W.B. and R.S. Warr, 2003, Price pressure on the NYSE and Nasdaq: Evidence from S&P 500 index changes, Financial Management 32, 85-99.
Elliott, William B., Bonnie F. Van Ness, Mark D. Walker and Richard S. Warr, 2006, What drives the S&P 500 inclusion effect? An analytical survey, Financial Management, 35, 31-48.
Engle, R., 1982, Autoregressive conditional heteroskedasticity with estimates of the variance of U.K. inflation, Econometrica, 50, 987-1008.
Epps, T.W., Epps, M.L., 1976, The stochastic dependence of security price changes and transaction volumes: Implications for the mixture-of-distributions hypothesis. Econometrica 44, 305-321.
French, K. R., and R. Roll, 1986, Stock return variances: The arrival of information and the reaction of traders, Journal of Financial Economics 17, 5-26.
Gallant, R.A., Rossi, P.E., Tauchen, G., 1992, Stock prices and volume, Review of Financial Studies 5, 199-242.
Glosten, R. G., Jagannathan, R. and Runkle, D. E.,1993, On the relation between the expected value and the volatility of the nominal excess return on stocks, Journal of Finance, 48, 1779-801.
Goetzmann, William N. and Mark Garry. Does delisting from the S&P 500 affect stock price? Financial Analysts Journal 42, 64-69.
Grossman, S. J., 1988, An analysis of the implications for stock and futures price volatility of program trading and dynamic hedging strategies, Journal of Business 61, 275-298.
Harris, Lawrence, 1989, S&P 500 cash stock price volatilities, Journal of Finance, 44, 1155-1175.
Harris, Lawrence, and Eitan Gurel, 1986, Price and volume effects associated with changes in the S&P 500 list: New evidence for the existence of price pressures. Journal of Finance 41, 815-829.
71

Hegde, Shantaram P. and John B. McDermott, 2003, The liquidity effects of revisions to the S&P 500 index: An empirical analysis, Journal of Financial Markets 6, 413-459.
Ho, T. and R. Macris, 1984, Dealer bid-ask quotes and transaction prices: An empirical study of some AMEX options, Journal of Finance 39, 23-45.
Jain, Prem C., 1987, The effect on stock price of inclusion in or exclusion from the S&P 500, Financial Analysts Journal, 43, 58-65.
Jennings, R.H., L.T. Starks and J.C. Fellingham, 1981, An Equilibrium Model of Asset Trading with Sequential Information Arrival, Journal of Finance, 36, 43-161.
Jones, C.M., Kaul, G., Lipson, M.L., 1994, Transactions, volume, and volatility, Review of Financial Studies 7, 631-651.
Karpoff, J.M., 1987, The relation between price changes and trading volume: A survey, Journal of Financial and Quantitative Analysis 22, 109-126.
Kaul, A., Vikas Mehrotra, and Randall Morck, 2000, Demand curves for stocks do slope down: New evidence from an index weights adjustment, Journal of Finance, 55, 893-912.
Lo, A. W., and A. C. MacKinlay, 1990, When are Contrarian Profits Due to Market Overreaction? Review of Financial Studies, 3, 175-205.
Lynch, Anthony W., and Richard R. Mendenhall, 1997, New evidence on stock price effects associated with changes in the S&P 500 index, Journal of Finance, 70, 351-383.
Merton, Robert C., 1987, Presidential address: A simple model of capital market equilibrium with incomplete information, Journal of Finance 42, 483-510.
Nelson, D., 1991, Conditional heteroscedasticity in asset returns: A new approach, Econometrica, 59, 347-370.
Ohlson, James A. and Stephen H. Penman, 1985, Volatility increases subsequent to stock splits: An empirical aberration, Journal of Financial Economics 14, 251-266.
Peterson, D. and P. Peterson, 1992, A further understanding of stock distributions: The Case of reverse stock splits, Journal of Financial Research 15, 189-205.
Polonchek, J., & Krehbiel, T., 1994, Price and volume effects associated with changes in the Dow Jones averages, Quarterly Review of Economics and Finance 34, 305-316.
72

Pruitt, Stephen W. and K. C. John Wei, 1989, Institutional ownership and changes in the S&P 500, Journal of Finance, 44, 509-513.
Ross, S. A., 1989, Information and volatility: The no-arbitrage martingale approach to timing and resolution irrelevancy. Journal of Finance, 44, 1-17.
Santoni, G. J., 1987, Has programmed trading made stock prices more volatile? Federal Reserve Bank of St. Louis Review, May, 18-29.
Scholes, M., & Williams, J., 1977, Estimating beat from non-synchronous data, Journal of Financial Economics, 5, 309-327.
Shleifer, A., 1986, Do demand curves for stocks slope down? Journal of Finance 41, 579-590.
Stein, J. C., 1987, Information externalities and welfare-reducing speculation, Journal of Political Economy, 95, 1123-1145.
Stoll, Hans R. and Robert E. Whaley, 1987, Expiration day effects of index options and futures, Financial Analysts Journal 43, 16-28.
Tauchen, G. E., and Pitts, M., 1983, The price variability-volume relationship on speculative markets. Econometrica, 51, 485-505.
Vijh, A., 1994, S&P 500 trading strategies and stock betas, Review of Financial Studies 7, 215-251.
Wurgler, Jeffery, and Katia Zhuravskaya, 2002, Does arbitrage flatten demand curves for stocks? Journal of Business, 75, 583-608.
73


