
Changing Faces – Profile of
Burlington Newcomers
November 2010

© 2010 Community Development Halton, all rights reserved. Copies of this document may be reproduced non-commercially for the purpose of community awareness or community development with appropriate recognition to Community Development Halton (CDH). In all other cases, permission must be sought from CDH. Electronic copies of this report are available from: Community Development Halton 860 Harrington Court Burlington, ON L7N 3N4 Phone: (905) 632-1975 Fax: (905) 632-0778 Email: [email protected] Web: www.cdhalton.ca
A United Way Member Agency Research Team Dr. Joey Edwardh, Executive Director Ted Hildebrandt, Director of Social Planning Richard Lau, Research Associate
Changing Faces – Profile of Burlington Newcomers i
Table of Contents 1. Introduction ................................................................................................................................ 1
1.1 Data Sources ......................................................................................................................... 1
1.2 Geographic Areas .................................................................................................................. 2
2. Geographic Distribution .............................................................................................................. 5
3. Place of Birth ............................................................................................................................... 7
4. Age Distribution .......................................................................................................................... 9
5. Mother Tongue ......................................................................................................................... 11
6. Home Language ........................................................................................................................ 13
7. Knowledge of Official Languages .............................................................................................. 14
8. Visible Minority ......................................................................................................................... 14
9. Postsecondary Education .......................................................................................................... 17
10. Major Field of Study ................................................................................................................ 18
11. Occupations ............................................................................................................................ 19
12. Labour Force Activity .............................................................................................................. 21
13. Income .................................................................................................................................... 23
14. Low Income ............................................................................................................................. 25
15. Summary ................................................................................................................................. 27
Table of Figures Figure 1. Newcomers by top ten places of birth, City of Burlington (1996-2006) ......................... 8
Figure 2. Proportion of total and newcomer population by age groups, City of Burlington, 2006....................................................................................................................................................... 10
Figure 3. Proportion of total population by top ten non-official mother tongue, City of Burlington, 2006 ........................................................................................................................... 11
Figure 4. Proportion of newcomers by top ten non-official mother tongue, City of Burlington, 2006 .............................................................................................................................................. 12
Figure 5. Proportion of newcomers by the top ten non-official home languages, City of Burlington, 2006 ........................................................................................................................... 13
Figure 6. Proportion of visible minority population, City of Burlington, 2006 ............................. 15
Figure 7. Educational attainment (population 25-64 years), City of Burlington, 2006 ................ 17
Figure 8. Proportion of recent immigrants by major field of study and by sex, City of Burlington, 2006 .............................................................................................................................................. 18
Figure 9. Proportion of labour force by major occupational groups, City of Burlington, 2006 ... 20
Figure 10. Unemployment rate by age group and by sex, City of Burlington, 2006 .................... 21
Figure 11. Proportion of population (15 years +) with employment income by work activity and by sex, City of Burlington, 2006 .................................................................................................... 22
Figure 12. Median total income by sex, City of Burlington, 2005 ................................................ 23
Figure 13. Median employment income by sex, City of Burlington, 2005 ................................... 24
Figure 14. Prevalence of low income by selected groups, City of Burlington, 2005 .................... 25
Changing Faces – Profile of Burlington Newcomers ii
Table of Maps Map 1. Census Tracts, City of Burlington, 2006 .............................................................................. 3
Map 2. Dissemination Areas, City of Burlington, 2006 ................................................................... 4
Map 3. Locations of newcomers (1996-2001, 2001-2006), City of Burlington .............................. 6
Map 4. Top four visible minority newcomers, City of Burlington, 2006 ...................................... 16
Map 5. Low income newcomers by Census Tract, City of Burlington, 2005 ................................ 26
Changing Faces – Profile of Burlington Newcomers 1
1. Introduction
Canada is a country of immigrants. One in five (20%) residents were born outside Canada. The proportion of the immigrant population varies in communities across the nation. In the City of Burlington, the proportion of foreign born population (22%) in the City of Burlington is higher than the national average of 20%. According to the latest Canadian Census (2006), over 4,000 immigrants have settled in the City of Burlington between 2001 and 2006. Statistics Canada defines recent immigrants or newcomers as landed immigrants who came to Canada up to five years prior to a given census year. However, some of them might have lived in another municipality in Ontario or another province prior to moving to Burlington. Moving to a new country always presents challenges especially for those immigrants who speak a different language and come from a different cultural background. In order to facilitate their transition and settlement in Canada, various levels of government have put settlement programs in place. Some of the programs are delivered by nonprofit organizations on behalf of the government. At the same time, many nonprofit social agencies also provide a variety of services to newcomers in their communities. Given the changing face of the newcomer population in Burlington, the United Way of Burlington and Greater Hamilton requested that Community Development Halton develop a report on newcomers in order to better understand their socio-economic circumstances, their needs and thus implications for social services. This report will provide background documentation that will allow community social agencies to respond and embrace the growing diversity in Burlington. The purpose of this work is to review and document the emerging demographics of Burlington’s newcomer population; to locate through mapping the location of newcomers and importantly their neighbourhoods where clusters of newcomers live. This report will also form part of the foundation information for the emerging region-wide initiative, the Halton Newcomer Strategy (HNS). This initiative is intended to coordinate cross-sector planning targeted at improving the quality of life for newcomers to Halton.
1.1 Data Sources To support this study, data were used from Statistics Canada’s 2006 Census. The 2006 Census is not only the most detailed and reliable source of socio-demographic characteristics of newcomers, it also allows comparison to be made across time periods. The data on newcomers came from a special Target Group Profile (TGP) tabulation. However, the content of the TGP pertains only to individuals; data on newcomer families, households or dwellings are not available.

Changing Faces – Profile of Burlington Newcomers 2
1.2 Geographic Areas
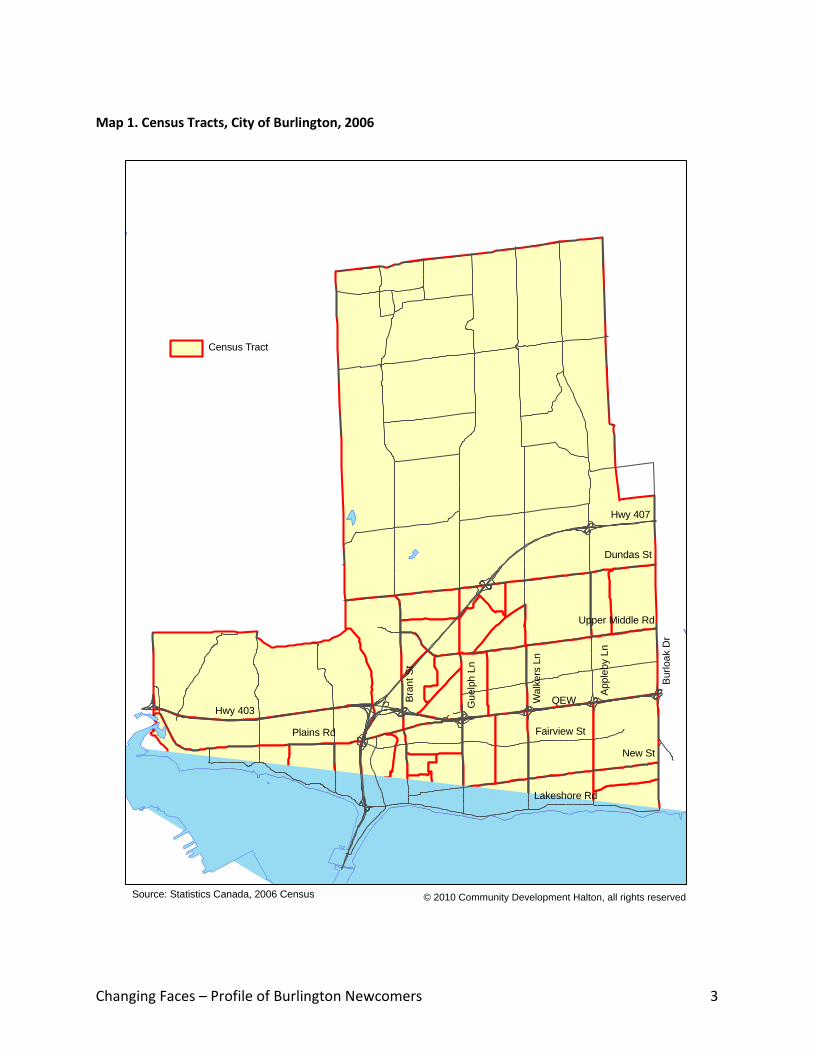
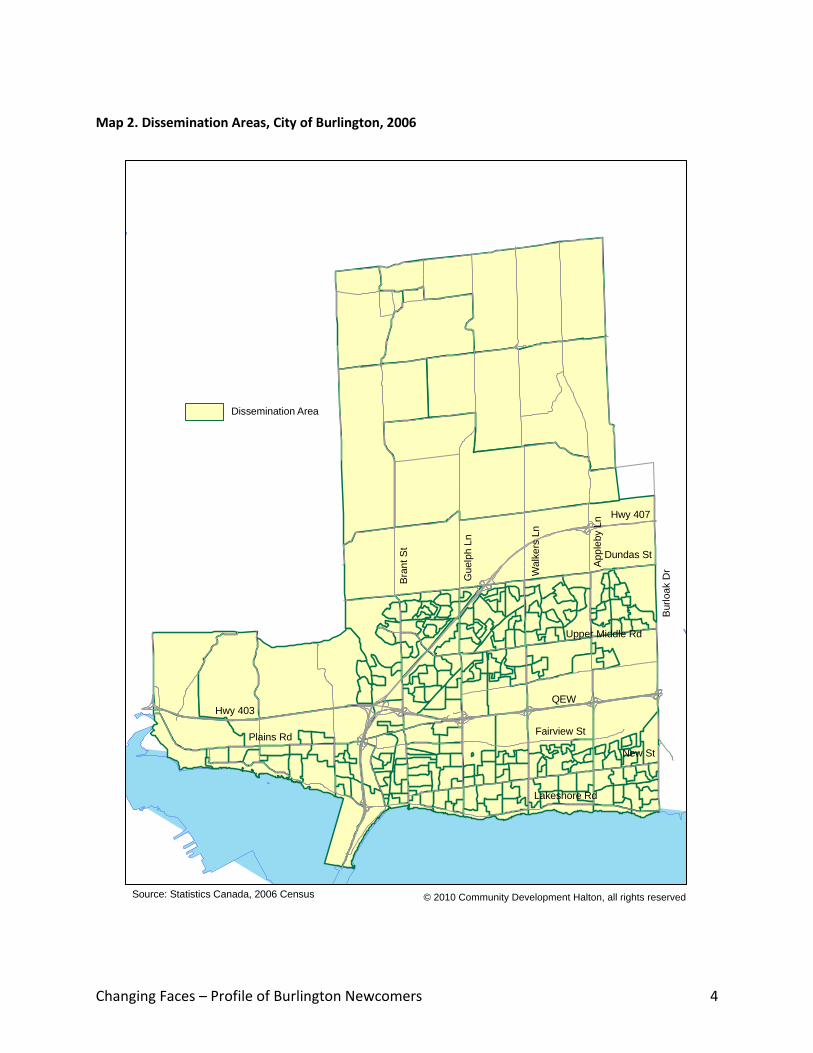
Census data are available at different level of geographies. For example, Dissemination Area (DA) covers an area with an average of 500 persons. DA is the lowest level of geography where most of the census data are available. Census Tract (CT) is a relatively permanent area with a population range of 2,500 to 8,000 and the greatest possible social and economic homogeneity. As illustrated in Maps 1 and 2, there are 38 Census Tracts and 255 Dissemination Areas in Burlington respectively. Each Census Tract incorporates a number of Dissemination Areas which allows for in depth exploration and understanding of the social structure of the City of Burlington.
Changing Faces – Profile of Burlington Newcomers 3
Map 1. Census Tracts, City of Burlington, 2006
Source: Statistics Canada, 2006 Census © 2010 Community Development Halton, all rights reserved
Hwy 407
Dundas St
Upper Middle Rd
QEW
New St
Fairview St
Lakeshore Rd
Plains Rd
Hwy 403
Bra
nt
St
Gu
elp
h L
n
Walk
ers
Ln
App
leby L
n
Burl
oa
k D
r
Census Tract
Changing Faces – Profile of Burlington Newcomers 4
Map 2. Dissemination Areas, City of Burlington, 2006
Source: Statistics Canada, 2006 Census © 2010 Community Development Halton, all rights reserved
Dissemination Area
Hwy 407
Dundas St
Upper Middle Rd
QEW
New St
Fairview St
Lakeshore Rd
Plains Rd
Hwy 403
Bra
nt
St
Gu
elp
h L
n
Walk
ers
Ln
App
leby L
n
Burl
oa
k D
r

Changing Faces – Profile of Burlington Newcomers 5
2. Geographic Distribution
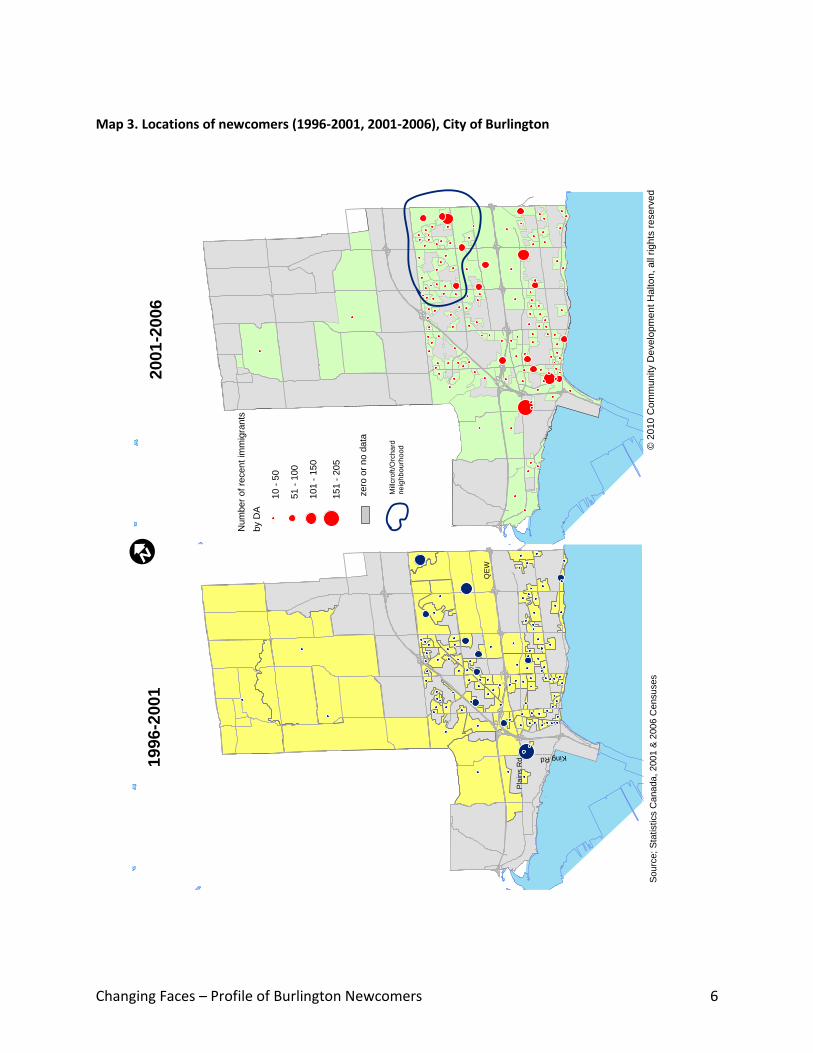
The number of newcomers has grown by over 40% between the periods of 1996-2001 and 2001-2006. This increase suggests a changing trend with respect to who choses to live in the Burlington area. In 2006, there were over 4,000 newcomers living in the City of Burlington representing 4.1% of the total population. This proportion is above the national average of 3.5% and slightly below the provincial average of 4.8%. As a service provider, it is as important to know the socio-economic characteristics of newcomers as it is to know their whereabouts within the community. By knowing their locations, public services can be more effectively and efficiently deployed. Services that were offered in the past may not be needed due to the change of client base in a particular location. Un-served or under-served areas can be identified and social service agencies can better serve the newcomers by deploying their often limited resources more strategically. Map 3 compares the geographic distribution of newcomers in 2001 and 2006. While newcomers settle throughout the city, some clusters of newcomers in certain areas can be identified. Most of those who came between 1996 and 2001 chose to live in areas north of the QEW (Queen Elizabeth Way). For those who arrived after 2001, many settled in the downtown area as well as in the newly developed area of Millcroft/Orchard.
Changing Faces – Profile of Burlington Newcomers 6
1996
-2001
2001
-2006
Sourc
e;
Sta
tistics C
anada, 2001 &
2006 C
ensuses
King Rd
Pla
ins R
d
QE
WI
zero
or
no d
ata
© 2
01
0 C
om
munity D
eve
lopm
en
t H
alton,
all
rights
reserv
ed
Mill
cro
ft/O
rch
ard
ne
igh
bo
urh
ood
Num
ber
of re
cent im
mig
rants
by D
A
10 -
50
51 -
100
101 -
150
151 -
205
Map 3. Locations of newcomers (1996-2001, 2001-2006), City of Burlington
Changing Faces – Profile of Burlington Newcomers 7
3. Place of Birth
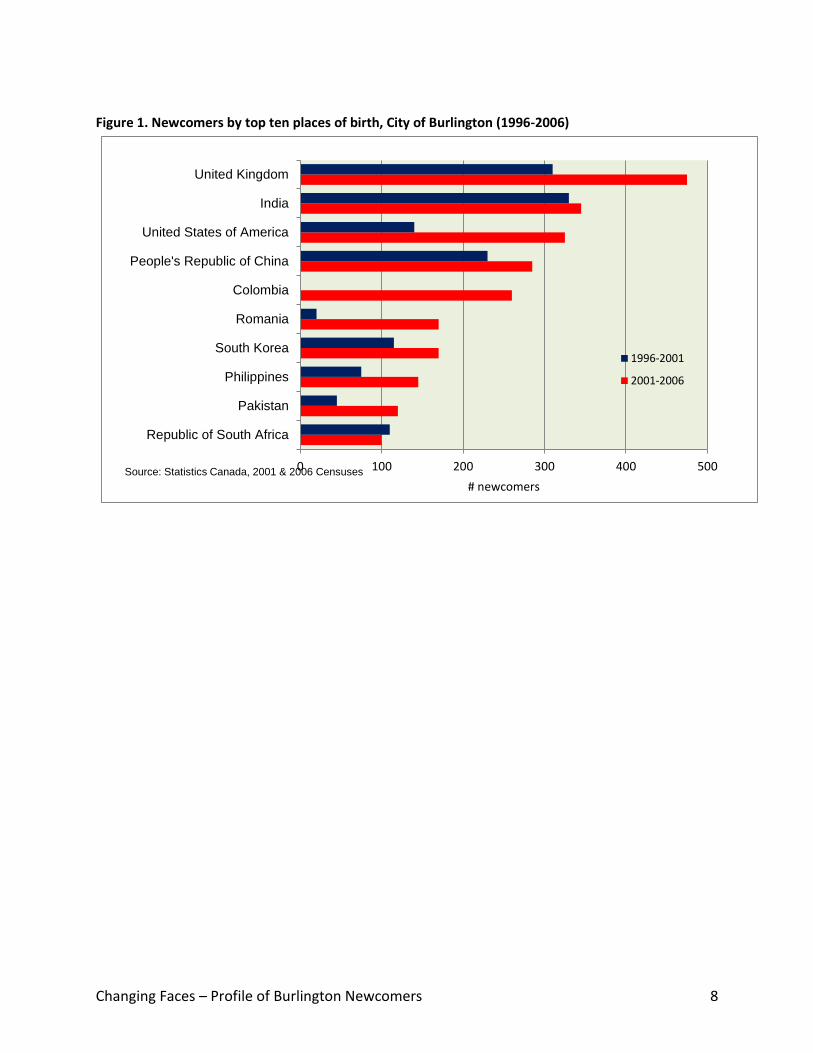
Since the 1970s, the majority of immigrants coming to Canada shifted from Europe to non-European countries. In 1971, about 60% of newcomers who arrived in Canada between 1966 and 1971 were from European countries; in 2006, only 16% originated from those countries. However, the City of Burlington still attracted a higher proportion (29%) of newcomers from European countries than Canada (16%) as a nation. Figure 1 shows the number of newcomers by the ten most popular place of birth between the periods of 1996-2001 and 2001-2006. The top four countries of origin of newcomers remain the same; they are United Kingdom, India, United States of America and the People’s Republic of China. Most newcomers to Burlington have come from the United Kingdom. They accounted for about 11% of all newcomers. While the 2001 Census recorded no recent immigrants from Columbia, over 250 Columbians came to Canada and settled in Burlington between 2001 and 2006. The newcomers from Columbia have become part of Burlington’s diversity. Newcomers from other popular countries such as the United States of America, Romania, Pakistan and the Philippines have more than doubled between the same periods.
Changing Faces – Profile of Burlington Newcomers 8
Figure 1. Newcomers by top ten places of birth, City of Burlington (1996-2006)
0 100 200 300 400 500
Republic of South Africa
Pakistan
Philippines
South Korea
Romania
Colombia
People's Republic of China
United States of America
India
United Kingdom
# newcomers
1996-2001
2001-2006
Source: Statistics Canada, 2001 & 2006 Censuses
Changing Faces – Profile of Burlington Newcomers 9
4. Age Distribution
The age structure of the newcomer population has significant implications on the need and demand for services such as health, education, training, parks and recreational, social and employment. Overall, the newcomer population is younger than the total population. As shown in Figure 2, over two-thirds (69%) of the recent immigrants are below the age of 40 compared to nearly half (49%) for the total population. With the exception of the 0-4 age group, the recent immigrant population has a higher percentage in the age groups between 5 and 19. Also, the proportion of recent immigrant in the age groups between 30 and 44 is also higher than the total population. In fact, the percentage of recent immigrants in the 30-44 age group is nearly double that of the total population. This seems to indicate that many newcomers are families with children settling in Burlington. For all age groups over 45, the recent immigrant population has a lower proportion than the total population. For example, less than 6% of the recent immigrants are seniors compared to 12% of the total population of the City of Burlington. Children from non-English speaking newcomer families will face some challenges in adjusting to a new school system and environment. On the other hand, there are opportunities for schools to introduce different sports and recreational activities familiar to newcomer students from different cultural backgrounds.

Changing Faces – Profile of Burlington Newcomers 10
Figure 2. Proportion of total and newcomer population by age groups, City of Burlington, 2006
0%
2%
4%
6%
8%
10%
12%
14%
16%newcomers
total population
Source: Statistics Canada, 2006 Census
Changing Faces – Profile of Burlington Newcomers 11
5. Mother Tongue
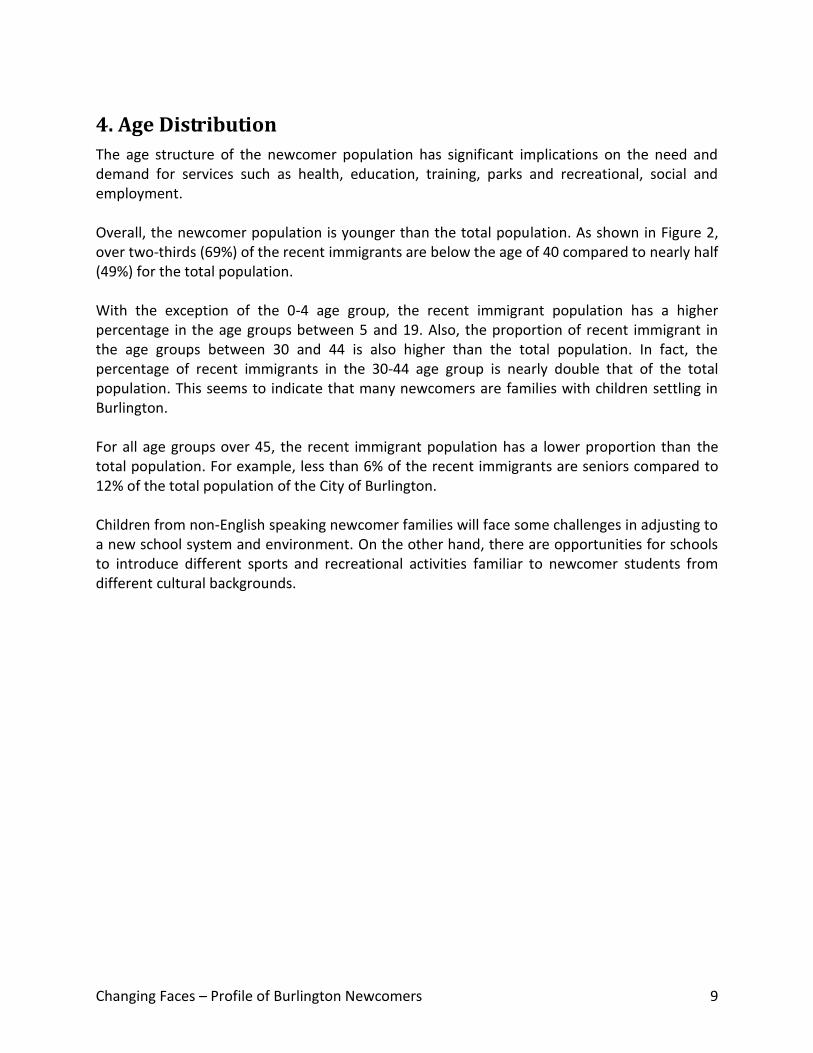
Mother tongue is the first language learned at home in childhood and still understood by the individual. People whose mother tongue is neither English nor French are allophones. Government and settlement agencies rely on information such as mother tongue and home language to develop appropriate programs for allophone newcomers. In 2006, there are about 25,000 allophones in Burlington representing about 15% of the total population. Collectively, they spoke more than 60 non-official mother tongues. Figure 3 shows top ten non-official mother tongues spoken by the general population. Polish, Italian, German and Spanish are spoken by at least 1% of the total population. Figure 3. Proportion of total population by top ten non-official mother tongue, City of Burlington, 2006
0.5%
0.6%
0.6%
0.7%
0.9%
0.9%
1.0%
1.2%
1.3%
1.5%
Chinese, n.o.s.
Croatian
Portuguese
Arabic
Panjabi (Punjabi)
Dutch
Spanish
German
Italian
Polish
% population
Source: Statistics Canada, 2006 Census n.o.s. not otherwise specified
Following the shift of the main source of immigrants to non-European countries, different mother tongues are spoken by the newcomers. Over 60% of the newcomers are allophones.
Changing Faces – Profile of Burlington Newcomers 12
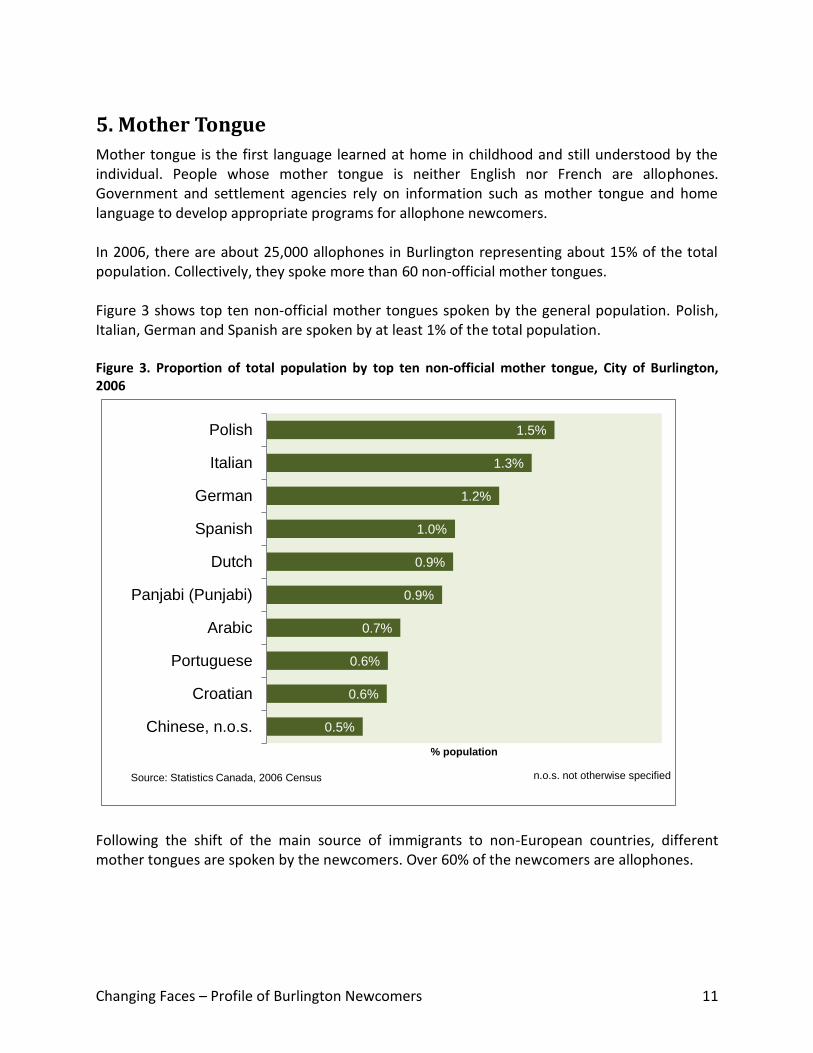
As shown in Figure 4, only four of the top ten non-official mother tongues (Spanish, Panjabi, Arabic and Chinese n.o.s.1 ) are spoken by the newcomers, their popularity has also changed. At the same time, Polish, Italian, German, Portuguese and Dutch had all dropped off the most popular list. They are replaced by Korean, Romanian, Russia, Tagalog and Mandarin. Spanish has become the most popular non-official mother tongue for the newcomers. It is spoken by one in 10 newcomers. Arabic became the second most spoken mother tongue. Figure 4. Proportion of newcomers by top ten non-official mother tongue, City of Burlington, 2006
2.6%
2.6%
2.7%
3.1%
3.4%
3.7%
4.0%
4.4%
5.3%
11.4%
Mandarin
Tagalog (Pilipino, Filipino)
Russian
Other languages
Panjabi (Punjabi)
Chinese, n.o.s.*
Romanian
Korean
Arabic
Spanish
% newcomers
Source: Statistics Canada, 2006 Census *n.o.s. not otherwise specified
1 In the 2006 Census, 'Chinese, n.o.s. (not otherwise specified)' includes responses of 'Chinese' as well as all
Chinese languages other than Cantonese, Mandarin, Taiwanese, Chaochow (Teochow), Fukien, Hakka and Shanghainese.
Changing Faces – Profile of Burlington Newcomers 13
6. Home Language
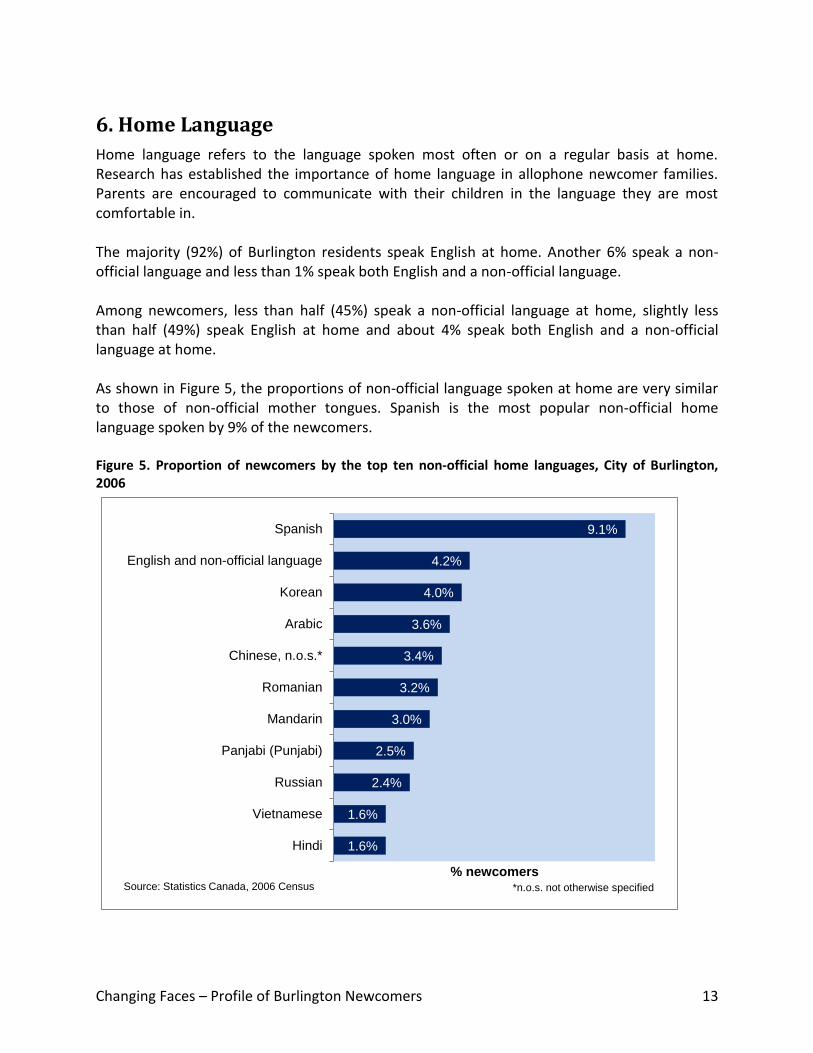
Home language refers to the language spoken most often or on a regular basis at home. Research has established the importance of home language in allophone newcomer families. Parents are encouraged to communicate with their children in the language they are most comfortable in. The majority (92%) of Burlington residents speak English at home. Another 6% speak a non-official language and less than 1% speak both English and a non-official language. Among newcomers, less than half (45%) speak a non-official language at home, slightly less than half (49%) speak English at home and about 4% speak both English and a non-official language at home. As shown in Figure 5, the proportions of non-official language spoken at home are very similar to those of non-official mother tongues. Spanish is the most popular non-official home language spoken by 9% of the newcomers. Figure 5. Proportion of newcomers by the top ten non-official home languages, City of Burlington, 2006
1.6%
1.6%
2.4%
2.5%
3.0%
3.2%
3.4%
3.6%
4.0%
4.2%
9.1%
Hindi
Vietnamese
Russian
Panjabi (Punjabi)
Mandarin
Romanian
Chinese, n.o.s.*
Arabic
Korean
English and non-official language
Spanish
% newcomersSource: Statistics Canada, 2006 Census *n.o.s. not otherwise specified
Changing Faces – Profile of Burlington Newcomers 14
7. Knowledge of Official Languages
Knowledge of official languages refers to the ability to conduct a conversation in English only, in French only, in both English and French, or in neither of the official languages. It is important to note that language knowledge focuses on conversation and speaking. There is no indication to show one’s ability to read or write in an official language. The majority (86%) of newcomers reported having knowledge of the English language (not reading or writing). About 9% can conduct a conversation in both English and French. About 4% were not able to carry on a conversation in either English or French.
8. Visible Minority
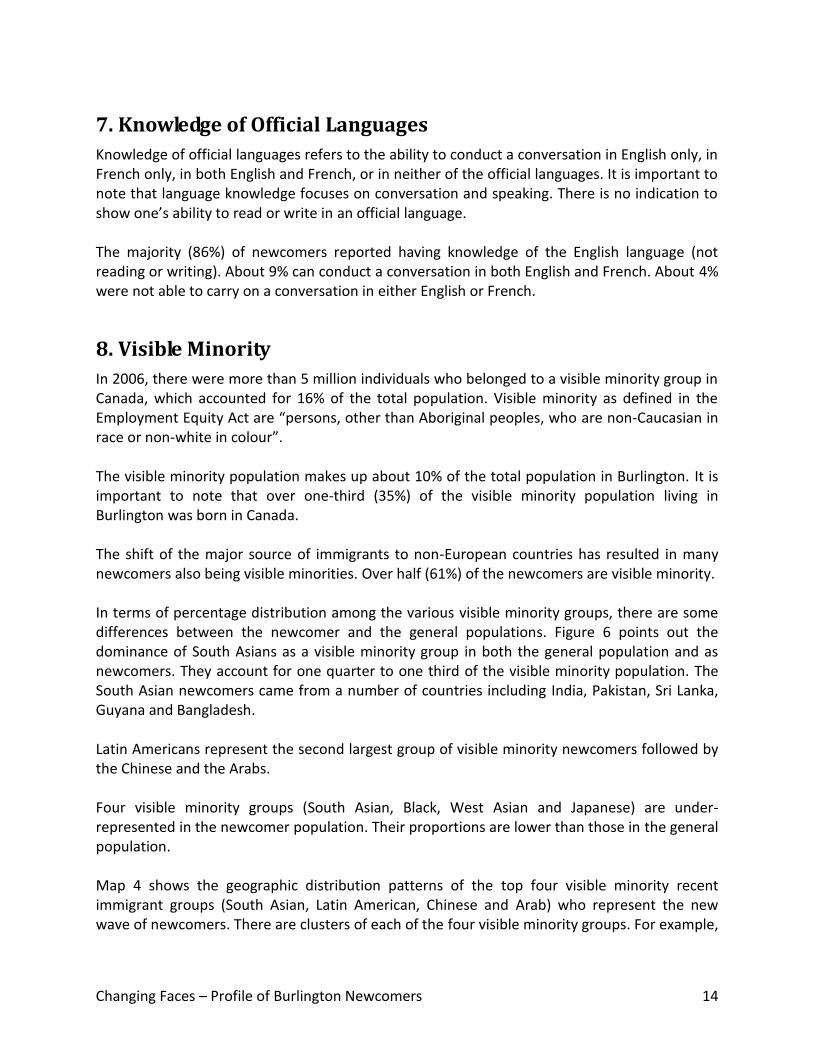
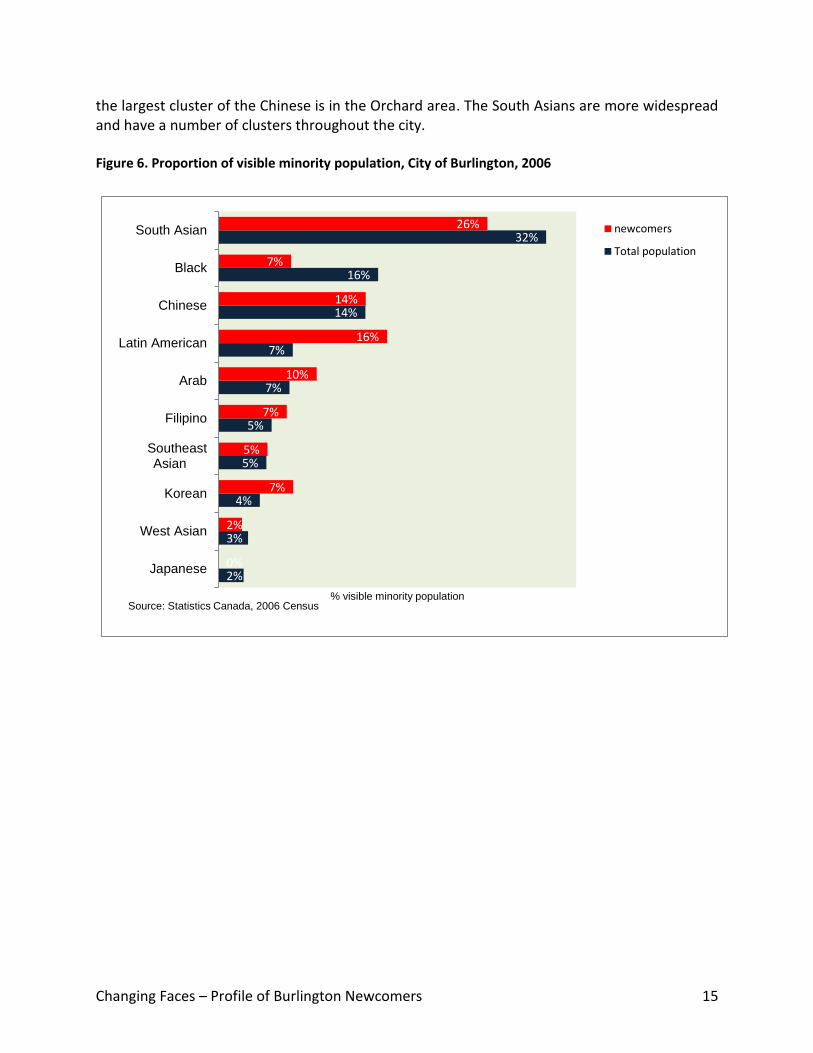
In 2006, there were more than 5 million individuals who belonged to a visible minority group in Canada, which accounted for 16% of the total population. Visible minority as defined in the Employment Equity Act are “persons, other than Aboriginal peoples, who are non-Caucasian in race or non-white in colour”. The visible minority population makes up about 10% of the total population in Burlington. It is important to note that over one-third (35%) of the visible minority population living in Burlington was born in Canada. The shift of the major source of immigrants to non-European countries has resulted in many newcomers also being visible minorities. Over half (61%) of the newcomers are visible minority. In terms of percentage distribution among the various visible minority groups, there are some differences between the newcomer and the general populations. Figure 6 points out the dominance of South Asians as a visible minority group in both the general population and as newcomers. They account for one quarter to one third of the visible minority population. The South Asian newcomers came from a number of countries including India, Pakistan, Sri Lanka, Guyana and Bangladesh. Latin Americans represent the second largest group of visible minority newcomers followed by the Chinese and the Arabs. Four visible minority groups (South Asian, Black, West Asian and Japanese) are under-represented in the newcomer population. Their proportions are lower than those in the general population. Map 4 shows the geographic distribution patterns of the top four visible minority recent immigrant groups (South Asian, Latin American, Chinese and Arab) who represent the new wave of newcomers. There are clusters of each of the four visible minority groups. For example,
Changing Faces – Profile of Burlington Newcomers 15
the largest cluster of the Chinese is in the Orchard area. The South Asians are more widespread and have a number of clusters throughout the city. Figure 6. Proportion of visible minority population, City of Burlington, 2006
2%
3%
4%
5%
5%
7%
7%
14%
16%
32%
0%
2%
7%
5%
7%
10%
16%
14%
7%
26%
Japanese
West Asian
Korean
SoutheastAsian
Filipino
Arab
Latin American
Chinese
Black
South Asian
% visible minority population
newcomers
Total population
Source: Statistics Canada, 2006 Census
Changing Faces – Profile of Burlington Newcomers 16
Map 4. Top four visible minority newcomers, City of Burlington, 2006
Number of visible minority
recent immigrants by DA
10 - 20
21 - 40
41 - 60
Latin American South Asian
Arab Chinese
Source: Statistics Canada, 2006 Census © 2010 Community Development Halton, all rights reserved
Changing Faces – Profile of Burlington Newcomers 17
9. Postsecondary Education
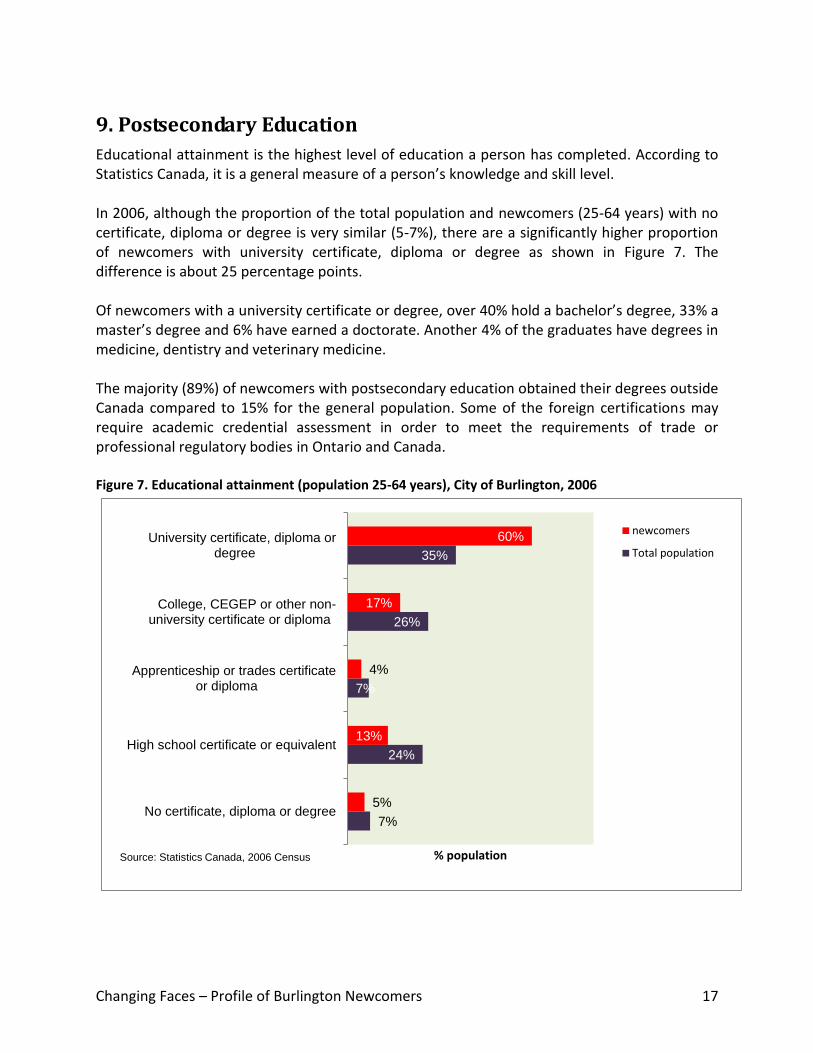
Educational attainment is the highest level of education a person has completed. According to Statistics Canada, it is a general measure of a person’s knowledge and skill level. In 2006, although the proportion of the total population and newcomers (25-64 years) with no certificate, diploma or degree is very similar (5-7%), there are a significantly higher proportion of newcomers with university certificate, diploma or degree as shown in Figure 7. The difference is about 25 percentage points. Of newcomers with a university certificate or degree, over 40% hold a bachelor’s degree, 33% a master’s degree and 6% have earned a doctorate. Another 4% of the graduates have degrees in medicine, dentistry and veterinary medicine. The majority (89%) of newcomers with postsecondary education obtained their degrees outside Canada compared to 15% for the general population. Some of the foreign certifications may require academic credential assessment in order to meet the requirements of trade or professional regulatory bodies in Ontario and Canada. Figure 7. Educational attainment (population 25-64 years), City of Burlington, 2006
7%
24%
7%
26%
35%
5%
13%
4%
17%
60%
No certificate, diploma or degree
High school certificate or equivalent
Apprenticeship or trades certificateor diploma
College, CEGEP or other non-university certificate or diploma
University certificate, diploma ordegree
% population
newcomers
Total population
Source: Statistics Canada, 2006 Census
Changing Faces – Profile of Burlington Newcomers 18
10. Major Field of Study
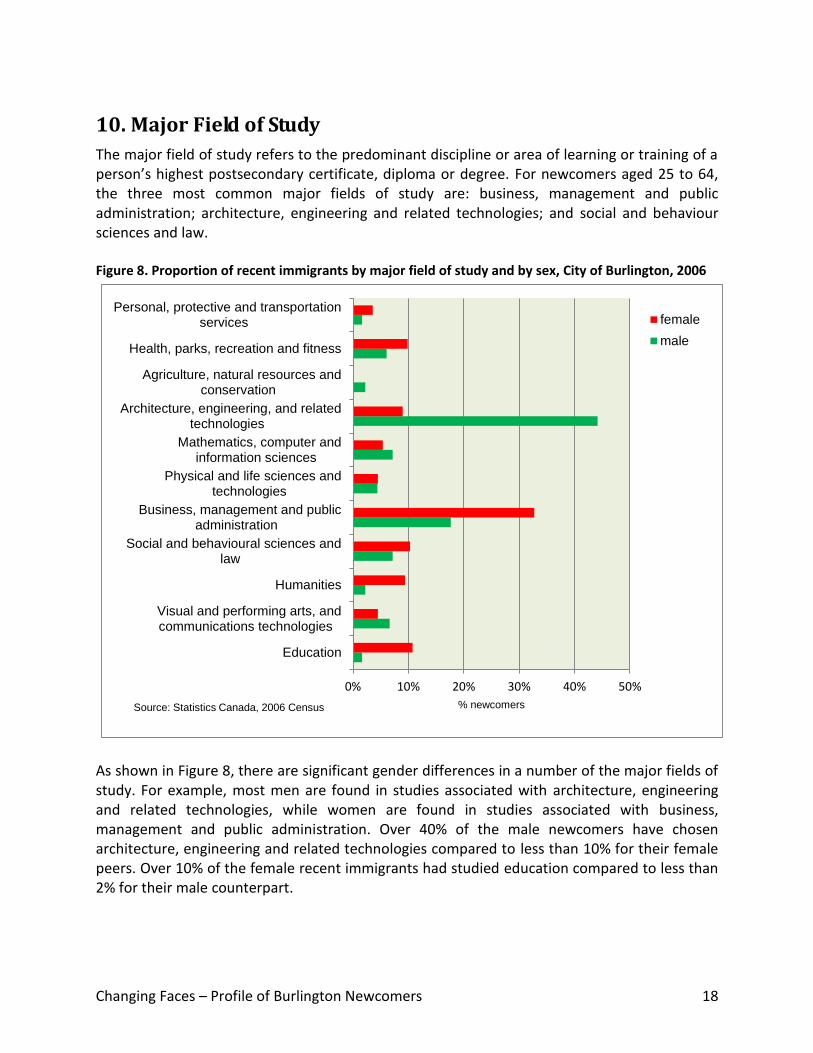
The major field of study refers to the predominant discipline or area of learning or training of a person’s highest postsecondary certificate, diploma or degree. For newcomers aged 25 to 64, the three most common major fields of study are: business, management and public administration; architecture, engineering and related technologies; and social and behaviour sciences and law. Figure 8. Proportion of recent immigrants by major field of study and by sex, City of Burlington, 2006
0% 10% 20% 30% 40% 50%
Education
Visual and performing arts, andcommunications technologies
Humanities
Social and behavioural sciences andlaw
Business, management and publicadministration
Physical and life sciences andtechnologies
Mathematics, computer andinformation sciences
Architecture, engineering, and relatedtechnologies
Agriculture, natural resources andconservation
Health, parks, recreation and fitness
Personal, protective and transportationservices
% newcomers
female
male
Source: Statistics Canada, 2006 Census
As shown in Figure 8, there are significant gender differences in a number of the major fields of study. For example, most men are found in studies associated with architecture, engineering and related technologies, while women are found in studies associated with business, management and public administration. Over 40% of the male newcomers have chosen architecture, engineering and related technologies compared to less than 10% for their female peers. Over 10% of the female recent immigrants had studied education compared to less than 2% for their male counterpart.
Changing Faces – Profile of Burlington Newcomers 19
11. Occupations
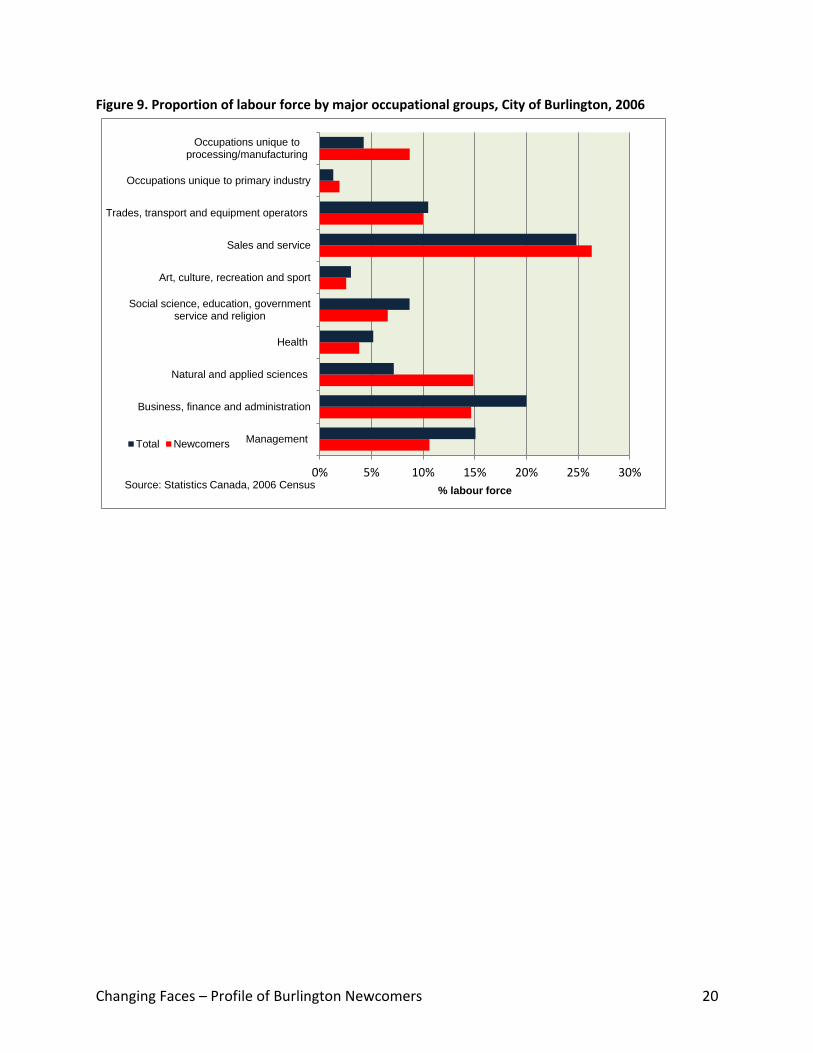
“Occupation” describes the type of work an individual does in a workplace. “Labour force” refers to persons (15 years and over) who were either employed or unemployed during the week of the Census. There were two major occupational groups with a significantly higher proportion of newcomer than the total population (Figure 9). The proportion of newcomer labour force working in the natural and applied sciences and related occupations is twice that of the general labour force (15% versus 7%). Examples of natural and applied sciences and related occupations include: engineers, architects, chemists, biologists, and computer and information systems professionals. There was also a higher proportion of newcomer labour force in the occupations unique to processing, manufacturing and utilities (8% versus 4%). Also, the proportion of newcomer labour force in the sales and service occupations was slightly higher than the total population. On the other hand, newcomers were underrepresented in major occupational groups such as social science, education, government services and religion; business, finance and administration; and management. In the trades, transport and equipment operators and related occupations, the proportion for the two population groups is almost the same at about 10%. The information on newcomer’s occupations and the comparison with those of the general population suggests opportunities and potentials. It will be useful to an organization or business looking for diversity in its workforce. An employer in the applied science field may want to turn to the newcomer workforce for potential recruits.
Changing Faces – Profile of Burlington Newcomers 20
Figure 9. Proportion of labour force by major occupational groups, City of Burlington, 2006
0% 5% 10% 15% 20% 25% 30%
Management
Business, finance and administration
Natural and applied sciences
Health
Social science, education, governmentservice and religion
Art, culture, recreation and sport
Sales and service
Trades, transport and equipment operators
Occupations unique to primary industry
Occupations unique toprocessing/manufacturing
% labour force
Total Newcomers
Source: Statistics Canada, 2006 Census

Changing Faces – Profile of Burlington Newcomers 21
12. Labour Force Activity
One of the greatest challenges facing newcomers is successful entry into the Canadian labour market. As a group, newcomers have a higher unemployment rate than the general population. This gap exists across age groups and both genders. Programs that help newcomers into the labour market include: job-search skills, employment counselling and placement, specific skills upgrading and certificating programs, internships, literacy training, basic skills training and specific programs for foreign trained professionals. As shown in Figure 10, over one in ten (11%) newcomers in Burlington was unemployed compared to 5% for the total population (15 years and over). Three in ten newcomers (male and female) between 15 and 24 years were unemployed. The gap becomes narrower for the age group over 25 years (8% versus 3.5%). The unemployment rate for male newcomers (15 years+) is lower than their female peers (4.9% versus 5.8%). Female newcomers aged 25 years and over were three times more likely to be unemployed than their male counterparts Figure 10. Unemployment rate by age group and by sex, City of Burlington, 2006
Changing Faces – Profile of Burlington Newcomers 22
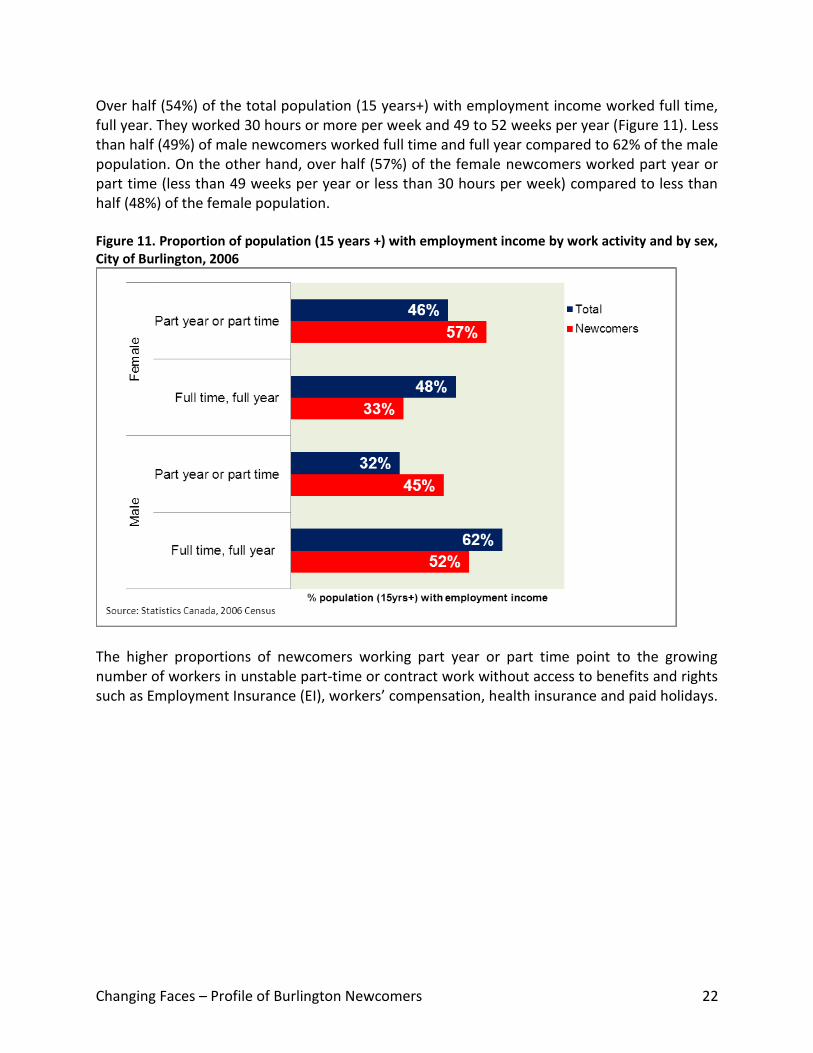
Over half (54%) of the total population (15 years+) with employment income worked full time, full year. They worked 30 hours or more per week and 49 to 52 weeks per year (Figure 11). Less than half (49%) of male newcomers worked full time and full year compared to 62% of the male population. On the other hand, over half (57%) of the female newcomers worked part year or part time (less than 49 weeks per year or less than 30 hours per week) compared to less than half (48%) of the female population. Figure 11. Proportion of population (15 years +) with employment income by work activity and by sex, City of Burlington, 2006
The higher proportions of newcomers working part year or part time point to the growing number of workers in unstable part-time or contract work without access to benefits and rights such as Employment Insurance (EI), workers’ compensation, health insurance and paid holidays.

Changing Faces – Profile of Burlington Newcomers 23
13. Income
The labour market and work activity (full time versus part time work) contribute significantly to the state of financial well-being of newcomers. There is a significant gap in median total income2 between newcomers and the total population. As shown in Figure 12, the 2005 median total income for newcomers is about half of the total population. In other words, a newcomer makes about 50 cents for every dollar made by his/her counterpart. The income gender gap in the total population also exists among newcomers. The median income of female newcomers represents about 59% of the male newcomers and 32% of the male income in the general population. Figure 12. Median total income by sex, City of Burlington, 2005
2 Although average income is often used to provide an aggregate income value for a population, it is sensitive to extreme high and low income
values. In order to minimize distortion from extremely high or low incomes, median income is used instead. Median income is the dollar amount which divides the population into two halves; the incomes of the first half are below the median, while those of the second half are above the median.
Changing Faces – Profile of Burlington Newcomers 24
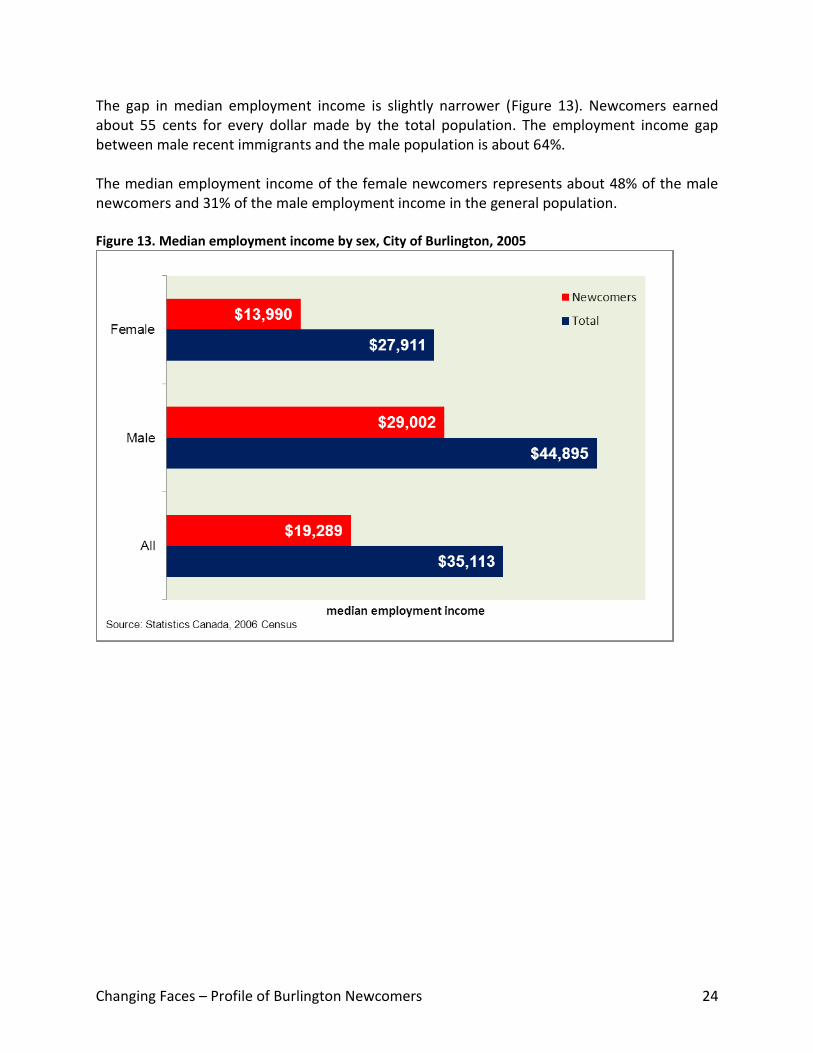
The gap in median employment income is slightly narrower (Figure 13). Newcomers earned about 55 cents for every dollar made by the total population. The employment income gap between male recent immigrants and the male population is about 64%. The median employment income of the female newcomers represents about 48% of the male newcomers and 31% of the male employment income in the general population. Figure 13. Median employment income by sex, City of Burlington, 2005
Changing Faces – Profile of Burlington Newcomers 25
14. Low Income
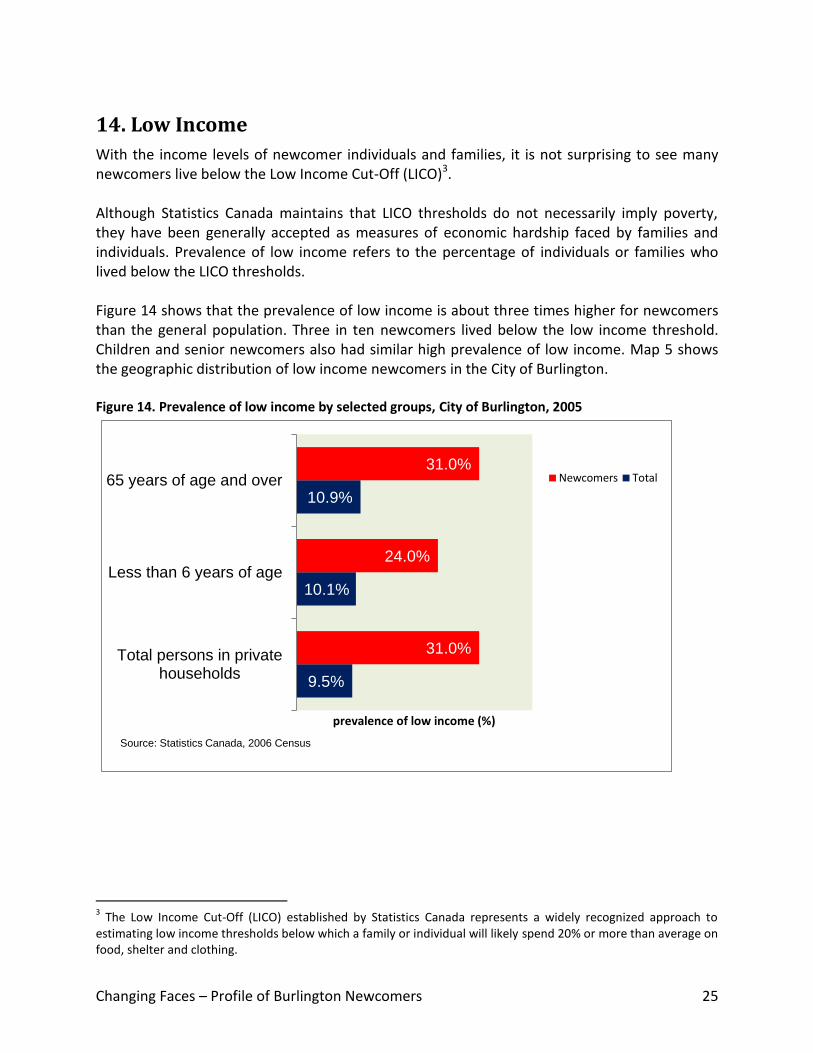
With the income levels of newcomer individuals and families, it is not surprising to see many newcomers live below the Low Income Cut-Off (LICO)3. Although Statistics Canada maintains that LICO thresholds do not necessarily imply poverty, they have been generally accepted as measures of economic hardship faced by families and individuals. Prevalence of low income refers to the percentage of individuals or families who lived below the LICO thresholds. Figure 14 shows that the prevalence of low income is about three times higher for newcomers than the general population. Three in ten newcomers lived below the low income threshold. Children and senior newcomers also had similar high prevalence of low income. Map 5 shows the geographic distribution of low income newcomers in the City of Burlington. Figure 14. Prevalence of low income by selected groups, City of Burlington, 2005
9.5%
10.1%
10.9%
31.0%
24.0%
31.0%
Total persons in privatehouseholds
Less than 6 years of age
65 years of age and over
prevalence of low income (%)
Newcomers Total
Source: Statistics Canada, 2006 Census
3 The Low Income Cut-Off (LICO) established by Statistics Canada represents a widely recognized approach to
estimating low income thresholds below which a family or individual will likely spend 20% or more than average on food, shelter and clothing.

Changing Faces – Profile of Burlington Newcomers 26
Map 5. Low income newcomers by Census Tract, City of Burlington, 2005
Source: Statistics Canada, 2006 Census © 2010 Community Development Halton, all rights reserved
Hwy 407
Dundas St
Upper Middle Rd
QEW
New St
Fairview St
Lakeshore Rd
Plains Rd
Hwy 403
Bra
nt
St
Gu
elp
h L
n
Walk
ers
Ln
App
leby L
n
Burl
oa
k D
r
# low income newcomers
by CT
10 - 40
41 - 95
96 - 195
zero or no data
Changing Faces – Profile of Burlington Newcomers 27
15. Summary
The Profile of Burlington Newcomers presents a portrait of newcomers in the City of Burlington. It highlights some of their major socio-economic characteristics and compares them with those of the general population. Although newcomers represent about 4.1% of Burlington’s population, they are different in many ways from those who settled in Canada earlier as well as the general population. Most of the newcomers came from non-European countries. Over half came from countries in Asia and South America. Among the non-European countries, India was the most frequent origin followed closely by the United States of America, the People’s Republic of China and Columbia. Over 60% of the newcomers belong to one of the visible minority groups. The dominant visible minority group is South Asians followed by Latin Americans and Chinese. Spanish is also the most spoken non-official mother tongue and home language. Nearly half of the newcomers speak English at home, less than half speak a non-official language and about 4% speak both English and a non-official language. The newcomers are younger. Over two-thirds of them are below the age of 40 compared to about half of the total population. Over 80% of the newcomers (25-64 years) have obtained postsecondary education. About 90% of the postsecondary education was obtained outside Canada. Over 40% of the male newcomers have chosen architecture, engineering and related technologies as their major field of study. Business, management and public administration was the popular field of study for the female recent immigrants. There were high proportions of newcomers working in the sales and service occupation, the natural and applied sciences occupation and the processing and manufacturing occupation. However, they were underrepresented in business/finance, management, social sciences and education occupations. Newcomers had higher unemployment rates than the general population. Female newcomers over age 25 were twice as likely to be unemployed. There were high proportions of recent immigrants working part year or part time.

Changing Faces – Profile of Burlington Newcomers 28
Economically, they were not as prosperous as their counterparts. Their median employment income was significantly less than that of the total population. On average, they made about 45% less. Female newcomers earned less than half of what their peers earned. The prevalence of low income among newcomers and their children was three times higher than the total population. Based on the latest projections4 prepared by Statistics Canada, by 2017, immigrants will account for 22.2% of Canada’s population and roughly one Canadian in five (between 19% and 23%) will be a visible minority person. Almost 95% of visible minority persons will live in Canada’s major urban areas (census metropolitan areas). It is with considerable certainty that the current trends of socio-economic characteristics of newcomers in Burlington will continue. As such, government organizations and nonprofit social agencies will need to be continuously informed and understand the changing socio-economic circumstances of the newcomers. Embracing cultural diversity is a two-way street. There are expectations that newcomers will make a smooth transition into the Canadian society. On the other hand, governments, businesses and social service organizations have a shared responsibility to provide the resources and supports for them to take the journey.
4 Statistics Canada, Population projections of visible minority groups, Canada, provinces and regions, 2001-2017,
Catalogue no. 91-541-XIE, March 2005


