

Chapter 9 Solutions Solution 9.1
Distinguish between operating and capital budgets.
Operating budgets are the various budgets that relate to the operating performance of the
business and are summarised in the projected profit statement for the period. The
operating budgets comprise of a sales budget, cost of sales budget, payroll, operating
expenses budgets, and fixed expenses budgets.
Capital budgets relate to the balance sheet and are composed primarily of the capital
expenditure budget, and include the stock budget, debtors and creditors budgets.
The master budget brings together all the financial projections from the various operating
and capital budgets within an organisation for the period. It embraces the impact of both
operating decisions (running the business) and investment and financing decisions (capital
budgets) that the business has planned for the next time period (usually 12 months). This
is illustrated in the following diagram.
The master budget

What are the main advantages of preparing monthly cash budgets?
The cash budget is primarily concerned with the timings of future cash inflows and
outflows and is based on data from the operating and capital budgets. The main
advantages associated with preparing monthly cash budgets is that management can
foresee significant cash surpluses and cash deficits and thus can plan for such events.
For example if a cash budget discloses a budget period where a cash shortfall is likely then
management can plan for this situation and ensure the necessary funds are available for
the business to get through this period. If the cash budget highlights possible cash
excesses then management can plan to invest these cash surpluses to ensure this asset is
working for the business and not lying idle.
Outline the main objectives of budgetary planning
• To forces management to set and prioritise goals which act as a blueprint for the
future.
• To compels management to plan and focus on the future, thus gaining an
advantage by anticipating future business conditions and otherwise unforeseen
problems.
• To provide management with a basis on which to measure subsequent
performance.
• To encourage and promote upward, downward and horizontal communication
within the organisation. Thus the budgetary process plays a strong role in the co-
ordination of activities and goal congruence. The budget acts as a vehicle through
which the activities of the different parts of the organisation can be integrated into
an overall plan.
• To provide a basis for responsibility accounting. Responsibility accounting occurs
where managers are identified with their budget centre and are responsible for
achieving the budget targets for that centre. Ultimately, responsibility accounting
makes managers responsible for the costs, revenues and resources that they
actually control. In the context of budgets, responsibility accounting represents the
delegation of responsibility to individuals within an organisation.
• To facilitate control within an organisation by the regular, systematic monitoring
and reporting of activities and comparing with the budget.
• To facilitate better cash and working capital management through the preparation of the master budgets.
Solution 9.2
Outline the main factors that influence sales.
The sales figure of any business is made up of three variables namely sales volume, sales
price and sales mix. These variables are influenced by a number of factors that should be
taken into account when forecasting sales.
Factors influencing sales
Past sales volume and mix Level of competition
Quality of the product or service Consumer behaviour
Strength of the brand name State of the economy
Planned advertising expenditure Political and industrial outlook
Pricing policy Local activities and events
Capacity Seasonality
Advance bookings Demand analysis
In practice, sales forecasts can be developed in a number of ways such as:
• To aggregate projections made by the sales force on the basis of their assumptions
of the market and changes in market conditions. On one hand this can be quite a
subjective approach, however a good sales team should know its market well and
should anticipate any significant changes that could affect sales.
• Using market research techniques would be particularly appropriate when
considering the launch of a new product.
• Large businesses sometimes develop economic models to predict sales. These models would incorporate a number of the variables identified above and take into account the relationship between them and their effect on sales.
Why is the sales forecast of critical importance to the preparation of
projected financial statements?
When preparing projected financial statements, the forecast of sales is the initial task or
starting point. A reliable sales forecast is essential as many items such as cost of goods
sold, other variable costs, stock levels, fixed assets and capital requirements will be
significantly influenced and determined by the level of sales forecast.

Outline the main ways in which a business can forecast its operating
costs.
To accurately estimate future costs, it is important to understand cost behaviour patterns
and how some costs are affected by fluctuating sales activity levels. Costs may be
classified into the following categories:
o Fixed costs. These are costs which are not expected to vary with sales. For example if
sales increase by 10 per cent, fixed costs would remain fixed and not increase in
proportion to sales. Examples are rent, rates, depreciation, salaries and insurance. From
a forecasting perspective, the level of sales activity forecast will not significantly
influence these costs unless the sales forecast is beyond the relevant range of sales
activity for these costs. Thus the main factors that influence fixed costs are inflation,
legal agreements, economic outlook and national wage agreements, as labour costs are
a major element of the fixed costs of any business.
o Variable costs . These are costs that are expected to vary with sales. Thus if sales
increase by 10 per cent, these costs are expected to increase proportionately. Examples
would include cost of sales, sales commissions and part-time labour. In reality, although
these costs should increase as sales increase, it may not be strictly proportionate
because factors such supplier’s prices, commissions and part-time labour rates may
vary.
o Semi-variable costs. These have both a fixed and a variable element and so may vary
partially with sales. Such costs may be identified by examining the past records of the
business. For example light and heat costs could be classified as a semi-variable cost as
a certain amount of light and heat will be incurred irrespective of the level of sales.
However if sales increase significantly, then more rooms will be used requiring extra
power. Semi-variable costs can be broken down into their separate fixed and variable
components (through the use of the high-low method, scatter-graph approach and
statistical techniques such as regression analysis covered in chapter 2). By doing this,
one can establish the total variable and total fixed costs of a business.
The analysis of costs into fixed and variable components is vitally important when
forecasting future costs. Variable costs will increase in relation to sales whereas fixed costs
may only increase with the rate of inflation (unless there is evidence to the contrary such
as a new leasing agreement or new wage agreements).

Solution 9.3
Incremental budgeting
This is where the current budget and actual figures act as the starting point or base for the
new budget. The base is adjusted for forecast changes to, for example, the product mix,
sales volume, sales price, expenses and capital expenditure that are expected to occur
over the next budget period. It is called incremental budgeting as the approach does not
focus on the base, but focuses on the increment (the changes from the base). An example
would include increasing last years operating expenses by the rate of inflation to calculate
the new budgeted figure. The major disadvantage of this is that the major part of the
expense (the base) does not change and in fact is overlooked and not questioned under
this approach. For example the base figure may be distorted due to extraordinary events
in the previous period which are not expected to reoccur. Thus if this is not taken into
account, the budget could be misleading.
Zero-based budgeting
This approach requires that every year, all costs and capital expenditure are questioned
and thus require justification and prioritising before any decision is taken regarding the
allocation of resources. Thus a zero base is adopted which effectively means that both the
base and the increment are questioned. In fact the whole activity that leads to the item of
expenditure is questioned and requires justification. Zero-based budgeting changes the
approach of traditional or incremental budgeting from focusing on changes in expense
items from year to year, to an approach that looks at each department budget as if it were
undertaking its activities or programmes for the first time. It requires a detailed
justification and cost-benefit approach to each expense item in the department budget. It
forces managers to prioritise activities and related expenses based on a value for money
concept. In effect, it overcomes the limitations of incremental budgeting.
Its advantages include the following
• It fosters a questioning attitude to all revenues and costs in preparing operating
budgets.
• It focuses attention on the value for money concept.
• It can help identify inefficient work processes and operations.
• It helps minimise waste.
• It should result in more efficientallocation of resources.

Its main disadvantages are that as an approach it is costly and time consuming and may
require management to develop and learn new skills.
Many businesses do not apply a full-scale zero-based approach to their budgeting process
but only apply it to selected revenue and expense items or departments within an
organisation. These expense items would often include advertising, research and the costs
associated with developing new products and product lines.
Activity based budgeting
Activity based budgeting (ABB) involves the build up of budgeted costs using an activity
approach. All the activities that are undertaken in the organisation, function or department
are defined, and costs attributed to that activity are established. Resources are allocated
according to activity levels. ABB can be used in all types of organisations. For example,
ABB in the front office of a hotel would involve ascertaining such activities as answering
customer queries, processing a reservation, preparing a quotation and updating customer
accounts. The costs of each activity would then be established and resources would be
allocated based on the planned level of activity.
ABB is an extension of the zero-based budgeting approach and goes into far greater detail
in identifying value and non-value activities. It can be more effective than zero-based and
incremental budgeting because:
• It avoids slack that is often included in the incremental approach.
• ABB focuses attention on each activity, highlighting those that do not add value.
Rolling budgets
A rolling budget is a twelve month budget which is prepared several times each year (say
once each quarter). The purpose of a rolling budget is to give management the chance to
revise its plans, but more importantly, to make more accurate forecasts and plans for the
next few months. When rolling budgets are used, the extra administration costs and effort
of producing several budgets instead of just one, should be balanced with more accurate
forecasting and planning.
The advantages associated with the use of rolling budgets are
• Budgets are reassessed regularly and thus should be more realistic and accurate.
• Because rolling budgets are revised regularly, uncertainty is reduced.

• Planning and control is based on a recent updated plan.
• The budget is continuous and will always extend a number of months ahead.
The disadvantages are
• Rolling budgets are time consuming and expensive as a number of budgets must
be produced during the year.
• The volume of work required with each reassessment of the budget can be off-
putting for managers.
• Each revised budget may require revision of standards or stock valuations which is
time consuming.

Solution 9.4
a) Cash Budget
b) Trading, Profit & Loss Account for four months ending 30th April
c) Balance sheet as at 30th April

Solution 9.5
a) Profit & Loss Account
b) Cash Budget
c) Balance Sheet

Solution 9.6
a) Prepare a projected profit and loss account for the 5 month period ending
30 November
The approach to preparing the projected profit and loss account in this question is to firstly
start with the trading account and follow the following steps.
1. Outline the trading account and put in the figures given in the questions – sales and
opening stock.
2. Calculate gross profit and cost of sales. This is done by using the gross profit
percentage given in the question. The question expresses gross profit as a mark-up or
as a percentage of cost of sales. Thus cost of sales = 100%, gross profit = 150% and
sales = 250%.
3. Calculate closing stock. Stock is to equal 50% of the following months demand. But
this figure values stock at selling price. Stock must be valued at cost and so it is
marked down to cost by multiplying by 100/250. Thus closing stock at the end of
November = 50% x Decembers sales x 100/250.
4. The purchases figure is the balancing figure.
5. In calculating the figures for the profit and loss account it is important to ensure that
only expenses charged are included irrespective of whether they are paid or not.
P
rojected Profit and Loss Account
Sales 27,000
Less Cost of sales
Opening Stock 2,000
Purchases 10,000
Closing Stock (6000 * 50% * 100/250) 1,200 10,800
ross profit
G 16,200
verheads (5 x 1200 O ) 6,000
leasing and Insurance (5000 x 5/12) 2,083
Advertising (1600 x
5/6 ) 1,333
es and Salaries ( Wag 1,500 x 5) 7,500 16,916

t Loss
Ne (716)
b) Prepare a monthly projected cash budget for the 5 month period
ending 30 November.
Projected Cash Budget
July August September October November
Income
Sales 5000 5000 5000 6000 6000
sh Ca 4500 4500 4500 5400 5400
Credit 500 500 500 600
Vat refund 3,210
tal income 500
To 4 5000 8210 5900 6000
penditure
Ex
Purchases (Working 1) 1000 2000 2200 2400
Overheads 1,000 1,000 1,000 1,000 1,000
Leasing and Insurance 1,250 1,250
Advertising 1,600
alaries
Wages and S 1,200 1,200 1,200 1,200 1,200
Paye/prsi 300 300 300 300
Vat 1,210
tal expenditure 050 To 5 3500 4500 5950 6110
sh Surplus/Deficit 1500 3710 -50 -110
Ca -550
Opening Balance 0 -550 950 4660 4610
osing Balance Cl -550 950 4660 4610 4500
Working 1 – Calculation of purchases

The figure for purchases must be calculated for each month as this is required for the
monthly cash budget. This requires preparing a trading account and going thought steps 1
– 4 outlined in part (a) above. The purchases figure for any month is paid the following
month. Thus the purchases figure for July of €1,000 is paid and is recorded in the cash
budget in August.
July August September October November
Sales 5000 5000 5000 6000 6000
Less Cost of sales
Opening stock 2000 1000 1000 1200 1200
Purchases 1000 2000 2200 2400 2400
Closing stock 1000 1000 1200 1200 1200
COGS 2000 2000 2000 2400 2400

Solution 9.7 a) Prepare a budgeted trading, profit and loss account for the three
months ended 31 March The approach to preparing the projected profit and loss account in this question is to firstly
start with the trading account and follow the following steps.
1. Outline the trading account and put in the figures given in the questions – sales and
opening stock.
2. Calculate gross profit and cost of sales. This is done by using the gross profit
percentage given in the question. The question expresses gross profit as a percentage
of sales. Thus sales = 100%, gross profit = 65% and cost of sales = 35%.
3. Calculate closing stock. Managements policy is to have sufficient stock to cover
demand for the following month. This Stock is to equal 100% of the following months
demand. But this figure values stock at selling price. Stock must be valued at cost and
so it is marked down to cost by multiplying by 35% (35/100). Thus closing stock at the
end of March = 100% April sales x 35%.
4. The purchases figure is the balancing figure.
5. Although the question does not ask for a monthly trading account in part (a) - a
monthly cash budget is required in part (b). Thus one needs to calculate the monthly
purchases figure to show when theses purchases are paid in the cash budget. This can
be done separately as in question 9.6 or when preparing the trading account as below.
Budgeted Trading, Profit and Loss Account January February March Total € € € € Sales 60000 66000 72600 198600
Less cost of goods sold O/stock 9000 23100 25410 9000
Purchases 35100 25410 27951 88461
44100 48510 53361 97461
C/stock 23100 25410 27951 27951
Cogs 21000 23100 25410 69510
Gross Profit 39000 42900 47190 129090
Less Expenses Labour costs 49,650 Overheads 39,720 Rent 6000 Loan interest 488 95,858
Net Profit 33,233

b) Prepare a monthly cash budget for January, February and March
Cash Budget
January February March Total
€ € € €
Income
Cash sales 30000 33000 36300 99300
Cash received from credit sales 24000 30000 33000 87000
Total 54000 63000 69300 186300
Expenditure
Purchases 15000 35100 25410 75510
Rent 12000 12000
Labour 15000 16500 18150 49650
Overheads 10,000 11200 12520 33720
Taxation 25000 25000
Capital expenditure 30000 30000
Capital repayments 900 900
Interest on loan 488 488
Total expenses 52000 87800 87468 227268
Surplus 2000 -24800 -18168 -40968
Opening balance 2500 4500 -20300 2500
Closing balance 4500 -20300 -38468 -38468
Note
• The cash received from credit sales for January relates to Decembers credit sales.
This is given in the opening balance sheet as debtors.
• The purchases figure in January is December’s purchases which is given in the
opening balance sheet as trade creditors.
• Depreciation is a non cash item and thus is excluded from the overheads figures

c) Prepare a balance sheet as at 31 March
Balance Sheet as at 31March € € Fixed Assets 124,000
Current Assets Stock 27951 Debtors 36300 Prepayments 6000 70251
Current Liabilities Creditors 27951 Bank overdraft 38468 66419
Long-term liabilities Loans 18,600
_______
Total Net Assets 109,233
Financed By Share capital 57000
Reserves 52,233
_______ 109,233
Note
• The fixed asset figure is calculated as follows
Fixed assets @ Jan 1
Additions
Less depreciation
Fixed assets @ 31 March
€
100,000
30,000
(6,000)
124,000
• Debtors = March credit sales
• Creditors = March purchases

Solution 9.8 a) Prepare a budgeted trading, profit and loss account for the three
months ended 30 November
This company hires out equipment and does not par-take in the buying and selling of
goods and services. Thus there is no requirement for a trading account and the profit and
loss account is simply sales less expenses as follows. Note the direct costs amount to 10%
of sales.
Budgeted Profit and Loss Account September October November Total € € € € Sales 66000 72600 79860 218,460 Less Expenses Direct costs 21,846 Labour costs 54,615 Overheads 43,030 Rent 6,000 Loan Interest 825 126,316
Net Profit 92,144
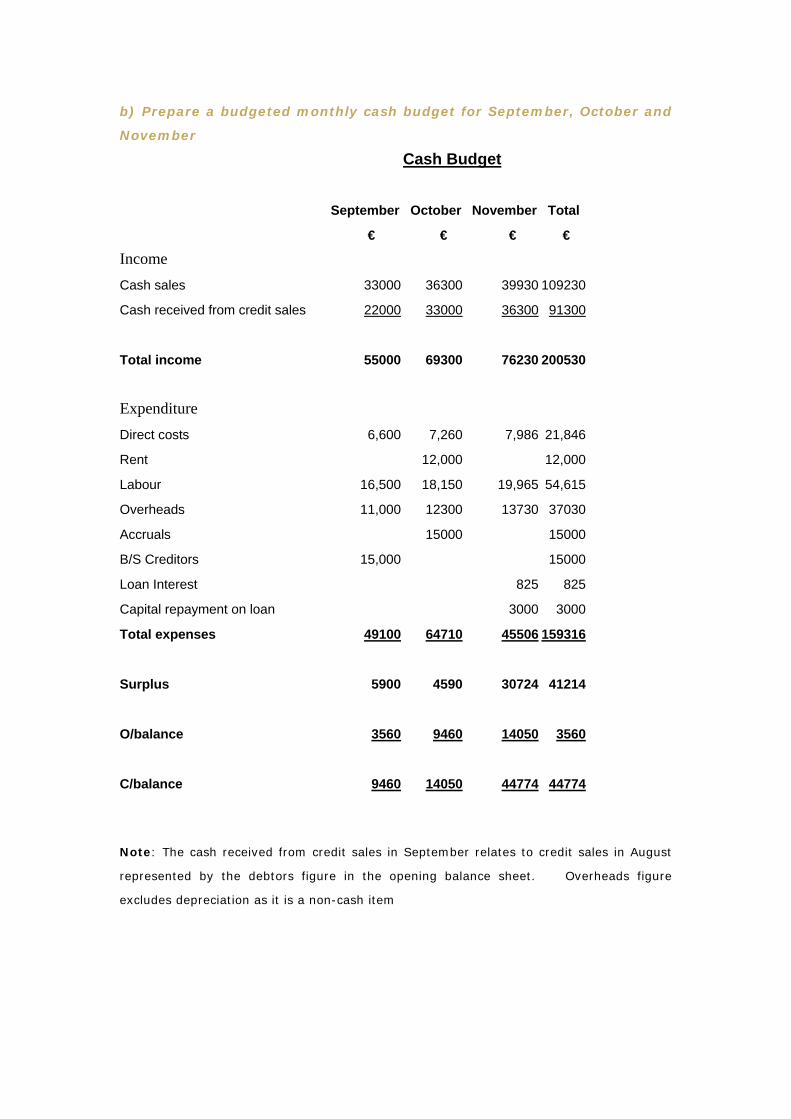
b) Prepare a budgeted monthly cash budget for September, October and
November
Cash Budget September October November Total € € € € Income Cash sales 33000 36300 39930 109230 Cash received from credit sales 22000 33000 36300 91300
Total income 55000 69300 76230 200530 Expenditure Direct costs 6,600 7,260 7,986 21,846 Rent 12,000 12,000 Labour 16,500 18,150 19,965 54,615 Overheads 11,000 12300 13730 37030 Accruals 15000 15000 B/S Creditors 15,000 15000 Loan Interest 825 825 Capital repayment on loan 3000 3000 Total expenses 49100 64710 45506 159316
Surplus 5900 4590 30724 41214 O/balance 3560 9460 14050 3560
C/balance 9460 14050 44774 44774
Note: The cash received from credit sales in September relates to credit sales in August
represented by the debtors figure in the opening balance sheet. Overheads figure
excludes depreciation as it is a non-cash item

c) Prepare a forecast balance sheet as at 30 November
Balance Sheet as at 30th November
€ € € Cost Accum Dep NBV Fixed Assets 298,000 6,000 292,000 Current Assets Debtors 39930 Bank 44774 prepayment 8,000 92,704 Current Liabilities Creditors for capital
expenditure 30,000 Long-term Liabilities Loan 30,000
324,704
Financed By Share Capital 205,000 Profit and loss (92,144 +
27,560) 119,704
324,704
Note:
• The fixed assets at cost figure is €268,000 + €30,000
• The prepayment relates to rent prepaid for 4 months x €2000 per month
• Creditors for capital expenditure relates to the new fixed assets purchased. This is
a current liability as it will be paid in December.
• The long term loan has been reduced by a repayment of €3,000
• The profit and loss balance in the balance sheet is made up of the profit and loss
balance in the opening balance sheet of €27560 + the projected profit of
€268,000.

Solution 9.9 a) Prepare a budgeted departmental trading, profit and loss account for
the three months ended 31August This question asks for a departmental trading, profit and loss account. That requires a separate trading account for the bar and restaurant. Unlike other questions you are given the purchases figures however you are not given any information on how to calculate closing stock. Thus closing stock is the balancing figure for each trading account. There is no need to prepare a monthly trading account as the monthly purchases figures are already given. The following are the steps in preparing the trading account 1. Outline the trading account and put in the figures given in the questions – sales,
purchases and opening stock. 2. Calculate gross profit and cost of sales. This is done by using the gross profit
percentage given in the question. The question expresses gross profit as a percentage of sales thus sales = 100%. For the bar, gross profit = 55% and hence cost of sales = 45%. For the restaurant, gross profit = 60% and thus cost of sales = 40%.
3. The balancing figure in the trading account is the closing stock for both the bar and restaurant.
Note: There is rental income in this question. The rental income earned for the period (3 months) should be added to gross profit. However the question does not tell us the monthly rental. This can be calculated by ascertaining how many months does the rent prepaid in the opening balance sheet represent. If the tenant pays every three months and his last payment before the opening balance sheet date was 1 may. Then the amount of the prepayment represents 2 months. Thus the monthly charge is €1,000 / 2 = €500
Departmental Trading, Profit and Loss Account
Bar Rest Total
€ € €
Sales 30,000 90,000 120,000
Less Cost of sales
O/stock 800 500 1300
Purchases 13,400 44,000 57400
14,200 44,500 58700
C/stock Balancing figure 700 8,500 9200
COGS 13,500 36,000 49500
Gross profit 16500 54000 70500
Add rental income 1500
72000
Less Expenses
Wages 34,500
Other Expenses (excluding insurance 20,500-3,000) 17,500
Insurance (less prepayment of 9 months 3000-2250) 750
Depreciation 2550
Loan interest 1350 56,650
Net Profit 15,350

b) Prepare a monthly forecast cash budget for June, July and August
Cash Budget
June July August Total
€ € € €
Income
Cash Sales 29520 36000 42480 108000
Cash received from credit sales 1000 3280 4000 8280
Rental Income received _____ ______ 1500 1500
Total income 30520 39280 47980 117780
Less Expenditure
Purchases 2230 17,000 18,400 37,630
Cash Wages 7000 8400 8750 24,150
PAYE/PRSI 3000 3600 6,600
Expenses 3000 7000 7500 17,500
Insurance 3000 3,000
Loan repayment 1200 1200 1200 3,600
Loan Interest 450 450 450 1350
Preliminary tax 10000 10000
Total expenditure 16880 37050 49900103,830
13640 2230 -1920 13950
Opening cash balance 2360 16000 18230 2360
Closing cash balance 16000 18230 16310 16310

c) Prepare a budgeted balance sheet as at 31 August
Balance Sheet
Fixed Assets Cost Depreciation N.B.V.
Leaseholds 200000 1800 198200
Equipment and Furniture 50000 750 49250
250,000 2,550 247450
Current Assets
Stock 9200
Debtors 4720
Bank 16310
Insurance prepaid (9 months prepaid) 2250 32480
Creditors <12 months
Trade Creditors 22000
Wages due 3750
Rent prepaid 1,000 26,750
Creditors >12 months
Loan capital 39,830
213,350
Financed By
Capital 150000
Reserves 48000
Retained profit 15350
213350
Note:
• There were no new fixed assets purchased so the NBV of fixed assets is simply cost
less depreciation.
• Debtors represent credit sales in August
• Trade creditors represents August credit purchases
• The rent prepaid is a prepayment on a revenue item and thus is a current liability.
In effect the tenant has paid in advance and thus the business owes the tenant the
amount of the prepayment. The prepayment represents 2 months rent namely
September and October.

Solution 9.10
a) A forecast trading, profit and loss account for the period 1 June to 30
September inclusive
The approach in this question is again to layout the information given in the question
sales, stock (opening and closing) and using the gross profit percentages given of 30%
one can calculate the gross profit and cost of sales figures. In this question opening and
closing stock will be the same (€500) thus cost of sales and purchases will also be the
same.
Forecast Trading, Profit and Loss Account
JUNE JULY AUGUSTT SEPT TOTAL
€ € € € €
SALES 10,000 10,000 10,000 9,000
39,000
LESS COST OF GDS SOLD
O/STOCK 500 500 500 500 500
PURCHASES 7,000 7,000 7,000 6,300 27,300
C/STOCK 500 500
500 500 500
7,000 7,000
7,000 6,300 27,300
GROSS PROFIT 3,000 3,000 3,000 2,700
11,700
LESS EXPENSES
INSURANCE (1900*4/12) 633
RATES (450*4/12 ) 150
OTHER EXPENSES 3,800
MORT INTEREST (100,000*12%*2/12) Note 1 2,000
(100,000-2778*12%*2/12)
1,944 8,527
NET PROFIT 22,673
Note 1: The mortgage interest is based on the amount outstanding on the loan. At 1 June
the amount of the loan was €100,000 however this amount was reduced at the beginning

of August by €2,778. Thus loan interest is charged for two months based on the amount
outstanding of €100,000 and for another 2 months based on the amount outstanding of
€97,222.
b) A forecast monthly cash budget for the above period
Forecast Cash Budget
JUNE JULY AUGUSTT SEPT
INCOME € € € €
CASH SALES 9,000 9,000 9,000 8,100
CREDIT SALES ______ 1,000 1,000 1,000
Total income 9,000 10,000 10,000 9,100
EXPENDITURE
PURCHASES 7,000 7,000 7,000
INSURANCE 1,900
OTHER EXPENSES 950 950 950
DRAWINGS 800 800 800 800
MORTGAGE CAPITAL 2,778
MORTGAGE INTEREST Note 1 3,000
RATES 225
______ ______ ______ ______
Total expenses 2,700 8,750 14,753 8,750
CASH SURPLUS/ DEFICIT 6,300 1,250
(4,753) 350
OPENING BALANCE 10,000 16,300
17,550
12,797
CLOSING BALANCE 16,300 17,550
12,797
13,147
Note 1: Loan interest is paid on a quarterly basis with the next payment date 1 August.
Thus the loan interest to be paid will be €100,000 x 3/12 x 12% = €3,000
c) Relevant extracts from the balance sheet as at 30 September
Current Assets
Stock
Debtors
Prepayments
Insurance
€
500
900
1,267

Rates
Bank
150
13,147
Current Liabilities
Trade creditors
Accruals
Other expenses
Loan Interest Note 1
6,300
950
1,944
Long- term Liabilities
Mortgage Loan
97,222
Financed By
Net profit
Less drawings
22,673
(3,200)
Note 1: Loan interest due at the end of September relates to the interest that has been
charged to the profit and loss account but not paid by the end of September. The only
interest payment made was at the beginning of August relating to the May June and July.
Thus The interest charged for August and September is outstanding and a current liability.
This amounts to €97,222 x 12% x 2/12 = €1944

Solution 9.11 a) A forecast profit and loss account for the three months to the end of
March
Budgeted Profit & Loss Account for 3 months ending 31 March
Sales 190,000
Cost of sales
Opening stock 0
Purchases (Note 1) 153,000
Less: Closing stock -96,000
_57,000
Gross profit (Note 2) 133,000
Expenses
Wages and salaries 41,000
Rent of premises (Note 3) 37,500
General expenses 20,000
Depreciation of equip (Note 4) 12,000 110,500
Operating profit 22,500
Loan interest (Note 5) _2,700
Net profit before tax 19,800
Note 1 : Purchases is calculated as follows
• Cost of sales + closing stock – opening stock
• €57,000 + €96,000 – 0) = €153,000
Note 2: Gross profit is calculated as 70% of sales
Note 3: The annual rent is €150,000 for which only 3/12 should be charged.
Note 4 : Depreciation is 12.5% of €384,000 x 3/12.
Note 5: Loan Interest is charged at 6% of €180,000 x 3/12

b) A monthly forecast cash budget for January February and March
Cash budge for 3 months January to March
Jan Feb Mar
Receipts € € €
Share capital 250,000
Bank loan 180,000
Cash sales (30% of current month) 15,000 18,000 24,000
Debtors (70% of sales 2 months previous) _____0 ____0 35,000
445,000 18,000 59,000
Payments
Purchases (Note 1) 0 85,000 28,000
Wages and salaries (current month) 12,000 13,500 15,500
Rent of premises (150,000 x 6/12) 75,000
Gen expense (prev month) 6,000 6,500
Loan principal 1,500 1,500 1,500
Loan interest 900 900 900
Equip and furniture. 192,000 _____0 192,000
281,400 106,900 244,400
Net Cash Inflow/(Outflow) 163,600 -88,900 -185,400
Opening balance 0 163,600 74,700
Closing balance 163,600 74,700 -110,700
Note 1 Calculation of purchases
Workings - Purchase Jan Feb Mar Jan-Mar
€ € € €
Sales 50,000 60,000 80,000 190,000
Mult by Cost of sales %) 0.30 0.30 0.30 0.30
Gives: Cost of sales 15,000 18,000 24,000 57,000
Add: Closing stock (given) 70,000 80,000 96,000 96,000
Less: Opening stock _____0 -70,000 -80,000 _____0
Gives: Purchases 85,000 28,000 40,000 153,000

c) A forecast balance sheet at end of March
Budgeted Balance Sheet on 31 March
€ €
Fixed Assets at Book Value (384,000 - depreciation 12,000) 372,000
Current Assets
Stock on hand 96,000
Debtors (Note 1) 98,000
Prepaid rent (Note 2) 37,500
231,500
Current Liabilities
Bank overdraft 110,700
Trade creditors (Note 3) 40,000
Accrued general exp (Note 4) 7,500
158,200
Net Current Assets 73,300
Total assets less current liabilities 445,300
Less: Bank Loan at 6% (Note 5) 175,500
Net Assets 269,800
Share Capital and Reserves
Ordinary share capital 250,000
Profit and loss account _19,800
269,800
Note 1: Debtors is calculated as 70% of both February (€60,000) and March’s sales
(€80,000).
Note 2: Rent was paid for 6 months. By the end of March only 3 months have elapsed
thus rent is prepaid by 3 months = €150,000 x 3/12.
Note 3: Trade creditor represents March’s purchases.
Note 4 : Accrued expenses represent unpaid general expenses for March.
Note 5 : €1500 a month was paid off the loan


