

153
CHAPTER IV
Profile of Marathwada region, Opportunities and
challenges before Foreign Direct Investment
Introduction:
The chapter fourth highlights on the profile of Marathwada
region with basic opportunities and challenges with basic
infrastructure facilities with all details of demographic and
geographic information of the region. The chapter gives the district
wise socio-economic development of Marathwada region like
classification of main and marginal worker, progress of small saving
programme, life insurance business, employment in different sector,
the chapter also highlights the investment and employment in
approved SEZ in Maharashtra state, status of co-operative industrial
estates, MIDC at a glance, the chapter also gives the details of the
financial service in Marathwada region like the banking service and
also the mutual fund industry at glance in Marathwada region.
Marathwada is a region of Maharashtra state, which
corresponds to Maharashtra's Aurangabad Division. The term
Marathwada is derived from the word Bara-hatti-vada (Bar-hat-
vada) meaning country of Dhangars. Marathwada was a part of the
former Hyderabad state of India until November 1, 1956, when it
was transferred to Bombay state, which in 1960 was divided into
Maharashtra and Gujarat. India became Independent on 15th
August, 1947 but Marathwada joined independent India on 17th
September 1948.On this day, the Indian Army liberated the

154
Hyderabad state from Nizam's rule in a military operation referred as
Operation Polo, also popularly known as Police Action.
Marathwada is a home to significant Hindu, Buddhist, Jain,
Sikh and Muslim monuments Like Ajanta, Ellora, Shaktipeeths like
Mahur and Ambajogai and Jyotirligas like Ghrishneshwar (Verul),
Nagnath (aundha) and Vaijanath (Parli);The Samadhi of Guru
Govind Singh the Tenth Guru of Sikh community at Sachkhand
Nanded and is called the land of saints like Dnyaneshwar (Apegaon
Tq Paithan Dist Aurangabad), Nivruttinath ( Apegaon Tq Paithan
Dist Aurangabad), Sopandev (Apegaon Tq Paithan Dist
Aurangabad), Muktabai (Apegaon Tq Paithan Dist Aurangabad),
Eknath (Paithan Dist Aurangabad), Samarth Ramdas (Jamb Samarth
Dist Jalna) , Namdev ( Narsi Dist Beed).
The boundaries of Maharashtra's Aurangabad division
correspond to the Marathwada region. Aurangabad District at a
glance. The capital of Aurangabad Division is the city of
Aurangabad, located in Marathwada's northwest.
4.1 Population at a Glance in Marathwada region.
Table No: - 1.1
Population at a glance in Marathwada Region
Year Total
Population
Decade Variation Percentage Decade
Variations
1901 32,16,376 -- --
1911 38,97,344 +6,80,968 +21.17
1921 35,06,179 -3,91,165 -10.04
1931 41,59,749 +6,53,570 +18.64
1941 46,11,181 +4,51,432 +10.85
1951 51,09,886 +4,98,705 +10.82

155
1961 62,97,373 +11,87,487 +23.24
1971 80,58,347 +17,60,974 +27.96
1981 97,43,782 +16,85,435 +27.29
1991 1,28,00,653 +30,56,871 +31.37
2001 1,55,89,223 +27,88,570 +17.88
Source: - Director of census operation, Maharashtra census of India-1991, series-14,
Maharashtra part XII- A & B, District Census Hand Book
The above table 1.1 shows the population of Marathwada region
since 1901.The population of the Marathwada Region has increased
in last ‘two-three decades. The continuous increase in population,
after 1951, can be ascribed to various factors:
a. The development of the districts as a divisional and sub-
divisional headquarters of the Marathwada Region in different
districts led to establishment of various offices.
b. Establishment of Dr. Babasaheb Ambedkar Marathwada
University, Swami Ramanand Teerth Marathwada University,
Agricultural University, the H.S.C. Aurangabad Division, L. I. C. of
India Aurangabad Divisional Office, State Bank of India Regional
office and almost all other establishments having their sub-centres
either at Nanded, Latur or Osmanabad, other than division place at
Aurangabad, led to significant growth in educational facilities,
student- population and business community.
c. The expansion of heavy and ancillary industrial activities in the
districts resulted in the growth of population of workers.
With the growth of population in different sector, the demand for the
investment management services has also been increased. This has

156
provided a good business opportunity of public sector finance
companies like SBI, LIC and others to meet the required demand of
financial services of traditional investment like life insurance and
fixed deposit
Despite recent industrial developments, the region remains the
most backward region of Maharashtra. Human Development Index
(HDI) using the United Nations Development Programme (UNDP)
methodology for the year 2000 highlights the backwardness of the
districts of Marathwada. None of the Marathwada districts are in the
list of above-the-State’s average attainment. It accounts for 16.84%
of the state's population and is home to nearly 30% of the state's
Below Poverty Line families. Its per capita GDP is Rs 10,373 -- a
good 40 per cent below the state's per capita GDP of Rs 17,029 --
and contributes just 8% of the state's industrial output. Its literacy
rate is the lowest in the state (51.23%, Census 2001). All eight
districts figure in the list of the 100 poorest districts in the country.
Marathwada is perhaps, the most neglected region of Maharashtra
because it lacks natural resources and is prone to drought. Nearly
32% of its 64,818 sq km area comes under the rain shadow region.
Annual average rainfall is 750mm and drought is a permanent
feature. Irrigation water, in real terms reaches not more than 50,000
acres of cultivable land. Getting supply of drinking water twice a
week is a luxury. The picture becomes slightly better owing to a
good monsoon. About 98% of agriculture is dry land farming and
cotton is the major crop. But the inherent susceptibility of cotton
crop to pest and the vagaries of nature make its cultivation a risky
affair, resulting in many a farmer falling prey to debt. Suicide

157
among farmers is on the rise. In recent developments the industrial
growth is much faster like the SKODA cars, AUDI cars are being
manufactured at Aurangabad, the capital of Marathwada, also
Hindalco, Parley, Siemens, Radico, etc big companies have started
their major projects. Videocon and Sterlite are already in production
of TVs, AC Units, Refrigerators, Washing Machines, etc by
Videocon and Fibre optic cables from Sterlite. All these products are
being exported all over the world.
MIDC and the following agencies are making valuable contribution
to this region by playing a vital role in its development of
Marathwada:
1) Maharashtra Industries Development corporation (MIDC)
2) State industries and Investment corporation (SICOM)
3) Maharashtra state financial corporation (MSEFC)
4) Maharashtra small scale industries Development Corporation.
5) Maharashtra state Electricity Board (MSEB)
6) Maharashtra Development corporation (MPC)
7) Maharashtra center for Entrepreneurship Development (MCED)
8) Bank
4.2 Economic and Industrial Background of
Marathwada Region
The Maharashtra State is administratively divided into six divisions
viz. Kokan, Nasik, Pune, Amrawati, Nagpur and Aurangabad. The
Aurangabad Division is known as the Marathwada Region. The
Marathwada Region was formerly a part Of the Hyderabad State.
The Marathwada Region forms the central portion of the
158
Maharashtra State with Aurangabad city being located almost in the
center of the state. In Aurangabad city, there is a confluence of
North and South. The Marathwada is a land of saints, nursery of
culture and seat of empires in a way goes to epitomize the course of
Indian History. The achievements of this region in the fields of art,
culture and spiritual activities are very great. The world renowned
caves of Ajanta and Ellora are still with us speaking about ancient
glory.
The religious concepts among the people of this region are
uncongenial to the entrepreneurship development of the region.
Agriculture is the main occupation of the people of Marathwada.
This region does not have any industrial background as compared to
other developed region. It is an industrially backward region. The
main cause of backwardness is absence of entrepreneurial class and
lack of entrepreneurial abilities.
4.3 Industry and Commerce
The opening of the Hyderabad Godavari Railway in 1900 stimulated
trading activities in the State. The State used to Import yarns, salt,
chemicals, manufactures of iron and steel, petrol, sugar,
automobiles, brass, rubber, etc. The state used to import cotton,
oilseeds, food-grains, shabad stones, the State used to levy Import
and export duties till the year 1920, there was no separate
department of industry Revenue department of Nizam was
considered as department of industry till the year 1948, industrial
Sector was only nominal in the economy of the Hyderabad State.
The main export from the state was only agricultural raw material.

159
4.4 Agriculture:
In the period of the Nizam, agriculture was the main Occupation of
people of Marathwada. The soil and climatic conditions of the
region were favorable for development but the backward traditional
agricultural practices and lack of irrigation facilities resulted in low
productivity. The land failed to produce any surplus, which in turn
prevented any economic activity. There was no industrialisation
because of traditional agricultural practices and lack of moderate
entrepreneurial class. The people from the region, therefore, had
little or no industrial background as compared to other developed
region. At present, agriculture is the main occupation of the people
of Marathwada. But irrigation covers only one tenth of the net sown
area of the Nizam region.
The rainfall is inadequate. Nearly two fifth of the land
remains under the drought prone zones. Agriculture in Marathwada
means chiefly cultivation of crops which are less water intensive like
Bajra and Jowar. Cultivation of cash crops like cotton, sugarcane
and oil seed is restricted.
4.5 Levels of Urbanization
The growth of entrepreneurship naturally is co-related to the level of
urbanization and vis-a-vis. Industrialisation, modernisation and
urbanisation go hand in hand and complimentary to each other. It
will be better if a level of urbanisation in Marathwada is reviewed.
The Marathwada region lags behind in level of urbanization
as compared to Maharashtra and India. According to Census of

160
2001, the percentage of urban population of India is 27.82%,
whereas of Maharashtra this percentage is 42.20% and
comparatively of Marathwada, it is only 22.60%, which is quite low.
Agriculture is the mainstay of the region. As much as three fourth of
the total geographical area is under plough and provides work to
almost four-fifth of labour force. Irrigation hardly covers one-tenth
of the net sown area of the region. Rainfall is also inadequate.
Nearly two-fifth of the land and population remains under the
drought prone zones.
4.6 Education at a Glance
Education accentuates development. Technical education plays a
key role in the industrial development of a region. It also directly
influences social environment and attitude of people. Even today
35% of its population is illiterate According to Census of 2001, the
total literacy rate of the region accounted 68.95% of the population.
4.7 Socio-Economic Aspects of Marathwada Region
Economic progress of the Marathwada Region developed slowly and
steadily over the years. Development culture is a long process,
which cannot be destroyed or created at once. In this context, Oscar
Levis has developed a concept namely “Culture of poverty”.
According to him, it is more difficult to remove poverty itself.
Culture of poverty indicates feeling of inferiority, lack of capacity to
take bold decisions and lack of planning for the future. The culture
of the Marathwada Region was so nurtured that it could not give
weightage to the modern values like equality and freedom, which is

161
the main cause of backwardness of the region. It never provided
congenial atmosphere for modernity and rational thought. Therefore,
it lagged behind as compared to rest of Maharashtra, which
remained relatively more progressive in cultural, Educational,
political, industrial fields.
On almost all the fronts such as, illiteracy, lack of skills,
deficient knowledge, immobility and indifferent attitude,
underdeveloped resources, low standard of living with a dominant
agriculture Sector with little industrialization, Marathwada remained
backward region.
4.8 Industrial Scenario of Marathwada Region
After 1948 State was brought into the fold of an all India economy
and released new economic forces which demanded attention. It
integrated Hyderabad finances with those of the Union Government
which geared the financial resources with a different motive
altogether.
After 1949, the Government discontinued the old practices to
support the industries, i.e. directly contributing to the share capital
of the industrial concerns and decided to advance loans to deserving
companies on suitable securities. Raising finance through Industrial
Trust Fund under the old system was replaced by establishing the
State Finance Corporation.
As regards to cottage and small-scale industries, the
Government decided to rehabilitate the handloom weaving industry
and accepted in principle that common utilisation in cottage

162
industries deserve equal attention as in the case of artistic crafts. As
regards handloom weaving a partial reservation of the market gave
some relief to the handloom weavers.
The household industrial sector continued to be neglected
even in tire new set up according to 1961 Census 86.5% workers in
the household industry were craftsmen and engaged in carpentry,
leather works, tailoring, weaving and related work, blacksmithy,
Pidsmithy, knitting,etc. This sector continued with low skill level
and traditional techniques of production and somehow managed to
survive under adverse conditions.
The industrial backwardness of the region can be explained by the
presence of poor infrastructural facilities. By the end of 1960 the
region had only 0.05 Km road length per one Sq.Km. of area. The
total road length in Marathwada was 50604.29 Kms in 2001. That
comes to about 784.25 Kms. per thousand Sq.Kms.
The banking facilities were scanty and much below the need of the
region. On 1st May 1960, the Maharashtra State was established,
which established the ‘Maharashtra Industrial Development
Corporation’ (MIDC) on 1st August 1962 for the dispersal of
industries and promotion of regulated balanced industrial
development of the State. The Director of Industries was the only
Government organization to promote and regulate industrial activity
in Marathwada region until 1962. In 1962, the Government setup
several autonomous corporations ‘for balanced Industrial
development like MSSIDC, SICOM, MSFC, MDC, MCED and
Banks. The Government of Maharashtra established four regional

163
corporations for industrial and entrepreneurial development in
Kokan, Western Maharashtra, Vidarbha and Marathwada. The
responsibility of these corporations was to promote entrepreneurship
and to exploit local resources. The Marathwada Development
Corporation was established in 1968.
4.8.1 Industrial Development of Marathwada Region in
the Twenty-first Century
Table No: - 1.2
District-wise Industrial Progress of the Marathwada Region
up to 31-3-2004
District Small Scale Industries Small and Medium (IEM) Scale Industries
No
. o
f u
nit
s
per
ma
nen
t
Inv
estm
ent
(in
la
kh
s) R
s.
Em
plo
ym
ent
Ex
isti
ng
No
.
of
Un
its
Pro
po
sed
un
its
To
tal
Un
its
Inv
estm
ent
(in
Cro
rers
)
Rs.
Em
plo
ym
ent
Aurangabad 2352 20884.24 18798 304 395 699 2125.00 37060
Jalna 585 2992.00 24841 19 35 54 164.57 2769
Parbhani 598 6284.00 2826 05 50 55 98.23 1664
Hingoli 159 1384.00 815 04 07 11 114.15 2026
Nanded 1036 2120.25 2371 19 74 93 291.81 4085
Latur 1362 7249.69 8560 17 76 93 388.83 5022
Beed 1143 637.53 12774 14 92 106 52.00 4975
Osmanabad 651 3031.94 2903 24 86 110 378.50 4608
Total 7886 44583.65 73888 406 815 1221 3613.09 62209
Source:-Joint Director of Industries, the Aurangabad region, Aurangabad. Note of Industrial
Development of the Marathwada region 2004 Page: 12-13.
The above table 1.2 shows the District-wise Industrial Progress of
the Marathwada Region, as we can see from the above table expect
Aurangabad and few other district have no of permanent unit above
1,000 with the highest being Aurangabad in the table with 2352

164
number of permanent unit which are providing employment of
18798 in number to the region with least number of unit in Hingoli
district 159.
The corporations and agencies are providing assistance to the
entrepreneurs in terms of infrastructural facilities, financial
assistance, incentives under Package Scheme of Incentives, training
and motivation for setting up of new units, marketing of the products
and distribution of raw materials and power supply to the industrial
units. The various policy initiatives for accelerating industrial
growth are as follows:
1. Industrial Policy of Maharashtra 2001.
2. Bio-technology Policy of Maharashtra 2001.
3. Policy on Special Economic Zones 2001.
4. Grape Processing policy 2001.
5. The Package Scheme of Incentives 2001.
6. IT and ITE Policy 2003.
The industrial policy of the Maharashtra State is liberal and has the
potential to accelerate industrial development of the backward areas.
The aim of the State Industrial Policy is:
1. To decentralise the industrialisation giving more thrust on the
industrial development of the backward areas and thereby creating
employment opportunities in those areas n order to check the
migration of rural unemployed youth to metropolis;

165
2. To delegate powers from state level to district level, so that the
entrepreneurs need not to run from pillar to post and to provide all
types of assistance at the district level, taking district as a unit of
development.
3. To simplify the procedures for providing assistance to the
entrepreneurs. As per the policy of simplification, the provisional
and permanent SSI registrations are now issued across the table and
the recommendations of raw materials are issued by District
Industries Centre on the same day without visits of field staff. N.A.
permission was supposed to be the barriers in the speedy
implementation of the project. Now as per the new industrial policy,
N.A. permission of land for industrial use, up to the limit of 10
hectares, is not required.
The implementation of the prestigious schemes such as PSI
scheme and revised Seed Money Scheme has been entrusted with
D.I.Cs. Almost all the powers of Industries Department and
Directorate of Industries have been now delegated to D.I.Cs. Similar
drive for delegation of powers at field level and simplification of
procedures has also been taken by other Government agencies
related to industrial development. It is hoped that all those measures
taken up by the Government will definitely boost the industrial
development of the Marathwada Region.
For faster and accelerated industrial growth, the State
Government has decided to create excellent infrastructure facilities
by developing five-star industrial estates at nine different locations
in the State. Two such industrial estates are developed at Shendra

166
(near Aurangabad) and Kushnur (near Nanded) in this region. These
estates are relatively large sized areas depending on the needs and
potential of the region. Irrigation Department are earmarking
necessary water for these estates from appropriate sources. Private
sector participation is most welcomed in developing these estates.
Generally, large acreage will be offered on competitive bidding so
that the private sector can associate with its development.
Private sector participation will be sought for upgrading
communication links of such areas with the nearest urban center.
The Government will come out with detailed modalities in this
matter. Service centers, footpaths, good water, integrated effluent
collection, treatment and disposal system, adequate and quality
power, telephone connection on demand and wherever possible, air-
link to a city like Mumbai through private initiatives are some of its
key feature. A noteworthy feature of these industrial estates will be
the facility for waste water treatment and use of waste water by
recycling. On the social infrastructure side, it will include provision
of industrial housing, sites for colleges, hospitals, IITs, clubs and
resorts, commercial complexes, so that a Self-sustainable urban
nucleus could be easily established near such an industrial hub. It is
also proposed to implement the concept of Single Window System
in these industrial areas. In each of the above industrial estates, a
suitable administrative nucleus could be established where officers
from different disciplines vested with necessary powers, would
remain physically Present and give time bound clearances to such
projects. These Would include officers from Industries Department,
MSEB, Sales Tax, Factory Inspector, Labour Department, Pollution

167
Control Board, etc from the Industries Department vested with
appropriate administrative powers and posted in such complexes to
discharge this work effectively.
To accelerate the industrial development of the backward
region, State Government has declared incentives like capital
subsidy and refund of octroi, refund of electricity duty and financial
assistance for conducting feasibility studies under the Package
Scheme of incentives-200l. The whole of the Marathwada Region
except Aurangabad city (D) is covered under D+ zones where
maximum incentives are available under the scheme. Similarly, the
State Govt. has exempted the industries from paying stamp duty on
the Instruments executed for starting a new industry in the
Marathwada Region.
If we look at the industrial status of the region, it is seen that
in the Marathwada Region as on 31.3.2004, there are 7886
permanent SSI units registered with Directorate of Industries with
capital investment of Rs. 44,583.65 lakhs and employment
generation of 62,349. Similarly, there are 402 large and medium
scale industries. In the region, 823 proposed large and medium scale
units have obtained Industrial Entrepreneurs Memorandums (IEM)
and they are likely to start their activities in the near future.
A district has been the unit of administration and development, it
would be appropriate to take district-wise review of the present
financial status and prospects for future industrial development.
4.9 Information Technology in Marathwada region

168
Many IT companies have already been established, with more
waiting to establish a presence, probably due to the city's large urban
and cosmopolitan population and its proximity to Mumbai, Pune and
Hyderabad.
4.10 District-wise Socio-Economic development of
Marathwada region.
4.10.1 Aurangabad District at a Glance
Paithan in Aurangabad district is famous for the last 200 years
for paithani Saris, unlike Aurangabad, which is famous for Himroo
and Mushroo textiles, shawls and Bidri works. Few decades ago
industrial activity in the district was confined to these crafts only.
But today Aurangabad city is one of the industrially developed
centers of the State. In Aurangabad district, as on 31.3.2004, there
are 2352 permanent SSI units with capital investment of Rs.
20,884.24 lakhs and employment generation of 18,798. Similarly,
there are about 304 large and medium scale industries located in the
district with capital investment of Rs. 2125 crores and employment
generation of 37060. Similarly, 395 proposed large scale and
medium scale units have obtained IEM. Due to the efforts of the
State Govt. mega projects of Skoda, Bajaj Auto and Videocon
groups have prominent presence. The major manufacturing
industries in the district includes chemical, electronics,
instrumentation, breweries, automobiles, machine tools, paper and
paper products, transport equipments, food and food processing,
rubber and plastics, etc. Several large corporate business groups

169
both Indian and foreign have started up their Sperations in
Aurangabad They include Colgate, Crompton & greaves,
Wockhardt, RMT, Ceat Tyres, Rallies India, Johnson & Johnson, etc
Most of these industrial units are located in 4 industrial areas
developed by MIDC These are Aurangabad City, Cbikalthana,
Waluj and Shendra with 34,719 and 1578 hectares areas respectively
At present, almost all the plots in MIDC areas of Aurangabad and
Chikalthana have been allotted However, in Waluj MIDC area, still
there 102 plots ranging with area from 500 to 10,000 sq. mtrs are
ready for allotment.
Aurangabad city is the most promising and ideal center for
industrial growth in the Marathwada Region and therefore, offers
good scope/opportunities for almost all type of industrial activities.
The city possesses development potential for specific industries like
tourism, poultry, professing of food, fruit and vegetables, breviaries,
industrial and scientific instruments, paper and paper products,
packaging pharmaceuticals, electronics, automobiles, etc.
The special efforts of MIDC for augmentation of Industries growth
are:
Setting up Software Technology Park of India (STPI) achieving
mark of Rs. 50 crores worth Software export.
Agro & Food Processing Zone by reserving 20 hectors in MIDC
Shendra.
Floriculture development zone in Paithan by reserving 32 hectors
in MIDC, Paithan.

170
Bio Technology Park, Addl. MIDC Area, Jalna reserving 50.53
hectors and MIDC Shendra,(Aurangabad) reserving 125 hectors.
Aurangabad is most sought after destination for industrial
development due to the following reasons.
1. It has the historical and tourist attraction and it is well connected
with Air by Jet Airways (morning and evening services) and Indian
Airlines (evening service).
2. It has the excellent transportation and communication facilities.
Aurangabad is at a distance of 400 Kms from Mumbai. It is
connected to Mumbai by broad-gauge. State Transport Corporation
and private transporters also operate bus services from Aurangabad
to the important cities of the State. There are five telephone
exchanges in the city most of which are electronically operated.
Telephone connections are easily available on demand. Internet and
Mobile phone facilities have also been started in Aurangabad. The
private service providers like Reliance, Airtel, Tata Telecom and
Vodaphone have developed their clientele.
3. For the industrial development of the region, support of technical
manpower is very essential. The city has number of technical
institutions which can fulfill the need of technical manpower
required by industries. There are seven engineering colleges and
three polytechnics which run the courses in the discipline of
mechanical engineering, electrical engineering, civil engineering,
chemical engineering, electronics, instrumentation, computer
engineering, etc. There are twenty management institutions which

171
provide managerial staff for running the industries and enterprises.
Moreover, there are two prestigious institutes in Aurangabad viz, the
Indo German Tool Room (IGTR) and Centre for Electronics and
Designing Technology (CEDT). The IGTR is set up by the Govt. of
Maharashtra and Govt. of India in collaboration with the Federal
Republic of Germany. It runs diploma courses to fulfill the need of
skilled manpower of the industries engaged in the design and
manufacture of tools. It is dedicated to the human resource
development in the area of modern technology and the training is
also imparted in the area of tool-making, tool designing, jigs and
fixtures of international standards. Short term, long term and tailor
made courses are conducted as per the requirement of engineering
and plastic industries. Similarly, manufacture of tools, dies, moulds,
jigs and fixtures is also undertaken to cater the need of high tech
industries. CEDT is established jointly by Govt. of India, Govt. of
Maharashtra and Dr. Babasaheb Ambedkar Marathwada University
to impart the training in the field of electronics and to design and
develop electronic products and technology. It is one of the
important centers of excellence in the field of agro electronics and
medical electronics. Informal and formal courses in electronics
design and technology are imparted in the institute to cater the need
of highly skilled personnel required by the electronics industry. The
diploma and M-Tech courses are conducted by this institute.
4. Medical Facilities:
There are two Medical Colleges in Aurangabad well equipped
with all medical facilities. They cater the need of not only

172
Aurangahad city but also the whole of the Marathwada Region and
neighbouring districts like Buldana, Jalgaon, Dhule and
Ahmednagar. In addition to this, there are Hospitals, namely-
Kamalnayan Bajaj Hospital, Seth Nandlal Dhoot Hospital, Apex
Hospital, MGM Hospital, Sahara Hospital, Aurangabad critical
Hospital etc. and many other hospitals well equipped with state of
the art technologies, modern facilities to provide the health services.
There are two Dental Colleges, one each in Govt. sector and private
sector and two colleges of Ayurvedic and Homeopathic.
5. Hotels –
Ajanta & Ellora caves being in proximity to Aurangabad,
tourism industry has already been developed considerably in
Aurangabad. To support tourism industry, well furnished hotels like
Hotel Taj Residency, Hotel Rama International, Hotel Ajanta
Ambassador, Hotel President Park, and Hotel Medows provide
better services to the tourists and industrialists.
6. Recreational & Cultural Facilities:
Aurangabad city is having long heritage of cultural activities.
There is a Govt. Cultural Hall and Dr. Babasaheb Ambedkar
Marathwada University is having a separate department of Drama
and Cultural Affairs. Aurangabad Sports Club has been recently
started which has the facilities of swimming tank, entertainment,
sports, auditorium, well equipped conference hall, etc.
7. Residential Township:

173
CIDCO is the premier institution of Govt. of Maharashtra
which looks after the development of residential township in the
State. CIDCO has already established the well developed city known
as New Aurangabad adjacent to the Chikaithana MIDC Area.
Moreover, the CIDCO has taken up ambitious programmes of
developing the new township known as Waluj Mahanagar which is
very much in the vicinity of Waluj MIDC Area. CIDCO has
developed approximately 935 hectors area out of 1011.96 hectors.
8. Financial & Banking Services:
The Term Loan needs of the industries are fulfilled by SICOM
and MSFC, the State level organisations. In addition to these,
financial institutions, nationalised banks and scheduled commercial
banks also provide the facilities of term loan and working capital to
the industries. The leading nationalized banks like State Bank of
India, State Bank of Hyderabad, Central Bank of India and Bank of
Maharashtra have their regional offices in Aurangabad. There are
about 75 branches of the nationalized banks and commercial banks
in the city which cater the financial needs of the industries. The
Branch office of SIDBI at Aurangabad covers all the eight districts
of this region.
Table No: - 1.3
Classification of Main and Marginal worker according to nature
of work in the Aurangabad District as on 31st Dec 2007

174
Sr.
No
Field of the worker Total Rural Urban
Main worker’s
1 Farmer 441125 433813 7312
2 Farm Labour 289765 279467 10298
3 Household, Repair, Production 20310 14646 5664
4 Other Worker’s 425657 134775 290882
5 Total of Main Worker 1176857 862701 314156
Marginal worker’s
6 Farmer N.A N.A N.A
7 Farm Labour N.A N.A N.A
8 Household, Repair, Production N.A N.A N.A
9 Other Worker’s 31769 15962 15807
10 Total of Marginal Worker 151326 131667 19659
Classification of Worker’s
11 Total Worker 1328813 994368 333815
12 % of workers to total Population 45.84 54.94 30.70
13 Total No of Non-Working People 1568200 815495 753335
14 % of Non-Working people to total population 54.13 45.15 69.29
15 Total Population of District 2897013 1809863 1087150
Source: - District Socio-Economic Review of Aurangabad 2007-2008 Page 10
Note: - N.A:- Data not available
The Above table 1.3 shows the main and marginal workers of
Aurangabad district. The district has a population of 28, 97,013 out
of which 1,32,8813 are working people i.e 45.84 % of the total
population of the district. There are 11, 76,857 main worker in the
district and 1, 51,326 marginal workers. Out of the 11, 76,857 main
worker 8, 62,701 belong to rural area whereas 3, 14,156 belong to
urban area. There are 1,31, 667 marginal rural workers in
Aurangabad district and 19,659 urban workers out of the total
1,51,326 marginal workers. The non- working population of the
district is 15, 68,200 (54.13 %) out of which 8, 15,495 belong to
rural area and 7,53,335 belong to urban area.

175
Table No: - 1.4
Progress of Small Savings Programme in Aurangabad District
as on 31st Dec 2007. (Rs. In lakhs) Sr.
No
Name of the
Scheme
No of the
Saving
Accounts
holder s
at the
end of
2007-08
Investment of the
Depositor in the year
2006-2007
Investment of the
Depositor in the year
2007-2008
Gross Net Gross Net
1 Postal
Saving
Account
N.A 4167.87 179.85 5010.95 168.19
2 Recurring
Deposit
21051 6130.80 3198.71 6469.14 2947.10
3 Term
Deposit
N.A 783.51 192.19 624.79 146.55
4 Others
4.1 State Bank 2879 4193.47 3441.97 2644 2067.18
4.2 Bank of
Maharashtra
N.A 0.00 0.00 0.00 0.00
4.3 Post office
Savings
N.A 658.74 563.32 908.83 827.63
4.4 Other
Banks
N.A 0.00 0.00 0.00 0.00
5 National
Saving
Certificate
N.A 1679.29 366.67 1144.31 -183.55
6 Indra Vikas
Patra
N.A 0.00 -8.81 0.00 -3.70
7 Kisan Vikas
patra
N.A 1599.08 407.93 1080.34 115.64
8 Montly
savings
11621 4353.35 3149.87 2899.15 652.44
9 National
Saving
Scheme
87
N.A 0.00 -41.30 0.00 -47.89
10 National
Saving
Scheme
92
N.A 0.00 -12.14 0.00 -19.21
11 Other
Scheme
N.A 2030.86 2011.60 648.87 417.82
Districts Total 35551 25596.97 13449.86 21430.38 7088.20
Source: - District Socio-Economic Review of Aurangabad 2007-2008 Page 27
Note: - N.A:- Data not available

176
The above table 1.4 shows the small saving scheme in Aurangabad
district, we can see from the above table that the total number of
saving account holders of the district are 3551 with an net amount of
Rs.7088.20 lakhs at the end of the Dec 2007. From the above table
we can see that the people of the district are keener in investing in
recurring deposit that holds an amount of Rs. 6469.14 lakhs. The
savings of State Bank was Rs. 3441.97 lakhs with 2879 number of
account holders at the end of Dec 2007 in the Aurangabad district.
Table 1.5
Life Insurance Corporation business at a Glance in the
Aurangabad District as on 31st Dec 2007
Sr.
No
Particular
Unit Details
1 Branches of Life Insurance Corporation in
the District
No 7
2 Current Insurance Policy( for March 2008
ending)
No 589977
3 Matured Insurance Policy ( for March 2008
ending)
No 353532
4 New Business (2007-2008)
4.1 Surrender Policy No 298553
4.2
Insured Policy Amount Rs. In
Lakhs
256142
4.3
First premium amount Rs. In
Lakhs
25385
5 No of the Life Insurance Agent
5.1 Total Number of Agent No 9765
5.2 No of the Agent belonging to Rural Area No 5428
5.3 No of women Insurance Agent No 1487
5.4 No of rural women Agent No 529
Source: - District Socio-Economic Review of Aurangabad 2007-2008 Page 28.
Table no 1.5 show the L.I.C business in the district the L.I.C is
having 7 branches in the district, the total number of the insurance
policy holders in the district are 5,89,977 in number which have an
insured policy amount of Rs. 2,56,142 lakhs, there are 9765 agents
of L.I.C in the district with 5428 belonging to rural area of the
177
Aurangabad district, and 4337 belong to urban area of the
Aurangabad district.
4.10.2 Jalna district at a Glance
Jalna district was created on l May 1981 by the bifurcation of the
former Aurangabad district The District is famous for the cultivation
and processing of seeds of international quality though the district
still maintains to lead under this activity, ring the last few years,
there is a phenomenal rise in the number of steel re-rolling mills and
the district in now recognized as the Steel City’ of Marathwada.
Presently, there are more than 25 steel re-rolling mills and steel
plants in the district. The noteworthy feature is that almost all these
units have been promoted by the entrepreneurs, in-spite of the fact
that there is a little encouragement for the activity from financial
institutions, as the aforesaid activity being under their negative list.
As on 31-3-2004, in the district there are 585 permanent SSI units
with a capital investment of Rs. 2992 lakhs and employment
generation of 24,84l. Similarly, 19 large and medium scale unit are
functioning the district with an employment generation of 2769.
Moreover, 35 proposed large and medium scale units have obtained
IEM and these units are expected to start their activities in the near
future.
MIDC has developed two industrial estates i.e. Jalna and Jalna
additional with areas of 50.58 and 158.10 hectares respectively
almost all the plots in both of these areas have been allotted. has the
proposal to develop additional 207 hectors of land adjacent to the
existing area There is a good demand for plots from prospective

178
entrepreneurs It would be possible for MIDC to start allotment of
the plots in this area, if the problem of water supply is solved
satisfactorily. Being in the proximity of the Aurangabad city, the
district has a very good scope for the industrial development.
However, scarcity of industrial water is the main constraint in the
future industrial development of the district.
Table 1.6
Classification of main and marginal worker according to
nature of work in the Jalna District as on 31st Dec 2007.
Sr.
No
Field of the worker Total Rural Urban
Main worker’s
1 Farmer 292018 289746 2272
2 Farm Labour 179336 175727 3609
3 Household, Repair, Production 10129 7996 2133
4 Other Worker’s 130515 59584 70931
5 Total of Main Worker 611998 533053 78945
Marginal worker’s
6 Farmer 25770 25645 125
7 Farm Labour 59966 58430 1536
8 Household, Repair, Production 4121 2594 1527
9 Other Worker’s 15045 7552 7493
10 Total of Marginal Worker 104902 94221 10681
Classification of Worker’s
11 Total Worker 716900 62724 89626
12 % of workers to total Population 44.45 48.06 29.11
13 Total No of Non-Working People 896080 677841 218239
14 % of Non-Working people to total
population
55.55 51.94 70.89
15 Total Population of District 1612980 1305115 307865
Source: - District Socio-Economic Review of Jalna 2007-2008 Page 9
Table No 1.6 shows the main and marginal workers in Jalna
district, the district has a population of 16,12,980 out of which
7,16,900 are working people i.e 44.45 % to the total working
population there are 896080 non-working people in the district, the
total of Main workers is 6,11,998 and marginal workers is
1,04,902. out of the 6,11,998 main workers 5,33,053 belong to
rural area of the Jalna district and 78,945 belong to urban area.

179
There are 94,221 number of the rural marginal workers in Jalna
district and 10,681 number of marginal workers which belong to
rural area out of the total number of 1,04,902 number of marginal
workers in Jalna district.
Table 1.7
Progress of Small Savings Programme in the Jalna District as on
31st Dec 2007 (Rs. In lakhs)
Source: - District Socio-Economic Review of Jalna 2007-2008 Page22
The above table shows the small saving schemes in the district, there
are more than 139182 saving account holders in the district with a
net investment of Rs.707.58 lakhs, the people of the region are more
Sr.
No
Name of the Scheme No of the
Saving
Accounts
holder s at
the end of
2007-08
Investment of the
Depositor in the year
2006-2007
Investment of the
Depositor in the year
2007-2008
Gross Net Gross Net
1
Postal Saving
Account
22391 800.41 244.16 842.19 64.40
2
Recurring Deposit 107350 2260.87 1084.13 2111.04 91.62
3
Term Deposit 2631 148.18 41.57 94.63 -43.35
4 Others
4.1 State Bank
1474 1137.29 769.97 689.43 310.35
4.2 Bank of Maharashtra 102 0.00 0.00 49.40 41.45
4.3 Post office Savings 938 88.15 84.97 134.59 128.43
4.4 Other Banks 0 0.00 0.00 0.00 0.00
5 National Saving
Certificate
0 233.67 25.89 138.39 -53.85
6 Indra Vikas Patra 0 0.00 -4.29 0.00 -1.33
7 Kisan Vikas patra 0 334.43 166.61 188.85 -30.75
8 Montly savings 4227 1100.97 973.52 396.18 157.17
9 National Saving
Scheme 87
0 0.00 -0.33 0.00 -3.24
10 National Saving
Scheme 92
0 0.00 -3.31 0.00 -5.95
11 Other Scheme 69 225.22 222.73 69.71 52.21
Total
139182 6329.19 3605.62 4714.41 707.58

180
interested in investing in post office savings with an amount of Rs.
128.43 lakhs are invested in them in the district. The number of
saving account holders of State Bank are 1474 with an amount of
Rs. 1137.29 lakhs, and that of Bank of Maharashtra are 102 saving
account holders with an amount of Rs. 41.45 lakhs. There are good
numbers of monthly saving holders which are 4227 in number with
an invested amount of Rs. 1100.97 lakhs.
Table 1.8
Life Insurance Corporation business at a Glance in the
Jalna District as on 31st Dec 2007.
Source: - District Socio-Economic Review of Jalna 2007-2008 Page 23
The above table 1.8 shows the business of LIC in the district, with
only a single branch of LIC in district there are 3, 66,687 insurance
policy holders in the district with an insured policy amount of Rs.
36,383 lakhs, there are 1292 number of LIC agent in the district out
of which 767 are from rural area and 525 belong to urban area, there
are 264 number women LIC agent in the Jalna district.
Sr.
No
Particular
Unit Details
1 Branches of Life Insurance Corporation in the District No 1
2 Current Insurance Policy( for March 2008 ending) No 366687
3 Matured Insurance Policy ( for March 2008 ending) No 11055
4 New Business (2007-2008)
4.1 Surrender Policy No 50240
4.2 Insured Policy Amount Rs. In Lakhs 36383
4.3 First premium amount Rs. In Lakhs 3768
5 No of the Life Insurance Agent
5.1 Total Number of Agent No 1292
5.2 No of the Agent belonging to Rural Area No 767
5.3 No of women Insurance Agent No 264
5.4 No of rural women Agent No 187

181
4.10.3 Parbhani district at a glance:-
Parbhani district is leading in agriculture production and Parbhani
city is a seat of agricultural university. Cotton, Jawar, groundnut
sunflower and bananas are the main crops of the district The existing
industrial activity of the district is confined to oil mills, slovent
extraction plants, dal mills, power looms, tarpaulin and steel
furniture As on 31-3-2004, there are 598 permanent SSI units With
capital investment of Rs 6,284 lakhs and employment generation of
2826 Similarly, there are 5 large and medium scale units with an
employment generation of 1661. Moreover, 50 proposed large scale
and medium scale units have obtained IEM. MIDC has developed an
industrial area of 95.74 hectors in parbhani. In this area out of 135
developed plots, 130 plots have been allotted to the entrepreneurs.
Similarly, MIDC Parbhani, jintur and Selu are the important growth
centers in this district.
Table 1.9
Classification of main an marginal workers according to nature
of work in the Parbhani District as on 31st Dec 2007
Sr.
No
Field of the worker Total Rural Urban
Main worker’s
1 Farmer 213367 208469 4898
2 Farm Labour 198438 183165 15273
3 Household, Repair, Production 7023 4731 2292
4 Other Worker’s 141089 41777 99312
5 Total of Main Worker 559917 438142 121775
Marginal worker’s
6 Farmer 24247 24021 226
7 Farm Labour 46362 42685 3677
8 Household, Repair, Production 2010 1137 873
9 Other Worker’s 7791 2877 4914
10 Total of Marginal Worker 80410 70720 9690
Classification of Worker’s
11 Total Worker 640327 508862 131465

182
12 % of workers to total Population 41.91 48.81 27.10
13 Total No of Non-Working People 887388 533667 353721
14 % of Non-Working people to total
population
58.09 51.19 72.90
15 Total Population of District 1527715 1042529 485186
Source: - District Socio-Economic Review of Parbhani 2007-2008 Page 4
The above table 1.9 shows the classification of main and marginal
workers in Parbhani district, the district has a population of 1527715
out of which there are 559917 main workers and 80410 marginal
workers in the district. Out of the total number of the main workers
438142 belong to rural area while 121775 belong to urban area.
There are 70720 numbers of the marginal workers which belongs to
rural area and 9690 number of the marginal workers belongs to
urban areas of the Parbhani district.
Table 1.10
Progress of Small Savings Programme in the Parbhani
District as on 31st Dec 2007.

183
Source: - District Socio-Economic Review of Parbhani 2007-2008 Page 31
The above table 1.10 shows the progress of small saving scheme in
Parbhani district, there are 204860 small savings account holders in
the district with a net investment of Rs. 4539.35 lakhs. The people
of the region have invested more in recurring deposit as compared to
other investment available in the district. The saving account holders
of banks and post office are 7993 with an amount of investment of
Rs. 868.56 lakhs. There are good number of monthly saving holders
in the Parbhani district with an amount of Rs. 3258.74 lakhs there
are 14759 number of account holders.
Sr.
No
Name of the
Scheme
No of the
Saving
Accounts
holder s at
the end of
2007-08
Investment of the
Depositor in the
year 2006-2007
Investment of the
Depositor in the
year 2007-2008
Gross Net Gross Net
1
Postal Saving
Account
13661 1524.29 102.20 1524.29 102.20
2
Recurring Deposit 164104 2683.97 980.43 3012.13 1315.59
3
Term Deposit 3754 439.20 268.28 562.31 188.45
4 Others
4.1 State Bank
7993
753.33
629.72
484.01
377.71 4.2 Bank of
Maharashtra
4.3 post office Savings 115.23 104.69 89.62 82.89
4.4 Other Banks 0 0 0 0
5 National
SavingCertificate
505.22 -24.91 458.61 (-)56.82
6 Indra Vikas Patra - -220.02 - (-)14.26
7 Kisan Vikas patra 840.36 437.29 884.50 562.52
8 Monthly savings 14759 3258.74 2818.70 2192.86 1796.90
9 National Saving
Scheme 87
- (-)13.76 - (-)1.33
10 National Saving
Scheme 92
- (-)1.23 - (-) 5.25
11 Other Scheme 589 238.42 238.42 193.01 190.75
Total 204860 10358.76 2284.60 9401.34 4539.35

184
Table 1.11
Life Insurance Corporation business at a Glance in the
Parbhani District as on 31st Dec 2007.
Sr.
No
Particular
Unit Details
1 Branches of Life Insurance Corporation in the
District
No 2
2 Current Insurance Policy( for March 2008
ending)
No 319911
3 Matured Insurance Policy ( for March 2008
ending)
No 107022
4 New Business (2007-2008)
4.1 Surrender Policy No 34697
4.2
Insured Policy Amount Rs. In
Lakhs
26181.00
4.3
First premium amount Rs. In
Lakhs
2411.00
5 No of the Life Insurance Agent
5.1 Total Number of Agent No 1114
5.2 No of the Agent belonging to Rural Area No 752
5.3 No of women Insurance Agent No 87
5.4 No of rural women Agent No 35
Source: - District Socio-Economic Review of Parbhani 2007-2008 Page 33
The above table 1.12 shows the LIC business in operation in
Parbhani district, there are 2 branches of LIC in operation with
319911 insurance policy holders and insured policy amount of Rs.
26,181 lakhs. There are 1114 number of LIC agent in the district out
of which 752 belong to rural area and 362 belong to urban area of
the Parbhani district, there are 35 number of the women insurance
agent in Parbhani district.
4.10.4 HINGOLI DISTRICT
Recently, the Government has created a new district viz. Hingoli as
on 1-5-1999 by bifurcation of the former Parbhani district. As on 31-
3-2004 there are 159 permanent SSI units with a capital investment
of Rs. 1384 lakhs an employment generation of 815.

185
Similarly, there are 4 large and medium scale units with an
employment generation of 2026. Moreover, 7 proposed large scale
and medium scale units have obtained IEM. The MIDC has
developed an industrial area of 231.25 hectors in Hingoli. Out of the
164 developed plots in this area, 24 plots have been allotted to the
entrepreneurs. There is MIDC at Tq. admeasuring 15 hectors. it has
38 plots, out of which 13 have been allotted. The MIDC area at Tq.
Kalamnuri has area admeasuring 9 hectors. It has 19 plots, of which
3 are allotted. The Cooperative Industrial Estate has 11 acres of land
accommodating 66 plots and 23 functioning units. This district has
religious importance due to Aundhanagnath (one of the Twelve
Jyotirlingas) and the birth place of great Saint Namdeo at Narshi.
These two locations attract lakhs of pilgrims. It gives potential for
economic activities.
Table 1.13
Classification of main and marginal workers according to
nature of work in the Hingoli District as on 31st Dec 2007.
Sr.
No Field of the worker Total Rural Urban
Main worker’s
1 Farmer 193689 191277 2412
2 Farm Labour 146822 142044 4778
3 Household, Repair, Production 5669 4858 811
4 Other Worker’s 66658 34866 31792
5 Total of Main Worker 412838 373045 39793
Marginal worker’s
6 Farmer 12745 12617 128

186
7 Farm Labour 28025 26581 1444
8 Household, Repair, Production 1082 836 246
9 Other Worker’s 5288 2973 2315
10 Total of Marginal Worker 47140 43007 4133
Classification of Worker’s
11 Total Worker 459978 416052 43926
12 % of workers to total Population 46.60 49.94 28.52
13 Total No of Non-Working People 527182 417078 110104
14 % of Non-Working people to total
population
53.40 50.06 71.48
15 Total Population of District 987160 833130 154030
Source: - District Socio-Economic Review of Hingoli 2007-2008 Page 15
The above table shows the classification of main and marginal
workers in the district, the total population of the district is 987160
out if which 459978 is working people in the district there are nearly
527182 number of non-working people in the district. There are
412838 main workers and 47140 numbers of marginal workers in
the district respectively. Out of the 412838 number of the marginal
workers there are 373045 number of the workers who belong to
rural area and 39
Table No: - 1.14
Progress of Small Savings Programme in the Hingoli District as
on 31st Dec 2007
Sr.
No
Name of the
Scheme
No of the
Saving
Accounts
holder s at
the end of
Investment of the
Depositor in the year
2006-2007
Investment of the
Depositor in the
year 2007-2008

187
Source: - District Socio-Economic Review of Hingoli 2007-2008 Page 26
The above table 1.15 shows the small saving programme in the
district, the small saving programme in the district is average with
only 219760 small saving account holders in the district with an net
investment of the district is Rs. 717.57 lakhs. There are 8985
number of bank saving account holders in the district with an
amount of Rs. 222.37 lakhs. There are 15630 number of postal
saving holders and 15795 number of monthly account holders.
Table No:-1.15
Life Insurance Corporation business at a Glance in the Hingoli
District as on 31st Dec 2007.
2007-08 Gross Net Gross Net
1
Postal Saving
Account
15630 330.63 25.46 584.44 26.94
2
Recurring Deposit 175400 1494.76 482.86 1655.98 433.22
3
Term Deposit 3950 79.84 13.28 44.33 -15.41
4 Others 0
0
0
0
0
4.1 State Bank
8985
101.44 90.67 77.28 95.52
4.2 Bank of
Maharashtra
4.3 Post office
Savings
120.93 84.27 122.88 83.48
4.4 Other Banks
0.00 0.00 0.00 0.00
5 National Saving
Certificate
0.00 155.26 -85.72 117.31 -84.99
6 Indra Vikas Patra 0 0.00 -2.25 0.00 -0.67
7 Kisan Vikas patra 0 282.74 157.51 169.63 27.59
8 Montly savings 15795 331.97 261.60 201.14 138.05
9 National Saving
Scheme 87
0 0.00 -0.88 0.00 0.00
10 National
Saving Scheme
92
0 0.00 -0.05 0.00 -0.05
11 Other Scheme 0 35.16 34.16 15.01 13.89
Total 219760 2929.73 1060.91 2988 717.57
Sr.
No
Particular
Unit Details
188
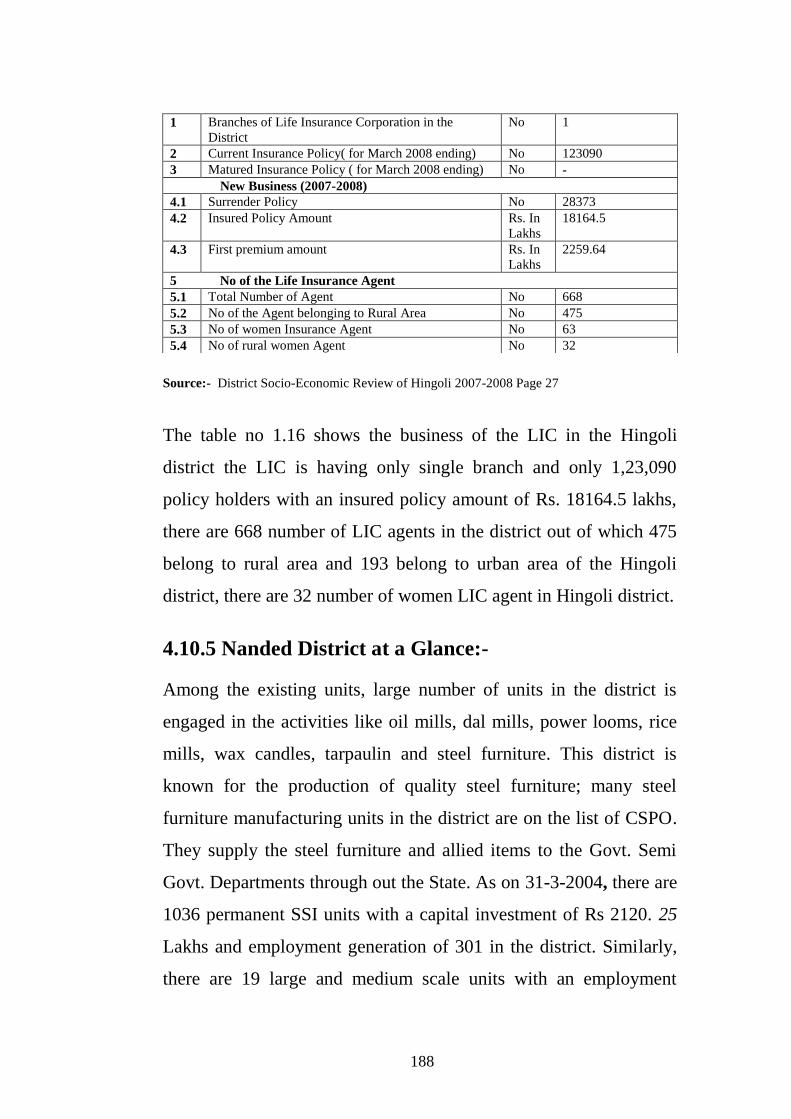
Source:- District Socio-Economic Review of Hingoli 2007-2008 Page 27
The table no 1.16 shows the business of the LIC in the Hingoli
district the LIC is having only single branch and only 1,23,090
policy holders with an insured policy amount of Rs. 18164.5 lakhs,
there are 668 number of LIC agents in the district out of which 475
belong to rural area and 193 belong to urban area of the Hingoli
district, there are 32 number of women LIC agent in Hingoli district.
4.10.5 Nanded District at a Glance:-
Among the existing units, large number of units in the district is
engaged in the activities like oil mills, dal mills, power looms, rice
mills, wax candles, tarpaulin and steel furniture. This district is
known for the production of quality steel furniture; many steel
furniture manufacturing units in the district are on the list of CSPO.
They supply the steel furniture and allied items to the Govt. Semi
Govt. Departments through out the State. As on 31-3-2004, there are
1036 permanent SSI units with a capital investment of Rs 2120. 25
Lakhs and employment generation of 301 in the district. Similarly,
there are 19 large and medium scale units with an employment
1 Branches of Life Insurance Corporation in the
District
No 1
2 Current Insurance Policy( for March 2008 ending) No 123090
3 Matured Insurance Policy ( for March 2008 ending) No -
New Business (2007-2008)
4.1 Surrender Policy No 28373
4.2 Insured Policy Amount Rs. In
Lakhs
18164.5
4.3 First premium amount Rs. In
Lakhs
2259.64
5 No of the Life Insurance Agent
5.1 Total Number of Agent No 668
5.2 No of the Agent belonging to Rural Area No 475
5.3 No of women Insurance Agent No 63
5.4 No of rural women Agent No 32

189
generation of 4085. Moreover, proposed large and medium scale
units have obtained IEM. MIDC has developed an industrial area of
271.90 hectors at Nanded. Out of 335 plots in this area, 326 plots
have been allotted to entrepreneurs. Taking into consideration
potential for the industrial development, State Govt. has taken the
decision to develop Five-Star industrial estate in 645.81 hectares at
Kushnur near the Nanded city. Nanded, Degloor, Mukhed, Kinwat,
Hadgaon are the important growth-centres in the district. The district
has MIDC areas at Degloor, Kandhar and Cooperative Industrial
Estate Nanded. Degloor, Dharmabad and Loha. The proposed co-
operative Industrial Estates are at Barad, Dabhad and Tamsa, q.
Hadgaon). The district has Gurudwara attracting Lakhs of pilgrims
throughout the country. It gives potential for economic activities.
Table No: - 1.17
Classification of main and marginal worker according to
nature of work in the Nanded District as on 31st Dec 2007
Sr.
No
Field of the worker Total Rural Urban
Main worker’s
1 Farmer 3408 3305 103
2 Farm Labour 3832 3602 230
3 Household, Repair,
Production
124 93 31
4 Other Worker’s 1902 902 1000
5 Total of Main Worker 9266 7902 1364
Marginal worker’s
6 Farmer N.A N.A N.A
7 Farm Labour N.A N.A N.A
8 Household, Repair,
Production
N.A N.A N.A

190
9 Other Worker’s 1159 68 1091
10 Total of Marginal Worker 1159 68 1091
Classification of Worker’s
11 Total Worker 9266 7902 1364
12 % of workers to total
Population
0.40 0.43 0.27
13 Total No of Non-Working
People
12879 9249 3630
14 % of Non-Working people
to total population
0.55 0.51 0.72
15 Total Population of District 2330374 1824234 506140
Source: - District Socio-Economic Review of Nanded 2007-2008 Page 12.
N.A:- Data not available
The above table 1.17 shows the Main and Marginal workers in the
district the district has a population of 23,30,374 out of which there
are 9266 main workers in the district. The data for the marginal
workers was not available in for the district. Out of the 9266 main
workers 7902 workers belong to rural area while 1364 belong to urban
area respectively as shown in the above table. The non- working
population of the district is 12879 out of which 9249 number of
people belong to rural areas and 3630 belong to urban area of Nanded
district.
Table No: - 1.18
Sr.
No
Name of the
Scheme
No of the
Saving
Accounts
holder s at
the end of
2007-08
Investment of the
Depositor in the year
2006-2007
Investment of the Depositor
in the
year 2007-2008
Gross Net Gross Net
1
Postal Saving
Account
16574 1892.29 133.12 1935.42 61.41
2
Recurring Deposit 269611 4617.07 1483.14 5012.49 1997.56

191
Progress of Small Savings Programme in the Nanded District as
on 31st Dec 2007.
Source: - District Socio-Economic Review of Nanded 2007-2008 Page 30
The above table 1.18 shows the small saving programme in the
Nanded district which has over 342366 small saving account holders
with and net invested amount of Rs. 6219.44 lakhs. The people of
the region have invested more in recurring deposit as compared to
other saving schemes available in the district. There are 16864
number of saving account holders in State Bank with an amount of
Rs. 743.41 lakhs, there are 16574 number of postal saving account
holders and 17652 number of monthly saving account holders in the
district.
Table No:- 1.19
Life Insurance Corporation business at a Glance in the Nanded
District as on 31st Dec 2007.
3
Term Deposit 4809 756.33 331.23 747.38 92.85
4 Others
4.1 State Bank 16864 743.41 665.11 1111.97 891.14
4.2 Bank of Maharashtra 0 0 0 0 0
4.3 Post office Savings 16747 326.73 281.92 342.97 297.96
4.4 Other Banks 0 0 0 0 0
5 National Saving
Certificate
0 740.89 5.61 678.35 -169.07
6 Indra Vikas Patra 0 0 -463.55 0 -16.28
7 Kisan Vikas patra 0 1467.41 593.10 1339.04 420.05
8 Montly savings 17652 4132.86 3460.57 2976.35 2255.45
9 National Saving
Scheme 87
0 0 -20.80 0 -10.50
10 National Saving
Scheme 92
0 0 -6.84 0 -6.53
11 Other Scheme 109 267.26 267.11 412.06 405.40
Districts Total 342366 14944.25 6729.72 14556.03 6219.44

192
Source: - District Socio-Economic Review of Nanded 2007-2008 Page 31
The above table 4.20 shows the LIC business in Nanded District
which has over 4 LIC branches in the region as shown the table the
numbers of insurance policy holders are 375351 with an insured
policy amount of Rs. 44186.13 lakhs. There are 2165 number of
LIC agents in the district out of which 1150 belongs to the rural
area of the district and 1015 belong to urban area of Nanded
district, there are 424 number of women LIC agent in Nanded
district.
4.10.6 Latur District at a Glance:
The Latur district was created in the year 1982 by the bifurcation
the former Osmanabad district. Latur and Udgir are the places of
historical importance in the district. The battle between Marathas
and Nizam at Udgir is famous. Earlier the crop of cotton was own
on large scale in the district. However, crop pattern has w been
shifted to sunflower which is grown in the district on a large scale
Sr.
No
Particular
Unit Details
1 Branches of Life Insurance Corporation in the District No 4
2 Current Insurance Policy( for March 2008 ending) No 375351
3 Matured Insurance Policy ( for March 2008 ending) No 168643
4 New Business (2007-2008)
4.1 Surrender Policy No 59369
4.2
Insured Policy Amount Rs.
In Lakhs
44186.
31
4.3
First premium amount Rs.
In Lakhs
3799.1
4
5 No of the Life Insurance Agent
5.1 Total Number of Agent No 2165
5.2 No of the Agent belonging to Rural Area No 1150
5.3 No of women Insurance Agent No 424
5.4 No of rural women Agent No 160

193
that the district came to be known as a ‘District Sunflower’. The
farmers of the district have also started to cultivate grapes and
sericulture on a large scale. Grapes are processed and exported to
the Western countries. Latur has been hub of trading activities and
there are large number of units in the district engaged in the
activities of ginning factories, oil mills, dal mills, refineries and
engineering units. As on 31-3-2004, there are 1362 permanent SSI
units with a capital investment of Rs. 7279.69 lakhs and an
employment generation of 8,560 in the district. Similarly, there are
17 large and medium scale units with an employment generation of
5022. Moreover, 76 proposed large and medium scale units have
obtained IEM. MIDC has developed Industrial area of 263.26
hectors at Latur. In this industrial area, out of 590 developed plots,
541 plots have been allotted to entrepreneurs. The district has
potential in the activities like sericulture, grade processing, and oil
mills. Udgir, Ausa, .Ahmedpur is the important. Growth-Centres
having potential for industrial development in the district The
Software Technology Park of India (STPI) is set up to cater the
need, of IT industry.
Table No:- 1.20
Classification of main an marginal workers according to nature
of work in the Latur District as on 31st Dec 2007
Sr.
No
Field of the worker Total Rural Urban
Main worker’s
1 Farmer 261904 258434 3470
2 Farm Labour 242041 234611 7430
3 Household, Repair, Production 139141 126797 12344
4 Other Worker’s 197432 89054 108378
5 Total of Main Worker 840518 708896 131622
Marginal worker’s
6 Farmer 38055 37857 198

194
7 Farm Labour 72472 70392 2080
8 Household, Repair, Production 3584 2505 1079
9 Other Worker’s 13558 6947 6611
10 Total of Marginal Worker 127669 117701 9968
Classification of Worker’s
11 Total Worker 968187 826597 141590
12 % of workers to total
Population
46.54 51.99 28.88
13 Total No of Non-Working
People
1112098 763427 348671
14 % of Non-Working people to
total population
53.46 48.01 71.12
15 Total Population of District 2080285 15900024 490261
Source: - District Socio-Economic Review of Latur 2007-2008 Page 32
The above table shows the main and the marginal workers in the
Latur district. The district has a population of 20,80,285 out of
which there are 968817 number of working people i.e 46.54 % to the
total of the population, the number of non-working people are
11,12,098 i.e 53.46 % to total population of the district. There are
840518 main workers in the district and 127669 numbers of
marginal workers. Out of the 840518 main workers in the district
708896 number of workers belong to rural area and 131622 belong
to urban area. There are 117701 number of marginal workers which
belong to rural area and 9968 number belong to urban area of Latur
district.
Table No: - 1.21
Progress of Small Savings Programme in the Latur District as
on 31st Dec 2007.
Sr.
No
Name of the
Scheme
No of the
Saving
Accounts
holder s at
the end of
2007-08
Investment of the
Depositor in the year
2006-2007
Investment of the
Depositor in the
year
2007-2008
Gross Net Gross Net
1
Postal Saving
Account
3141 1554.56 52.72 2020.97 72.73

195
Source: - District Socio-Economic Review of Latur 2007-2008 Page 48
The above table shows the small saving programme in the Latur
district. The district is having 48538 small saving account holders
with a net investment of Rs.2822.07 lakhs. The people of the region
are more interested in investing in recurring deposit and state bank
savings scheme which has an net investment of Rs944.65 lakhs &
Rs.1000.53 lakhs respectively, there are 3141 number of postal
saving account holders in the district with an investment of Rs.
1554.56 lakhs.
Table 1.22
Life Insurance Corporation business at a Glance in the Latur
District as on 31st Dec 2007
Sr.
No
Particular
Unit Details
1 Branches of Life Insurance Corporation in the
District
No 5
2 Current Insurance Policy( for March 2008 ending) No 359210
3 Matured Insurance Policy ( for March 2008 ending) No 39580
4 New Business (2007-2008)
2
Recurring
Deposit
43190 5642.31 1510.01 5696.92 944.65
3
Term Deposit 733 309.62 50.12 265.58 60.79
4 Others
4.1 State Bank 297 1634.23 1264.84 1463.94 1000.5
3
4.2 Bank of
Maharashtra
3 32.61 26.20 29.91 10.24
4.3 Post office
Savings
218 335.71 307.41 378.59 306.43
4.4 Other Banks - 0 0 0 0
5 National Saving
Certificate
- 458.27 -11.33 27826 -128.77
6 Indra Vikas Patra - - -9.75 0 -6.92
7 Kisan Vikas patra - 1146.62 576.89 593.76 26.01
8 Montly savings - 2481.38 2127.56 912.27 611.09
9 National Saving
Scheme 87
- 0 -32.20 0 -25.03
10 National Saving
Scheme 92
- 0 -3.86 0 9.37
11 Other Scheme 17 308.64 300.56 47.82 42.36
Total 48538 13903.95 6159.11 11686.01 2822.0
7

196
4.1 Surrender Policy No 61740
4.2
Insured Policy Amount Rs. In
Lakhs 51214
4.3 First premium amount Rs. In
Lakhs 4520.46
5 No of the Life Insurance Agent
5.1 Total Number of Agent No 2167
5.2 No of the Agent belonging to Rural Area No 1360
5.3 No of women Insurance Agent No 205
5.4 No of rural women Agent No 25
Source: - District Socio-Economic Review of Latur 2007-2008 Page 49
The above table shows the LIC business at a glance in the Latur
district there are nearly 5 branches in operation in the district with
an 359210 number of insurance policy holders with an amount of
Rs. 51214 Lakhs. There are 2167 number of the LIC agents in the
district. Out of which 1360 are from rural area and 807 number of
LIC agent belong to urban area, there are 205 women insurance
agent in Latur district.
4.10.7 BEED DISTRICT
Agriculture is the main activity in the Beed district. The important
agriculture produces are Jawar, Bajara, Tur, Sugarcane, etc. The
district has large population of animals. The average is almost 180
animals per 1000 persons as against the average of 108 for the State.
Therefore, there is scope for activities like leather processing and
leather goods, bone mills, Gelatin and also for Products based on
milk and poultry. As on 31-3-2004, there are 1143 permanent SSI
units with a capital investment of Rs. 637.53 lakh an employment
generation of 12474 in the district. Similarly, there are 14 large and
medium scale units with an employment generation of 4975.
Moreover, 92 proposed large and medium scale units have claimed

197
IEM. The MIDC has developed as an industrial area of 68.53
hectors at Beed. In this area, out of 187 plots, 161 plots have been
allotted to the needy entrepreneurs. beed, Ambejogai, Parli (V) and
Majalgaon are the important growth centers in the district.
Table No: - 1.23
Classification of main and marginal worker according to
nature of work in the Beed District as on 31st Dec 2007
Sr.
No
Field of the worker Total Rural Urban
Main worker’s
1 Farmer 424195 420858 3337
2 Farm Labour 213170 206251 6919
3 Household, Repair, Production 11851 9768 2083
4 Other Worker’s 181442 98071 83371
5 Total of Main Worker 830658 734948 95710
Marginal worker’s
6 Farmer 38781 38618 163
7 Farm Labour 66913 64272 2641
8 Household, Repair, Production 3999 3319 680
9 Other Worker’s 17233 11014 6219
10 Total of Marginal Worker 126926 117223 9703
Classification of Worker’s
11 Total Worker 957584 852171 105413
12 % of workers to total Population 44.31 48.03 27.23
13 Total No of Non-Working People 1203666 922009 281657
14 % of Non-Working people to total
population
55.69 51.97 72.77
15 Total Population of District 2161250 1774180 387070
Source: - District Socio-Economic Review of Beed 2007-2008 Page 12
The above table shows the main and marginal workers in Beed
district, the district has an population of 21,61,250 out of which
9,57,584 are working people which is nearly 44.31 % to the total
population of the district. There are 830658 main workers in the
district and 126926 numbers of the marginal workers from the
district. Out of the 830658 main workers in the district 734948

198
belong to rural area and 95710 belong to urban area. There are
117223 numbers of marginal workers which belong to rural area and
9703 number of workers belongs to urban area of Beed district.
Table 1.24
Progress of Small Savings Programme in the Beed District as
on 31st Dec 2007.
Sr.
No
Name of the Scheme No of the
Saving
Accounts
holder s at the
end of 2007-08
Investment of the
Depositor in the
year 2006-2007
Investment of the
Depositor in the year
2007-2008
Gross Net Gross Net
1
Postal Saving
Account
26542
1732.95 68.39 2040.43 102.30
2 Recurring Deposit 204088
3568.88 1387.
87
3730.82 1083.04
3
Term Deposit 464 251.56 44.42 202.67 -51.58
4 Other
4.1 State Bank 4679 650.14 402.8
4
407.50 264.35
4.2 Bank of Maharashtra 0 0 0 0 0
4.3 Post office Savings 690 65.32 51.09 68.95 45.08
4.4 Other Banks 0 0 0 0 0
5 National Saving
Certificate
0 0 0 0 0
6 Indra Vikas Patra - - - - -
7 Kisan Vikas patra 18481 1002.82 623.3
8
502.31 97.26
8 Montly savings 4102 2110.81 1439.
28
990.16 329.84
9 National Saving
Scheme 87
0 0 0 0 0
10 National Saving
Scheme 92
0 0 0 0 0
11 Other Scheme 874 179.920 235.2
1
23.12 -2.25
Districts Total 269027 9881.74 4280.
13
8200.28 1814.02

199
Source: - District Socio-Economic Review of Beed 2007-2008 Page 30
The above table 1.24 shows the Small Saving Programme in beed
district, the total number of saving account holders are 269027 with
an net investment of Rs. 1814.02 lakhs, the people of the district has
invested more in recurring deposit with an amount of Rs. 1083.04 is
invested in it. There are 4679 number of saving account in State
bank with an investment of Rs. 650.14 Crore. There are nearly
18481 number of kisan vikas patra holders in the district with an
invested amount of Rs. 1002.82 lakhs.
Table 1.25
Life Insurance Corporation business at a Glance in the
Beed District as on 31st Dec 2007
Sr.
No
Particular
Unit Details
1 Branches of Life Insurance Corporation in the District No 3
2 Current Insurance Policy( for March 2008 ending) No 319766
3 Matured Insurance Policy ( for March 2008 ending) No 185114
4 New Business (2007-2008)
4.1 Surrender Policy No 60161
4.2 Insured Policy Amount Rs. In
Lakhs
5243
4.3 First premium amount Rs. In
Lakhs
4680
5 No of the Life Insurance Agent
5.1 Total Number of Agent No 1971
5.2 No of the Agent belonging to Rural Area No 1586
5.3 No of women Insurance Agent No 151
5.4 No of rural women Agent No 111
Source: District Socio-Economic Review of Beed 2007-2008 Page 31.
The above table shows the L.I.C business in Beed district the region
is having 3 branches of L.I.C with 3,19, 766 number of policy
holders which has an insurance policy amount of Rs.5,243 lakhs.
There are 1971 number of LIC agent in the district out of which
200
1586 belongs to rural area and 385 belong to urban area, there are
151 women insurance agents in Beed district.
4.10.8 OSMANABAD DISTRICT:
Osmanabad district has a rich, historical and religious background.
pranda fort was once a head quarter of the Nizam Government
naldurg is also another important place of historic importance.
tuljapur is famous for the historical temple of the Goddess bavani.
However, Osmanabad is considered to be the most industrial1y
backward district in Marathwada. The district lacks in infrastructure,
such as network of railways, telecommunications, etc. The district
has only 30 Kms narrow-gauge railway line completed in the pre
independence era. Agriculture is the main activity in the district and
important agriculture produces are war, Bajara, Maize, Pulses,
Sericulture, Groundnut and Tobacco. The district has got a large
population of livestock and is better placed in milk production. Agro
based activities and activities based on livestock such as leather
processing, dairy, poultry farms, grape processing, sericulture, oil
mills and dal mills have good pope in the district. As on 31-3-2004,
there are 651 permanent SI units with a capital investment of Rs.
3031.94 lakhs and an employment generation of 2,903 in the district.
Similarly, there re 24 large and medium scale units with an
employment generation of 4608. Moreover, 86 proposed large scale
units have Osmanabad. Out of 131 plots in this industrial area, 112
plots have been allotted to entrepreneurs.
Table No: - 1.27

201
Classification of main and marginal workers according to
nature of work in the Osmanabad District as on 31st Dec 2007.
Sr.
No
Field of the worker Total Rural Urban
Main worker’s
1 Farmer 236068 232163 3905
2 Farm Labour 196582 187939 8643
3 Household, Repair, Production 11207 9543 1664
4 Other Worker’s 11345 66672 44673
5 Total of Main Worker 555202 496317 58885
Marginal worker’s
6 Farmer 20907 20654 253
7 Farm Labour 60543 57453 3090
8 Household, Repair, Production 4910 4150 760
9 Other Worker’s 11960 8183 3777
10 Total of Marginal Worker 98320 90440 7880
Classification of Worker’s
11 Total Worker 653522
586757 66765
12 % of workers to total Population 43.96
46.82 28.62
13 Total No of Non-Working
People
833064
666573 166491
14 % of Non-Working people to
total population
56.04
53.18 71.37
15 Total Population of District 1486586
1253330 233256
Source: - District Socio-Economic Review of Osmanabad 2007-2008 Page 8.
The above table shows the classification of main and marginal
workers in the Osmanabad district which has an population of
14,86,586 out of which 5,55,202 are main workers in the district and
98,320 are marginal workers there are 43.96 % working people in
the district out of the total population and 56.04 % non-working
people in the district. Out of the total number of 5,55,202 main
workers in the district 496317 belong to rural areas and 58885
belong to urban area. There are 90440 number of marginal workers
which belong to rural area and 7880 number of marginal workers
belong to urban areas.
Table No: - 1.28

202
Progress of Small Savings Programme in the Osmanabad
District
Sr.
No
Name of the
Scheme
No of the
Saving
Accounts
holder s at
the end of
2007-08
Investment of the
Depositor in the
year 2006-2007
Investment of the
Depositor in the year
2007-2008
Gross Net Gross Net
1 Postal Saving
Account
31393 1825.02
97.83 1950.41 89.67
2 Recurring
Deposit
135434 2585.48
659.86 2665.19 410.84
3 Term Deposit 6181 285.55
-504..23 263.82 -103.22
4 Others
4.1 State Bank 1010 350.21 275.81 292.67 160.91
4.2 Bank of
Maharashtra
N.A N.A N.A N.A N.A
4.3 Post office
Savings
13891 134.03 124.65 147.20 133.70
4.4 Other Banks N.A N.A N.A N.A N.A
5 National Saving
Certificate
210.03 -34.06 164.82 -26.37
6 Indra Vikas
Patra
------ -3.40 ---- -3.36
7 Kisan Vikas
patra
881.86 506.04 464.63 68.08
8 Montly savings 21929 1129.22 759.70 553.94 -25.84
9 National Saving
Scheme 87
313 -0.89 ----- ---
10 National Saving
Scheme 92
----- -0.16 ---- -1.99
11 Other Scheme N.A N.A N.A N.A N.A
Total 210389 7485.30 1965.05 6506.88 696.08
Source:- District Socio-Economic Review of Osmanabad 2007-2008 Page 20
Note: - N.A:- Data not available
The above table highlights the small saving programme in
Osmanabad district there are 210389 number of small saving
account holders in the district out of which the net amount invested
is Rs.696.08 Lakhs. There are 31393 number of postal saving
account holders with an investment of Rs. 1825.02 lakhs.
Table No: - 1.29

203
Life Insurance Corporation business at a Glance in the
Osmanabad District
Sr.
No
Particular
Unit Details
1 Branches of Life Insurance Corporation in the District No 2
2 Current Insurance Policy( for March 2008 ending) No 230197
3 Matured Insurance Policy ( for March 2008 ending) No 18732
4 New Business (2007-2008)
4.1 Surrender Policy No 21470
4.2
Insured Policy Amount Rs. In
Lakhs 17146.8
3
4.3
First premium amount Rs. In
Lakhs 1851.68
5 No of the Life Insurance Agent
5.1 Total Number of Agent No 1082
5.2 No of the Agent belonging to Rural Area No 761
5.3 No of women Insurance Agent No 752
5.4 No of rural women Agent No 89
Source: - District Socio-Economic Review of Osmanabad 2007-2008 Page 21
The above table 1.29 shows the business of LIC in the Osmanabad
district there are 2 branches of LIC which are in operation in the
district with 230197 numbers of insurance policy holders and
insured policy amount of Rs. 17146.83 lakhs. There are 1082
number of LIC agent in the district out of which 761 belong to rural
area of the district and 321 belong to urban area of the Osmanabad
district, there are 752 number of women insurance agent in the
district.
Table No: - 1.30

204
Investments and Employment in approved SEZs in
Maharashtra State as on 31st October, 2008.
Source:- Directorate of Industries, Government of Maharashtra
The above table 1.30 shows the Investments and Employment in
approved SEZs in Maharashtra State. The State has adopted the
Special Economic Zone Policy (SEZ) with effect from
10thFebruary, 2006. The SEZs notified as duty free enclaves, have a
relaxed and business friendly policy regime, aimed at promoting
rapid industrial development and employment generation. As we can
see from the above table Marathwada region had 14 SEZ with an
investment of Rs 4,041 Crore and Employment of 1.56 lakhs that
shows that region is devlopeing and state govt is also providing
them incentives for development.
The approved policy regime includes:
• All related approvals through a dedicated single window
mechanism.
• Development of infrastructure facilities.
• Creation of employment opportunities.
• Promotion of exports of goods and services.
• Promotion of investment from domestic and foreign sources.
Region
No. Area
(ha.)
Investment (Rs.
Crore)
Employment
(in lakh)
Konkan 65 29,608 1,10,581 42.05
Western Maharashtra 45 6,264 21,668 11.67
Marathwada 14 3,811 4,041 1.56
Vidarbha 9 4,799 12,432 5.76
Total 6,797 72,117 7,197 77,069

205
• Generation of additional economic activities.
Table: 1.31
Status of Co-operative Industrial estates as on 31st December,
2008.
Region Registered Functioning Industrial units in
operations
Employment
Greater Mumbai 3 3 312 11,550
Konkan
(excluding Greater
Mumbai)
15 12 500 9,853
Nashik 33 26 1,442 38,785
Pune 45 34 2,985 49,105
Marathwada 26 13 455 4,212
Amravati 10 3 82 615
Nagpur 10 4 289 2,915
Total 142 95 6,065 1,17,035
Source: - Directorate of Industries, Government of Maharashtra
The above table 4.36 shows the Status of Co-operative Industrial
estates in Maharashtra state. The State Government has undertaken
a programme of developing industrial estates in areas other than
MIDC areas on a co-operative basis with the view to generate more
employment opportunities in rural areas. The State Government is
providing several facilities in terms of contribution to share capital
& technical guidance for establishing industries in co-operative
industrial estates. The status of co-operative industrial estates in the
State is given in above Table the Marathwada region has 26
cooperative sciotey out of which 13 are functioning.
Table No: - 1.32

206
Maharashtra Industrial Development Corporation (MIDC) as
on 31st March, 2008.
Region MIDC areas Industrial Units No. of Plots
Maj
or
Mi
ni
Grow
th
Centr
e
Tot
al
No. Investm
ent (Rs.
Crore)
Employm
ent
Develop
ed
Allot
ed
Greater
Mumbai
1 0 0 1 305 1,300 1,35,000 357 349
Konkan
(Excl. Gr.
Mumbai)
24 5 3# 32 10,0
45
11,891 2,33,270 17,000 15,18
9
Nashik 10 9 11# 30 5,61
6
2,176 49,156 8,772 7,962
Pune 29 18 19 66 8,41
6
12,089 2,68,532 15,067 13,43
0
Marathw
ada
16 20 12# 48 4,21
4
1m257 50,633 9,410 8,356
Amravati 7 32 8# 47 1,32
8
452 17,532 4,462 3,139
Nagpur 11 25 10# 46 2,25
4
7,860 66,600 5,660 4,770
Total 98 109 63 270 32,1
78
37,025 8,20,723 60,728 53,19
8
Source: MIDC, Government of Maharashtra
# of which one centre each is being developed by Government of India.
Form the above table 1.32 we can see MIDC at a glance in
Maharashtra State. In order to achieve planned and systematic
growth throughout the State, Maharashtra Industrial Development
Corporation (MIDC) is developing industrial areas with essential
infrastructure like internal roads, water, electricity and other internal
services for entrepreneurs. To achieve decentralized as well as faster

207
industrial development, the State Government is also implementing
the following important programmes through MIDC:
• Establishment of growth centers
• Establishment of mini-industrial areas
• Setting-up of ‘Five Star’ industrial areas
Table No:- 1.33
Details of MSME & Large Enterprises in Maharashtra State as
on 31st October, 2008
Source: Directorate of Industries, Government of Maharashtra
From the above table 1.33 we can see the Details of MSME & Large
Enterprises in Maharashtra StateMicro, Small & Medium
Enterprises (MSMEs) Development Act, 2006 was enacted
witheffect from 2nd October, 2006. The State Government has
already simplified the registration procedure. The earlier concept of
‘Industries’ has been changed to ‘Enterprises’. Enterprises have
been classified broadly into two categories (i) manufacturing, (ii)
Region MSME Employment @ Large
Enterprises
Employment
Konkan 26,245 2,66,950 1,311 1,42,774
Nashik 21,407 1,48,746 353 70,694
Pune 79,296 4,20,382 2,227 4,03,623
Marathwada 10,815 92,552 225 48,798
Amravati 6,858 41,456 62 73,003
Nagpur 14,940 1,16,025 228 73,893
Maharashtra 1,59,561 10,86,111 4,406 8,12,785

208
services. Both the categories of enterprises have further been
classified into Micro, Small, Medium and Large enterprises based
on their investments in plant & machinery (for manufacturing
enterprises) or on equipments (in the case of enterprises providing or
rendering services). Details about MSMEs and large unitsare given
in above table
4.11 Some of the popular Mutual fund in operation in
Marathwada region
Public Sector
1. UTI (1964). 2. SBI MF (1987)
3. CAN Bank MF (1987). 4. IND Bank MF (1990)
5. BOI MF (1990). 6. PNB MF(1990)
7. GIC MF (1990). 8. BOB MF
9.LIC MF (1989.) 10.IDBI MF
Private Sector
1. Kothari Pioneer MF 2.ICICI MF
3.20th Century MF 4.Morgin Stanley MF
5. Taurus MF 6.Apple MF
7. CRB MF 8.JM MF
9. Shriram MF 10.Alliance MF
11. Birla MF 12.Tata MF
13. Reliance MF 14.Jardine Fleming MF
15. HB MF 16.Pioneer MF

209
17. CEAT MF 18.Indus Ind MF
19. Kotak Mahindra MF 20.Templeton
Table No. 1.34
Mutual Fund Industries at a Glance in Marathwada
Region as on 31st December 2008
SR.NO Name of District Number of
AMFI Broker
Total Number of
Investors
1 Aurangabad 84 21600
2 Nanded 14 4191
3 Latur 15 4810
4 Parbhani 8 1640
5 Jalna 6 1149
6 Beed 4 510
7 Osmanabad 1 270
8 Hingoli 1 260
Total 133 34430
Source: - Compiled from AMFI`s and other AMC`s websites.
The table No. 1.34 highlights on the overall AMFI registered broker
from Marathwada Region. The Marathwada Region consists of eight
districts; the total No. AMFI registered broker is shown in table No.
4.31 we can see that Aurangabad district has the highest number of
AMFI registered broker i.e 84 as awareness regarding mutual funds
is more in this district and there are many AMC`s office which are
present in the city so the broker can deal with the mutual fund
companies directly and also there are many banks in the district,
followed by Latur (15) Nanded (14) there are only single broker in
210
Hingoli and Osmanabad this shows the awareness of mutual fund is
low in this region.
4.12 Banking and Financial Services in Marathwada
Region
In the first decade of the 21st century, Marathwda has seen a spurt in
financial activities, with almost all public sector and private banks
have opened up branches including the State Bank of India, State
Bank of Hyderabad, Citibank, Deutsche Bank, ICICI Bank, the
Bank of India, HDFC Bank, YES Bank, SIDBI , Catholic Syrian
Bank , Karur Vyasya Bank , Karnataka Bank , State Bank of Patiala
, State Bank of Indore , J&K Bank , Syndicate Bank , Indian Bank.
If we take the overall review of the industrial and financial sector
scenario in the Marathwada region, it reveals, that except
Aurangabad district and to some extent a few other pockets like
Jalna, Nanded and Latur, rest of Marathwada is still industrially very
backward in Investment Management Industry like Mutual fund or
stock market investment. However, it is hoped that the Govt efforts
to create additional infrastructural and extend maximum incentives
to the up coming units in industrially backward areas coupled with
rise in local entrepreneurship, would accelerate the industrial
development of Marathwada Region.

211
References:
1. Dr. Sadhak H., “Industrial Development in Backward Regions in
India,” Chugh Publications, Allahabad, p-4.
2. District Socio-Economic Review of Aurangabad 2005-2008.
3. District Socio-Economic Review of Beed 2005-2008.
4. District Socio-Economic Review of Hingoli 2005-2008.
5. District Socio-Economic Review of Jalna 2005-2008.
6. District Socio-Economic Review of Latur 2005-2008.
7. District Socio-Economic Review of Nanded 2005-2008.
8. District Socio-Economic Review of Osmanabad 2005-2008.
9. District Socio-Economic Review of Parbhani 2005-2008.
10. Drushti Kshepath Maharashtra, Aurangabad Division 1994-1997,
Director of Economic and Statistics, Regional Office, Govt. of
Maharashtra, Aurangabad.
11. Deshpande M.U., Marathwada 2001 Vol. II Article Published
Marathwadyatil Udyojakta Vikas, Sanyojan Samiti Marathwada,
2001, Prakashan 1998, p-621-622.
12. Dr. M.U. Deshpande, Entrepreneurship of small scale industries,
Deep Publications, New Delhi, p-2-83.

212
13. Intellectual’s Sandarbh, Maharashtra State and District at a Glance,
Set in 2, Vol. I and II, Anupam Mudran, Bhopal, Chapter-
Population-200l, Marathwada- p- 638-810. Consultancy Services,
Bombay — p-38.
14. Jadhav J.V., ‘Role of Development Agencies in promotion of
Industrial growth in backward region, industrial people —journal-
1987, Vol. 1, No.1.
15. Kate P.V., Impact of the Nizam’s Regime on Marathwada (1724-
1948), Unpublished Ph.D. Thesis Submitted to the Marathwada
University, 1978, p-3.
16. Marathwada 2001 Vol. 1, Article by Dr. Deshpande M.U.,
Vikasatil Adsarwa Tyawaril Upay, Sanoyojan Samiti.
17. Marathwada 2001 Vol. 1, Article by Dr. Deshpande M.U.
Marathwadyatil Udyojakta Vikas, Sanyojan Samiti, Marathwada
2001, Vikas Bhavan, Dr. Rajendra Prasad Marg, Aurangabad,
June-1988, p-6.1 to 6.22.
18. Note on Marathwada Industrial Development-2004, B.V. Rathod,
Joint Director of Industries Aurangabad Region, Aurangabad, P-l-
7.
19. Sinha S.K., “The Urban Process in Maharashtra,” Indian Journal of
Regional Science Vol. 1 l-No.2, Regional Science Association.
20. Socio-Economic Review and Divisional Statistical Abstract of
Aurangabad Region — Published by Bureau of Economics and
Statistics, Govt. of Maharashtra, Bombay- 1970-71, p-1.

213
21. The Hyderabad Government-Bulletin of Economic Affairs, Vol. II,
Nos. 1-2 Jan-Feb-l954.
22. The Economic Times Mumbai — A news from Ahmedabad, Title
‘NIFT has some new designs on size chart; dated 8th December
2006, p-32.
23. Vasant Desai, “Entrepreneurial Development,” Vol. 1, Himalaya
Publishing House, New Delhi l991-p-lOl-lO3.
Website:-
http://www.aurangabad.nic.in
http://www.maharashtra.gov.in
http://www.midcindia.org
http://www.wikipedia.org

206


