

Wayne State UniversityDigitalCommons@WayneStateBiochemistry and Molecular Biology FacultyPublications Department of Biochemistry and Molecular Biology
7-3-2007
Characterization and Structure of a Zn2+ and[2Fe-2S]-containing Copper Chaperone fromArchaeoglobus FulgidusMatthew H. SazinskyNorthwestern University
Benjamin LeMoineNorthwestern University
Maria OrofinoWorcester Polytechnic Institute
Roman DavydovNorthwestern University
Krisztina Z. BenczeWayne State University
See next page for additional authors
This Article is brought to you for free and open access by the Department of Biochemistry and Molecular Biology at DigitalCommons@WayneState. Ithas been accepted for inclusion in Biochemistry and Molecular Biology Faculty Publications by an authorized administrator ofDigitalCommons@WayneState.
Recommended CitationSazinsky, M. H., LeMoine, B., Orofino, M., Davydov, R., Bencze, K. Z., Stemmler, T. L., Hoffman, B. M., Argüello, J. M., andRosenzweig, A. C. (2007) J. Biol. Chem. 282, 25950-25959. doi:10.1074/jbc.M703311200Available at: http://digitalcommons.wayne.edu/med_biochem/5

AuthorsMatthew H. Sazinsky, Benjamin LeMoine, Maria Orofino, Roman Davydov, Krisztina Z. Bencze, Timothy L.Stemmler, Brian M. Hoffman, José M. Argüello, and Amy C. Rosenzweig
This article is available at DigitalCommons@WayneState: http://digitalcommons.wayne.edu/med_biochem/5

This is the author's post-print version, previously appearing in the Journal of
Biological Chemistry.,2007 282: 25950-25959.
Available online at: http://www.jbc.org/

Characterization and Structure of a Zn2+ and [2Fe-2S]-Containing Copper
Chaperone from Archaeoglobus fulgidus
Matthew H. Sazinsky,§ Benjamin LeMoine,§ Maria Orofino,† Roman Davydov,§ Krisztina Z. Bencze,‡
Timothy L. Stemmler,‡ Brian M. Hoffman,§ José M. Argüello,†,¶ and Amy C. Rosenzweig§,¶
From the §Departments of Biochemistry, Molecular Biology, and Cell Biology and of Chemistry,
Northwestern University, Evanston IL 60208, †Department of Chemistry and Biochemistry,
Worcester Polytechnic Institute, Worcester MA 01609, ‡Department of Biochemistry and Molecular
Biology, Wayne State University School of Medicine, Detroit, Michigan 48201
Address correspondence to: Amy C. Rosenzweig, Departments of Biochemistry, Molecular Biology,
and Cell Biology and of Chemistry, Northwestern University, Evanston IL 60208, Tel.: 847-467-5301;
Fax. 847-467-6489; E-mail: [email protected] and José M. Argüello, Department of Chemistry
and Biochemistry, Worcester Polytechnic Institute, Worcester MA 01609, Tel. (508)-831-5326; Fax.
(508)-831-5933; E-mail: [email protected]
Abstract
Bacterial CopZ proteins deliver copper to P1B-type Cu+-ATPases that are homologous to the
human Wilson and Menkes disease proteins. The genome of the hyperthermophile
Archaeoglobus fulgidus encodes a putative CopZ copper chaperone that contains an unusual
cysteine rich N-terminal domain of 130 amino acids in addition to a C-terminal copper-
binding domain with a conserved CXXC motif. The N-terminal domain (CopZ-NT) is
homologous to proteins found only in extremophiles and is the only such protein that is
fused to a copper chaperone. Surprisingly, optical, electron paramagnetic resonance, and X-
ray absorption spectroscopic data indicate the presence of a [2Fe-2S] cluster in CopZ-NT.
The intact CopZ protein binds two copper ions, one in each domain. The 1.8 Å resolution
crystal structure of CopZ-NT reveals that the [2Fe-2S] cluster is housed within a novel fold
and that the protein also binds a zinc ion at a four cysteine site. CopZ can deliver Cu+ to the
A. fulgidus CopA N-terminal metal binding domain and is capable of reducing Cu2+ to Cu+.
This unique fusion of a redox-active domain with a CXXC-containing copper chaperone
domain is relevant to the evolution of copper homeostatic mechanisms and suggests new
models for copper trafficking.

Characterization and Structure of a Zn2+ and [2Fe-2S]-Containing Copper Chaperone from Archaeoglobus
fulgidus | Matthew Sazinsky, et. al
DIGITALCOMMONS@WSU | 2007 3
Copper is a meticulously regulated redox active micronutrient found in a number of important
enzymes, including cytochrome c oxidase and superoxide dismutase. Since free or excess
intracellular copper can cause oxidative damage, both prokaryotes and eukaryotes have developed
specific copper trafficking and transport pathways (1,2). Deficiencies in these processes are linked to
human diseases, including Wilson and Menkes disease. In Wilson disease, accumulation of copper in
the liver and brain leads to cirrhosis and neurodegeneration, and in Menkes disease, copper
transport across the small intestine is impaired, leading to copper deficiency in peripheral tissues
(3,4). Both disorders are caused by mutations in Cu+-transporting P1B-type ATPases (5-7), enzymes
that are found in most organisms and function in the cellular localization and/or export of cytosolic
copper (8,9).
The Cu+-ATPases comprise eight transmembrane (TM) helices, of which three (TM6, TM7, and
TM8) contribute invariant residues to form the transmembrane metal binding site, a cytosolic ATP
binding domain linking TM6 and TM7, an actuator domain (A-domain) between TM4 and TM5, and
cytosolic metal binding domains (MBDs) of ~60-70 amino acids that bind Cu+ (8,10). Whereas
prokaryotic Cu+-ATPases typically have one or two MBDs, eukaryotic homologs have up to six such
domains. Each MBD contains a highly conserved CXXC consensus sequence for binding Cu+ and
adopts a βαββαβ fold (11-14) nearly identical to that of the Atx1-like cytosolic copper chaperones,
including yeast Atx1, human Atox1, and bacterial CopZ (15-19). These chaperones also contain a
CXXC motif and deliver Cu+ to one or all of the MBDs (20-26). It is not clear how Cu+ reaches the
transmembrane metal binding site and how the cytosolic chaperones participate in this process.
The hyperthermophilic Cu+-ATPase CopA from Archaeoglobus fulgidus is readily expressed in fully
active recombinant form, is highly stable, and contains all of the essential structural elements for
copper transfer, including one N-terminal and one C-terminal MBD (27-29). CopA is therefore an
excellent model system both for investigating the mechanisms of P1B-type ATPases and for studying
interactions between a cytosolic chaperone and its intact partner Cu+-ATPase. The only potential
copper chaperone protein in the A. fugidus genome, which we have designated A. fulgidus CopZ,
differs from all other known copper chaperones in that it contains an additional 130 amino acids
fused to the N-terminus of a 60 residue CXXC-containing sequence that is homologous to Atx1-like
chaperones and Cu+-ATPase MBDs (Fig. 1A). Notably, the A. fulgidus CopA C-terminal metal
binding domain (CopA C-MBD) is the most similar to the CopZ C-terminus, with 42% identity. The
CopA N-terminal MBD (CopA N-MBD) is only 20% identical to CopZ. The novel N-terminal domain
of CopZ (CopZ-NT) contains 9 conserved cysteine residues and resembles uncharacterized 10-15 kDa

Characterization and Structure of a Zn2+ and [2Fe-2S]-Containing Copper Chaperone from Archaeoglobus
fulgidus | Matthew Sazinsky, et. al
DIGITALCOMMONS@WSU | 2007 4
proteins from other extremophilic archaea (Fig. 1B). The A. fulgidus protein is the only one in which
this domain is fused to a putative copper chaperone, however. In all the other extremophilic
organisms that have a CopZ-NT homolog, the putative copper chaperone exists as a separate 70
amino acid protein, and its gene is not located in an operon with that encoding a CopZ-NT homolog,
suggesting that their expression might not be linked.
Here we describe the characterization and 1.8 Å resolution crystal structure of the A. fulgidus
CopZ N-terminus (CopZ-NT). Surprisingly, CopZ-NT contains a [2Fe-2S] cluster and a mononuclear
zinc site. The fusion of a redox-active domain with a CXXC-containing copper chaperone is
unprecedented and suggests previously unrecognized paradigms for copper trafficking and
regulation.
Fig. 1 Sequence alignment of the A. fulgidus CopZ domains. (A) CopZ C-terminal domain sequence
alignment to the A. fulgidus CopA N- and C-terminal MBDs, and to human Atox1. Completely conserved
residues are highlighted green, residues conserved among the A. fulgidus proteins are highlighted blue,
residues conserved between CopZ-CT and CopA-NT are highlighted yellow, and residues conserved between
CopZ-CT and CopA-CT are highlighted red. (B) N-terminal domain sequence alignment. Sequences of
homologous proteins used for the alignments were from the following species: Archaeoglobus fulgidus DSM
4304 (NP_069182.1), Alkaliphilus metalliredigenes QYMF (EAO82573.1), Caldicellulosiruptor saccharolyticus
DSM 8903 (EAP42583.1), Carboxydothermus hydrogenoformans Z-2901 (YP_359666.1), Moorella
thermoacetica ATCC 39073 (YP_429978.1), Deinococcus geothermalis DSM 11300 (ZP_00398040.1),
Geobacillus kaustophilus HTA426 (YP_146024.1), Chloroflexus aurantiacus J-10-fl (EAO58988.1),
Thermoanaerobacter tengcongensis MB4 (NP_623988.1), Thiomicrospira crunogena XCL-2 (YP_392381.1),
Thermosynechococcus elongatus BP-1 (NP_682675.1), Chlorobium tepidum TLS (NP_662049.1), Wolinella
succinogenes DSM 1740 (NP_906973.1). The protein accession numbers are in parentheses.

Characterization and Structure of a Zn2+ and [2Fe-2S]-Containing Copper Chaperone from Archaeoglobus
fulgidus | Matthew Sazinsky, et. al
DIGITALCOMMONS@WSU | 2007 5
Materials and Methods
Cloning and Purification of CopZ and the CopA N-terminal MBD. The gene encoding CopZ
(AF0346) was cloned from A. fulgidus genomic DNA by PCR using the primers 5'-
ATGATGCGATGCCCAGAATG-3' and 5'-TCTCTTTCAAGCCGTGCAGA-3'. The purified gene and
the plasmid pPRIBA1 (IBA, Germany) were digested with the restriction enzyme Bsa1, purified,
and ligated to create the plasmid pCOPZ, which fuses a 10 amino acid (SAWSHPQFEK) streptactin
tag to the C-terminus of the expressed gene product. The gene encoding CopZ was also cloned into
pBAD/TOPO vector (Invitrogen, Carlsbad, CA) using the primers 5’-ATGATGCGATGCCCAGAATG-
3’ and 5’-TCTCTTTTCAAGCCGTGCAGA-3’ to attach a (His)6-tag to the CopZ N-terminus. The N-
terminal domain of CopZ (residues 1-131, CopZ-NT) was PCR amplified from the pCOPZ plasmid by
using the primers 5'-CGGGAAGGTCTCTGCGCTTCCAACGGG-AAATCC-'3 and 5'-
GCCCTTGGTCTCTAATGATCGATGCCCAGAAT-'3, which encode for a BsaI restriction site. As
described above, the gene was inserted into the pPRIBA1 plasmid to create pCOPZNT. The C-
terminal CXXC-containing copper chaperone domain (residues 132-204, CopZ-CT) was PCR
amplified from the pCOPZ plasmid to include the streptactin tag by using the primers
5’-GGAATTCCATATGGGTGAGAAGAAAGCGGCTAAAAG-‘3 and
5’-CCGCTCGAGTTATTTTTCGAACTGCGGGTGGCTCCAAGC-’3, which incorporate a 5’ Nde1 and 3’
Xho1 restriction sites. The purified gene product and a pET21b plasmid (Novagen) were digested,
purified, and combined to create the pCOPZCT vector. The CopA N-MBD (residues 16-87) was
cloned into a pASK-IBA3 vector after PCR amplication with the primers 5’-
GCCCTTGGTCTCTAATGGAAAGAACCGTCAGAGTTAC-3’ and
5’CGGGAAGGTCTCTGCGCTAGCAGCTTGCTCATCCACCACAC-3’ as described above to create the
construct pCOPANT.
BL21Star(DE3)pLysS E. coli cells carrying the plasmid pSJS1240 encoding for rare tRNAs
(tRNAargAGA/AGG and tRNAileAUA) were transformed with the pCOPZ and pCOPZNT, and
pCOPANT constructs. BL21(DE3)pLysS E. coli cells (Stratagene) were transformed with the
pCOPZCT plasmid and the (His)6-tagged CopZ construct was inserted into E. coli TOP10CP cells.
All cell types were grown in Luria-Bertani media at 37 °C in the presence of 100 mg/l carbanicillin
and 20 mg/l chloramphenicol. Media for cells harboring the pSJS1240 plasmid were supplemented
with 70 mg/l spectinomycin. At an OD600 of ~0.6-0.7, protein expression was induced by adding
either 100-500 µM isopropyl β-D-thiogalactopyranoside to cells containing the pPRIBA1 and pET21
vectors, 200 µg/L tetracycline to cells containing the pASK-IBA3 vector or 0.02% arabinose to cells

Characterization and Structure of a Zn2+ and [2Fe-2S]-Containing Copper Chaperone from Archaeoglobus
fulgidus | Matthew Sazinsky, et. al
DIGITALCOMMONS@WSU | 2007 6
expressing (His)6-tagged CopZ from the pBAD/TOPO vector. For cells expressing CopZ or CopZNT,
100 µM ferrous ammonium sulfate was added to the media at induction and every hour thereafter.
The cells were harvested by centrifugation at 6000 x g for 5 min 3-4 h after induction. The pellet
was washed with 25 mM Tris-HCl, pH 7.0, 100 mM KCl, frozen in liquid nitrogen and stored at –80
°C until further use. Full length CopZ was also expressed as described above in cells grown in
minimal media supplemented with 100 µM iron ammonium sulfate that contained less than 10 µM
zinc.
Streptactin-tagged CopZ, CopZ-NT, CopZ-CT, and the CopA N-MBD were purified by using a
procedure identical to the one described for the A. fulgidus CopA ATP binding domain (29) except
that 1 mM DTT was added to all of the buffers. The (His)6-tagged CopZ was purified on a Ni-NTA
column (Invitrogen, Carlsbad, CA) following the manufacturer’s instructions. The purified protein
was either exchanged into 20 mM MOPS, pH 7.0, 20 mM NaCl, 1 mM DTT, 5% glycerol by several
concentration and dilution steps using an Amicon Ultra YM-10 or YM-5 concentrator or into 25 mM
Tris-HCl, pH 8.0, 50 mM NaCl, 1 mM DTT by using a Sephadex G-25 column. The proteins was
frozen at 30 mg/ml in liquid nitrogen, and stored at –80 °C until further use. Protein concentrations
were estimated by using the Bradford assay (Sigma).
Site-Directed Mutagenesis. Site-directed mutagenesis was performed by using the Quick Change
method (Stratagene) and the pCOPZ vector. The DNA primers for 9 single Cys to Ser mutations in
the N-terminus are listed in Table 1. Mutations were verified by DNA sequencing. All CopZ mutants
were expressed and purified from BL21Star(DE3)pLysS E. coli cells containing the pSJS1240
plasmid using the procedures described above.
Table 1. Oligonucleotide Primers for SiteTable 1. Oligonucleotide Primers for SiteTable 1. Oligonucleotide Primers for SiteTable 1. Oligonucleotide Primers for Site----Directed Mutagenesis of CopZDirected Mutagenesis of CopZDirected Mutagenesis of CopZDirected Mutagenesis of CopZ Cys4Ser 5’ ATGATGCGAAGCCCAGAATGCAGCACGGAAG Cys7Ser 5’ GATGCCCAGAAAGCAGCACGGAAGGATGGAG
Cys38Ser 5’ GGATTTTTACTTCAGCTCTTTGGAGAGCTGCGAGG Cys43Ser 5’ CTGCTCTTTGGAGAGCAGCGAGGTTGTTTACTTC Cys75Ser 5’ CAAAGCCGGTTAGCTACTGCAACAGGGTTACAGAG Cys77Ser 5’ CAAAGCCGGTTTGCTACAGCAACAGGGTTACAGAG
Cys109Ser 5’ CAGGAAAAGGAAAATGGAGCGTCGTTACCAACCCATC Cys118Ser 5’ CATCCGGGAGAAGCTGCCACTGGCATCTGG Cys119Ser 5’ CATCCGGGAGATGCAGCCACTGGCATCTGG
Metal Binding Analysis. Apo forms of the proteins were loaded with Cu+ by incubation with a 10
molar excess of CuCl2 or CuSO4 in 25 mM Tris-HCl, pH 8.0, 50 mM NaCl, 1 mM DTT or 25 mM

Characterization and Structure of a Zn2+ and [2Fe-2S]-Containing Copper Chaperone from Archaeoglobus
fulgidus | Matthew Sazinsky, et. al
DIGITALCOMMONS@WSU | 2007 7
MOPS, pH 7.0, 25 mM NaCl, 5 mM DTT for 10-60 min at room temperature with gentle agitation.
The unbound copper was removed by centrifuging in a 10 kDa cutoff centricon Amicon-15 (Millipore,
MA) after diluting the sample with 15-20 volumes of buffer without DTT or desalting over a PD-10
column (BioRad).
The amount of bound copper was determined by the BCA method (30). Briefly, the proteins were
precipitated by mixing up to 55 µl of sample with 18.3 µl of 30% TCA. The pellet was separated by
centrifugation for 5 min at 9,000 x g. The supernatant (66 µl) was mixed with 5 µl of 0.07% freshly
prepared ascorbic acid and 29 µl of 2x BCA solution (0.012% BCA, 7.2% NaOH, 31.2% HEPES).
After a 5 min incubation at room temperature, the absorbance at 359 and 562 nm was measured.
CuCl2 solutions were used as standards. Concentrations of 2-10 µM Cu+ were within the linear
range.
The iron content was determined by using a ferrozine assay (31), and acid-labile sulfide was
quantified by using the method of Beinert (32). Zinc content was determined by flame atomic
absorption spectrometry (AAS) and by ICP atomic emission spectrometry. The results of three
measurements were averaged and the concentration was determined from a standard curve.
The presence of various metal ions was also investigated by using X-ray fluorescence
spectroscopy at the sector 5 beamline at the Advanced Photon Source. A small sample of 2 mM CopZ
in 25 mM Tris pH 7.5, 100 mM NaCl, 5% glycerol was frozen at 100 K on a standard protein crystal
mounting loop and exposed to X-rays tuned to the absorption edges of Fe, Co, Ni, Cu, Ni, Zn, and W.
Cu+ transfer between CopZ and the CopA N-MBD. Apo-CopA N-MBD was incubated with
streptactin beads in a column for 20 min at room temperature with gentle agitation. To separate
unbound protein, the column was washed with 10 volumes of buffer W (25 mM Tris-HCl, pH 8.0,
150 mM NaCl, 10 mM ascorbic acid). (His)6-tagged CopZ loaded with 1.8 +/- 0.1 Cu+ was added in
6.6 fold excess to the column containing bound CopA N-MBD and incubated for 10 min at room
temperature to initiate copper exchange. The proteins were then separated by washing the column
with 10 volumes of buffer W followed by elution of the CopA N-MBD with buffer W containing 2.5
mM 2-(4-hydroxyphenylazo)benzoic acid (HABA). Both the wash and elution fractions were collected
and analyzed for copper and protein content. To confirm that only the CopA N-MBD was present in
the elution fractions, each fraction was analyzed by SDS-PAGE. As a control, copper-loaded CopZ
was incubated with streptactin beads without bound CopA N-MBD was subjected to the procedure
described above and demonstrated no copper loss. Streptactin-bound apo CopA N-MBD incubated
with just buffer W did not acquire copper either.

Characterization and Structure of a Zn2+ and [2Fe-2S]-Containing Copper Chaperone from Archaeoglobus
fulgidus | Matthew Sazinsky, et. al
DIGITALCOMMONS@WSU | 2007 8
Reduction of Cu2+ by CopZ. Under anaerobic conditions, 1 mM CopZ and CopZ-NT in 25 mM
MOPS, pH 7.0, 25 mM NaCl were reduced with four-fold excess dithionite and desalted on a PD-10
column (BioRad) equilibrated with 50 mM Tris pH, 7.0, 50 mM NaCl. A ten-fold excess of BCA and a
three-fold excess of CuSO4 was then added to the eluted protein and allowed to incubate for 4 hr at
25 °C to detect the reduction of Cu2+ to Cu+ colorimetrically. As a control, 1 mM CopZ and CopZ-NT
in 25 mM MOPS, pH 7.0, 25 mM NaCl were oxidized with 10 mM K3Fe(CN)6 under aerobic
conditions, desalted, moved into the anaerobic chamber, and incubated with BCA and CuSO4 as
described above. No color change was observed.
X-ray Absorption Spectroscopy. XAS samples were prepared anaerobically and aerobically for
reduced and oxidized CopZ and CopZ-NT. Multiple independent but reproducible samples were
prepared at 2.0-5.0 mM iron concentrations in 100 mM Tris, pH 8.0, 150 mM NaCl, 30% glycerol
and transferred into Lucite sample cells wrapped with Kapton tape. Samples were immediately
frozen in liquid nitrogen. Iron XAS data for full-length CopZ were collected at Brookhaven National
Laboratory (NSLS) beamline X-9B using a Si-(111) crystal monochromator equipped with a
harmonic rejection mirror. Samples were kept at 24 K using a He Displex cryostat, and protein
fluorescence excitation spectra were collected using a 13-element Ge solid-state detector. Spectra
were collected with a iron foil control in a manner described previously (33). During data collection,
each spectrum was closely monitored for photoreduction. The data represent the average of 7-10
scans.
XAS data were analyzed using the the Macintosh OS X version of the EXAFSPAK program suite
(34) integrated with the Feff v7.2 software (35) for theoretical model generation. Processing methods
and fitting parameters used during data analysis are described in detail elsewhere (33,36). Single
scattering theoretical models were used during data simulation. Data were simulated over the
spectral k range of 1 to 12.85 Å-1, corresponding to a spectral resolution of 0.13 Å (37). When
simulating empirical data, only the absorber-scatterer bond length (R) and Debye-Waller factor (σ2)
were allowed to freely vary while metal-ligand coordination numbers were fixed at quarter-integer
values. The criteria for judging the best fit simulation and for adding ligand environments included
a reduction in the mean square deviation between data and fit (F’) (38), a value corrected for
number of degrees of freedom in the fit, bond lengths outside the data resolution, and all Debye-
Waller factors having values less than 0.006 Å2.
EPR Spectroscopy. Dithionite-reduced and as-isolated 2 mM CopZ and CopZ-NT samples in 100
mM Tris (pH 7.0 –10.0), 150 mM NaCl, 20-30% glycerol were frozen in liquid nitrogen in 3 mm i.d.

Characterization and Structure of a Zn2+ and [2Fe-2S]-Containing Copper Chaperone from Archaeoglobus
fulgidus | Matthew Sazinsky, et. al
DIGITALCOMMONS@WSU | 2007 9
quartz EPR tubes. Cryoreduction was achieved by γ-irradiation of the samples by exposure to a 60Co
source at a dose rate of 0.46 Mrad h-1 for 5-10 min. Cryogenically reduced samples were annealed in
cooled isopentane at various times and temperatures before being rapidly cooled to 77 K. X-band
EPR spectra were recorded between 2-20 K on Bruker ESP300 or EMX spectrometers equipped with
an Oxford Instrument ESR900 liquid helium cryostat.
Structure Determination of the CopZ N-terminus. CopZ-NT was crystallized in a Coy anaerobic
chamber at room temperature by using the sitting drop vapor diffusion method. Equal volumes of
protein at ~15 mg/ml in 20 mM MOPS, pH 7.0, 20 mM NaCl, 5% glycerol, 1 mM DTT were combined
with a crystallization buffer comprising 100 mM sodium acetate, pH 4.6, 200 mM ammonium
sulfate, 15-20% PEG 2000 MME. Dark red crystals grew within two days. The crystals were flash
frozen aerobically in a cryosolution consisting of 75 mM sodium acetate, pH 4.6, 100 mM ammonium
sulfate, 20% PEG 2000 MME, 20% glycerol. Native and iron anomalous data were collected at 100 K
to 2.3-1.8 Å resolution at the Advanced Photon Source on the sector 19 and 23 beamlines (Table 2).
After data collection, sections of the crystal exposed to the X-ray beam turned yellow, suggestive of
photoreduction. The crystals belonged to the space group P212121 and had unit cell dimensions of a =
56.25, b = 64.50, c = 84.15. Data sets were indexed and scaled with HKL2000 (39), and SOLVE (40)
and CNS (41) were used to locate 4 iron atoms and calculate phases by the SAD method. After
density modification, ARP/wARP was used for automatic model building (42). The remainder of the
model was built with XtalView (43) and refined with CNS. Residues 1-130 were observed in one
molecule in the asymmetric unit, and residues 2-130 were observed in the second molecule. A
Ramachandran plot calculation with PROCHECK (44) indicated that 90% of the residues have the
most favored geometry, and the rest occupy additionally allowed regions. The root mean square
difference (r.m.s.d.) for backbone atoms between the two molecules in the asymmetric unit is 0.3 Å,
and no significant structural differences are observed.

Characterization and Structure of a Zn2+ and [2Fe-2S]-Containing Copper Chaperone from Archaeoglobus
fulgidus | Matthew Sazinsky, et. al
DIGITALCOMMONS@WSU | 2007 10
Table 2. Table 2. Table 2. Table 2. Data Collection, Phasing and Refinement Statistics Data CollectionData CollectionData CollectionData Collection Iron PeakIron PeakIron PeakIron Peak NativeNativeNativeNative APS Beamline GM/CA-CAT
(Sector 23) SBC-CAT (Sector
19) Wavelength (Å) 1.74 0.979 Resolution (Å)a 40.0-2.3 50.0-1.78
Unique Observations 13,948 29,750 Total Observations 195,626 194,503 Completeness (%) 100 (100) 98.9 (93.3)
Redundancy 14.0 (14.0) 6.5 (4.6) I/ σ 19.4 (19.3) 13.0 (3.2)
Rsym b (%) 6.8 (16.8) 6.3 (45.1) Fe Sites used for phasing 4
Fig. of merit (after density modification)
0.374 (0.897)
Refinement Rwork (%)c 20.9 Rfree (%)d 23.5
Molecules in ASU 2 Number of protein-nonhydrogen
atoms 2066
Number of protein nonhydrogen atoms
157
R.m.s.d. bond length (Å) 0.0048 R.m.s.d. bond angle (°) 1.14 Average B-value (Å2) 37.7
aValues in parentheses are for the highest resolution shell (1.84-1.78 Å). bRsym = •i •
hkl
|Ii(hkl)-<I(hkl)>|/ •
hkl <I(hkl)>, where I
i(hkl) is the ith measured diffraction intensity
and <I(hkl)> is the mean of the intensity for the Miller index (hkl). cRwork = •hkl
||F
o(hkl)| - |F
c(hkl)|| / •
hkl |F
o(hkl)|. dRfree = Rwork for a test set of reflections (5%).
Results and Discussion

Characterization and Structure of a Zn2+ and [2Fe-2S]-Containing Copper Chaperone from Archaeoglobus
fulgidus | Matthew Sazinsky, et. al
DIGITALCOMMONS@WSU | 2007 11
Metal Content of CopZ. Purified CopZ and CopZ-NT are 23 kDa and 14 kDa monomers,
respectively, that have a distinct red color whereas the 9 kDa CopZ-CT is colorless. The optical
spectra of the full length protein and CopZ-NT are identical with three absorption peaks at 340, 430,
480 nm and a shoulder at 550 nm (Fig. 2A). The spectra are most similar to those observed for [2Fe-
2S]-containing proteins (45). Features attributable to either a mononuclear iron center or a [4Fe-4S]
cluster are not present. Upon reduction with dithionite, these spectral features disappear. Since the
spectra of CopZ and CopZ-NT are identical, it is likely that the C-terminus is not involved in
assembly of the CopZ-NT metal centers. Consistent with a [2Fe-2S] cluster, both CopZ and CopZ-NT
bound 1.7 ± 0.3 iron ions per protein molecule. Full length CopZ contained ~0.6 equivalents of zinc,
and the isolated CopZ, CopZ-NT, and CopZ-CT did not contain copper. Only zinc and iron were
detected by X-ray fluorescence spectroscopy.
Copper Binding, Transfer, and Reduction. After incubation with excess CuSO4 and DTT and buffer
exchange, CopZ, CopZ-NT, and CopZ-CT were determined to bind 2.1 ± 0.3, 1.4 ± 0.3, and 1.0 ± 0.4
Cu+ ions/protein, respectively. Thus, each domain binds a single Cu+ ion. Like all of the other Atx1-
like proteins, CopZ-CT likely binds Cu+ via the conserved cysteines in the CXXC motif (vide infra).
The presence of a Cu+ ion bound to CopZ-NT is unexpected.
Copper transfer from (His)6-tagged CopZ to the CopA N-MBD was demonstrated by
incubating Cu+-loaded chaperone with streptactin resin containing bound apo CopA N-MBD,
separating the individual proteins, and analyzing the copper content (Fig. 3). The CopA N-MBD was
selected for these experiments because mutagenesis data indicate that the N-MBD, but not the C-
MBD, is important for CopA activity (46). (His)6-tagged CopZ bound 2.0 ± 0.1 copper ions per
protein, similar to the value obtained for streptactin-tagged CopZ. Thus, the (His)6-tag likely does
not interfere with Cu+ binding. When eluted from the column, 34.5% of the CopA N-MBD was
loaded with copper. In control experiments, copper-loaded CopZ incubated with streptactin beads
and treated as above did not release copper and retained its full complement. Likewise, streptactin-
bound apo CopA N-MBD did not acquire copper after washing and elution steps in the absence of
CopZ. Because there is no apparent copper loss or gain in the control experiments, CopZ is therefore
capable of delivering Cu+ to the CopA N-MBD, similar to what has been reported for yeast and
human Atx1-like chaperones and their cognate Cu+-ATPases (24,25,47). However, when comparing
Cu+ transfer in these various systems, the 80-100 ºC optimal growth conditions of A. fulgidus should
be considered. Thus, a temperature dependence of Kex might explain the reduced Cu+ transfer

Characterization and Structure of a Zn
fulgidus | Matthew Sazinsky, et. al
DIGITALCOMMONS@WSU | 200712
(34.5%) observed in A. fulgidus compared to eukaryotic systems (60
Guerrero and Argüello, unpublished results).
Fig. 2 UV-Vis absorption spectra of CopZ, CopZ
(black), dithionite reduced wild-type (blue), and CopZ
(blue), Cys109Ser (purple), Cys118Ser (black), and Cys119Ser (green) variants. All spectra were recorded on
60-80 µM protein in 25 mM MOPS, pH 7.0, 25 mM NaCl at room temperature on a Hewlett Packard 8452A
diode array spectrophotometer. Anaerobic measurements were obtained by using a custom designed Thünberg
Characterization and Structure of a Zn2+ and [2Fe-2S]-Containing Copper Chaperone from
DIGITALCOMMONS@WSU | 2007
compared to eukaryotic systems (60-90%) (24,25,47)
Guerrero and Argüello, unpublished results).
Vis absorption spectra of CopZ, CopZ-NT, and Cys-to-Ser mutants. (A) Spectra of wild
type (blue), and CopZ-NT (red). (B) Spectra of Cys75Ser (red), Cys77Ser
(blue), Cys109Ser (purple), Cys118Ser (black), and Cys119Ser (green) variants. All spectra were recorded on
M protein in 25 mM MOPS, pH 7.0, 25 mM NaCl at room temperature on a Hewlett Packard 8452A
ode array spectrophotometer. Anaerobic measurements were obtained by using a custom designed Thünberg
cuvettte.
Containing Copper Chaperone from Archaeoglobus
(24,25,47) (González-
) Spectra of wild-type
) Spectra of Cys75Ser (red), Cys77Ser
(blue), Cys109Ser (purple), Cys118Ser (black), and Cys119Ser (green) variants. All spectra were recorded on
M protein in 25 mM MOPS, pH 7.0, 25 mM NaCl at room temperature on a Hewlett Packard 8452A
ode array spectrophotometer. Anaerobic measurements were obtained by using a custom designed Thünberg

Characterization and Structure of a Zn
fulgidus | Matthew Sazinsky, et. al
DIGITALCOMMONS@WSU | 200713
Fig. 3 Copper transfer from CopZ to the CopA N
(W) and elution (E) fractions are shown. Peaks corresponding to specific proteins eluted from the streptatcin
column are identified on the Figure. At the end of the experiment, 34.5% of the CopA N
To test whether CopZ and CopZ
protein were incubated with CuSO4
Cu+-BCA complex was only observed when reduced CopZ and CopZ
CuSO4/BCA solution (data not shown). Thus, th
cluster is favorable and consistent with known redox potentials for Cu
2S]2+/[2Fe-2S]+ (200-500 mV) (48). A protein environment, however, can significantly affect the
potential of bound copper ions (49)
source of Cu2+.
X-ray Absorption Spectroscopy. A comparison of the Fe XANES spectra of CopZ in the presence and
absence of dithionite is consistent with partial reduction of the [2Fe
features for the two protein samples d
reduced and 7117.5 eV for oxidized) as well as a diminished shoulder feature for the oxidized sample
at ~7125 eV (Fig. 4A). Features for the 1s
for the reduced sample and 7112.6 eV for the oxidized sample. Concurrent with a subtle shift in the
1s�3d pre-edge maximal signal energy is an increase in area for this signal from 22.1 to 27.3
Characterization and Structure of a Zn2+ and [2Fe-2S]-Containing Copper Chaperone from
DIGITALCOMMONS@WSU | 2007
Fig. 3 Copper transfer from CopZ to the CopA N-MBD. The copper (�) and protein (•) content of the wash
are shown. Peaks corresponding to specific proteins eluted from the streptatcin
At the end of the experiment, 34.5% of the CopA N-
copper.
To test whether CopZ and CopZ-NT can reduce Cu2+ to Cu+, chemically oxidized and reduced
4 and bicinchoninic acid (BCA), a Cu+ specific chelator. A magenta
BCA complex was only observed when reduced CopZ and CopZ-NT were added to the
/BCA solution (data not shown). Thus, the in vitro reduction of Cu2+ by the CopZ [2Fe
cluster is favorable and consistent with known redox potentials for Cu2+/Cu+
. A protein environment, however, can significantly affect the
(49), so whether CopZ reduces Cu2+ in vivo would depend
A comparison of the Fe XANES spectra of CopZ in the presence and
absence of dithionite is consistent with partial reduction of the [2Fe-2S] cluster. General edge
features for the two protein samples differ in their edge first inflection energies (7117.0 eV for
reduced and 7117.5 eV for oxidized) as well as a diminished shoulder feature for the oxidized sample
at ~7125 eV (Fig. 4A). Features for the 1s�3d pre-edge signal occur at maximal values of 7112.2 eV
for the reduced sample and 7112.6 eV for the oxidized sample. Concurrent with a subtle shift in the
edge maximal signal energy is an increase in area for this signal from 22.1 to 27.3
Containing Copper Chaperone from Archaeoglobus
) and protein (•) content of the wash
are shown. Peaks corresponding to specific proteins eluted from the streptatcin
-MBD was loaded with
emically oxidized and reduced
specific chelator. A magenta
NT were added to the
by the CopZ [2Fe-2S]
(154 mV) and [2Fe-
. A protein environment, however, can significantly affect the
would depend on the
A comparison of the Fe XANES spectra of CopZ in the presence and
2S] cluster. General edge
iffer in their edge first inflection energies (7117.0 eV for
reduced and 7117.5 eV for oxidized) as well as a diminished shoulder feature for the oxidized sample
edge signal occur at maximal values of 7112.2 eV
for the reduced sample and 7112.6 eV for the oxidized sample. Concurrent with a subtle shift in the
edge maximal signal energy is an increase in area for this signal from 22.1 to 27.3

Characterization and Structure of a Zn
fulgidus | Matthew Sazinsky, et. al
DIGITALCOMMONS@WSU | 200714
(unitless values), consistent with four
compounds (50).
Analysis of the EXAFS data for reduced and oxidized CopZ indicates a unique
coordination geometry for both samples with trends matching those expected for Fe
centers in slightly different redox states. The EXAFS of both samples show a node in the scattering
oscillations at a k value of 7.5 Å
environments (Fig.s 4B and 4D). Fourier transforms of the EXAFS data for both samples show two
ligand scattering environments at phase shifted bond lengths of ~1.8
minimal long range (> 3.0 Å) scattering (Fig.s 4C and 4E). Simulations of the iron EXAFS indicate
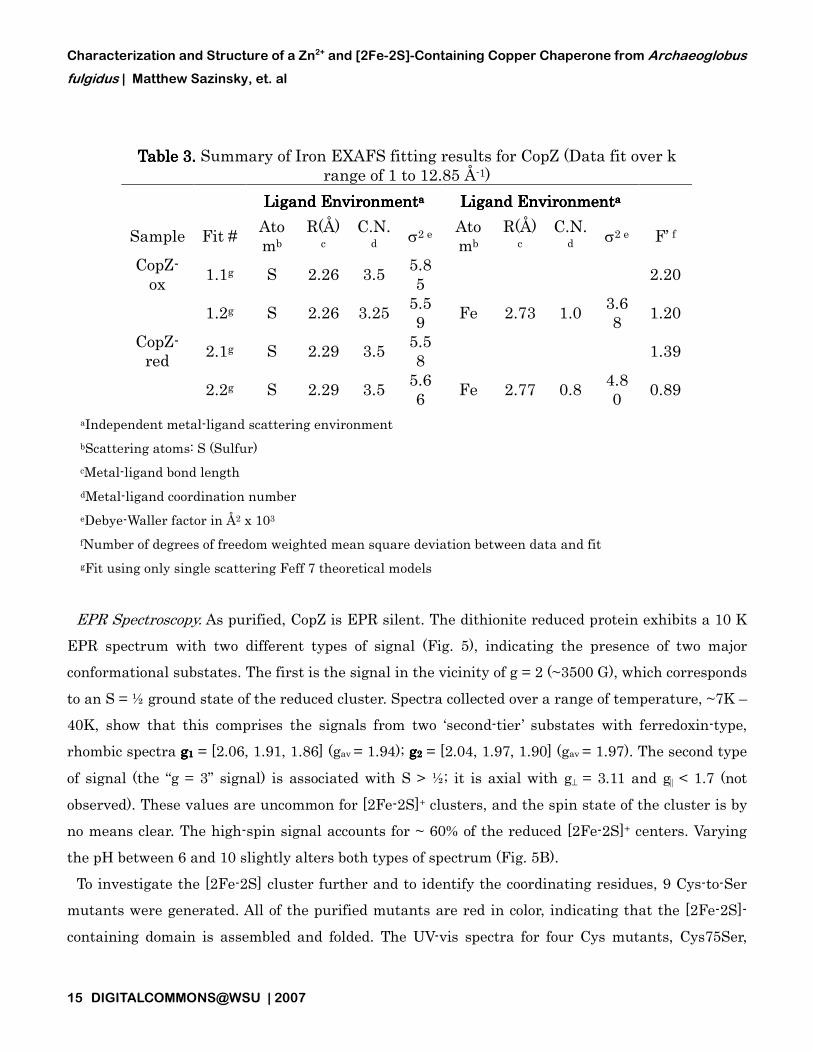
two distinct ligand scattering interactions are present in both samples (Table 3). For the oxidized
sample, the data are best fit with ca. 4 Fe
2.73 Å. For the reduced sample, the data are best fit with ca. 4 Fe
distance of 2.29 Å and a single Fe-
justification for fitting the long range (> 3.0 Å) scattering in either data set.
Fig. 4 Iron XAS spectra of CopZ. Normalized XANES spectra for oxidized (solid line) and reduced (dotted
line) CopZ samples (panel A). The inset shows the expansion of the background subtracted pre
for the two samples. The EXAFS and Fourier transforms (FT) of the CopZ iron
superimposed in gray for oxidized (panels
Characterization and Structure of a Zn2+ and [2Fe-2S]-Containing Copper Chaperone from
DIGITALCOMMONS@WSU | 2007
ess values), consistent with four-coordinate ferrous and ferric iron values obtained from model
Analysis of the EXAFS data for reduced and oxidized CopZ indicates a unique
coordination geometry for both samples with trends matching those expected for Fe
centers in slightly different redox states. The EXAFS of both samples show a node in the scattering
value of 7.5 Å-1, consistent with destructively interacting distinct ligand
environments (Fig.s 4B and 4D). Fourier transforms of the EXAFS data for both samples show two
ligand scattering environments at phase shifted bond lengths of ~1.8 Å and 2.4
3.0 Å) scattering (Fig.s 4C and 4E). Simulations of the iron EXAFS indicate
two distinct ligand scattering interactions are present in both samples (Table 3). For the oxidized
sample, the data are best fit with ca. 4 Fe-S interactions at 2.26 Å and a single Fe
2.73 Å. For the reduced sample, the data are best fit with ca. 4 Fe-S interactions at an extended
-Fe interaction at an extended distance of 2.77 Å. There was no
nge (> 3.0 Å) scattering in either data set.
Fig. 4 Iron XAS spectra of CopZ. Normalized XANES spectra for oxidized (solid line) and reduced (dotted
). The inset shows the expansion of the background subtracted pre
for the two samples. The EXAFS and Fourier transforms (FT) of the CopZ iron-sulfur cluster with best fits
superimposed in gray for oxidized (panels A and B) and reduced (panels C and D) CopZ samples.
Containing Copper Chaperone from Archaeoglobus
coordinate ferrous and ferric iron values obtained from model
Analysis of the EXAFS data for reduced and oxidized CopZ indicates a unique metal-ligand
coordination geometry for both samples with trends matching those expected for Fe-S cluster
centers in slightly different redox states. The EXAFS of both samples show a node in the scattering
ith destructively interacting distinct ligand
environments (Fig.s 4B and 4D). Fourier transforms of the EXAFS data for both samples show two
and 2.4 Å, as well as
3.0 Å) scattering (Fig.s 4C and 4E). Simulations of the iron EXAFS indicate
two distinct ligand scattering interactions are present in both samples (Table 3). For the oxidized
e Fe-Fe interaction at
S interactions at an extended
Fe interaction at an extended distance of 2.77 Å. There was no
Fig. 4 Iron XAS spectra of CopZ. Normalized XANES spectra for oxidized (solid line) and reduced (dotted
). The inset shows the expansion of the background subtracted pre-edge feature
sulfur cluster with best fits
) CopZ samples.
Characterization and Structure of a Zn2+ and [2Fe-2S]-Containing Copper Chaperone from Archaeoglobus
fulgidus | Matthew Sazinsky, et. al
DIGITALCOMMONS@WSU | 2007 15
aIndependent metal-ligand scattering environment
bScattering atoms: S (Sulfur)
cMetal-ligand bond length
dMetal-ligand coordination number
eDebye-Waller factor in Å2 x 10³
fNumber of degrees of freedom weighted mean square deviation between data and fit
gFit using only single scattering Feff 7 theoretical models
EPR Spectroscopy. As purified, CopZ is EPR silent. The dithionite reduced protein exhibits a 10 K
EPR spectrum with two different types of signal (Fig. 5), indicating the presence of two major
conformational substates. The first is the signal in the vicinity of g = 2 (~3500 G), which corresponds
to an S = ½ ground state of the reduced cluster. Spectra collected over a range of temperature, ~7K –
40K, show that this comprises the signals from two ‘second-tier’ substates with ferredoxin-type,
rhombic spectra gggg1111 = [2.06, 1.91, 1.86] (gav = 1.94); gggg2222 = [2.04, 1.97, 1.90] (gav = 1.97). The second type
of signal (the “g = 3” signal) is associated with S > ½; it is axial with g⊥ = 3.11 and g|| < 1.7 (not
observed). These values are uncommon for [2Fe-2S]+ clusters, and the spin state of the cluster is by
no means clear. The high-spin signal accounts for ~ 60% of the reduced [2Fe-2S]+ centers. Varying
the pH between 6 and 10 slightly alters both types of spectrum (Fig. 5B).
To investigate the [2Fe-2S] cluster further and to identify the coordinating residues, 9 Cys-to-Ser
mutants were generated. All of the purified mutants are red in color, indicating that the [2Fe-2S]-
containing domain is assembled and folded. The UV-vis spectra for four Cys mutants, Cys75Ser,
Table 3. Table 3. Table 3. Table 3. Summary of Iron EXAFS fitting results for CopZ (Data fit over k range of 1 to 12.85 Å-1)
Ligand EnvironmentLigand EnvironmentLigand EnvironmentLigand Environmentaaaa Ligand EnvironmentLigand EnvironmentLigand EnvironmentLigand Environmentaaaa
Sample Fit # Atomb
R(Å)c
C.N.d σ2 e Ato
mb R(Å)
c C.N.
d σ2 e F’ f
CopZ-ox
1.1g S 2.26 3.5 5.85
2.20
1.2g S 2.26 3.25 5.59
Fe 2.73 1.0 3.68
1.20
CopZ-red
2.1g S 2.29 3.5 5.58
1.39
2.2g S 2.29 3.5 5.66
Fe 2.77 0.8 4.80
0.89

Characterization and Structure of a Zn2+ and [2Fe-2S]-Containing Copper Chaperone from Archaeoglobus
fulgidus | Matthew Sazinsky, et. al
DIGITALCOMMONS@WSU | 2007 16
Cys77Ser, Cys109Ser, and Cys119Ser, are different from the wild type spectra whereas Cys to Ser
mutations at positions 4, 7, 38, 43 and 118 exhibited UV-Vis spectra identical to the native protein
(Fig. 2B). The Cys75Ser, Cys109Ser and Cys119Ser mutations lead to the complete disappearance of
the “g = 3” signal (Fig.s 5D-5F). The Cys75Ser and Cys109Ser mutants also collapse the overlapping
S = ½ signals into a single axial ferredoxin-like signal with gav < 2, whereas the Cys119Ser mutation
leaves the S = ½ region of the spectrum as an overlap of two signals (Fig.s 5D-5F). The Cys77Ser
mutant exhibits both types of the signal, but both types are slightly altered (Fig. 5C).
It was demonstrated previously that γ-irradiation at 77 K of diamagnetic diiron(III) centers of
frozen protein solutions generates a one-electron reduced product trapped in the conformation of the
oxidized precursor (51). The species trapped at 77 K relaxes to an equilibrium state during
annealing at elevated temperatures (T > 160 K). Such cryo-reduced proteins provide a sensitive EPR
probe of the EPR-silent deferric precursors. The EPR spectrum of cryoreduced CopZ (Fig. 5G) shows
well-resolved features from the high-spin conformer, at g= 3.0 and 1.9, which differ from those of the
equilibrium conformation. The strong g = 2 signal from radiolytically generated radicals partially
obscures the region of the signals of the S = ½ conformers. However, comparison with the spectrum
of the chemically reduced protein shows that there are features in the cryoreduction spectrun that
would be observable if the S = ½ signals were present, and they are not. Thus, the “g = 3” species is
the major product of cryo-reduction, suggesting that the diferric cluster exists as only one major
substate. The EPR spectrum of the cryoreduced sample annealed at 240 K (not shown) becomes
identical to that of the chemically reduced protein (Fig. 5A), showing that the “g = 3” conformational
substate can convert to the S = ½ substate.

Characterization and Structure of a Zn
fulgidus | Matthew Sazinsky, et. al
DIGITALCOMMONS@WSU | 200717
Fig. 5 EPR spectra of CopZ. (A) Chemically reduced CopZ, pH 7.0, (
Cys77Ser variant, (D) Cys75Ser variant, (
cryoreduction (CR) of diferric CopZ. Sharp feature at ~1500G in some spectra is non
feature at ~1500G in some spectra is non
Fig. 6 Crystal structure of CopZ-NT. (
terminal domain is shown in blue. The zinc ion is shown as a purple sphere and the [2Fe
as yellow and orange spheres. (B) The [2Fe2S] cluster. Atoms are repres
gray, sulfur in yellow and iron in orange. Acetate and water are bound in a small cavity (magenta) directly
below the [2Fe-2S] cluster. Residues contributing to the surface of the cavity are shown as ball
representations. (C) The mononuclear metal center. The zinc ion is shown as a purple sphere. (
Characterization and Structure of a Zn2+ and [2Fe-2S]-Containing Copper Chaperone from
DIGITALCOMMONS@WSU | 2007
) Chemically reduced CopZ, pH 7.0, (B) Chemically reduced CopZ, pH 10, (
) Cys75Ser variant, (E) Cys109Ser variant, (F) Cys119Ser variant, (
diferric CopZ. Sharp feature at ~1500G in some spectra is non-heme Fe(III). The sharp
feature at ~1500G in some spectra is non-heme Fe(III). Conditions: T = 10K; frequency, 9.372 GHz; power, 1
mW; modulation amplitude, 5 G.
NT. (A) The N-terminal domain of CopZ-NT is shown in green and the C
terminal domain is shown in blue. The zinc ion is shown as a purple sphere and the [2Fe
) The [2Fe2S] cluster. Atoms are represented as ball and sticks with carbon in
gray, sulfur in yellow and iron in orange. Acetate and water are bound in a small cavity (magenta) directly
2S] cluster. Residues contributing to the surface of the cavity are shown as ball
) The mononuclear metal center. The zinc ion is shown as a purple sphere. (
Containing Copper Chaperone from Archaeoglobus
) Chemically reduced CopZ, pH 10, (C)
) Cys119Ser variant, (G) After 77K
heme Fe(III). The sharp
heme Fe(III). Conditions: T = 10K; frequency, 9.372 GHz; power, 1
NT is shown in green and the C-
terminal domain is shown in blue. The zinc ion is shown as a purple sphere and the [2Fe-2S] cluster is shown
ented as ball and sticks with carbon in
gray, sulfur in yellow and iron in orange. Acetate and water are bound in a small cavity (magenta) directly
2S] cluster. Residues contributing to the surface of the cavity are shown as ball-and-stick
) The mononuclear metal center. The zinc ion is shown as a purple sphere. (D) Electrostatic

Characterization and Structure of a Zn2+ and [2Fe-2S]-Containing Copper Chaperone from Archaeoglobus
fulgidus | Matthew Sazinsky, et. al
DIGITALCOMMONS@WSU | 2007 18
surface maps of the CopZ-NT and (E) and (F) a homology model of CopZ-CT. The homology model was
generated from the PDB file 1OSD by using the CPHmodels server (63). Red surfaces represent regions of
negative charge and blue surfaces are positively charged.
Structure of CopZ-NT. CopZ-NT is composed of two subdomains, an N-terminal domain containing
a mononuclear metal center and a C-terminal domain containing the [2Fe-2S] cluster (Fig. 6A). This
distinct domain arrangement is consistent with the observation that the Wolinella,
Thermoanaerobacter, and Chlorobium CopZ-NT sequences lack an N-terminal domain (Fig. 1B).
Interestingly, other homologs have an additional N-terminal cysteine rich region that is not present
in A. fulgidus CopZ (Fig. 1B). The folds of the two CopZ-NT subdomains are unique with no
similarity to previously determined structures in the PDB according to DALI searches (52).
The N-terminal domain of CopZ-NT has a βααβββα fold. The metal ion is coordinated in a
tetrahedral arrangement by Cys 4 and Cys 7 on the N-terminal loop before β1 and Cys 38 and Cys
43 on the loop connecting β2 and β3 (Fig. 6B). Of these cysteines, Cys 4, Cys 38, and Cys 43 are
conserved among all of the known proteins that have homology to the N-terminus. The
Thiomicrospira, Deinococcus, and Thermosynechococcus proteins contain Asn, Ser, and Asp
residues, respectively, at position 7 instead of a cysteine (Fig. 1B). The average metal-sulfur
distance over both molecules in the asymmetric unit is 2.35 Å. Anomalous difference maps
calculated using data collected at the Fe absorption edge yield a small peak at the position of the
metal ion (Table 4). This peak is 6-fold less intense than those used to identify the [2Fe-2S] cluster
at this wavelength, suggesting that only a trace amount of iron occupies this position. For data
collected at the Se absorption edge, the metal ion at this position gives rise to a slightly stronger
anomalous signal than the iron atoms in [2Fe-2S] cluster. Based on these anomalous differences, the
coordination geometry, and the presence of zinc in the purified protein, it is likely that Zn2+
primarily occupies this site and that it assumes a structural role in the protein. It is possible that
protein purified directly from A. fulgidus would contain iron at this position, however. If this were
the case, the iron coordination environment would be most similar to that found in rubredoxins (48)
and would be consistent with a redox function for this domain. Besides the cysteine ligands, Val 14
from β2 and Thr 18 from α2 are the only other conserved residues in this domain and may be
important for mediating contacts with the [2Fe-2S] domain.

Characterization and Structure of a Zn2+ and [2Fe-2S]-Containing Copper Chaperone from Archaeoglobus
fulgidus | Matthew Sazinsky, et. al
DIGITALCOMMONS@WSU | 2007 19
Table 4.Table 4.Table 4.Table 4. Anomalous peak heights at the Fe and Se Absorption Edges Atom Fe-edge
(7177 eV) Se-edge
(13660 eV) Molecule 1
Fe1 26.5 10.4 Fe2 25.3 9.3
Zn/Fe 3.9 13.8 Molecule 2
Fe1 26.5 11.4 Fe2 24.1 8.7
Zn/Fe 3.9 14.5
The [2Fe-2S] domain is all α-helical and differs significantly from typical [2Fe-2S] ferredoxins,
which usually have a βαββαβ fold (53). The [2Fe-2S] center is coordinated by Cys 75, Cys 77, Cys
109, and Cys 119, which are found on loops between the α-helices (Fig. 6C) and are highly conserved
(Fig. 1B). The average Fe-Fe distance of 2.8 Å is nearly identical to the 2.77 Å Fe-Fe distance
determined by XAS for reduced CopZ. The average Fe-S(Cys) and Fe-S2- distances are 2.35 Å and
2.30 Å, respectively, and the overall geometry of the iron-sulfur cluster is similar to that observed in
high resolution crystal structures of [2Fe-2S]-containing proteins (54). The unusual EPR spectrum
of CopZ is not readily explained by the structure. All the conserved residues in this domain that do
not coordinate the [2Fe-2S] cluster are located nearby. These include Tyr 76, Asn 113, Pro 114, and
Cys 118. The side chains of Tyr 76 and Asn 113 point away from the [2Fe-2S] cluster towards a
polar, 61 Å3 cavity that contains ordered solvent and an acetate molecule derived from the
crystallization solution (Fig. 5C). The [2Fe-2S] cluster forms the roof of this cavity. Such cavities are
also observed in other [2Fe-2S] proteins such as Trichomonas vaginalis ferredoxin (55). The
remaining conserved residue, Cys 118, lies on the protein surface 4 Å from [2Fe-2S] center and
hydrogen bonds to a non-conserved histidine, His 120. The Cys118Ser mutant, however, binds as
much copper as native CopZ, suggesting Cys 118 and His 120 do not constitute the additional copper
binding site.
Functional Implications. CopZ from A. fulgidus is the first known fusion of a redox active [2Fe-2S]-
containing domain to an Atx1-like CXXC-containing domain that delivers Cu+ ions. The combination
of these two modular units differentiates CopZ from all other members of the Atx1-like copper
chaperone family. CopZ binds Cu+ and can transfer it to the N-MBD of its putative partner Cu+-
ATPase CopA, and likely has the same fold as and a similar function to other Atx1-like proteins. By

Characterization and Structure of a Zn2+ and [2Fe-2S]-Containing Copper Chaperone from Archaeoglobus
fulgidus | Matthew Sazinsky, et. al
DIGITALCOMMONS@WSU | 2007 20
contrast, CopZ-NT has a novel fold and represents a new class of [2Fe-2S] protein that appears to be
found only in extremophilic organisms. This domain is further partitioned into smaller units, each
housing a metallo-cofactor. The exact role of CopZ-NT is unknown, but the presence of a [2Fe-2S]
center strongly suggests that a redox function is involved.
One possibility is that the [2Fe-2S] cluster reduces Cu2+ to Cu+. The Cu+ might then bind to the
CopZ-CT CXXC sequence for subsequent shuttling to the CopA N-MBD or the CopA transmembrane
copper binding site for efflux. In support of this model, CopZ can reduce Cu2+ to Cu+, and CopZ-NT
binds one copper ion. It is conceivable that Cu2+ binds transiently to a site near the [2Fe-2S] cluster
(Fig. 5C), is reduced, and then transferred to the CopZ-CT. At present we are trying to identify the
location of the Cu+ binding site in the CopZ-NT and assess its possible role in metal transfer to the
CopA MBDs.
Electrostatic surface calculations using PyMOL (56) reveal extended positively and negatively
charged patches on the face of CopZ-NT containing [2Fe-2S] cluster (Fig. 6D). Homology modeling
and electrostatic surface calculations for CopZ-CT (Figs. 5E and 5F) suggest that this domain has a
negatively charged surface. These complementary surfaces could allow docking with the metal
binding sites in close proximity and subsequent metal transfer between domains.
Several organisms, including A. fulgidus and Enterococcus hirae, express a Cu2+-ATPase, called
CopB, that utilizes histidine-rich cytosolic metal binding domains to facilitate Cu2+ removal
(8,57,58). In E. hirae, CopB is co-transcribed with CopA in response to copper stress (59). As an
additional or alternative route for Cu2+ removal, A. fulgidus CopZ could reduce Cu2+ to Cu+, allowing
CopB and CopA to function simultaneously. Given that A. fulgidus is an anaerobic, sulfur-
metabolizing hyperthermophile (60,61), is reasonable that its copper trafficking system differs from
those in other organisms. Prior to the advent of an oxidizing atmosphere, copper was not an
essential element (62), and the earliest copper ATPases probably only functioned in detoxification.
Further characterization of A. fulgidus CopZ and its interactions with CopA may provide new
insight into the evolution of copper homeostatic pathways.
Acknowledgements
We thank M. González-Guerrero for his generous help with the Cu+ transfer experiments.. Use of
the Advanced Photon Source was supported by the United States Department of Energy, Office of
Science, Office of Basic Energy Sciences under Contract No. DE-AC02-06CH11357.

Characterization and Structure of a Zn2+ and [2Fe-2S]-Containing Copper Chaperone from Archaeoglobus
fulgidus | Matthew Sazinsky, et. al
DIGITALCOMMONS@WSU | 2007 21
Footnotes
*This work was supported by NIH grant GM58518 (A. C. R), NSF grant MCM-0235165 (J. M. A.),
NIH grant HL13531 (B. M. H.), and NIH grant DK068139 (T. L. S.). M. H. S. was supported by
NRSA Fellowship GM073457.
The atomic coordinates (code 2HU9) have been deposited in the Protein Data Bank, Research
Collaboratory for Structural Bioinformatics, Rutgers University, New Brunswick, NJ
(http://www.rcsb.org/)
1Abbreviations: A-domain, actuator domain; ATPBD, ATP binding domain; BCA, bicinchoninic acid;
C-MBD, C-terminal CopA metal binding domain; CopZ-CT, CopZ C-terminus; CopZ-NT, CopZ N-
terminus; HABA, 2-(4-hydroxyphenylazo)benzoic acid; MNK, Menkes syndrome protein; N-MBD, N-
terminal CopA metal binding domain; r.m.s.d., root mean square deviation; SERCA1, sarcoplasmic
reticulum Ca2+-ATPase; WND, Wilson disease protein.
References
1. Rosenzweig, A. C. (2001) Acc. Chem. Res. 34343434, 119-128
2. Huffman, D. L., and O'Halloran, T. V. (2001) Annu. Rev. Biochem. 70707070, 677-701
3. Llanos, R. M., and Mercer, J. F. B. (2002) DNA Cell Biol. 21212121, 259-270
4. Sarkar, B. (1999) Chem. Rev. 99999999, 2535-2544
5. Bull, P. C., and Cox, D. W. (1994) Trends Genet. 10101010, 246-252
6. Cox, D. W., and Moore, S. D. (2002) J. Bioenerg. Biomembr. 34343434, 333-338
7. Hsi, G., and Cox, D. W. (2004) Human Genet. 114114114114, 165-172
8. Argüello, J. M. (2003) J. Membr. Biochem. 195195195195, 93-108
9. Axelsen, K. B., and Palmgren, M. G. (1998) J. Mol. Evol. 46464646, 84-101
10. Lutsenko, S., and Kaplan, J. H. (1995) Biochemistry 34343434, 15607-15613
11. Achila, D., Banci, L., Bertini, I., Bunce, J., Ciofi-Baffoni, S., and Huffman, D. L. (2006) Proc. Natl. Acad.
Sci. USA 103103103103, 5729-5734
12. Banci, L., Bertini, I., Ciofi-Baffoni, S., Gonnelli, L., and Su, X. C. (2003) J. Biol. Chem. 278278278278, 50506-
50513
13. Banci, L., Bertini, I., Ciofi-Baffoni, S., Huffman, D. L., and O'Halloran, T. V. (2001) J. Biol. Chem. 276276276276,
8415-8426
14. Gitschier, J., Moffat, B., Reilly, D., Wood, W. I., and Fairbrother, W. J. (1998) Nature Struct. Biol. 5555, 47-
54

Characterization and Structure of a Zn2+ and [2Fe-2S]-Containing Copper Chaperone from Archaeoglobus
fulgidus | Matthew Sazinsky, et. al
DIGITALCOMMONS@WSU | 2007 22
15. Arnesano, F., Banci, L., Bertini, I., Huffman, D. L., and O'Halloran, T. V. (2001) Biochemistry 40404040, 1528-
1539
16. Banci, L., Bertini, I., Conte, R. D., Markey, J., and Ruiz-Dueñas, F. J. (2001) Biochemistry 40404040, 15660-
15668
17. Rosenzweig, A. C., Huffman, D. L., Hou, M. Y., Wernimont, A. K., Pufahl, R. A., and O'Halloran, T. V.
(1999) Structure 7777, 605-617
18. Wernimont, A. K., Huffman, D. L., Lamb, A. L., O'Halloran, T. V., and Rosenzweig, A. C. (2000) Nature
Struct. Biol. 7777, 766-771
19. Wimmer, R., Herrmann, T., Solioz, M., and Wüthrich, K. (1999) J. Biol. Chem. 274274274274, 22597-22603
20. Cobine, P. A., George, G. N., Winzor, D. J., Harrison, M. D., Mogahaddas, S., and Dameron, C. T. (2000)
Biochem. 39393939, 6857-6863
21. DiDonato, M., Hsu, H.-F., Narindrasorasak, S., Que, L., Jr., and Sarkar, B. (2000) Biochem. 39393939, 1890-
1896
22. Forbes, J. R., Hsi, G., and Cox, D. W. (1999) J. Biol. Chem. 274274274274, 12408-12413
23. Hamza, I., Schaefer, M., Klomp, L. W. J., and Gitlin, J. D. (1999) Proc. Natl. Acad. Sci. USA 96969696, 13363-
13368
24. Huffman, D. L., and O'Halloran, T. V. (2000) J. Biol. Chem. 275275275275, 18611-18614
25. Walker, J. M., Tsivkovskii, R., and Lutsenko, S. (2002) J. Biol. Chem. 277277277277, 27953-27959
26. Wernimont, A. K., Yatsunyk, L. A., and Rosenzweig, A. C. (2004) J. Biol. Chem. 279279279279, 12269-12276
27. Mandal, A. K., Cheung, W. D., and Argüello, J. M. (2002) J. Biol. Chem. 277277277277, 7201-7208
28. Sazinsky, M. H., Agarwal, S., Argüello, J. M., and Rosenzweig, A. C. (2006) Biochemistry 45454545, 9949-9955
29. Sazinsky, M. H., Mandal, A. K., Argüello, J. M., and Rosenzweig, A. C. (2006) J. Biol. Chem. 281281281281, 11161-
11166
30. Brenner, A. J., and Harris, E. D. (1995) Anal. Biochem. 226226226226, 80-84
31. Stookey, L. L. (1970) Anal. Chem. 42424242, 779-781
32. Beinert, H. (1983) Anal. Biochem. 131131131131, 373-378
33. Cook, J. D., Bencze, K. Z., Jankovic, A. D., Crater, A. K., Busch, C. N., Bradley, P. B., Stemmler, A. J.,
Spaller, M. R., and Stemmler, T. L. (2006) Biochemistry 45454545(25), 7767-7777
34. George, G. N., George, S. J., and Pickering, I. J. (2001) EXAFSPAK. In., http://www-
ssrl.slac.stanford.edu/~george/exafspak/exafs.htm
35. Ankudinov, A. L., and Rehr, J. J. (1997) Phys. Rev. B 56565656, R1712-R1715
36. Lieberman, R. L., Kondapalli, K. C., Shrestha, D. B., Hakemian, A. S., Smith, S. M., Telser, J., Kuzelka,
J., Gupta, R., Borovik, A. S., Lippard, S. J., Hoffman, B. M., Rosenzweig, A. C., and Stemmler, T. L.
(2006) Inorg. Chem. 45454545, 8372-8381
37. Lee, P. A., Citrin, P. H., Eisenberger, P., and Kincaid, B. M. (1981) Rev. Mod. Phys. 53535353(4), 769-806

Characterization and Structure of a Zn2+ and [2Fe-2S]-Containing Copper Chaperone from Archaeoglobus
fulgidus | Matthew Sazinsky, et. al
DIGITALCOMMONS@WSU | 2007 23
38. Riggs-Gelasco, P. J., Stemmler, T. L., and Penner-Hahn, J. E. (1995) Coord. Chem. Rev. 144144144144, 245-286
39. Otwinowski, Z., and Minor, W. (1997) Methods Enzymol. 276276276276, 307-326
40. Terwilliger, T. C., and Berendzen, J. (1999) Acta Cryst. D55D55D55D55, 849-861
41. Brünger, A. T., Adams, P. D., Clore, G. M., DeLano, W. L., Gros, P., Grosse-Kunstleve, R. W., Jiang, J.-S.,
Kuszewski, J., Nilges, M., Pannu, N. S., Read, R. J., Rice, L. M., Simonson, T., and Warren, G. L. (1998)
Acta Cryst. D54D54D54D54, 905-921
42. Cohen, S. X., Morris, R. J., Fernandez, F. J., Ben Jelloul, M., Kakaris, M., Parthasarathy, V., Lamzin, V.
S., Kleywegt, G. J., and Perrakis, A. (2004) Acta Cryst. D60D60D60D60, 2222-2229
43. McRee, D. E. (1999) J. Struct. Biol. 125125125125, 156-165
44. Laskowski, R. A. (1993) J. Appl. Cryst. 26262626, 283-291
45. Messerschmidt, A., Huber, R., Wieghardt, K., and Poulos, T. (eds). (2001) Handbook of Metalloproteins,
John Wiley & Sons, New York
46. Mandal, A. K., and Argüello, J. M. (2003) Biochemistry 42424242, 11040-11047
47. Yatsunyk, L. A., and Rosenzweig, A. C. (2007) J. Biol. Chem. 282282282282, 8622-8631
48. Lippard, S. J., and Berg, J. M. (1994) Principles of bioinorganic chemistry, University Science Books,
Mill Valley
49. Solomon, E. I., Szilagyi, R. K., George, S. D., and Basumallick, L. (2004) Chem. Rev. 104104104104, 419-458
50. Westre, T. E., Kennepohl, P., DeWitt, J. G., Hedman, B., Hodgson, K. O., and Solomon, E. I. (1997) J.
Am. Chem. Soc. 119119119119, 6297-6314
51. Davydov, A., Davydov, R., Gräslund, A., Lipscomb, J. D., and Andersson, K. K. (1997) J. Biol. Chem. 272272272272,
7022-7026
52. Holm, L., and Sander, C. (1993) J. Mol. Biol. 233233233233, 123-138
53. Hubbard, T. J. P., Murzin, A. G., Brenner, S. E., and Chothia, C. (1997) Nucleic Acids Res. 25252525, 236-239
54. Sticht, H., and Rösch, P. (1998) Prog. Biophys. Molec. Biol. 70707070, 95-136
55. Crossnoe, C. R., Germanas, J. P., LeMagueres, P., Mustata, G., and Krause, K. L. (2002) J. Mol. Biol.
318318318318, 503-518
56. Delano, W. L. (2002) The PyMOL molecular graphics system, DeLano Scientific, San Carlos, CA
57. Bissig, K.-D., Wunderli-Ye, H., Duda, P. W., and Solioz, M. (2001) Biochem. J. 357357357357, 217-223
58. Mana-Capelli, S., Mandal, A. K., and Argüello, J. M. (2003) J. Biol. Chem. 278278278278, 40534-40541
59. Solioz, M., and Stoyanov, J. V. (2003) FEMS Microbiol. Rev. 27272727(2-3), 183-195
60. Kletzin, A., Urich, T., Müller, F., Bandeiras, T. M., and Gomes, C. M. (2004) J. Bioenerg. Biomemb. 36363636,
77-91
61. Stetter, K. O. (1999) FEBS Lett. 452452452452, 22-25
62. Kaim, W., and Rall, J. (1996) Angew. Chem. Int. Ed. Engl. 35353535, 43-60
63. Lund, O., Nielsen, M., Lundegaard, C., and Worning, P. (2002) CASP5 conference, A102
![Anamorsin Is a [2Fe-2S] Cluster-Containing Substrate of ... · Chemistry & Biology Article Anamorsin Is a [2Fe-2S] Cluster-Containing Substrate of the Mia40-Dependent Mitochondrial](https://static.documents.pub/doc/80x56/601ea65e00f6d6241253573f/anamorsin-is-a-2fe-2s-cluster-containing-substrate-of-chemistry-biology.jpg)


![RsmA is an anti-sigma factor that modulates its activity ... · 1 RsmA is an anti-sigma factor that modulates its activity through a [2Fe-2S] cluster cofactor Alisa A. Gaskell1,2,](https://static.documents.pub/doc/80x56/5e8e4c36dec58d2c340cdb9a/rsma-is-an-anti-sigma-factor-that-modulates-its-activity-1-rsma-is-an-anti-sigma.jpg)

![Structure-function studies of [2Fe-2S] ferredoxins...1986), (2) the nature of the coordinating ligands (Gurbiel et al., 1989), and (3) the polarity of the clus- ter environment (Tsukihara](https://static.documents.pub/doc/80x56/5f2b349924b5c2534673c93a/structure-function-studies-of-2fe-2s-ferredoxins-1986-2-the-nature-of.jpg)