
CIMA P1 Course Notes www.astranti.com
CIMA P1 Course Notes
Chapter 1
Costing Systems I –
Absorption and MarginalCosting
© Strategic Business Coaching Ltd 2014
Personal use only - not licensed for use on courses. 6Any unauthorised sharing or copying of this material is punishableby CIMA under the CIMA code of Ethics
CIMA P1 Course Notes www.astranti.com
1. Costing systems
A costing system is a method used to determine how much an item costs.
You may be thinking, that’s easy, the cost of something is how much we paid for it!
However, the actual price paid is not always as obvious as you might think.
Imagine you own a business building toy cars and this week you finished building two new models: Car A and Car B.
The parts for Car A cost £200.
The parts for Car B costs £2,000.
Both have a selling price of £3,000.
On the surface, it appears Car A is far more profitable than Car B. By the looks of things you might even consider specialising in producing Car A and forget about Car B altogether.
But what if Car A took five days to build and Car B only took an hour? What if you needed to hire three different specialists just to assist in the building of Car A? What if Car A needs £20,000 worth of special machinery to build? What if you needed to hire a bigger factory especially for the building of CarA?
In light of this information, what is real cost of Car A and Car B?
As you can see, costing is not always a simple exercise. Accurately costing products is important because if you don’t know the cost of your product, there’s no way to know whether it’s profitable.
To overcome this problem, corporations use costing systems. Costing systems take costs and accurately allocate them to outputs. This allows corporations to determine the actual costs of producing each product and give them a better indication of each unit’s profitability.
2. Absorption Costing
So far we have covered relatively simple examples of overhead allocation and apportionment. However, depending on the circumstances of the firm, it can get a little more complicated than this. In this section we'll run you through the stages of this process in more complex cases. As you read through, remember our goal in this process is to end up with an accurate overhead cost per unit.
© Strategic Business Coaching Ltd 2014
Personal use only - not licensed for use on courses. 7Any unauthorised sharing or copying of this material is punishableby CIMA under the CIMA code of Ethics
CIMA P1 Course Notes www.astranti.com
Step 1 – Overhead Allocation
The first stage of correctly apportioning overhead costs to cost units is to collect together overhead costs into relevant cost centres and categories.
For example, our pie shop has four main cost centres: Preparation, Baking, Purchasing and Admin. Two of these are production cost centres (directly related to making the pies) and two are service cost centres (more related to supporting the production).
The overhead costs directly related to these costs centres are recorded and grouped together. Let's say they are as follows:
Directly allocated costs:
Preparation: £60,000
Baking: £30,000
Purchasing: £50,000
Admin: £10,000
We may also have overheads that relate to the business as a whole and which can't be specifically allocated to a particular cost centre. In this case these are:
General overheads:
Rent: £100,000
Machine maintenance: £50,000
Water: £20,000
Electricity: £60,000
Heating: £40,000
Step 2 – Apportioning general overheads to cost centres
In order to relate an overhead to a cost unit accurately we want to end up with all overheads in the production cost centres as these most closely relate to the production of units.
Step 2 in the process gets us one step further closer to doing this, which is to take our general overheads and apportion them to cost centres.
Here's some information that will help us to do this:
© Strategic Business Coaching Ltd 2014
Personal use only - not licensed for use on courses. 8Any unauthorised sharing or copying of this material is punishableby CIMA under the CIMA code of Ethics
CIMA P1 Course Notes www.astranti.com
Preparation Baking Purchasing Admin
Floor space (m²) 300 200 400 100
Original machine cost 50,000 100,000 30,000 20,000
We next look at the overheads and decide what is the fairest way to spread our overheads into cost centres. Let's start with rent. Well rent is most closely related to floor space – the higher the floor space the higher the rent(or so you would think).
Similarly it's probably best to also apportion water, electricity and heating are apportioned by floor space, whereas machine maintenance should apportioned by the original cost of the machine as that is a fairer basis of spreading those costs.
We now need to work out exactly how much of each overhead should be distributed to each cost centre. We’ll start by breaking down floor space, asyou can see our business has a total of 1000m² worth of space and each costcentre utilises a different amount (for example, the preparation departmenthas 300m², meaning that the preparation department has 30% of the floor space) using this info we can work out the floor space proportions for each cost centre:
Preparation: 300/1000 = 30%
Baking: 200/1000 = 20%
Purchasing: 400/1000 = 40%
Admin: 100/1000 = 10%
Knowing these percentages, we can know calculate the amount of rent, water, electricity and heating to attribute to each cost centre:
Preparation(30%)
Baking(20%)
Purchasing(40%)
Admin(10%)
Rent (£100,000) 30,000 20,000 40,000 10,000
Water (£20,000) 6,000 4,000 8,000 2,000
Electricity (£60,000) 18,000 12,000 24,000 6,000
Heating (£40,000) 12,000 8,000 16,000 4,000
Total 66,000 44,000 88,000 22,000
We can now do the same for the cost of the machines:
Preparation: 50,000/200,000 = 25%
Baking: 100,000/200,000 = 50%© Strategic Business Coaching Ltd 2014
Personal use only - not licensed for use on courses. 9Any unauthorised sharing or copying of this material is punishableby CIMA under the CIMA code of Ethics
CIMA P1 Course Notes www.astranti.com
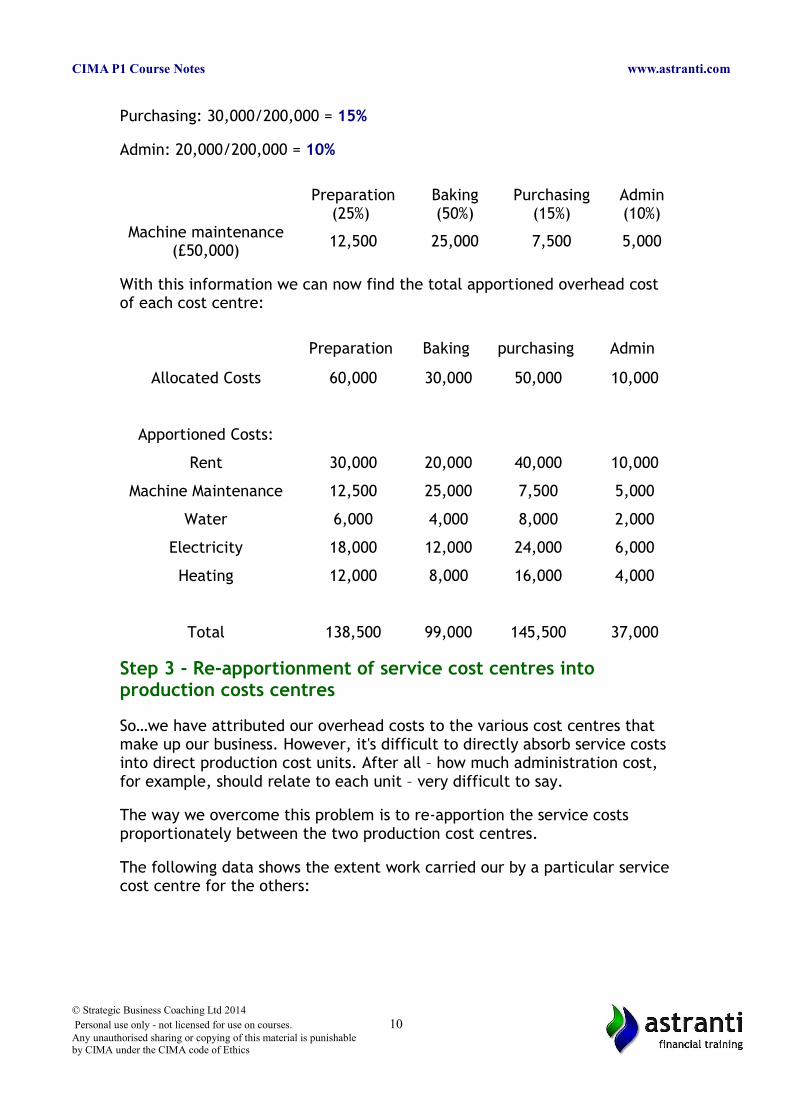
Purchasing: 30,000/200,000 = 15%
Admin: 20,000/200,000 = 10%
Preparation(25%)
Baking(50%)
Purchasing(15%)
Admin(10%)
Machine maintenance(£50,000)
12,500 25,000 7,500 5,000
With this information we can now find the total apportioned overhead cost of each cost centre:
Preparation Baking purchasing Admin
Allocated Costs 60,000 30,000 50,000 10,000
Apportioned Costs:
Rent 30,000 20,000 40,000 10,000
Machine Maintenance 12,500 25,000 7,500 5,000
Water 6,000 4,000 8,000 2,000
Electricity 18,000 12,000 24,000 6,000
Heating 12,000 8,000 16,000 4,000
Total 138,500 99,000 145,500 37,000
Step 3 - Re-apportionment of service cost centres into production costs centres
So…we have attributed our overhead costs to the various cost centres that make up our business. However, it's difficult to directly absorb service costs into direct production cost units. After all – how much administration cost, for example, should relate to each unit – very difficult to say.
The way we overcome this problem is to re-apportion the service costs proportionately between the two production cost centres.
The following data shows the extent work carried our by a particular servicecost centre for the others:
© Strategic Business Coaching Ltd 2014
Personal use only - not licensed for use on courses. 10Any unauthorised sharing or copying of this material is punishableby CIMA under the CIMA code of Ethics
CIMA P1 Course Notes www.astranti.com
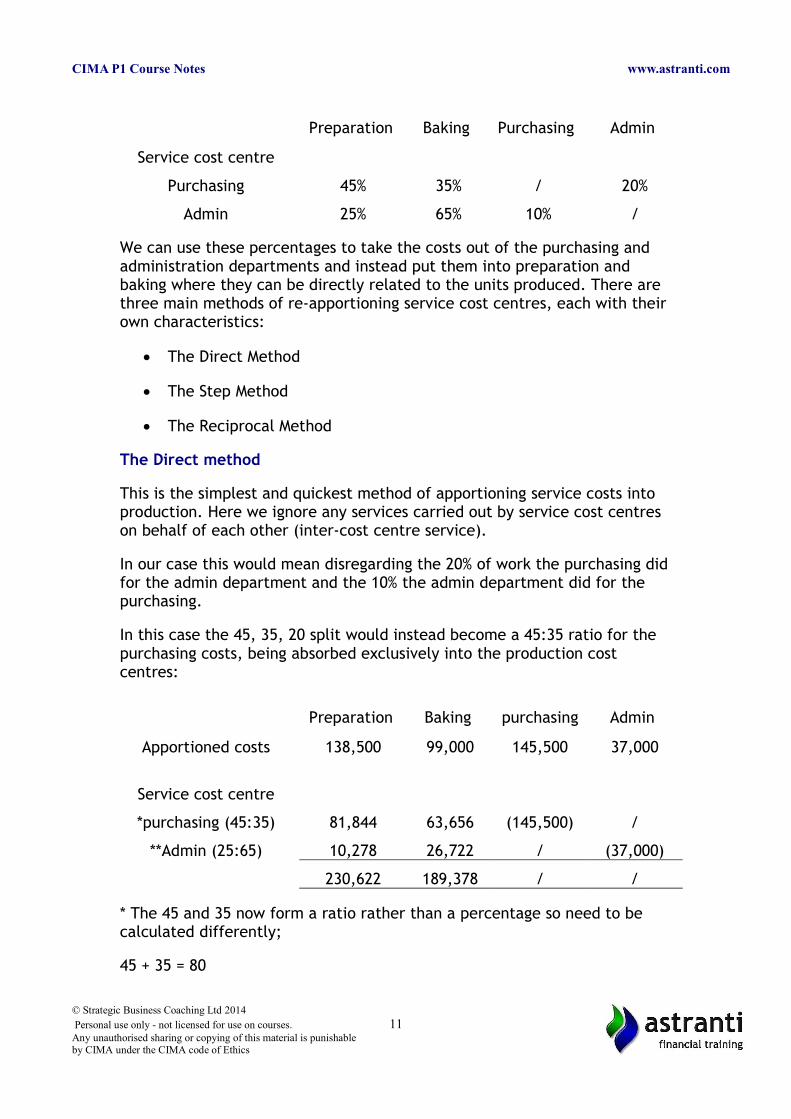
Preparation Baking Purchasing Admin
Service cost centre
Purchasing 45% 35% / 20%
Admin 25% 65% 10% /
We can use these percentages to take the costs out of the purchasing and administration departments and instead put them into preparation and baking where they can be directly related to the units produced. There are three main methods of re-apportioning service cost centres, each with their own characteristics:
The Direct Method
The Step Method
The Reciprocal Method
The Direct method
This is the simplest and quickest method of apportioning service costs into production. Here we ignore any services carried out by service cost centres on behalf of each other (inter-cost centre service).
In our case this would mean disregarding the 20% of work the purchasing didfor the admin department and the 10% the admin department did for the purchasing.
In this case the 45, 35, 20 split would instead become a 45:35 ratio for the purchasing costs, being absorbed exclusively into the production cost centres:
Preparation Baking purchasing Admin
Apportioned costs 138,500 99,000 145,500 37,000
Service cost centre
*purchasing (45:35) 81,844 63,656 (145,500) /
**Admin (25:65) 10,278 26,722 / (37,000)
230,622 189,378 / /
* The 45 and 35 now form a ratio rather than a percentage so need to be calculated differently;
45 + 35 = 80
© Strategic Business Coaching Ltd 2014
Personal use only - not licensed for use on courses. 11Any unauthorised sharing or copying of this material is punishableby CIMA under the CIMA code of Ethics
CIMA P1 Course Notes www.astranti.com
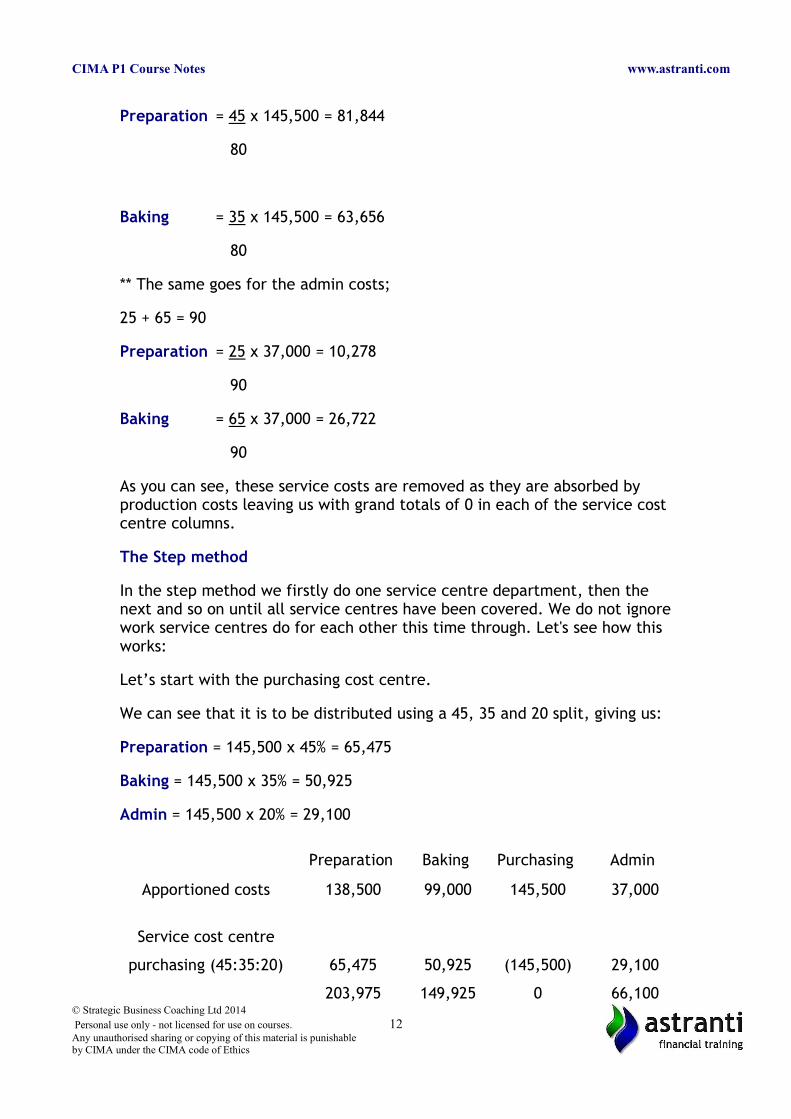
Preparation = 45 x 145,500 = 81,844
80
Baking = 35 x 145,500 = 63,656
80
** The same goes for the admin costs;
25 + 65 = 90
Preparation = 25 x 37,000 = 10,278
90
Baking = 65 x 37,000 = 26,722
90
As you can see, these service costs are removed as they are absorbed by production costs leaving us with grand totals of 0 in each of the service cost centre columns.
The Step method
In the step method we firstly do one service centre department, then the next and so on until all service centres have been covered. We do not ignorework service centres do for each other this time through. Let's see how this works:
Let’s start with the purchasing cost centre.
We can see that it is to be distributed using a 45, 35 and 20 split, giving us:
Preparation = 145,500 x 45% = 65,475
Baking = 145,500 x 35% = 50,925
Admin = 145,500 x 20% = 29,100
Preparation Baking Purchasing Admin
Apportioned costs 138,500 99,000 145,500 37,000
Service cost centre
purchasing (45:35:20) 65,475 50,925 (145,500) 29,100
203,975 149,925 0 66,100© Strategic Business Coaching Ltd 2014
Personal use only - not licensed for use on courses. 12Any unauthorised sharing or copying of this material is punishableby CIMA under the CIMA code of Ethics
CIMA P1 Course Notes www.astranti.com
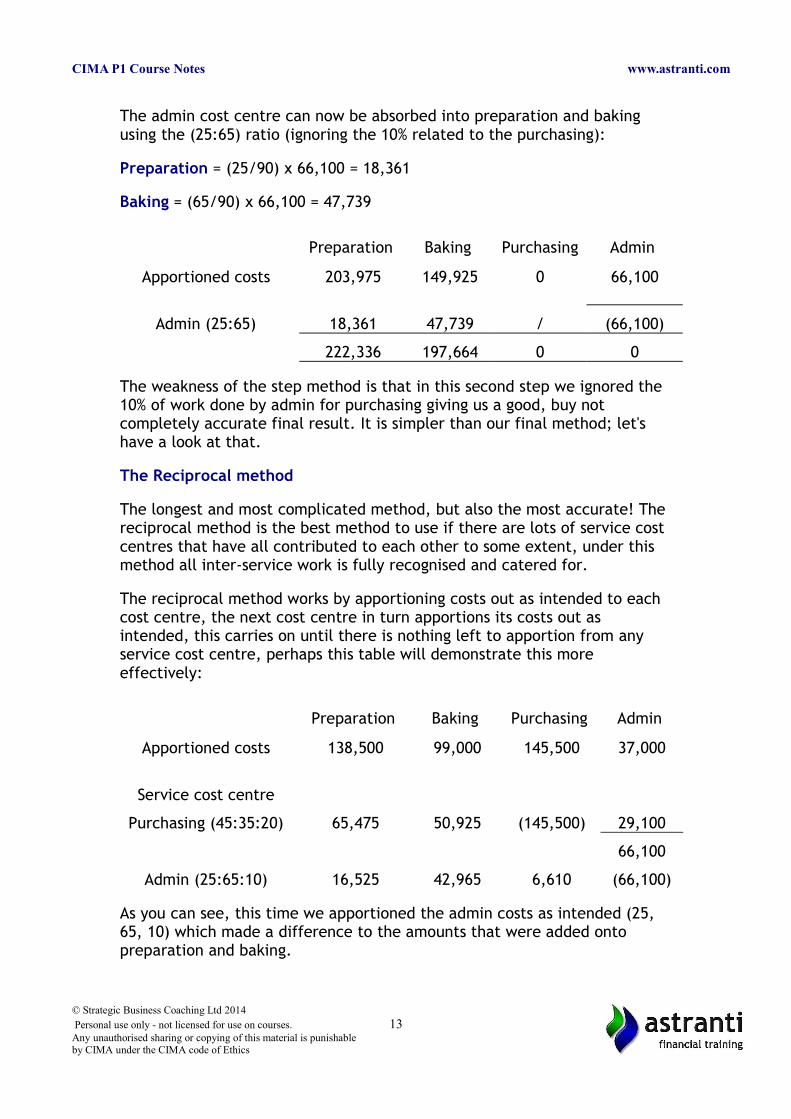
The admin cost centre can now be absorbed into preparation and baking using the (25:65) ratio (ignoring the 10% related to the purchasing):
Preparation = (25/90) x 66,100 = 18,361
Baking = (65/90) x 66,100 = 47,739
Preparation Baking Purchasing Admin
Apportioned costs 203,975 149,925 0 66,100
Admin (25:65) 18,361 47,739 / (66,100)
222,336 197,664 0 0
The weakness of the step method is that in this second step we ignored the 10% of work done by admin for purchasing giving us a good, buy not completely accurate final result. It is simpler than our final method; let's have a look at that.
The Reciprocal method
The longest and most complicated method, but also the most accurate! The reciprocal method is the best method to use if there are lots of service cost centres that have all contributed to each other to some extent, under this method all inter-service work is fully recognised and catered for.
The reciprocal method works by apportioning costs out as intended to each cost centre, the next cost centre in turn apportions its costs out as intended, this carries on until there is nothing left to apportion from any service cost centre, perhaps this table will demonstrate this more effectively:
Preparation Baking Purchasing Admin
Apportioned costs 138,500 99,000 145,500 37,000
Service cost centre
Purchasing (45:35:20) 65,475 50,925 (145,500) 29,100
66,100
Admin (25:65:10) 16,525 42,965 6,610 (66,100)
As you can see, this time we apportioned the admin costs as intended (25, 65, 10) which made a difference to the amounts that were added onto preparation and baking.
© Strategic Business Coaching Ltd 2014
Personal use only - not licensed for use on courses. 13Any unauthorised sharing or copying of this material is punishableby CIMA under the CIMA code of Ethics
CIMA P1 Course Notes www.astranti.com
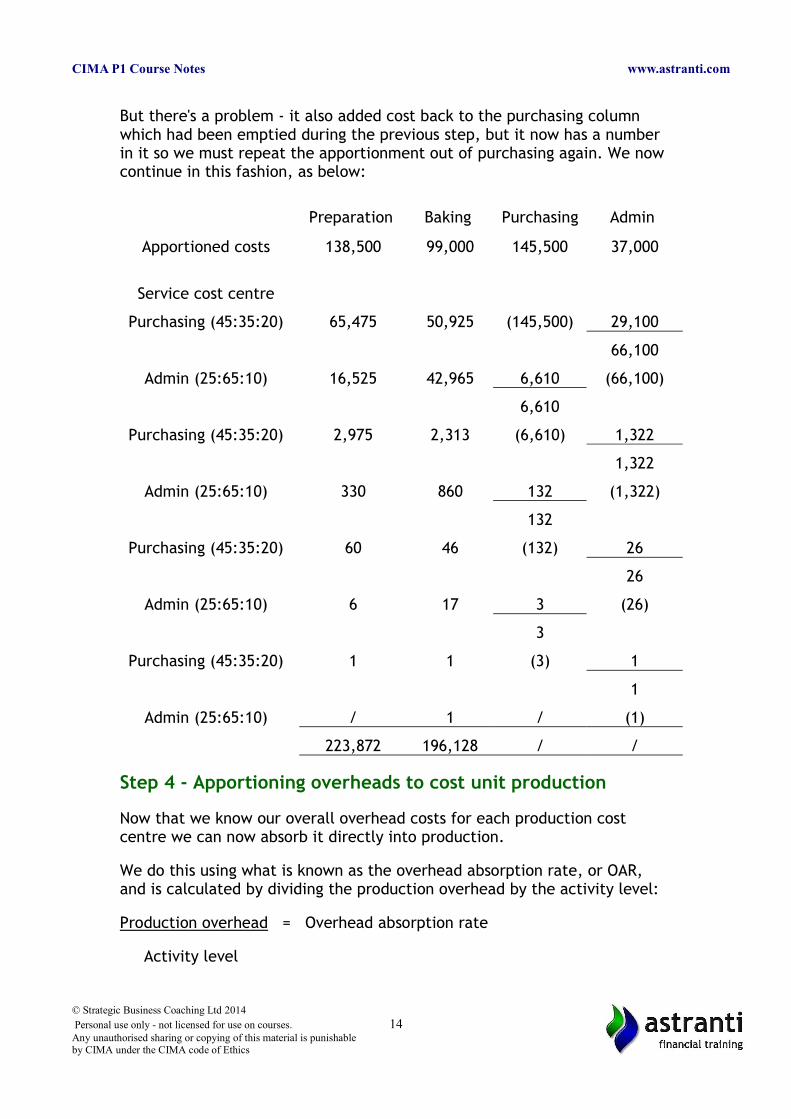
But there's a problem - it also added cost back to the purchasing column which had been emptied during the previous step, but it now has a number in it so we must repeat the apportionment out of purchasing again. We now continue in this fashion, as below:
Preparation Baking Purchasing Admin
Apportioned costs 138,500 99,000 145,500 37,000
Service cost centre
Purchasing (45:35:20) 65,475 50,925 (145,500) 29,100
66,100
Admin (25:65:10) 16,525 42,965 6,610 (66,100)
6,610
Purchasing (45:35:20) 2,975 2,313 (6,610) 1,322
1,322
Admin (25:65:10) 330 860 132 (1,322)
132
Purchasing (45:35:20) 60 46 (132) 26
26
Admin (25:65:10) 6 17 3 (26)
3
Purchasing (45:35:20) 1 1 (3) 1
1
Admin (25:65:10) / 1 / (1)
223,872 196,128 / /
Step 4 - Apportioning overheads to cost unit production
Now that we know our overall overhead costs for each production cost centre we can now absorb it directly into production.
We do this using what is known as the overhead absorption rate, or OAR, and is calculated by dividing the production overhead by the activity level:
Production overhead = Overhead absorption rate
Activity level
© Strategic Business Coaching Ltd 2014
Personal use only - not licensed for use on courses. 14Any unauthorised sharing or copying of this material is punishableby CIMA under the CIMA code of Ethics
CIMA P1 Course Notes www.astranti.com
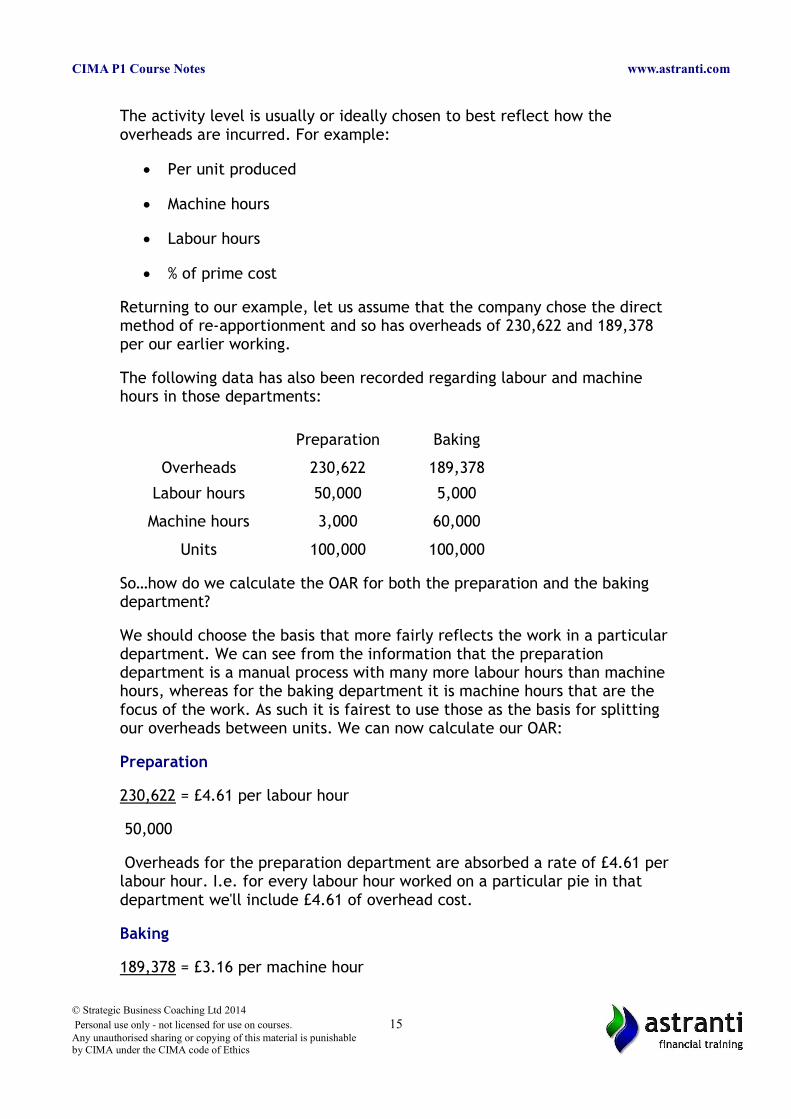
The activity level is usually or ideally chosen to best reflect how the overheads are incurred. For example:
Per unit produced
Machine hours
Labour hours
% of prime cost
Returning to our example, let us assume that the company chose the direct method of re-apportionment and so has overheads of 230,622 and 189,378 per our earlier working.
The following data has also been recorded regarding labour and machine hours in those departments:
Preparation Baking
Overheads 230,622 189,378
Labour hours 50,000 5,000
Machine hours 3,000 60,000
Units 100,000 100,000
So…how do we calculate the OAR for both the preparation and the baking department?
We should choose the basis that more fairly reflects the work in a particulardepartment. We can see from the information that the preparation department is a manual process with many more labour hours than machine hours, whereas for the baking department it is machine hours that are the focus of the work. As such it is fairest to use those as the basis for splitting our overheads between units. We can now calculate our OAR:
Preparation
230,622 = £4.61 per labour hour
50,000
Overheads for the preparation department are absorbed a rate of £4.61 perlabour hour. I.e. for every labour hour worked on a particular pie in that department we'll include £4.61 of overhead cost.
Baking
189,378 = £3.16 per machine hour
© Strategic Business Coaching Ltd 2014
Personal use only - not licensed for use on courses. 15Any unauthorised sharing or copying of this material is punishableby CIMA under the CIMA code of Ethics
CIMA P1 Course Notes www.astranti.com
60,000
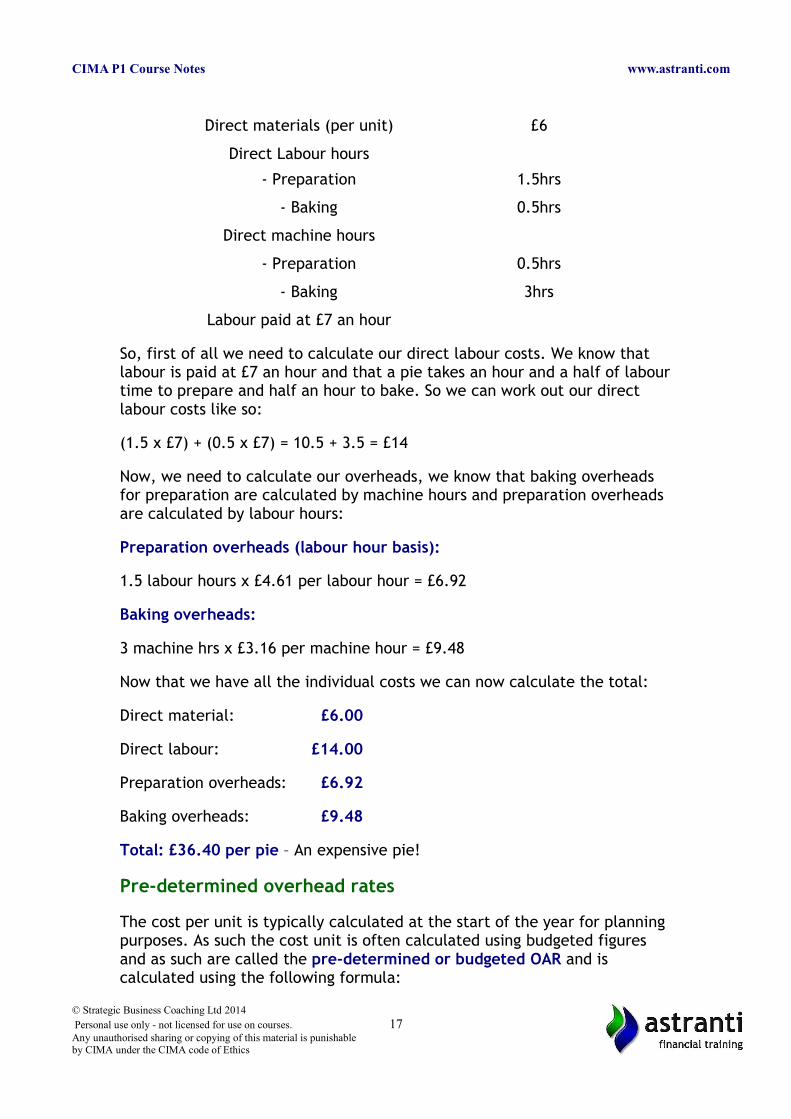
Overheads for the baking department are absorbed a rate of £3.16 per machine hour!
So let’s put this all together!
The pie Purchasing makes a particular pie ‘the big one’ and the following costs have been identified:
© Strategic Business Coaching Ltd 2014
Personal use only - not licensed for use on courses. 16Any unauthorised sharing or copying of this material is punishableby CIMA under the CIMA code of Ethics
CIMA P1 Course Notes www.astranti.com
Direct materials (per unit) £6
Direct Labour hours
- Preparation 1.5hrs
- Baking 0.5hrs
Direct machine hours
- Preparation 0.5hrs
- Baking 3hrs
Labour paid at £7 an hour
So, first of all we need to calculate our direct labour costs. We know that labour is paid at £7 an hour and that a pie takes an hour and a half of labourtime to prepare and half an hour to bake. So we can work out our direct labour costs like so:
(1.5 x £7) + (0.5 x £7) = 10.5 + 3.5 = £14
Now, we need to calculate our overheads, we know that baking overheads for preparation are calculated by machine hours and preparation overheads are calculated by labour hours:
Preparation overheads (labour hour basis):
1.5 labour hours x £4.61 per labour hour = £6.92
Baking overheads:
3 machine hrs x £3.16 per machine hour = £9.48
Now that we have all the individual costs we can now calculate the total:
Direct material: £6.00
Direct labour: £14.00
Preparation overheads: £6.92
Baking overheads: £9.48
Total: £36.40 per pie – An expensive pie!
Pre-determined overhead rates
The cost per unit is typically calculated at the start of the year for planning purposes. As such the cost unit is often calculated using budgeted figures and as such are called the pre-determined or budgeted OAR and is calculated using the following formula:
© Strategic Business Coaching Ltd 2014
Personal use only - not licensed for use on courses. 17Any unauthorised sharing or copying of this material is punishableby CIMA under the CIMA code of Ethics
CIMA P1 Course Notes www.astranti.com
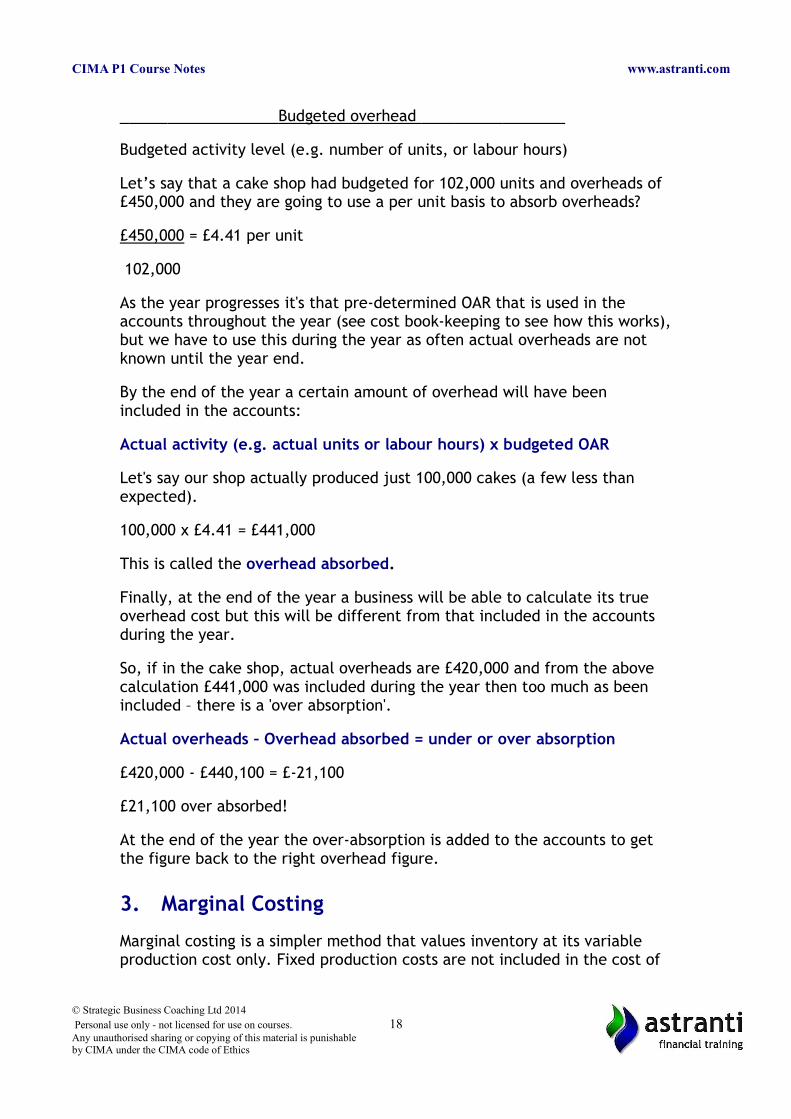
Budgeted overhead .
Budgeted activity level (e.g. number of units, or labour hours)
Let’s say that a cake shop had budgeted for 102,000 units and overheads of £450,000 and they are going to use a per unit basis to absorb overheads?
£450,000 = £4.41 per unit
102,000
As the year progresses it's that pre-determined OAR that is used in the accounts throughout the year (see cost book-keeping to see how this works),but we have to use this during the year as often actual overheads are not known until the year end.
By the end of the year a certain amount of overhead will have been included in the accounts:
Actual activity (e.g. actual units or labour hours) x budgeted OAR
Let's say our shop actually produced just 100,000 cakes (a few less than expected).
100,000 x £4.41 = £441,000
This is called the overhead absorbed.
Finally, at the end of the year a business will be able to calculate its true overhead cost but this will be different from that included in the accounts during the year.
So, if in the cake shop, actual overheads are £420,000 and from the above calculation £441,000 was included during the year then too much as been included – there is a 'over absorption'.
Actual overheads – Overhead absorbed = under or over absorption
£420,000 - £440,100 = £-21,100
£21,100 over absorbed!
At the end of the year the over-absorption is added to the accounts to get the figure back to the right overhead figure.
3. Marginal Costing
Marginal costing is a simpler method that values inventory at its variable production cost only. Fixed production costs are not included in the cost of
© Strategic Business Coaching Ltd 2014
Personal use only - not licensed for use on courses. 18Any unauthorised sharing or copying of this material is punishableby CIMA under the CIMA code of Ethics
CIMA P1 Course Notes www.astranti.com
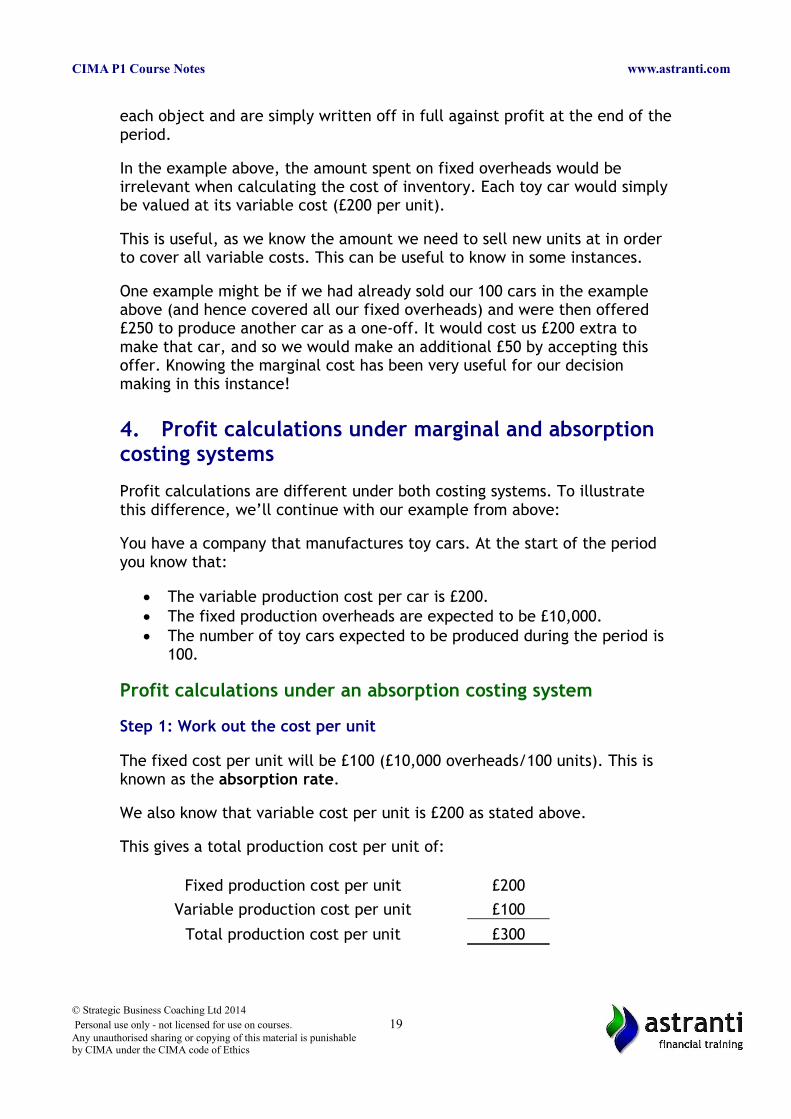
each object and are simply written off in full against profit at the end of theperiod.
In the example above, the amount spent on fixed overheads would be irrelevant when calculating the cost of inventory. Each toy car would simplybe valued at its variable cost (£200 per unit).
This is useful, as we know the amount we need to sell new units at in order to cover all variable costs. This can be useful to know in some instances.
One example might be if we had already sold our 100 cars in the example above (and hence covered all our fixed overheads) and were then offered £250 to produce another car as a one-off. It would cost us £200 extra to make that car, and so we would make an additional £50 by accepting this offer. Knowing the marginal cost has been very useful for our decision making in this instance!
4. Profit calculations under marginal and absorption costing systems
Profit calculations are different under both costing systems. To illustrate this difference, we’ll continue with our example from above:
You have a company that manufactures toy cars. At the start of the period you know that:
The variable production cost per car is £200. The fixed production overheads are expected to be £10,000. The number of toy cars expected to be produced during the period is
100.
Profit calculations under an absorption costing system
Step 1: Work out the cost per unit
The fixed cost per unit will be £100 (£10,000 overheads/100 units). This is known as the absorption rate.
We also know that variable cost per unit is £200 as stated above.
This gives a total production cost per unit of:
Fixed production cost per unit £200
Variable production cost per unit £100
Total production cost per unit £300
© Strategic Business Coaching Ltd 2014
Personal use only - not licensed for use on courses. 19Any unauthorised sharing or copying of this material is punishableby CIMA under the CIMA code of Ethics
CIMA P1 Course Notes www.astranti.com
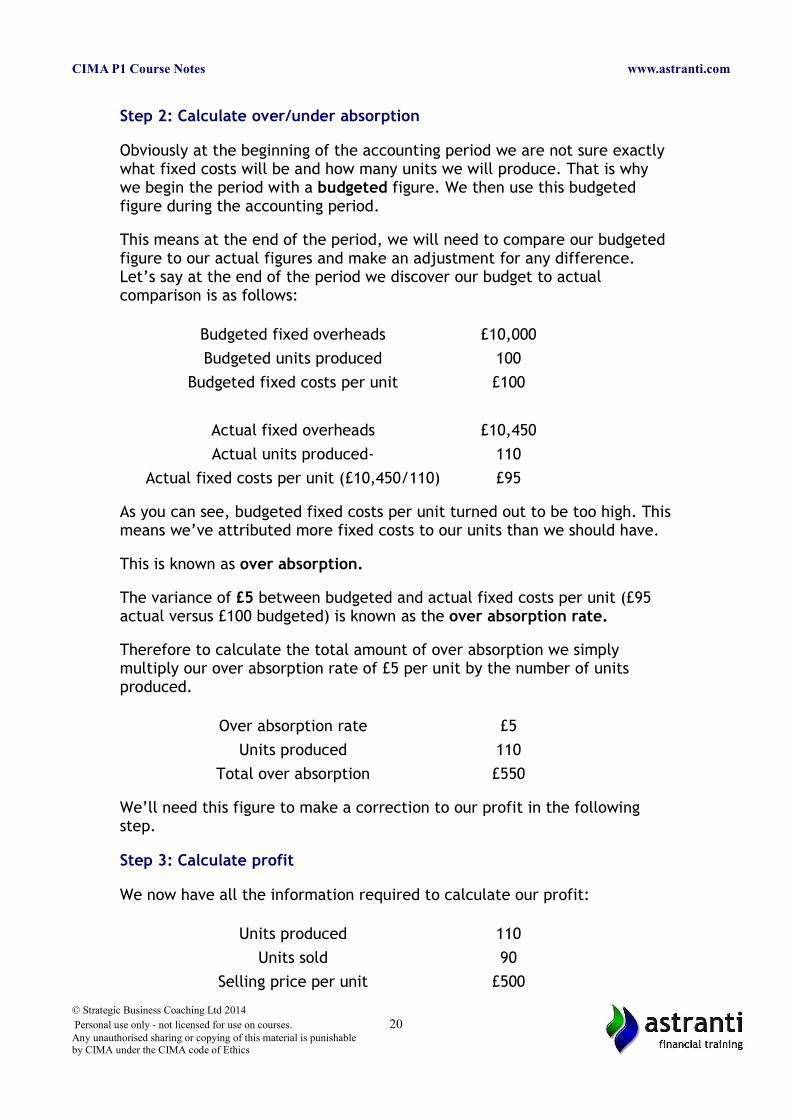
Step 2: Calculate over/under absorption
Obviously at the beginning of the accounting period we are not sure exactly what fixed costs will be and how many units we will produce. That is why we begin the period with a budgeted figure. We then use this budgeted figure during the accounting period.
This means at the end of the period, we will need to compare our budgeted figure to our actual figures and make an adjustment for any difference. Let’s say at the end of the period we discover our budget to actual comparison is as follows:
Budgeted fixed overheads £10,000
Budgeted units produced 100
Budgeted fixed costs per unit £100
Actual fixed overheads £10,450
Actual units produced- 110
Actual fixed costs per unit (£10,450/110) £95
As you can see, budgeted fixed costs per unit turned out to be too high. Thismeans we’ve attributed more fixed costs to our units than we should have.
This is known as over absorption.
The variance of £5 between budgeted and actual fixed costs per unit (£95 actual versus £100 budgeted) is known as the over absorption rate.
Therefore to calculate the total amount of over absorption we simply multiply our over absorption rate of £5 per unit by the number of units produced.
Over absorption rate £5
Units produced 110
Total over absorption £550
We’ll need this figure to make a correction to our profit in the following step.
Step 3: Calculate profit
We now have all the information required to calculate our profit:
Units produced 110
Units sold 90
Selling price per unit £500
© Strategic Business Coaching Ltd 2014
Personal use only - not licensed for use on courses. 20Any unauthorised sharing or copying of this material is punishableby CIMA under the CIMA code of Ethics
CIMA P1 Course Notes www.astranti.com
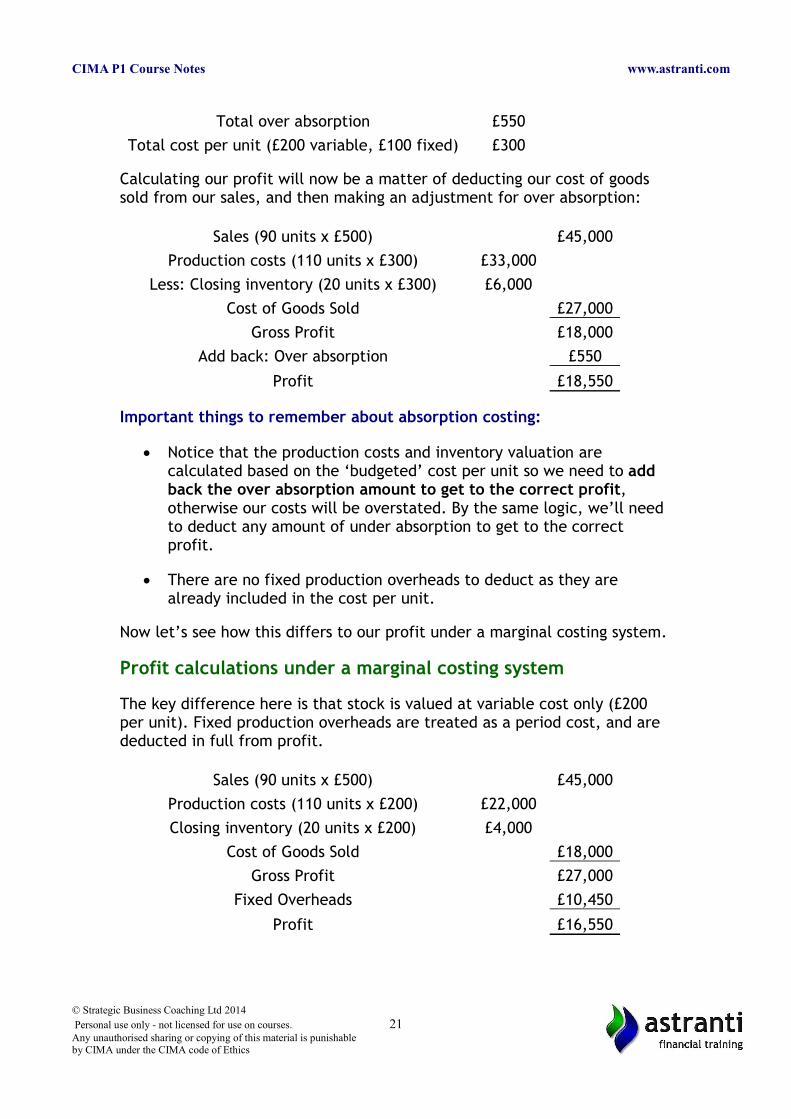
Total over absorption £550
Total cost per unit (£200 variable, £100 fixed) £300
Calculating our profit will now be a matter of deducting our cost of goods sold from our sales, and then making an adjustment for over absorption:
Sales (90 units x £500) £45,000
Production costs (110 units x £300) £33,000
Less: Closing inventory (20 units x £300) £6,000
Cost of Goods Sold £27,000
Gross Profit £18,000
Add back: Over absorption £550
Profit £18,550
Important things to remember about absorption costing:
Notice that the production costs and inventory valuation are calculated based on the ‘budgeted’ cost per unit so we need to add back the over absorption amount to get to the correct profit, otherwise our costs will be overstated. By the same logic, we’ll need to deduct any amount of under absorption to get to the correct profit.
There are no fixed production overheads to deduct as they are already included in the cost per unit.
Now let’s see how this differs to our profit under a marginal costing system.
Profit calculations under a marginal costing system
The key difference here is that stock is valued at variable cost only (£200 per unit). Fixed production overheads are treated as a period cost, and are deducted in full from profit.
Sales (90 units x £500) £45,000
Production costs (110 units x £200) £22,000
Closing inventory (20 units x £200) £4,000
Cost of Goods Sold £18,000
Gross Profit £27,000
Fixed Overheads £10,450
Profit £16,550
© Strategic Business Coaching Ltd 2014
Personal use only - not licensed for use on courses. 21Any unauthorised sharing or copying of this material is punishableby CIMA under the CIMA code of Ethics
CIMA P1 Course Notes www.astranti.com
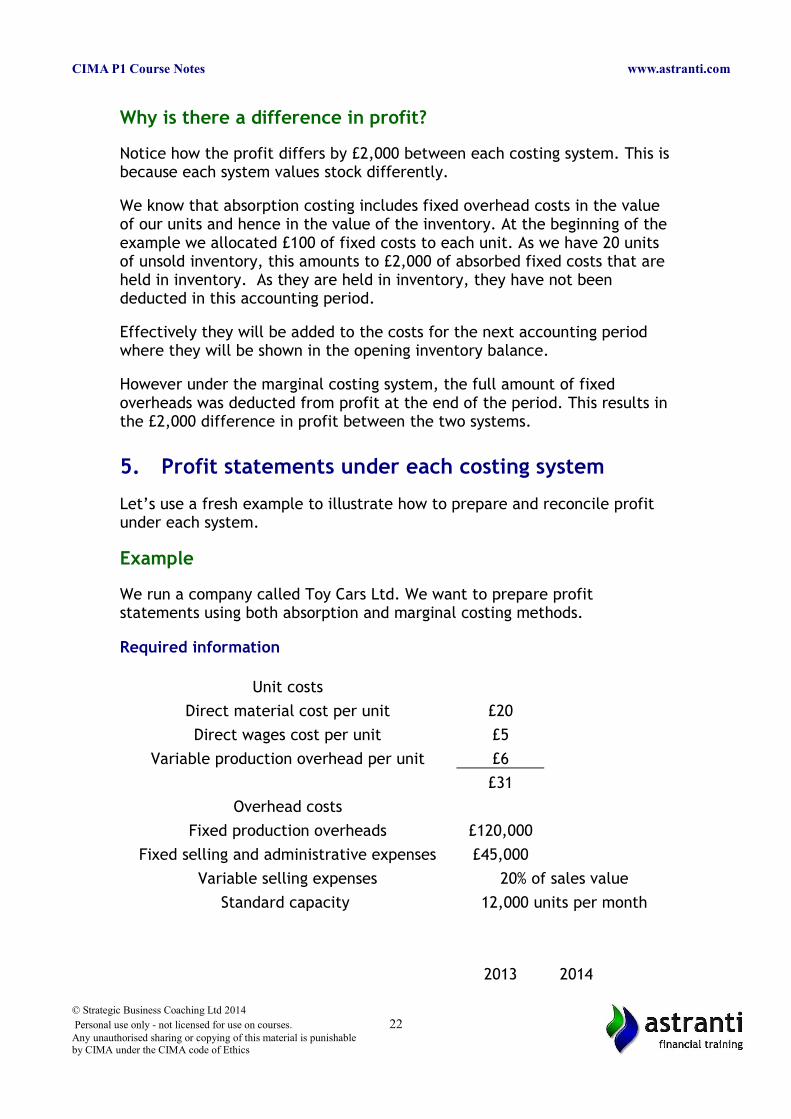
Why is there a difference in profit?
Notice how the profit differs by £2,000 between each costing system. This isbecause each system values stock differently.
We know that absorption costing includes fixed overhead costs in the value of our units and hence in the value of the inventory. At the beginning of the example we allocated £100 of fixed costs to each unit. As we have 20 units of unsold inventory, this amounts to £2,000 of absorbed fixed costs that are held in inventory. As they are held in inventory, they have not been deducted in this accounting period.
Effectively they will be added to the costs for the next accounting period where they will be shown in the opening inventory balance.
However under the marginal costing system, the full amount of fixed overheads was deducted from profit at the end of the period. This results inthe £2,000 difference in profit between the two systems.
5. Profit statements under each costing system
Let’s use a fresh example to illustrate how to prepare and reconcile profit under each system.
Example
We run a company called Toy Cars Ltd. We want to prepare profit statements using both absorption and marginal costing methods.
Required information
Unit costs
Direct material cost per unit £20
Direct wages cost per unit £5
Variable production overhead per unit £6
£31
Overhead costs
Fixed production overheads £120,000
Fixed selling and administrative expenses £45,000
Variable selling expenses 20% of sales value
Standard capacity 12,000 units per month
2013 2014
© Strategic Business Coaching Ltd 2014
Personal use only - not licensed for use on courses. 22Any unauthorised sharing or copying of this material is punishableby CIMA under the CIMA code of Ethics
CIMA P1 Course Notes www.astranti.com
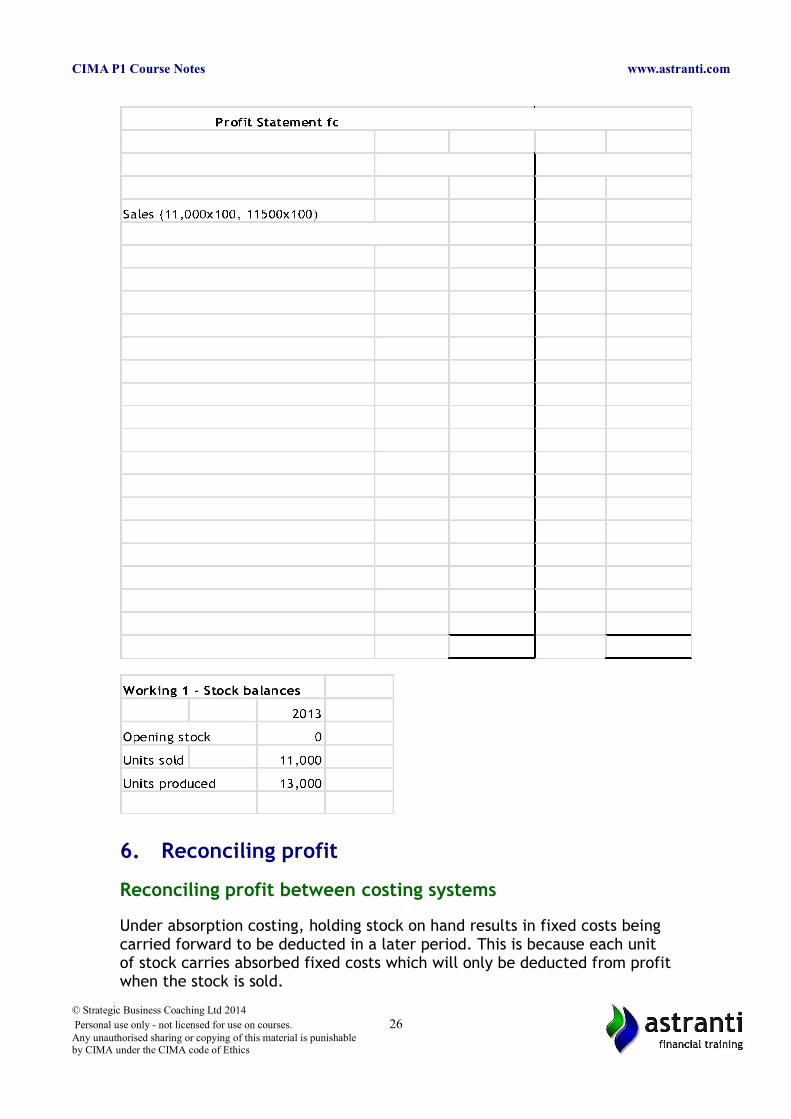
Units sold 11,000 11,500
Units produced 13,000 10,000
Selling price £100
Profit statement using a marginal costing system
Step 1: Work out our cost per unit
The cost of each unit of inventory will be £31, which is the sum of each unit’s variable production costs (£20 + £5 + £6).
Step 2: Compile profit statement
First we deduct all variable expenses from our sales. This gives us a ‘contribution’ figure. You can think of this amount as a surplus from business activities that ‘contributes’ to covering fixed costs.
From there we simply deduct fixed costs to calculate profit.
The format of our profit statement will be as follows:
© Strategic Business Coaching Ltd 2014
Personal use only - not licensed for use on courses. 23Any unauthorised sharing or copying of this material is punishableby CIMA under the CIMA code of Ethics
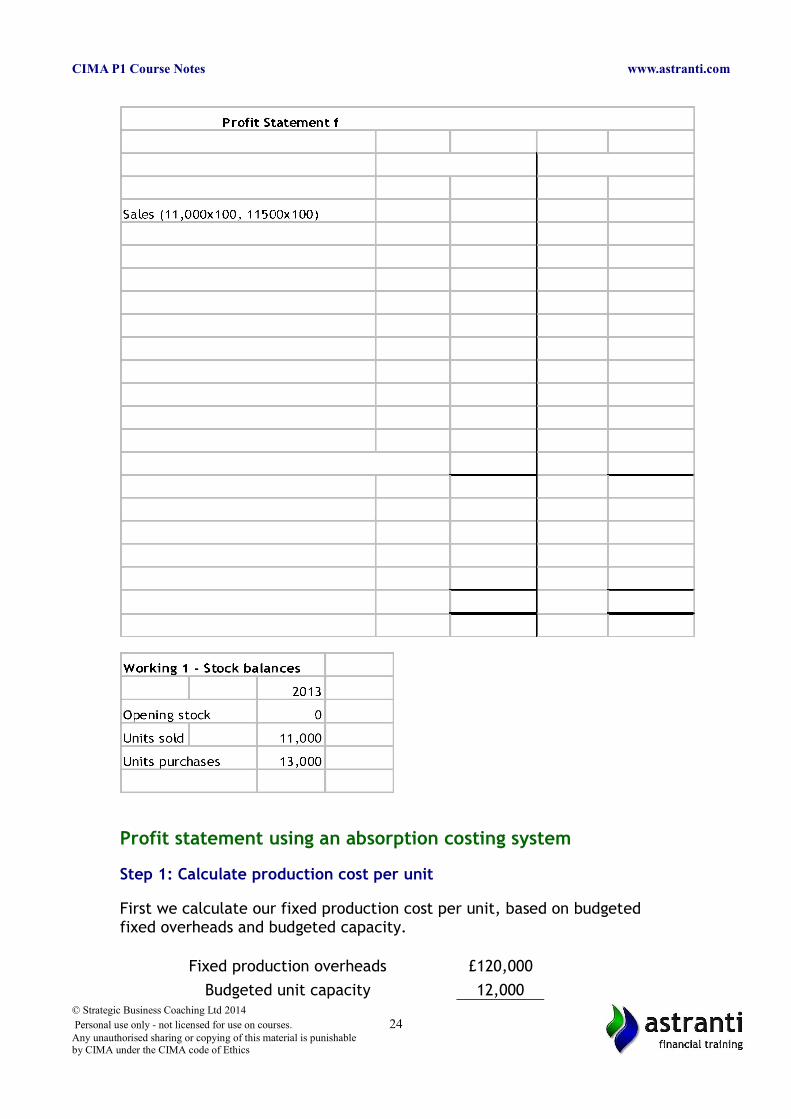
CIMA P1 Course Notes www.astranti.com
Profit statement using an absorption costing system
Step 1: Calculate production cost per unit
First we calculate our fixed production cost per unit, based on budgeted fixed overheads and budgeted capacity.
Fixed production overheads £120,000
Budgeted unit capacity 12,000© Strategic Business Coaching Ltd 2014
Personal use only - not licensed for use on courses. 24Any unauthorised sharing or copying of this material is punishableby CIMA under the CIMA code of Ethics
CIMA P1 Course Notes www.astranti.com
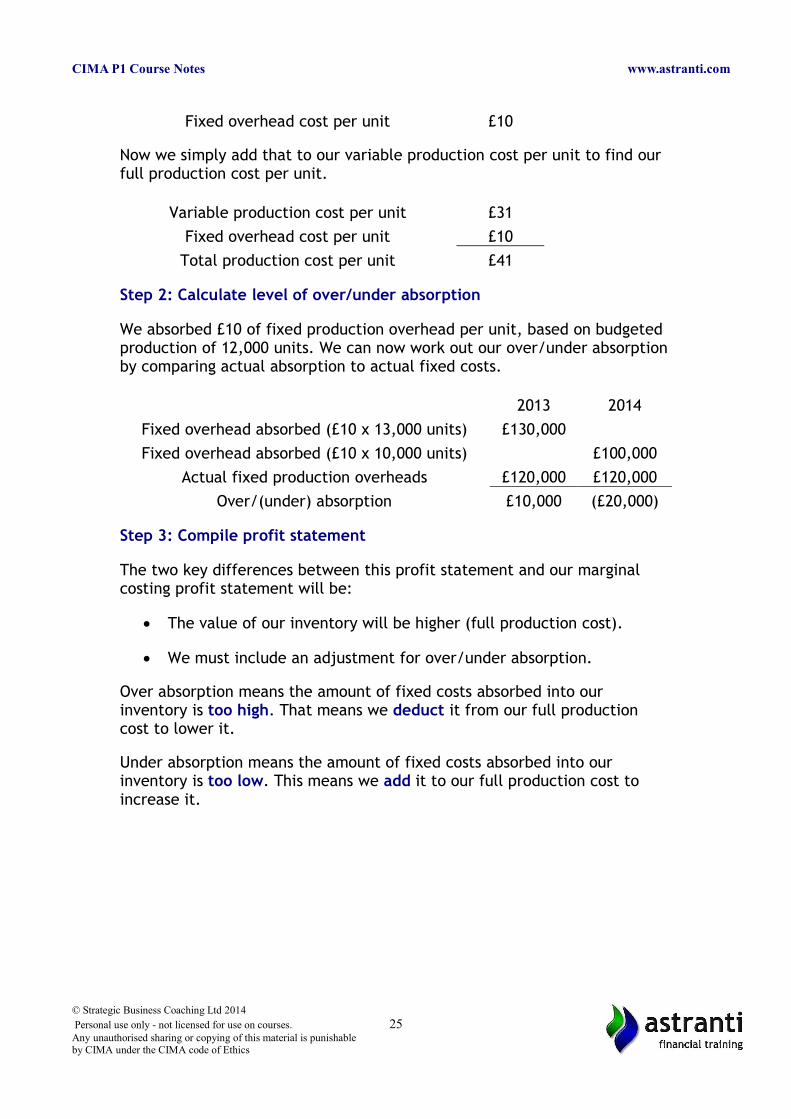
Fixed overhead cost per unit £10
Now we simply add that to our variable production cost per unit to find our full production cost per unit.
Variable production cost per unit £31
Fixed overhead cost per unit £10
Total production cost per unit £41
Step 2: Calculate level of over/under absorption
We absorbed £10 of fixed production overhead per unit, based on budgeted production of 12,000 units. We can now work out our over/under absorptionby comparing actual absorption to actual fixed costs.
2013 2014
Fixed overhead absorbed (£10 x 13,000 units) £130,000
Fixed overhead absorbed (£10 x 10,000 units) £100,000
Actual fixed production overheads £120,000 £120,000
Over/(under) absorption £10,000 (£20,000)
Step 3: Compile profit statement
The two key differences between this profit statement and our marginal costing profit statement will be:
The value of our inventory will be higher (full production cost).
We must include an adjustment for over/under absorption.
Over absorption means the amount of fixed costs absorbed into our inventory is too high. That means we deduct it from our full production cost to lower it.
Under absorption means the amount of fixed costs absorbed into our inventory is too low. This means we add it to our full production cost to increase it.
© Strategic Business Coaching Ltd 2014
Personal use only - not licensed for use on courses. 25Any unauthorised sharing or copying of this material is punishableby CIMA under the CIMA code of Ethics
CIMA P1 Course Notes www.astranti.com
6. Reconciling profit
Reconciling profit between costing systems
Under absorption costing, holding stock on hand results in fixed costs being carried forward to be deducted in a later period. This is because each unit of stock carries absorbed fixed costs which will only be deducted from profitwhen the stock is sold.
© Strategic Business Coaching Ltd 2014
Personal use only - not licensed for use on courses. 26Any unauthorised sharing or copying of this material is punishableby CIMA under the CIMA code of Ethics
CIMA P1 Course Notes www.astranti.com
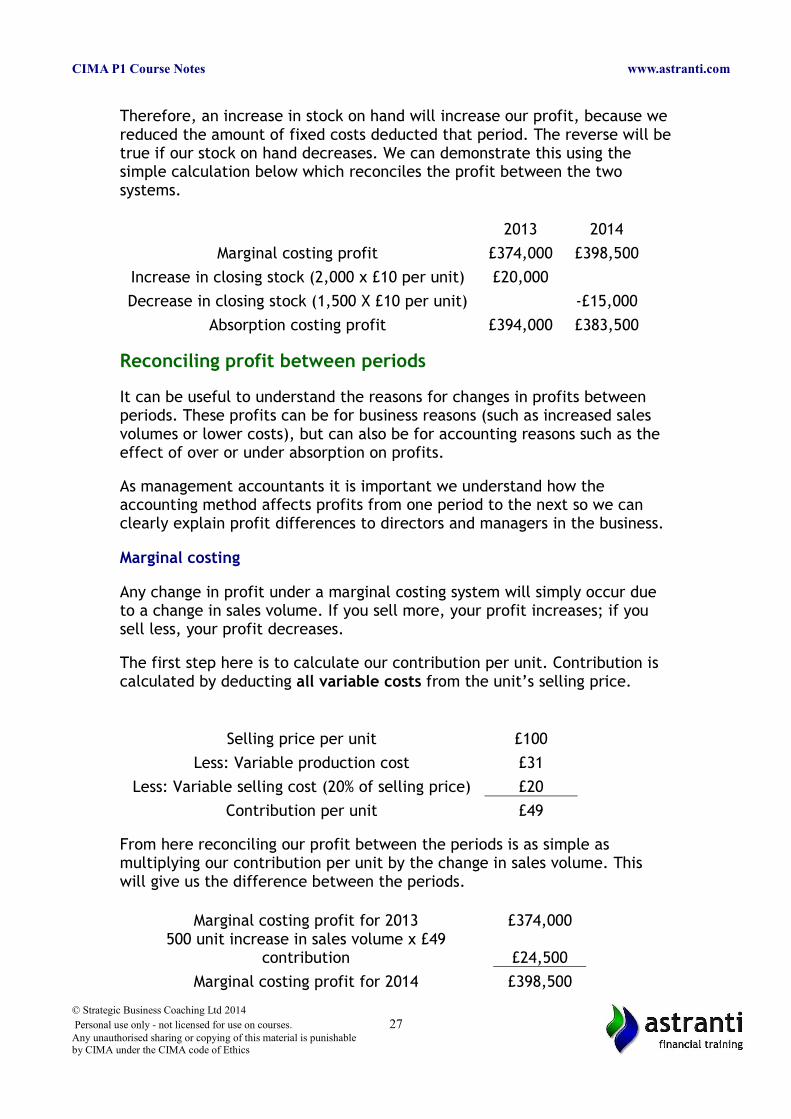
Therefore, an increase in stock on hand will increase our profit, because wereduced the amount of fixed costs deducted that period. The reverse will betrue if our stock on hand decreases. We can demonstrate this using the simple calculation below which reconciles the profit between the two systems.
2013 2014
Marginal costing profit £374,000 £398,500
Increase in closing stock (2,000 x £10 per unit) £20,000
Decrease in closing stock (1,500 X £10 per unit) -£15,000
Absorption costing profit £394,000 £383,500
Reconciling profit between periods
It can be useful to understand the reasons for changes in profits between periods. These profits can be for business reasons (such as increased sales volumes or lower costs), but can also be for accounting reasons such as the effect of over or under absorption on profits.
As management accountants it is important we understand how the accounting method affects profits from one period to the next so we can clearly explain profit differences to directors and managers in the business.
Marginal costing
Any change in profit under a marginal costing system will simply occur due to a change in sales volume. If you sell more, your profit increases; if you sell less, your profit decreases.
The first step here is to calculate our contribution per unit. Contribution is calculated by deducting all variable costs from the unit’s selling price.
Selling price per unit £100
Less: Variable production cost £31
Less: Variable selling cost (20% of selling price) £20
Contribution per unit £49
From here reconciling our profit between the periods is as simple as multiplying our contribution per unit by the change in sales volume. This will give us the difference between the periods.
Marginal costing profit for 2013 £374,000500 unit increase in sales volume x £49
contribution £24,500
Marginal costing profit for 2014 £398,500
© Strategic Business Coaching Ltd 2014
Personal use only - not licensed for use on courses. 27Any unauthorised sharing or copying of this material is punishableby CIMA under the CIMA code of Ethics
CIMA P1 Course Notes www.astranti.com
Absorption costing
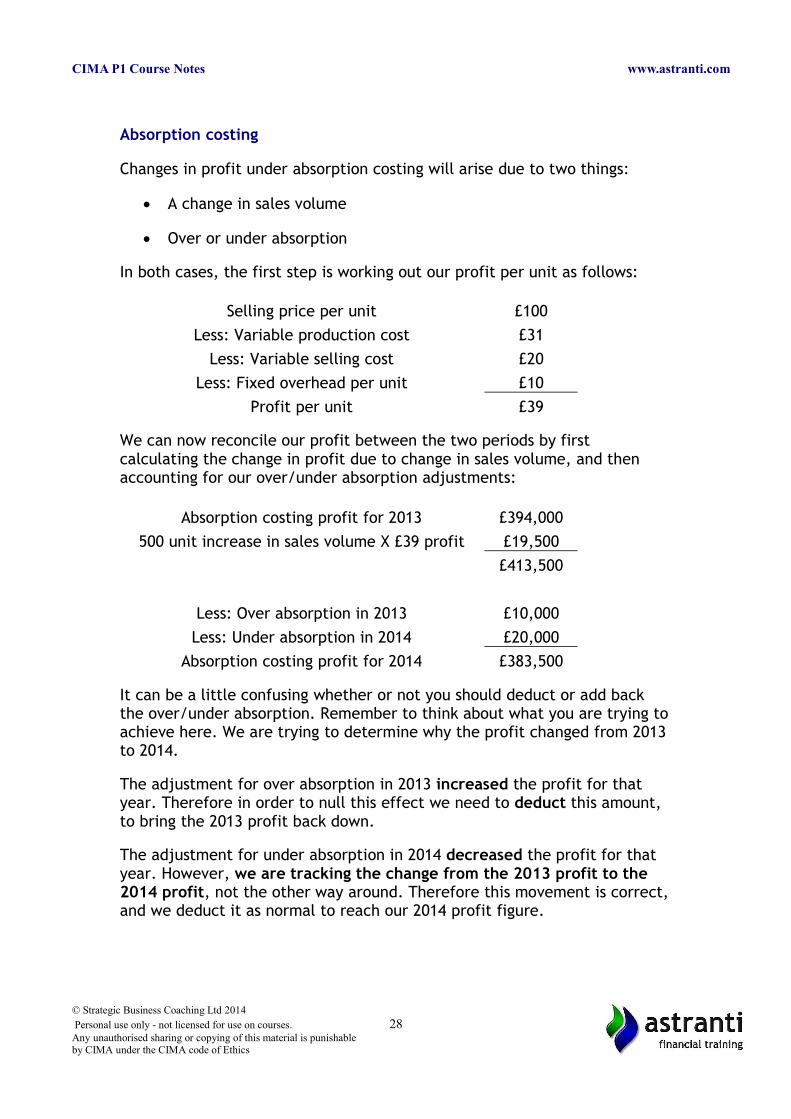
Changes in profit under absorption costing will arise due to two things:
A change in sales volume
Over or under absorption
In both cases, the first step is working out our profit per unit as follows:
Selling price per unit £100
Less: Variable production cost £31
Less: Variable selling cost £20
Less: Fixed overhead per unit £10
Profit per unit £39
We can now reconcile our profit between the two periods by first calculating the change in profit due to change in sales volume, and then accounting for our over/under absorption adjustments:
Absorption costing profit for 2013 £394,000
500 unit increase in sales volume X £39 profit £19,500
£413,500
Less: Over absorption in 2013 £10,000
Less: Under absorption in 2014 £20,000
Absorption costing profit for 2014 £383,500
It can be a little confusing whether or not you should deduct or add back the over/under absorption. Remember to think about what you are trying toachieve here. We are trying to determine why the profit changed from 2013 to 2014.
The adjustment for over absorption in 2013 increased the profit for that year. Therefore in order to null this effect we need to deduct this amount, to bring the 2013 profit back down.
The adjustment for under absorption in 2014 decreased the profit for that year. However, we are tracking the change from the 2013 profit to the 2014 profit, not the other way around. Therefore this movement is correct,and we deduct it as normal to reach our 2014 profit figure.
© Strategic Business Coaching Ltd 2014
Personal use only - not licensed for use on courses. 28Any unauthorised sharing or copying of this material is punishableby CIMA under the CIMA code of Ethics
CIMA P1 Course Notes www.astranti.com
7. Advantages and disadvantages
Absorption costing
Advantages
The key benefit of absorption costing is that it recognises both fixed and variable overheads are necessary for production to occur. This ensures that the price charged will cover both types of costs and ensure the product is sold profitably (assuming it is able to sell up to budgeted levels).
Accounting standards (IAS 2) require that cost of inventory must include at least some amount of fixed production overhead, and as such absorption costing is useful for financial accounting purposes. If this is also used for management accounting purposes both sets of accounts will be consistent, and there will be no need for reconciliation of accounts using two different bases.
Absorption costing also ensures that fixed overheads are only deducted fromprofit when the actual units are sold. This is particularly helpful for products that take several years to complete, as fixed production overheadsaren’t deducted while the items are still in production and sales are not possible. This ensures a fair allocation of costs to the period in which the sales are made (the ‘matching’ principle).
Disadvantages
However, many people argue that absorption costing does little to aid management in their decision making. Fixed costs, by their nature, do not depend on the number of units produced, so treating them as if they do maymake managers using these figures think about them in the wrong way, and as such take decisions on the basis that they are variable (when they are not!)
In fact, because absorption costing allows costs to be controlled by the levelof production rather than the costs themselves, the risk of profit manipulation arises. If management simply increases production levels, the amount of unsold stock will increase which results in a larger portion of fixed overheads being carried forward to future periods. This increases the profit of the current period, despite there being no ‘real’ increase in profit.
Marginal costing
Advantages
Some people say that marginal costing is the most useful costing method forproduction decisions, as it clearly illustrates contribution. Every cost that affects contribution can be controlled by a divisional manager and possibly
© Strategic Business Coaching Ltd 2014
Personal use only - not licensed for use on courses. 29Any unauthorised sharing or copying of this material is punishableby CIMA under the CIMA code of Ethics
CIMA P1 Course Notes www.astranti.com
improved – this gives management the incentive to improve profit by effective cost control rather than manipulating production levels.
Disadvantages
Under this system there is the very real possibility that a positive contribution gives the illusion of profitability, when in actual fact fixed costs are not covered and the operation is loss-making.
Also, IAS2 requires absorption of fixed overhead costs when valuing inventory in the financial accounts. As a result, if management accounts use marginal costing and financial accounts use absorption costing, there will be differences between the two sets of accounts. This may be confusing for managers, and it also increases the amount of work required.
© Strategic Business Coaching Ltd 2014
Personal use only - not licensed for use on courses. 30Any unauthorised sharing or copying of this material is punishableby CIMA under the CIMA code of Ethics
CIMA P1 Course Notes www.astranti.com
Free Study Texts
Free, high quality and concise online Study Texts for all subjectsStudy Text also available as a book on Amazon,
and ebook for download on Amazon and the iBookstore
Objective Test Question Packs
Objective tests linked to the Study Texts on a chapter by chapter basis –practise CIMA exam style questions as you complete each chapter of the text
Mock Exam Objective Tests
Mock Exams Tests designed to emulate the 2015 CIMA examsPerfect exam practise!
Video Tuition Guides
Comprehensive online tuition videos teaching you the full exam syllabusin a clear, concise and understandable manner
Case Study Exam Courses
Join our online courses for the operational, managerial and strategic case studyexams including:
2 Full Day Interactive online Masterclasses to support and focus your study
Full course notesCourse videos – You full guide to passing the case study exams
Exam technique video guide – designed to maximise your marks
Video analysis of the latest Preseen Case Study
3 full, computer-based mock exams based around the latest preseen anddesigned to emulate the real CIMA computer exams
Marking and with detailed feedback from our team of experienced markers
Student forum so our expert case study teams can answer all your questions
All with our unique pass guarantee scheme
Or buy any element of the course individually – it's up to you!
Find out more at www.astranti.com
© Strategic Business Coaching Ltd 2014
Personal use only - not licensed for use on courses. 31Any unauthorised sharing or copying of this material is punishableby CIMA under the CIMA code of Ethics


