

City of Kirkwood Water Distribution System
Master Plan
(Kirkwood Agreement No. 9660)
Prepared for City of Kirkwood
July 2014
300 Hunter Avenue Suite 305
St. Louis, MO 63124

WBG060614122807STL ES-1
Executive Summary Purpose of the Project The Kirkwood Water Distribution System Master Plan project is a comprehensive study and evaluation of the City’s water system infrastructure. The purpose of the project is to identify the strengths and weaknesses of the water utility so that the necessary capital improvements can be programmed providing for a reliable water system under an equitable rate structure.
Elements of the Project The Kirkwood Water Distribution System Master Plan project is divided into four distinct components, described below:
Computer Generated Hydraulic Modeling was completed of the Kirkwood distribution system including pumping stations, storage tanks, and interconnects with the Missouri American Water Company water supply.
Senior Engineer‐led Facility Assessments were completed of the major water infrastructure to assess its current physical condition and remaining useful life.
A Capital Improvement Project listing and Asset Renewal and Replacement schedule was developed to create a Master Plan to chart the necessary improvements over the next 20 years.
High level financial modeling and Water Rate Analysis were completed to identify the need for water rate increases to support the recommended master plan projects.
Results and Conclusions The results of the hydraulic modeling effort indicated that the existing water system is operating efficiently, but a few capital improvement projects are recommended. The improvements include piping projects to eliminate excessive head loss in certain pipe segments near the Swan and Fillmore Pumping Stations, and to improve fire flows near Woodbine/Magnolia. In addition, there is an opportunity to improve water quality by constructing physical improvements to the ground storage tanks to promote mixing.
The results of the facility assessment effort indicated that the utility is being operated and maintained effectively, but the average age of the system continues to degenerate. A comprehensive list of capital projects was developed to best preserve the life expectancy of assets and plan for the eventual replacement. The cost of the specifically identified capital improvement projects was approximately $8 million over the next 20 years.
The results of the master plan suggested that in addition to the specific capital improvement projects, significant renewal and replacement of the water distribution system is necessary to preserve the reliability of the utility. The Kirkwood water system is proliferated with old and small diameter pipes that need to be systematically replaced. The cost of the renewal and replacement to meet industry accepted standards for useful design life criteria suggests $42 million over the next 20 years.
The results of the financial modeling and water rate analysis are self‐evident when considering the significance of the recommended reinvestment into the water distribution system. When combining the cost of the capital improvement projects and renewals and replacements, the average reinvestment cost ranges from $2.5 ‐ $3.5 million annually when future escalation is factored. The value is substantially more than is currently being reinvested, and also much more than the current Kirkwood Strategic plan targeting $1.2 million annually. In order to capture the necessary revenue, user water rates and fees will need to increase from under $30/month to over $40/month for a typical residential customer.

CITY OF KIRKWOOD WATER DISTRIBUTION SYSTEM MASTER PLAN
ES-2 WBG060614122807STL
Much like many communities across the nation, Kirkwood has been deliberate in ramping up the reinvestment into its buried infrastructure. This observation is consistent with messaging from national organizations, such as the American Society of Civil Engineering, American Water Works Association, and the American Public Works Association, as well as the local Metro (St. Louis) Water Infrastructure Partnership. The problem is largely buried and out of sight, but it cannot remain out of mind. In order to sustain the reliability of the water system into the future, the City of Kirkwood needs to proactively and pragmatically raise the rate structure to generate new revenue to reinvest directly back into the water system.

WBG060614122807STL I
Contents Executive Summary ............................................................................................................................... ES‐1
Purpose of the Project ....................................................................................................................... ES‐1 Elements of the Project ..................................................................................................................... ES‐1 Results and Conclusions ..................................................................................................................... ES‐1
Acronyms and Abbreviations ..................................................................................................................... iii
1 Project Purpose and Objectives .................................................................................................. 1‐1
2 Hydraulic Modeling .................................................................................................................... 2‐1 2.1 Project Data ........................................................................................................................... 2‐1 2.2 Software Selection ................................................................................................................. 2‐2 2.3 Model Development and Calibration .................................................................................... 2‐3 2.4 Analysis Criteria ..................................................................................................................... 2‐3 2.5 Results and Recommendations ............................................................................................. 2‐4
3 Facility Assessment ..................................................................................................................... 3‐1 3.1 Analysis Criteria ..................................................................................................................... 3‐1 3.2 Results and Recommendations ............................................................................................. 3‐2
4 Master Planning ......................................................................................................................... 4‐1 4.1 Capital Improvement Program .............................................................................................. 4‐1 4.2 Results and Recommendations ............................................................................................. 4‐4
5 Water Rate Analysis ................................................................................................................... 5‐1 5.1 Project Data ........................................................................................................................... 5‐1 5.2 Financial Model ...................................................................................................................... 5‐1 5.3 Results and Recommendations ............................................................................................. 5‐1
Tables
2‐1 Summary of Distribution System Performance Criteria ..................................................................... 2‐3 2‐2 Average and Maximum Day Water Demand ...................................................................................... 2‐3 2‐3 Summary of Hydraulic Modeling Pipe Improvements ........................................................................ 2‐4 3‐1 List of Assessments and Evaluations ................................................................................................... 3‐1 3‐2 Benchmark Useful Design Life ............................................................................................................ 3‐1 3‐3 Capital Improvement Projects (2014 – 2034) ..................................................................................... 3‐2 4‐1 Project Funding Summary ................................................................................................................... 4‐1
Figures
2‐1 City of Kirkwood Water Distribution System Map .............................................................................. 2‐2 5‐1 Comparison of Estimated Typical Monthly Bill for 5.7 CCF and 3/4‐inch meter (FY 2015–2019) ...... 5‐2
Appendixes
A Comparison of Hydraulic Modeling Software B Model Development and Calibration C Deficiency Analysis and Recommended Improvements D Physical Assessment E Rate/Financial Impact Analysis

WBG060614122807STL III
Acronyms and Abbreviations City City of Kirkwood
CIP capital improvement program
FY fiscal year
GIS Geographical Information System
MGD millions of gallons per day
O&M operations and maintenance
psi pounds per square inch
SCADA supervisory control and data acquisition

WBG060614122807STL 1-1
SECTION 1
Project Purpose and Objectives The City of Kirkwood’s (the City) over‐arching objective for this project is to evaluate the entire water distribution system to identify strengths, weaknesses, opportunities, and threats to establish short‐ and long‐term improvements that provide for a reliable, sustainable system with a fair and equitable rate structure. The four main components of the evaluation performed include Hydraulic Modeling, Facility Assessment, Master Planning, and Water Rate Analysis. This report serves to summarize the analysis and findings of detailed investigations that were performed for each component.

WBG060614122807STL 2-1
SECTION 2
Hydraulic Modeling 2.1 Project Data The City’s water distribution system currently serves a population over 27,000 people across a service area of approximately 10 square miles. The system operates as one‐pressure zone consisting of 135 miles of piping ranging from 2 inches to 24 inches in diameter. Kirkwood is supplied wholesale water from the Missouri American Water Company through six interconnects with a contracted maximum daily rate of 9.5 million gallons per day (MGD). In addition, the distribution system consists of six pump stations, two elevated water tanks, and two ground storage tanks with a total storage capacity of 5.75 million gallons. The City maintains a detailed Geographical Information System (GIS) database of the water distribution system in ArcGIS. The major physical attributes of the Kirkwood Water Distribution System are shown in Figure 2‐1.
For this project, most of the water distribution system infrastructure data was obtained through the City’s GIS in the form of an ArcGIS map package. CH2M HILL first reviewed the GIS data to check if information necessary for building the hydraulic model was available in the database files. After the GIS data were verified and compiled, the GIS files were imported into the hydraulic model using an interface that included the software package. Data attributes, such as pipe diameter, length, and material, were included in the data import process. Service connections and hydrant lines were not included in the model.
Other necessary data that was collected and used for the development of the hydraulic modeling included:
Water meter data for 2009‐2013 provided by the City
Water billing data for 2012 provided by the City
Water purchased from Missouri American Water Company provided by the City
Supervisory control and data acquisition (SCADA) records defining diurnal demand patterns provided by the City
Hydrant pressure recording and hydrant flow tests conducted by CH2M HILL
This information was used to set up and calibrate the hydraulic model of the Kirkwood Water Distribution System. The hydraulic model was then used to perform a deficiency analysis of the existing system.

CITY OF KIRKWOOD WATER DISTRIBUTION SYSTEM MASTER PLAN
2-2 WBG060614122807STL
FIGURE 2‐1 City of Kirkwood Water Distribution System Map
2.2 Software Selection The software selection evaluation was limited to a side‐by‐side analysis of WaterGEMS versus InfoWater. The evaluation of the functionality of WaterGEMS and InfoWater was found to be very similar, but InfoWater provided a more complete software package with powerful analysis tools, such as asset management CapPlan and Unidirectional Flushing analysis. These tools are considered useful for when the City’s need arises in the future. Based on the detailed evaluation presented in Comparison of Hydraulic

SECTION 2 – HYDRAULIC MODELING
WBG060614122807STL 2-3
Modeling Software (see Appendix A), cost considerations, and a conference call conducted with Kirkwood on June 12, 2013, CH2M HILL recommended and used the InfoWater software package.
2.3 Model Development and Calibration CH2MHILL developed the City’s hydraulic model using the InfoWater software package and the project data previously described. Both steady state and extended period simulation calibrations were performed on the hydraulic model as described in City of Kirkwood Water Distribution Hydraulic Model Development and Calibration (see Appendix B). The calibrations verified that the model accurately predicted water system performance so that the model could be used to perform deficiency analyses and recommend system improvements.
2.4 Analysis Criteria To provide a reliable and sustainable water system, it was necessary to establish a benchmark for the Kirkwood Water Department that was also consistent with industry standards. System performance criteria were established in City of Kirkwood Water Distribution Deficiency Analysis and Recommended Improvements (see Appendix C) to measure the performance of the system to determine sizing of system components and the adequacy of system pressures, pipeline velocities, pipeline headloss, storage volume, and fire‐fighting capabilities. Table 2‐1 summarizes the criteria that were used.
TABLE 2‐1 Summary of Distribution System Performance Criteria
Description Performance Criteria
Water pumping requirements Capacity to meet Maximum Day Demand
System pressure, psi
Minimum pressure 35
Maximum pressure 150
During fire flow 20
Storage capacities Equal to Average Day Demand
Maximum headloss, ft/1,000 ft 10
psi = pounds per square inch
In addition to system performance criteria, it was also important to understand the consumption requirements. CH2M HILL reviewed water consumption data provided by Kirkwood and established the Average Day and Maximum Day Demand Projections. Since the City is landlocked and the historical data suggest flat consumption rates (no growth projected), the following values listed in Table 2‐2 were used as the basis for the hydraulic modeling scenarios.
TABLE 2‐2 Average and Maximum Day Water Demand
Average Day Demand (MGD)
Maximum Day Demand (MGD)
3.6 8.2
To confirm the performance and the adequacy of the water distribution system, CH2M HILL performed evaluations that included a variety of different modeling scenarios requested by the City to include Average Day, Maximum Day, Fire Flows, Redevelopment, and Water Quality (age). The scenarios allowed CH2M HILL

CITY OF KIRKWOOD WATER DISTRIBUTION SYSTEM MASTER PLAN
2-4 WBG060614122807STL
to identify system deficiencies associated with minimum system pressures, storage capacity, water velocities, pipeline headloss, supply sufficiency, pump capacity redundancy, fire flow availability, and water age.
2.5 Results and Recommendations In general, the Kirkwood water system was found to be operating efficiently. The majority of the assets are in good working condition. Model results indicated no pipe improvements are required to meet the 35‐psi minimum pressure under current water demands. Model results also indicated the current water system does contain sufficient pumping and storage capacity under current water demands. However, based upon other performance criteria, CH2M HILL did recommend some specific improvements to the City’s distribution system to include both pipe improvements and operational enhancements.
Pipe improvements were recommended to decrease headloss and improve operating efficiency. The pipe improvements were recommended where: 1) excessive headloss (greater than 10 feet/1,000 feet of pipe) was identified during the deficiency analysis; and 2) water mains that are strategically important, that is, near interconnections. Table 2‐3 lists the proposed pipe improvements.
TABLE 2‐3 Summary of Hydraulic Modeling Pipe Improvements
Areas Purpose for
Improvements Location
Existing Diameter, inches
Recommended Diameter, inches
Pipe Length, feet
Swan Pump Station
To eliminate excessive headloss in the water mains
Swan Ave and N. Kirkwood Rd 8 12 977
N. Taylor Ave 6 and 8 in parallel
12 1,093
Quan Ave 6 8 265
N. Kirkwood Rd and E. Jewel Ave 4 8 42
Fillmore Pump Station
To eliminate excessive headloss in the water mains
Big Bend Blvd 6 8 1,312
Woodbine/ Magnolia
To correct fire flow deficiency
Woodbine Ave 4 8 1,240
There are also many dead‐ends in the City’s water distribution system, which may create issues related to water age and fire flow availability. It is recommended that the City periodically investigate and take opportunity when presented to eliminate distribution system piping dead‐ends, as this will improve peak demand system pressures, reduce water age, and improve water quality and available fire flows.
While the storage tanks and reservoirs have sufficient capacity to meet the performance criteria, they do not have sufficient turn over under the current operational controls, which increases water age in the distribution system. To reduce water age, operational changes are recommended to allow water levels to drop to lower levels at the Park 1 and Park 2 reservoirs. This operational change will slightly lower the system pressures and needs to be monitored so as to not cause a system pressure drop to below 35 psi. Additional physical improvements that were recommended to reduce water age and improve water quality included the installation of inlet/outlet pipes, draft tubes, mixing systems or tank baffles to promote water mixing in the storage facilities.

WBG060614122807STL 3-1
SECTION 3
Facility Assessment The physical assessments of existing infrastructure were completed by CH2M HILL during the week of June 10‐14, 2013. The staff performing the assessments included senior civil, mechanical, instrumentation & control, and structural engineers from CH2M HILL in collaboration with Kirkwood Water Department Staff. The purpose of the inspections and assessments was to characterize the current condition of major assets so that a plan could be developed to include capital improvement projects and a renewals/replacement schedule to maximize the use of existing facilities. The details of these assessments are provided in the Facility Assessment Report (see Appendix D).
3.1 Analysis Criteria The Facility Assessment Report was prepared following visual inspections and desktop assessments of the City’s physical water system assets (except for the distribution system piping). The assets evaluated included elevated and ground storage tanks, pump stations, interconnections, fire hydrants, distribution system valves, water meters, and operations and maintenance (O&M) facilities. The types of evaluation completed are listed in Table 3‐1.
TABLE 3‐1 List of Assessments and Evaluations
Site Drainage Issues Corrosion Protection/Coatings
Site Security Electrical System Integrity
Adequate Maintenance Controls System Integrity
Structural Integrity Backup Power Supplies
Mechanical Reliability & Redundancy Seismic Event Performance Considerations
To benchmark an asset’s condition, planning level useful design lives for typical system components were developed and are summarized in Table 3‐2. These target design lives were used to determine remaining useful life, and subsequently when a planned replacement should occur.
TABLE 3‐2 Benchmark Useful Design Life
Asset Design Life (Years)
WTP Structures 75
WTP Pumps 25
Distribution System Pipes 75
Meters 25
Valves 75
Hydrants 75
Storage Tanks 75
Pump Station Structure 75
SCADA 25
Cathodic Protection 25

CITY OF KIRKWOOD WATER DISTRIBUTION SYSTEM MASTER PLAN
3-2 WBG060614122807STL
3.2 Results and Recommendations Project recommendations were developed to address each deficiency identified in the facility assessment. These projects serve to preserve the life expectancy of assets, and plan for the eventual replacement when required. The complete list of recommended capital projects resulting the facility assessment are listed in Table 3‐3.
TABLE 3‐3 Capital Improvement Projects (2014 – 2034)
Project Name Project Description
Leak Detection Study Study to locate leaks for repair
Swan PS Area Pipes 307 LF ‐ 8", 2,070 LF ‐ 12" water main
Fillmore PS Area Pipes 1,312 LF ‐ 8" water main
Woodbine Area Pipes 1,240 LF ‐ 8" water main
Facility Security Upgrades Install security cameras at 10 facilities
Marshall Road PS Mechanical Replace pumps and appurtenances
Marshall Road PS Electrical Replace electrical systems
Swan PS Mechanical Replace pumps and appurtenances
Swan PS Electrical Provide generator for backup power
Swan PS Structural Replace Swan PS building
Dougherty Ferry Tank Inspection Inspect tank (2014/2020/2023/2026/2029)
Dougherty Ferry Tank Recoating Repaint/recoat of tank (2017/2032)
Dougherty Ferry Civil Replacement of fencing
Dougherty Ferry Mechanical Replace valves and appurtenances
Dougherty Ferry Electrical Replace electrical systems
Rose Hill Tank Inspection Inspect tank (2016/2019/2022/2025/2028/2031/2034)
Rose Hill Tank Recoating Repaint/recoat of tank (2027)
Park #1 Tank Mechanical Replace pumps and appurtenances
Park #1 Tank Structural Replace Park #1 storage tank
Park #1 Tank Electrical Replace electrical systems
Park #1 Tank Inspection Inspect tank (2016/2019/2022/2025/2031/2034)
Park #1 Tank Recoating Repaint/recoat of tank (2026 ext./2028 int.)
Park #2 Tank Mechanical Replace pumps and appurtenances
Park #2 Tank Electrical Replace electrical systems
Park #2 Tank Inspection Inspect tank (2016/2019/2025/2028/2034)
Park #2 Tank Recoating Repaint/recoat of tank (2022 ext./2029 int.)
Tree Court Vault Mechanical Replace valves and appurtenances
Highland Vault Mechanical Replace valves and appurtenances
Barrett Station Mechanical Replace valves and appurtenances
Trailer Mounted Generator Provide generator for backup power
Trailcrest PS Electrical Replace electrical systems
Trailcrest PS Mechanical Replace pumps and appurtenances
Fillmore PS Electrical Replace electrical systems
Fillmore PS Mechanical Replace pumps and appurtenances

WBG060614122807STL 4-1
SECTION 4
Master Planning 4.1 Capital Improvement Program Based on the results of the hydraulic modeling analyses and the facility assessments, CH2M HILL prepared a comprehensive set of recommended system improvements to achieve Kirkwood’s objective of providing a reliable, sustainable water system. These recommended improvements were developed to meet system demands and address deficiencies (existing or forecasted) in the water system. Once the complete list of projects was identified, CH2M HILL developed order‐ of‐magnitude cost estimates for each project taking into consideration design, construction, project location and projected start date of construction. In following, CH2M HILL worked with the Kirkwood Water Department to prioritize the projects in the form of a phased capital improvement program (CIP) for 5‐, 10‐ and 20‐year periods. The projects, costs, and phased priority are provided in Table 4‐1.
TABLE 4‐1
Project Funding Summary
Capital Improvement Projects
Proposed Years of Construction
0‐5 (2014‐2019)
5‐10 (2019‐2024)
10‐15 (2024‐2029)
15‐20 (2029‐2034)
Project Name Project Description
Leak Detection Study $75,000 $75,000
Swan PS Area Pipes 307 LF ‐ 8", 2,070 LF ‐ 12" water main $542,000
Fillmore PS Area Pipes 1,312 LF ‐ 8" water main $274,000
Woodbine Area Pipes 1,240 LF ‐ 8" water main $259,000
Facility Security Upgrades
Install security cameras at 10 facilities $55,000
Marshall Road PS Mechanical
Replace pumps and appurtenances $306,400
Marshall Road PS Electrical
Replace electrical systems $115,600
Swan PS Mechanical Replace pumps and appurtenances $80,000
Swan PS Electrical Provide generator for backup power $212,400
Swan PS Structural Replace Swan PS building $249,200
Dougherty Ferry Tank Inspection
Inspect tank (2014/2020/2023/2026/2029) $30,000 $60,000 $60,000
Dougherty Ferry Tank Recoating
Repaint/recoat of tank (2017/2032) $150,300 $150,300
Dougherty Ferry Civil Replacement of fencing $4,500
Dougherty Ferry Mechanical
Replace valves and appurtenances $72,000
Dougherty Ferry Electrical
Replace electrical systems $50,000
Rose Hill Tank Inspection
Inspect tank (2016/2019/2022/2025/2028/2031/2034)
$84,000 $42,000 $84,000 $84,000

CITY OF KIRKWOOD WATER DISTRIBUTION SYSTEM MASTER PLAN
4-2 WBG060614122807STL
TABLE 4‐1
Project Funding Summary
Capital Improvement Projects
Proposed Years of Construction
0‐5 (2014‐2019)
5‐10 (2019‐2024)
10‐15 (2024‐2029)
15‐20 (2029‐2034)
Project Name Project Description
Rose Hill Tank Recoating
Repaint/recoat of tank (2027) $207,500
Park #1 Tank Mechanical
Replace pumps and appurtenances $223,500
Park #1 Tank Structural Replace Park #1 storage tank $1,703,000
Park #1 Tank Electrical Replace electrical systems $100,000
Park #1 Tank Inspection Inspect tank (2016/2019/2022/2025/2031/2034)
$180,100 $90,500 $90,500 $90,500
Park #1 Tank Recoating Repaint/recoat of tank (2026 ext./2028 int.) $452,700
Park #2 Tank Mechanical
Replace pumps and appurtenances $239,500
Park #2 Tank Electrical Replace electrical systems $100,000
Park #2 Tank Inspection Inspect tank (2016/2019/2025/2028/2034) $90,500 $90,500 $180,100 $90,500
Park #2 Tank Recoating Repaint/recoat of tank (2022 ext./2029 int.) $226,400 $226,400
Tree Court Vault Mechanical
Replace valves and appurtenances $91,500
Highland Vault Mechanical
Replace valves and appurtenances $43,000
Barrett Station Mechanical
Replace valves and appurtenances $43,000
Trailer Mounted Generator
Provide generator for backup power $58,400
Trailcrest PS Electrical Replace electrical systems $50,000
Trailcrest PS Mechanical
Replace pumps and appurtenances $43,000
Fillmore PS Electrical Replace electrical systems $50,000
Fillmore PS Mechanical Replace pumps and appurtenances $43,000
Capital Improvement Project Totals $2,805,200 $509,400 $1,746,000 $2,708,200
TABLE 4‐1 (CONTINUED)
Project Funding Summary
Renewals and Replacements
Proposed Years of Construction
Project Description
Quantity (lf/ea)
Unit Replacement Cost (lf/ea)
Est. Total Replacement
Cost
0‐5 (2014‐2019)
5‐10 (2019‐2024)
10‐15 (2024‐2029)
15‐20 (2029‐2034)
6" Water Main* 539,616 $152.45 $82,264,459 $5,484,300 $5,484,300 $5,484,300 $5,484,300
8" Water Main 164,736 $163.66 $26,960,694 $1,797,400 $1,797,400 $1,797,400 $1,797,400

SECTION 4 – MASTER PLANNING
WBG060614122807STL 4-3
TABLE 4‐1 (CONTINUED)
Project Funding Summary
Renewals and Replacements
Proposed Years of Construction
Project Description
Quantity (lf/ea)
Unit ReplacementCost (lf/ea)
Est. Total Replacement
Cost
0‐5 (2014‐2019)
5‐10 (2019‐2024)
10‐15 (2024‐2029)
15‐20 (2029‐2034)
10" Water Main 21,648 $175.67 $3,802,904 $253,500 $253,500 $253,500 $253,500
12" Water Main 52,800 $190.34 $10,049,952 $670,000 $670,000 $670,000 $670,000
14" Water Main 6,864 $195.06 $1,338,892 $89,300 $89,300 $89,300 $89,300
16" Water Main 11,616 $210.71 $2,447,607 $163,200 $163,200 $163,200 $163,200
20" Water Main 12,144 $246.94 $2,998,839 $199,900 $199,900 $199,900 $199,900
24" Water Main 528 $289.08 $152,634 $10,200 $10,200 $10,200 $10,200
Fire Hydrants 1,183 $4,369.55 $5,169,178 $344,600 $344,600 $344,600 $344,600
5/8" Meter 2,578 $134.99 $348,004 $69,600 $69,600 $69,600 $69,600
3/4" Meter 6,626 $213.73 $1,416,175 $283,200 $283,200 $283,200 $283,200
1"Meter 918 $557.24 $511,546 $102,300 $102,300 $102,300 $102,300
1 1/2" Meter 67 $686.13 $45,971 $9,200 $9,200 $9,200 $9,200
2"Meter 139 $883.16 $122,759 $24,600 $24,600 $24,600 $24,600
3"Meter 24 $13,378.66 $321,088 $64,200 $64,200 $64,200 $64,200
4"Meter 17 $13,573.60 $230,751 $92,300 $64,600 $ ‐ $46,200
6" Meter 5 $20,614.23 $103,071 $103,071 $ ‐ $ ‐ $ ‐
6" Gate Valve 7,330 $667.67 $4,894,021 $326,300 $326,300 $326,300 $326,300
8" Gate Valve 2,238 $908.79 $2,033,872 $135,600 $135,600 $135,600 $135,600
10" Gate Valve 294 $1,496.43 $439,950 $29,300 $29,300 $29,300 $29,300
12" Gate Valve 717 $1,764.90 $1,265,433 $84,400 $84,400 $84,400 $84,400
14" Gate Valve 93 $4,595.18 $427,352 $28,500 $28,500 $28,500 $28,500
16" Gate Valve 158 $8,602.00 $1,359,116 $90,600 $90,600 $90,600 $90,600
20" Gate Valve 165 $13,297.07 $2,194,017 $146,300 $146,300 $146,300 $146,300
24" Gate Valve 7 $17,588.92 $123,122 $123,100 $ ‐ $ ‐ $ ‐
Renewals and Replacements Project Totals $ 10,725,000 $ 10,471,100 $ 10,406,500 $ 10,452,700
TABLE 4‐1 (CONTINUED)
Project Funding Summary
Master Plan Project Summary
Proposed Years of Construction
0‐5 (2014‐2019)
5‐10 (2019‐2024)
10‐15 (2024‐2029)
15‐20 (2029‐2034)
CIP and Renewals and Replacements Totals $13,530,200 $10,980,500 $12,152,500 $13,160,900
CIP and Renewals and Replacements Totals ‐ Escalated** $14,126,500 $12,552,500 $15,188,400 $17,983,400
Avg. Annual Cost per period w/ Esc. $2,825,300 $2,510,500 $3,037,680 $3,596,680
* Includes all pipe 6" and smaller ** Note: Escalation is to mid‐point of construction period

CITY OF KIRKWOOD WATER DISTRIBUTION SYSTEM MASTER PLAN
4-4 WBG060614122807STL
4.2 Results and Recommendations The comprehensive prioritized list presented in Table 4‐1 is the road map for water infrastructure reinvestment for Kirkwood to follow in the years ahead. The total project costs associated with Capital Improvement Projects and Renewals/Replacement Projects served as the basis for determining the necessary revenue required to sustain the Kirkwood Water System.

WBG060614122807STL 5-1
SECTION 5
Water Rate Analysis 5.1 Project Data CH2M HILL developed a high‐level rate/financial impact model to identify the need for water rate increases as a result of on‐going costs and new costs identified during the hydraulic modeling and facility assessments. Key elements of this analysis included:
Payments to Missouri American Water Company for water treatment and transmission service under the terms of the long‐term contract currently in place
Continuation of Kirkwood’s baseline costs for administrative, customer service, and O&M of Kirkwood’s distribution system
Debt service, direct capital payments, and any O&M costs for new capital projects
The specific information that was collected for this financial model includes:
Customer characteristics (number and type of accounts, volume sales, growth projections, and water loss reduction)
Current rates and rate structure (cost per gallon, minimum monthly charges, and rate variations)
Financial history and planning documents (capital and operating budgets, audit reports, contract commitments, capital projects, and debt service schedules)
Financial performance (collection rates and bond rating)
Financial policies and related requirements (debt service coverage, pay as you go)
5.2 Financial Model Based on the data and assumptions gathered, as well as capital improvement projects and renewals/replacements identified through this project, CH2M HILL developed a high‐level rate impact model to identify how projected Kirkwood revenue requirements compare with projected revenues under current rates and charges for the water utility. Once the model was set up and validated, a total of nine evaluation scenarios were conducted to determine the rate impacts and potential rate increase scenarios. The complete details of the financial modeling and rate analysis are included in City of Kirkwood, MO Water Master Plan Rate/Financial Impact Analysis (see Appendix E).
5.3 Results and Recommendations During the detailed final development of the rate impact analysis, a total of three options were considered:
Option #1 (Planning Level) – 20‐year CIP and 75‐year Useful Life (Renewals and Replacements)
Option #2 (Implementation Level) – 20‐year CIP and 100‐year Useful Life (Renewals and Replacements)
Option #3 (Kirkwood Strategic Plan) – 20‐year CIP and Fixed Rate Useful Life Expenditure (Renewals and Replacements)
Option #2 (Implementation Level) was recommended by CH2M HILL and endorsed by the City of Kirkwood Water Department because it provided substantial progress toward renewal and replacement of aging infrastructure and the cost recovery, while providing less severe financial burden on City customers, than would be the case with Option #1 (Planning Level). Even though Option #3 (Kirkwood Strategic Plan) resulted in lower revenue requirements and therefore lower rate impacts to City customers, it was not
CITY OF KIRKWOOD WATER DISTRIBUTION SYSTEM MASTER PLAN
5-2 WBG060614122807STL
recommended because it did not provide sufficient progress toward meeting the renewal and replacement needs of the City’s aging infrastructure.
Once Option #2 was endorsed, CH2M HILL evaluated the potential rate impacts for three different scenarios:
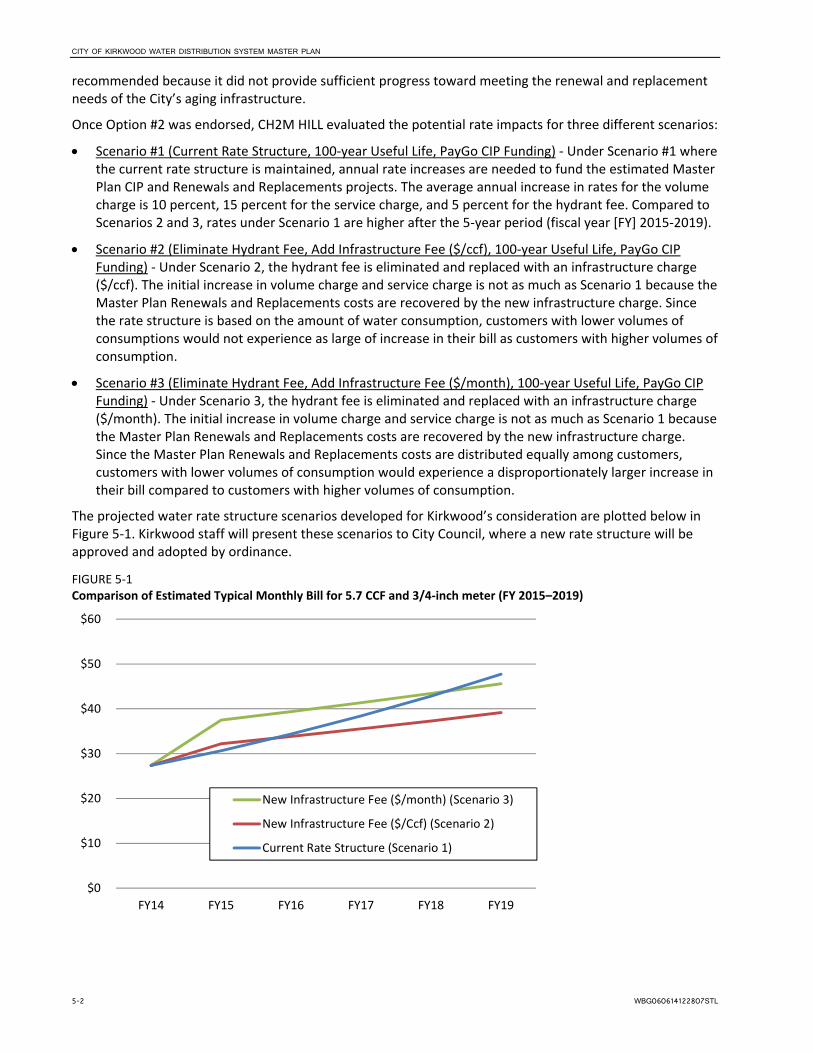
Scenario #1 (Current Rate Structure, 100‐year Useful Life, PayGo CIP Funding) ‐ Under Scenario #1 where the current rate structure is maintained, annual rate increases are needed to fund the estimated Master Plan CIP and Renewals and Replacements projects. The average annual increase in rates for the volume charge is 10 percent, 15 percent for the service charge, and 5 percent for the hydrant fee. Compared to Scenarios 2 and 3, rates under Scenario 1 are higher after the 5‐year period (fiscal year [FY] 2015‐2019).
Scenario #2 (Eliminate Hydrant Fee, Add Infrastructure Fee ($/ccf), 100‐year Useful Life, PayGo CIP Funding) ‐ Under Scenario 2, the hydrant fee is eliminated and replaced with an infrastructure charge ($/ccf). The initial increase in volume charge and service charge is not as much as Scenario 1 because the Master Plan Renewals and Replacements costs are recovered by the new infrastructure charge. Since the rate structure is based on the amount of water consumption, customers with lower volumes of consumptions would not experience as large of increase in their bill as customers with higher volumes of consumption.
Scenario #3 (Eliminate Hydrant Fee, Add Infrastructure Fee ($/month), 100‐year Useful Life, PayGo CIP Funding) ‐ Under Scenario 3, the hydrant fee is eliminated and replaced with an infrastructure charge ($/month). The initial increase in volume charge and service charge is not as much as Scenario 1 because the Master Plan Renewals and Replacements costs are recovered by the new infrastructure charge. Since the Master Plan Renewals and Replacements costs are distributed equally among customers, customers with lower volumes of consumption would experience a disproportionately larger increase in their bill compared to customers with higher volumes of consumption.
The projected water rate structure scenarios developed for Kirkwood’s consideration are plotted below in Figure 5‐1. Kirkwood staff will present these scenarios to City Council, where a new rate structure will be approved and adopted by ordinance.
FIGURE 5‐1 Comparison of Estimated Typical Monthly Bill for 5.7 CCF and 3/4‐inch meter (FY 2015–2019)
$0
$10
$20
$30
$40
$50
$60
FY14 FY15 FY16 FY17 FY18 FY19
New Infrastructure Fee ($/month) (Scenario 3)
New Infrastructure Fee ($/Ccf) (Scenario 2)
Current Rate Structure (Scenario 1)

Appendix A Comparison of Hydraulic Modeling Software

KIRKWOOD SOFTWARE EVALUATION TM_FINAL_061813.DOCX 1
F I N A L T E C H N I C A L M E M O R A N D U M
Comparison of Hydraulic Modeling Software
PREPARED FOR: City of Kirkwood
PREPARED BY: CH2M HILL
DATE: June 18, 2013
Software Selection
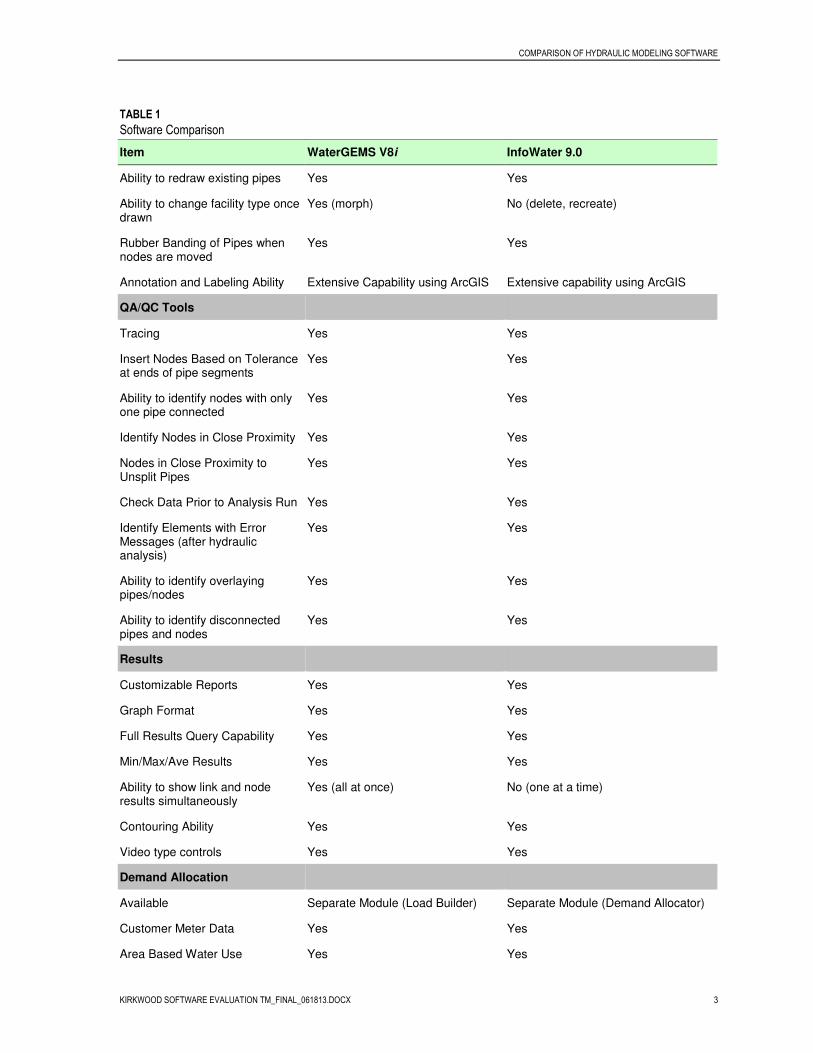
The first step in model development is the selection of modeling software that provides the necessary tools for hydraulic analysis of the distribution system in a cost efficient manner. The purpose of this memorandum is to review two commercially-available hydraulic modeling software packages, WaterGEMS and InfoWater, to help determine which modeling software should be utilized for the City of Kirkwood’s distribution system model. The following table provides a comparison of WaterGEMS and InfoWater.
TABLE 1
Software Comparison
Item WaterGEMS V8i InfoWater 9.0
Basic Information
Vendor Bentley (USA) Innovyze (USA)
Hydraulic Engine Hybrid - EPANET Hybrid - EPANET
Version of EPANET 2 2
Portable Yes Yes
Licensing Stand alone/server Stand alone/server
Platform Stand alone/
ArcGIS (license required)
ArcGIS (license required)
Documentation Good Good
Diagnostic Messages Good Good
Documented Messages Good Good
Extended-period Simulation Yes Yes
Water Quality Analysis Included Included
Support Full Full
Model Management
Scenario Management Yes Yes
Scenario Manager Supports Inheritance
Yes Yes

COMPARISON OF HYDRAULIC MODELING SOFTWARE
KIRKWOOD SOFTWARE EVALUATION TM_FINAL_061813.DOCX 2
TABLE 1
Software Comparison
Item WaterGEMS V8i InfoWater 9.0
Alternatives Yes Yes
Alternatives Support Inheritance Yes Yes
Sub-setting of Model Yes (checkboxes) Yes, Domain, Facility Managers (queries, query sets)
Scenario Comparison Input Input and Output
Active link between Scenario Manager and Results
Yes Yes
Fire Flow
Ability to run multiple fire flow locations
Yes Yes
Ability to set different fire flow rates in single simulation
Yes Yes
Ability to see fire flow pipe results Yes Yes
Ability to subset the searching range of the fire flow analysis
No Yes
Import/Export
ODBC Capability Import/Export Import/Export
EPANet V1 and V2 Import/Export V1/V2 Import/Export V2
Other Model Formats Import, Cybernet 2, Kypipe 3 H2ONet, H2OMap
Shape files Import/Export Import/Export
Other Import Formats DXF, Coverages, Geodatabases, Access, Excel, dBase, Lotus, FoxPro
Delimited Text, Coverages, Access, Excel, dBase, Lotus, FoxPro
Database
Ability to add new attributes Yes Yes
Ability to sort ascending/ descending
Yes Yes
Ability to find Yes Yes
Ability to create SQL statements to calculate or set values
Yes Yes
Summary Statistics Yes Yes
Group Editing Yes Yes
Copy - Paste Copy only Yes
Prototyping of default values Yes Yes
Graphical editing
COMPARISON OF HYDRAULIC MODELING SOFTWARE
KIRKWOOD SOFTWARE EVALUATION TM_FINAL_061813.DOCX 3
TABLE 1
Software Comparison
Item WaterGEMS V8i InfoWater 9.0
Ability to redraw existing pipes Yes Yes
Ability to change facility type once drawn
Yes (morph) No (delete, recreate)
Rubber Banding of Pipes when nodes are moved
Yes Yes
Annotation and Labeling Ability Extensive Capability using ArcGIS Extensive capability using ArcGIS
QA/QC Tools
Tracing Yes Yes
Insert Nodes Based on Tolerance at ends of pipe segments
Yes Yes
Ability to identify nodes with only one pipe connected
Yes Yes
Identify Nodes in Close Proximity Yes Yes
Nodes in Close Proximity to Unsplit Pipes
Yes Yes
Check Data Prior to Analysis Run Yes Yes
Identify Elements with Error Messages (after hydraulic analysis)
Yes Yes
Ability to identify overlaying pipes/nodes
Yes Yes
Ability to identify disconnected pipes and nodes
Yes Yes
Results
Customizable Reports Yes Yes
Graph Format Yes Yes
Full Results Query Capability Yes Yes
Min/Max/Ave Results Yes Yes
Ability to show link and node results simultaneously
Yes (all at once) No (one at a time)
Contouring Ability Yes Yes
Video type controls Yes Yes
Demand Allocation
Available Separate Module (Load Builder) Separate Module (Demand Allocator)
Customer Meter Data Yes Yes
Area Based Water Use Yes Yes

COMPARISON OF HYDRAULIC MODELING SOFTWARE
KIRKWOOD SOFTWARE EVALUATION TM_FINAL_061813.DOCX 4
TABLE 1
Software Comparison
Item WaterGEMS V8i InfoWater 9.0
Population or Land Use Based Water Use
Yes Yes
Calibration
Available Separate Module (Darwin Calibrator) suite license required
Separate Module (Calibrator) suite license required
Genetic Algorithm Engine Yes Yes
Skeletonization
Available Separate Module (Skelebrator) Separate Module (Skeletonizer)
Pipe Removal Based on Attribute(s)
Yes Yes
Dead-end Removal Yes Yes
Series Pipe Merging Yes Yes
Parallel Pipe Merging Yes Yes
Reallocated Demands with all Processes
Yes Yes
Miscellaneous
Undo Function Partial, through editor interface or use SA
Two step (recall) process for deleted elements only
Variable Frequency Drives Yes Yes
Report Quality Graphics Extensive using ArcGIS functionality Extensive using ArcGIS functionality
Pump/Valve Element Type Point Point
SCADA Interface Separate Module (ScadaConnect) Yes (already in package)
Hot-Link Yes Yes
Pipeline Costing Tool Yes Yes
Engineering Tables Provided Yes Yes
Hydraulic Calculator No Yes
Reference Formats SHP, Coverage, DWG, DXF, DGN, Geodatabase, TIF, MrSID
DGN, DWG, DXF, SHP, MI, AI Coverages, TIF, Geodatabases
Ability to thematically map reference files
Extensive using ArcGIS functionality Extensive using ArcGIS functionality
Model Coordinate Transformation Extensive using ArcGIS functionality Extensive using ArcGIS functionality
TIN overlay capability Extensive using ArcGIS functionality Extensive using ArcGIS functionality
Use GRID or other DEM/DTM for elevation data
Extensive using ArcGIS functionality Extensive using ArcGIS functionality
Vulnerability Assessment Separate Module (WaterSafe) Separate Module (Protector)

COMPARISON OF HYDRAULIC MODELING SOFTWARE
KIRKWOOD SOFTWARE EVALUATION TM_FINAL_061813.DOCX 5
TABLE 1
Software Comparison
Item WaterGEMS V8i InfoWater 9.0
Genetic Algorithm for Pump Improvements
No Yes
Genetic Algorithm for Pipe Improvements
Separate Module (Darwin Designer) Separate Module (Designer)
Add-on Module Matrix
Calibration Yes (Darwin Calibrator) Yes (Calibrator)
Demand Allocation Yes (Load Builder) Yes (Demand Allocator)
Skeletonization Yes (Skelebrator) Yes (Skeletonizer)
Vulnerability Assessment Yes (WaterSAFE) Yes (Protector)
Pump Operation/Energy Analysis Yes Yes
Water Quality Calibration No Yes (Water Quality Calibrator)
Pipe Optimization Yes (Darwin Designer) Yes (Designer)
SCADA Interface Yes (ScadaConnect) Yes
Unidirectional Flushing Yes (Flushing Simulation)* Yes (InfoWater UDF)
Asset Management and Capital Planning
Limited Yes, CapPlan
*: requires all-pipe model to include valves and hydrants
Cost
• The cost of WaterGEMS with unlimited links is approximately $22,000 plus $4,800 for license support.
• The cost of InfoWater with unlimited links is approximately $17,000 plus $2,000 for license support.
• The cost of InfoWater with 6,000 links is approximately $10,000 plus $2,000 for license support.
Summary and Recommendation
As displayed by the comparison table, the functionality of WaterGEMS and InfoWater is very similar, but InfoWater provides a more complete software package with powerful analysis tools, such as asset management CapPlan and UDF analysis. These tools will be useful when the City’s need arise in the future. Based on this technical memorandum, cost considerations, and conference call conducted with Kirkwood on June 12, 2013, CH2M HILL recommends and will use the InfoWater software package to develop and calibrate City’s model. CH2M HILL will not purchase or provide software to the City of Kirkwood as part of this project.

Appendix B Model Development and Calibration

1
T E C H N I C A L M E M O R A N D U M
City of Kirkwood Water Distribution Hydraulic Model Development and Calibration
PREPARED FOR: City of Kirkwood
PREPARED BY: CH2M HILL
DATE: October 22, 2013 The City of Kirkwood desires to develop a hydraulic model of the water distribution system to identify system strengths and weaknesses and establish short and long-term improvements, which provide for a reliable, sustainable system with a fair and equitable rate structure. This technical memorandum summarizes the model development process and the outcome of hydraulic model calibration.
1. Data Collection and System Overview
The City’s water distribution system currently serves a population of over 27,000 people across a service area of approximately 10 square miles. The system operates as one pressure zone consisting of 153 miles of piping ranging from 2” to 24”. Kirkwood is supplied water from the Missouri American Water Company through six (6) interconnects with a contracted maximum daily rate of 9.5 million gallons per day. In addition, the system operates off of six (6) pump stations, two (2) elevated storage tanks, and two (2) ground storage tanks, with a total storage capacity of 5.63 million gallons. The City maintains a detailed Geographical Information System database of the water distribution system in ArcGIS.
Figure 1 provides an overview map of the City’s water distribution system, including interconnections, pump stations, and storage facilities. Table 1 and Table 2 present a summary of the City’s distribution system major facilities. The pump station control rules in Table 1 are programmed into the SCADA system to turn the pumps on and off automatically. The control rules were provided to CH2M HILL by the City and were later confirmed during the field trip on May 8th, 2013. The listed set points are for normal operation; however there are separate set points for summer-time seasonal operations. All the set points are adjustable, if needed.

CITY OF KIRKWOOD WATER DISTRIBUTION HYDRAULIC MODEL DEVELOPMENT AND CALIBRATION
2
FIGURE 1
City of Kirkwood Water Distribution System Map

CITY OF KIRKWOOD WATER DISTRIBUTION HYDRAULIC MODEL DEVELOPMENT AND CALIBRATION
3
TABLE 1
City of Kirkwood Interconnections
Interconnections No. of Pumps Horsepower, HP Design Point Controls
Barret None - - Open when Rose Hill tank level < 98’
Close when Rose Hill tank level > 98.5’
Fillmore 1 5 208gpm @ 56’ On when Rose Hill tank level < 96’
Off when Rose Hill tank level > 98’
Highland None - - Open when Dougherty Ferry tank level < 146’
Close when Dougherty Ferry tank level > 146.5’
Marshall 4 100 1,390gpm @ 176’
1st on when Rose Hill tank level < 95’
1st off when Rose Hill tank level > 93.5’
2nd on when Rose Hill tank level < 93.5’
2nd off when Rose Hill tank level > 92.5’
3rd on when Rose Hill tank level < 92.5’
3rd off when Rose Hill tank level > 91.5’
Park 1 2 100 2,000gpm @ 160’ On when Rose Hill tank level < 89.5’
Off when Rose Hill tank level > 91.8’ 1 75 1,500gpm @ 155’
Park 2 3 100 1,675gpm @ 170’ On when Rose Hill tank level < 88.5’
Off when Rose Hill tank level > 91’
Swan
2 40 1,000gpm @ 90’ On when Dougherty Ferry tank level < 141’
Off when Dougherty Ferry tank level > 142’
2 15 400gpm @ 90’ On when Dougherty Ferry tank level < 142’
Off when Dougherty Ferry tank level > 143’
Trailcrest 1 3 208gpm @ 34’ Open when Dougherty Ferry tank level < 145’
Close when Dougherty Ferry tank level > 146’
TABLE 2
City of Kirkwood Storage Facilities
Name Type Tank Size, MG Ground Elevation Overflow Elevation
Dougherty Ferry Elevated Tank 0.25 632.5’ 780.75’
Rose Hill Elevated Tank 0.5 680.25’ 780.75’
Park 1 Ground Reservoir 2.38 618.5’ 667.5’
Park 2 Ground Reservoir 2.5 590’ 632’
Total Storage Capacity 5.63

CITY OF KIRKWOOD WATER DISTRIBUTION HYDRAULIC MODEL DEVELOPMENT AND CALIBRATION
4
2. Model Development
2.1 Model Software The first step in model development is the selection of modeling software that provides the necessary tools for hydraulic analysis of the distribution system in a cost efficient manner. CH2M HILL developed a technical memorandum titled “Comparison of Hydraulic Modeling Software” at the beginning of the project. In this memo, CH2M HILL reviewed two commercially-available hydraulic modeling software packages, WaterGEMS and InfoWater. As a result of the process, InfoWater was selected as the model software.
2.2 Model Development and GIS Integration
Data used in building a hydraulic model can be obtained from various sources, such as record drawings, maps, or a geographic information system (GIS). For this project, most of the water distribution system infrastructure data were obtained through the City’s GIS in the form of a ArcGIS map package.
CH2M HILL first reviewed the GIS data to check if information necessary for building the hydraulic model was available in the database files. After the GIS data were verified and compiled, the GIS files were imported into InfoWater using a model interface included with the software package. Data attributes, such as pipe diameter, length, and material were included in the data import process. Service connections and hydrant lines were not included in the model.
Once the data were imported into InfoWater, the network connectivity was examined and verified before finalizing the layout of the model. During this process, CH2M HILL reviewed and corrected connectivity issues in the model. The disconnections were typically caused by missing junctions, incorrectly joined pipes, disconnected junctions, and overlapping pipes. CH2M HILL also reviewed and excluded the abandoned pipes from the model.
At the time of model development, the City identified some new pipes that were not yet in the GIS and provided a marked-up map of these pipes. CH2M HILL manually digitized these new pipes and included them into the model.
2.3 Demand Development and Allocation
Accurately estimating existing water demands on the City’s distribution system is key in developing a capital improvements plan that identifies proper solutions to real system deficiencies. Water demands for existing conditions were developed to simulate existing operations and to identify deficiencies experienced under existing demands.
2.3.1 Demand Development
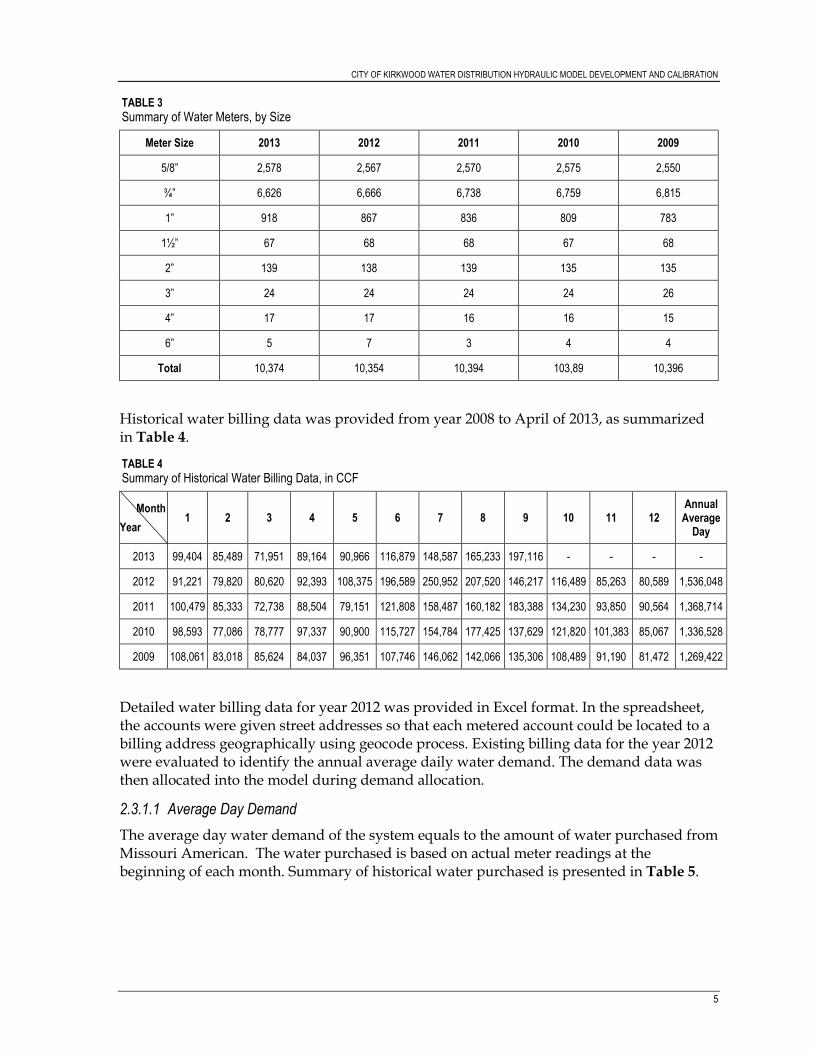
The City provided CH2M HILL with a summary of water meters for year 2009 - 2013 for all residential, commercial, and industrial accounts. The total number of water meters had little change from year to year, as presented in Table 3.
CITY OF KIRKWOOD WATER DISTRIBUTION HYDRAULIC MODEL DEVELOPMENT AND CALIBRATION
5
TABLE 3
Summary of Water Meters, by Size
Meter Size 2013 2012 2011 2010 2009
5/8” 2,578 2,567 2,570 2,575 2,550
¾” 6,626 6,666 6,738 6,759 6,815
1” 918 867 836 809 783
1½” 67 68 68 67 68
2” 139 138 139 135 135
3” 24 24 24 24 26
4” 17 17 16 16 15
6” 5 7 3 4 4
Total 10,374 10,354 10,394 103,89 10,396
Historical water billing data was provided from year 2008 to April of 2013, as summarized in Table 4.
TABLE 4
Summary of Historical Water Billing Data, in CCF
Month
Year 1 2 3 4 5 6 7 8 9 10 11 12
Annual Average Day
2013 99,404 85,489 71,951 89,164 90,966 116,879 148,587 165,233 197,116 - - - -
2012 91,221 79,820 80,620 92,393 108,375 196,589 250,952 207,520 146,217 116,489 85,263 80,589 1,536,048
2011 100,479 85,333 72,738 88,504 79,151 121,808 158,487 160,182 183,388 134,230 93,850 90,564 1,368,714
2010 98,593 77,086 78,777 97,337 90,900 115,727 154,784 177,425 137,629 121,820 101,383 85,067 1,336,528
2009 108,061 83,018 85,624 84,037 96,351 107,746 146,062 142,066 135,306 108,489 91,190 81,472 1,269,422
Detailed water billing data for year 2012 was provided in Excel format. In the spreadsheet, the accounts were given street addresses so that each metered account could be located to a billing address geographically using geocode process. Existing billing data for the year 2012 were evaluated to identify the annual average daily water demand. The demand data was then allocated into the model during demand allocation.
2.3.1.1 Average Day Demand
The average day water demand of the system equals to the amount of water purchased from Missouri American. The water purchased is based on actual meter readings at the beginning of each month. Summary of historical water purchased is presented in Table 5.

CITY OF KIRKWOOD WATER DISTRIBUTION HYDRAULIC MODEL DEVELOPMENT AND CALIBRATION
6
TABLE 5
Summary of Historical Water Purchased, in CCF
Month
Year 1 2 3 4 5 6 7 8 9 10 11 12
Annual Average Day
2013 116,871 96,808 103,204 107,571 124,140 146,540 193,542 202,610 223,917 - - - -
2012 119,610 105,034 116,757 114,330 175,423 175,378* 220,554* 235,483 134,397 129,269 109,906 112,590 1,748,731
2011 136,219 129,135 113,530 113,380 126,550 164,485 207,013 220,625 160,895 158,621 109,717 103,670 1,743,840
2010 120,949 116,954 123,154 127,970 149,882 157,479 197,360 205,376 141,839 156,316 116,086 124,194 1,737,559
2009 118,528 103,841 106,564 105,401 138,945 151,293 163,657 168,638 147,297 121,818 117,380 111,655 1,555,017
*Data Estimated.
2.3.1.2 Maximum Day Demand
Maximum daily demand is the maximum anticipated demand during a 24-hour period within any given year. The ratio of maximum daily demand to average annual demand is referred to as the “maximum daily demand factor.” This factor usually varies from 1.2 to 3.0.
Using SCADA records, the total daily volumes of water at interconnections for year 2012 were reviewed to determine the maximum daily demand factor. High flowrates were recorded during the period of June 28, 2012 to July 1, 2012, with daily rates exceeding 8.0 MGD. A maximum day pumping of 8.74 MGD was identified on June 30, 2012. Therefore the maximum day to average day demand factor is calculated at 2.3.
2.3.1.3 Non-Revenue Water
Non-revenue water is the difference between water produced and water billed. It is calculated by subtracting the amount of water billed from the amount of water produced. Non-revenue water can be caused by:
• Physical losses due to leakage in the system,
• Administrative losses due to illegal connections and under registration of the water meters, and
• Activities such as hydrant flushing, fire training, etc.
Based on year 2012 water billing data provided by the City, the total water billed for the year was 1,536,048 CCF. Therefore, the average daily water demand billed across the system was calculated to be 3.2 million gallons a day (MGD) in 2012.
During the same time period, the total purchased flow was 1,748,731 CCF. Therefore, average daily purchased flow was calculated to be 3.6 MGD. The percentage of non-revenue water for the distribution system was calculated to be approximately 12 percent in 2012 (January 1 to December 31).
The City tracked non-revenue water by fiscal year (FY), which is April 1st through March 31st of the following year. The City tracks water purchased by actual meter reads instead of billing by Missouri American.
Historically by fiscal year, the non-revenue water has been:

CITY OF KIRKWOOD WATER DISTRIBUTION HYDRAULIC MODEL DEVELOPMENT AND CALIBRATION
7
Fiscal Year Non-Revenue Water, % Notes
FY14 19.1% April 2013 to September
FY13 10.6% June and July data were estimated
FY12 20.2%
FY11 23.6%
FY10 21.4%
These values for fiscal year differ from those for calendar year slightly due to the difference in definition of fiscal year and calendar year, as well as an abnormally high demand summer of 2012.
2.3.2 Demand Patterns
A demand pattern reflects the variations in water usage over a 24-hour period. After a demand pattern has been established, a clear correlation between demand magnitude and the time of day can be noted, demonstrating the maximum and minimum demand periods throughout a typical day. The demand pattern depends upon the type of development that the water distribution system supplies. Commonly used development types include commercial, industrial, and residential.
For the City of Kirkwood, where water users are predominantly residential, one demand pattern was developed based on SCADA records. A mass balance was conducted to include flowrates at all interconnections as well as take into consideration of the tank level changes. The diurnal pattern included peaks in the morning and evening, as shown in Figure 2. In this figure, the Y-axis is the pattern multiplier, which is defined as instantaneous demand divided by average day demand.
FIGURE 2
City of Kirkwood Demand Pattern
0
0.2
0.4
0.6
0.8
1
1.2
1.4
1.6
0 1 2 3 4 5 6 7 8 9 101112131415161718192021222324
De
ma
nd
Mu
ltip
lie
r
Hour

CITY OF KIRKWOOD WATER DISTRIBUTION HYDRAULIC MODEL DEVELOPMENT AND CALIBRATION
8
2.3.3 Demand Allocation
After average daily demands, maximum daily demands, and demand pattern were developed to represent existing conditions in the distribution system, the demands were then added to the model by allocating them to the nearest model nodes using the Demand Allocator tool in InfoWater.
CH2M HILL collected year 2012 water billing records from the City in Excel format. Using geocoding process, a water account GIS shapefile was generated based on the water billing address in the Excel spreadsheet. The water demand data in the Excel spreadsheet was linked to the GIS water accounts using GIS tools.
Over 99 percent of the water billing records could be successfully allocated through above-mentioned method, which is considered very high by industry standards. This also represented over 96 percent of the total water billed. The 1 percent water accounts that could not be allocated were treated as non-revenue water. Those accounts could not be allocated as these accounts had addresses that could not be located in the street GIS files.
The non-revenue water was allocated equally to each model node in the system to represent random water losses that may occur in all parts of the system.
3. Field Testing
The purpose of the field data collection task is to collect distribution system information that could be used in the development of a well-calibrated hydraulic model. Once the model was calibrated, it would accurately simulate the distribution system and can be used to assess the distribution system under varying demand conditions.
For the City of Kirkwood, CH2M HILL developed a field testing program which included hydrant pressure recording and hydrant flow tests. Hydrant pressure recording was used to monitor pressure variations at different locations in the system. Hydrant flow tests are the most common method of collecting hydraulic model calibration data. During hydrant flow tests, a hydrant is open to stress the system, and the flow through an open hydrant is measured along with the corresponding drop in pressure in the residual hydrant.
3.1 Hydrant Pressure Recording Tests
Since the City of Kirkwood did not have any permanent pressure monitoring equipment installed throughout the system, it was necessary to determine system wide pressure fluctuations through the installation of pressure measuring and recording devices at strategic hydrant locations.
A total of five hydrants were selected as test hydrants (designated as H-1 through H-5) for installation of continuous pressure recording equipment. The number and location of the proposed test hydrants were selected based on the following:
• To provide a system-wide coverage without being too close to the pump stations and tanks as pressure and level data are recorded at these locations and additional pressure information in the close vicinity would be redundant.
CITY OF KIRKWOOD WATER DISTRIBUTION HYDRAULIC MODEL DEVELOPMENT AND CALIBRATION
9
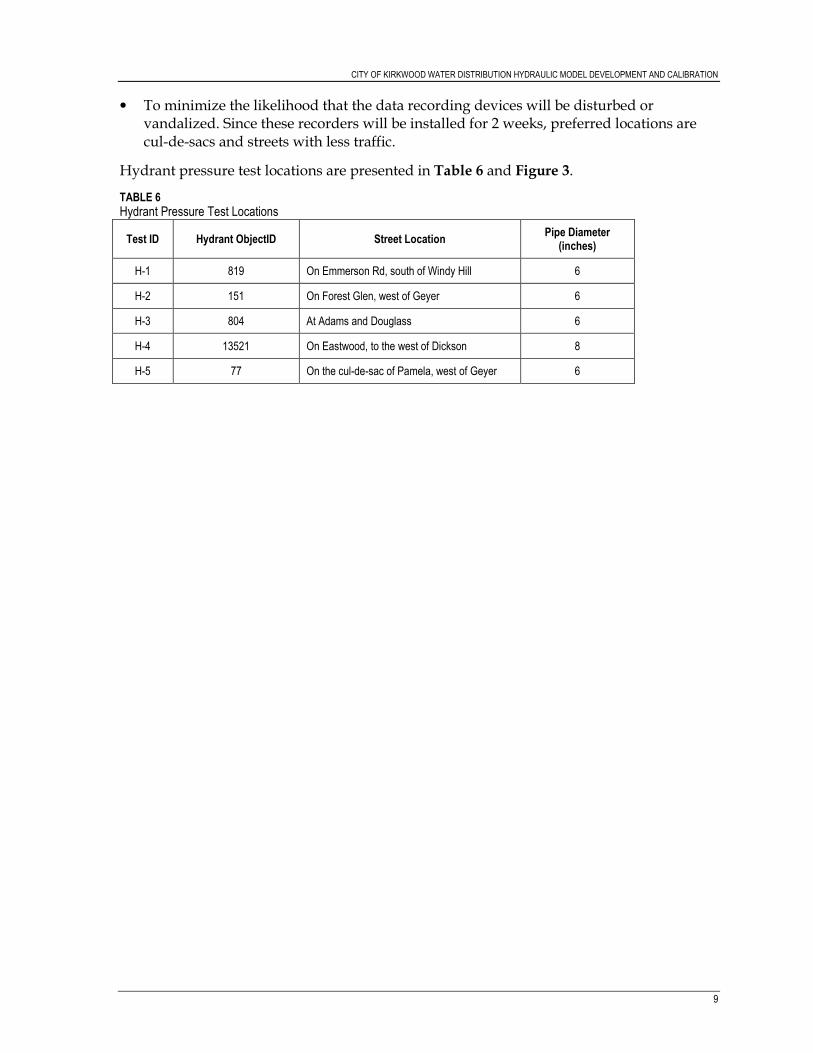
• To minimize the likelihood that the data recording devices will be disturbed or vandalized. Since these recorders will be installed for 2 weeks, preferred locations are cul-de-sacs and streets with less traffic.
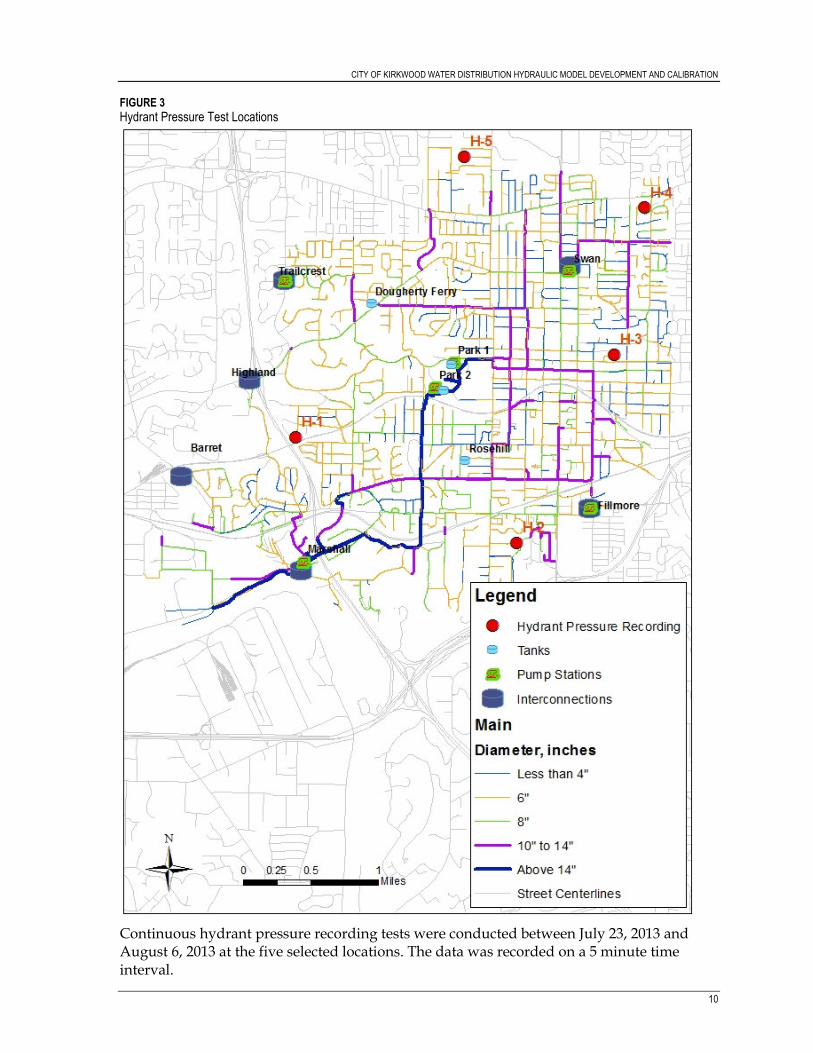
Hydrant pressure test locations are presented in Table 6 and Figure 3.
TABLE 6
Hydrant Pressure Test Locations
Test ID Hydrant ObjectID Street Location Pipe Diameter
(inches)
H-1 819 On Emmerson Rd, south of Windy Hill 6
H-2 151 On Forest Glen, west of Geyer 6
H-3 804 At Adams and Douglass 6
H-4 13521 On Eastwood, to the west of Dickson 8
H-5 77 On the cul-de-sac of Pamela, west of Geyer 6
CITY OF KIRKWOOD WATER DISTRIBUTION HYDRAULIC MODEL DEVELOPMENT AND CALIBRATION
10
FIGURE 3
Hydrant Pressure Test Locations
Continuous hydrant pressure recording tests were conducted between July 23, 2013 and August 6, 2013 at the five selected locations. The data was recorded on a 5 minute time interval.

CITY OF KIRKWOOD WATER DISTRIBUTION HYDRAULIC MODEL DEVELOPMENT AND CALIBRATION
11
3.2 Hydrant Flow Tests
Hydrant flow tests are among the most common methods of collecting hydraulic model calibration data. During hydrant flow tests, the system is stressed during known hydraulic baseline conditions. Two hydrants (flow hydrant and residual hydrant) are located on a straight run of pipe preferably without any tees or interconnections in between. Prior to opening the flow hydrant, pressure is measured at both the flow and residual hydrant. This data are used to confirm that the model is accurately simulating conditions prior to stressing the system. The flow hydrant is then opened and discharge flow is metered. Residual pressure is also recorded at the non-flowing test hydrant.
Hydrant flow tests should be conducted throughout the system to achieve thorough coverage of the distribution system. To adequately stress the system, it is preferred to have a minimum 10 psi pressure drop at the test hydrant (non-flowing), if possible, during the flow test. Tests should generally be conducted away from any supply points, such as storage tanks and pump stations, or there may be very little change in pressure during the flow test. To achieve sufficient pressure drop, the tests should also be conducted on fire hydrants connecting to smaller water lines (6 or 8 inches), as smaller diameter pipes are more sensitive to system stresses than larger pipes.
One critical factor for conducting successful hydrant flow tests is obtaining accurate boundary conditions from SCADA records during the tests. This information includes the following:
• Tank levels
• Pump status (on/off)
• Pump station discharge pressure and flow rates
• Valve status and settings
The testing equipment included Pitot gauge and two pressure gauges (Figure 4).
FIGURE 4
Use of Pitot Gauge and Pressure Gauge during Hydrant Flow Tests

CITY OF KIRKWOOD WATER DISTRIBUTION HYDRAULIC MODEL DEVELOPMENT AND CALIBRATION
12
A total of ten hydrant flow tests were conducted for this project. The field data sheet used to record the testing results was developed specifically for this project and attached in Appendix A.
The following criteria were used in selecting hydrant flow test locations:
• Locations provided a thorough, system-wide coverage.
• Points of supply (storage tanks, pump stations, and interconnections) were avoided as much as possible.
• Pipe diameters were small (6 or 8 inches) in areas where tests were conducted.
• Two hydrants without multiple connections were chosen, when possible.
The following Table 7 and Figure 5 present the hydrant flow test locations.
TABLE 7
Hydrant Flow Test Locations
Test ID Hydrant ObjectID Street Location Pipe Diameter
(inches)
FF-1 171 and 92 Winesap, to the west of Lindman 6
FF-2 2 and 18182 Scottsdale, between Ruth and Geyer 6
FF-3 3528 and 14744 Warrenton, to the east of Dickson 6
FF-4 402 and 404 Dougherty, to the north of Dougherty Ferry 6
FF-5 942 and 943 Argonne, between Woodlawn and Dickson 6
FF-6* 901 and 513 Hillcrest, north of Woodbine (relocated to Clay during retest) 6
FF-7* 300 and 534 Orchard, to the west of Greyer (relocated to Geyer during retest) 6
FF-8 143 and 759 Maybrook, to the north of Big Bend 6
FF-9 268 and 585 Adams and Ballas 6
FF-10 911 and 601 Coulter, to the east of Ballas 6
*: These two tests were relocated to nearby hydrants.

CITY OF KIRKWOOD WATER DISTRIBUTION HYDRAULIC MODEL DEVELOPMENT AND CALIBRATION
13
FIGURE 5
Proposed Hydrant Flow Test Locations

CITY OF KIRKWOOD WATER DISTRIBUTION HYDRAULIC MODEL DEVELOPMENT AND CALIBRATION
14
The procedures for the hydrant flow tests are as follows:
1. Synchronize the clock that will be used in the field tests with the SCADA system clock.
2. Confirm which facilities are in operation and which facilities are inactive (e.g., interconnections, pump stations, pressure-reducing valves (PRVs), etc.).
3. At each location, designate the flow hydrant and the test hydrant.
4. Slowly open each of the fire hydrants to be used in the test and flush hydrant laterals. Allow the hydrant to discharge until water is clear. Slowly close the fire hydrant. Both flow and test hydrants should be flushed.
5. Measure and record the static pressure at both the flow and test hydrants using pressure gages. Note the time.
6. Remove a cap from the flow hydrant(s). Measure and record the inside diameter of the open hydrant.
7. Feel the inner edge of the open hydrant butt and determine the hydrant coefficient. This coefficient measures the degree to which water flow is impeded and used in determining the flow from the hydrant.
8. Attach the Pitot gage to the flow hydrant.
9. Slowly open the flow hydrant fully and let the stream adjust to a clear and steady flow. Record the time and the residual pressure at the test hydrant. Record the Pitot pressure at the flowing hydrant. Ideally, the residual pressure in the test hydrant should have dropped 10 psi.
10. Shut off both hydrants slowly so as not to cause water hammer in the main.
11. Allow the pressure to stabilize at both the test and flow hydrants and once again record the static pressure after the test is complete. This may be helpful to indicate if there was a change to the baseline conditions such as a pump being turned on or off during the test.
12. Monitor and record SCADA information during the tests in the Field Data Collection Sheet. Data will be required from every facility in operation at the time of the tests in the pressure zone being tested. It is preferable that the same facilities are operating for all of the tests in a given zone.
Ten hydrant flow tests were conducted on July 24, 2013. After initial model calibration, two sites (Tests 6 and 7) were repeated on September 5, 2013, to verify test results.
4. Model Calibration
Once the model has been developed from the City’s GIS system, current demands determined and allocated, and the field testing program was completed, the model is set to be calibrated hydraulically. This involves a two-step process, one a steady-state model calibration and the second an extended period simulation calibration.

CITY OF KIRKWOOD WATER DISTRIBUTION HYDRAULIC MODEL DEVELOPMENT AND CALIBRATION
15
4.1 Steady-State Model Calibration The field data used for the steady-state hydraulic calibration were collected during the ten hydrant-flow tests. The test locations were distributed throughout the distribution system to provide system-wide coverage.
During model calibration, model results were compared to field data. The comparisons included pressures at the flow and residual hydrants for each field test during both static and flow conditions. Fire hydrants were modeled as nodes at the appropriate locations. Hydrant nozzles were assumed to be 2 feet higher than the ground elevation.
The initial model run was conducted without a hydrant flowing to compare the static pressures. Then the hydrant flow rate data from field testing was input into the model as a demand at the flowing hydrant, and model-predicted pressure was compared with the field-tested residual pressure.
InfoWater’s Calibrator module was used to calibrate the hydraulic model. The calibration process adjusted the Hazen-Williams coefficient C-factors in pipes in the vicinity of the test hydrant location to match the field data. The hydraulic model calibration approach is as follows:
1. Exam pipe attributes and group the pipes based on pipe material and installation period information.
The City provided pipe material and date of installation data on the water mains. CH2M HILL carefully studied the data and established 5 pipe groups. Pipes within the same group would have the same material and similar diameter and age, therefore assumed to have similar C values.
2. Assign each pipe group a C value range.
After the pipes were grouped, CH2M HILL assigned an empirical C value range to each group.
3. Set up scenarios and boundary conditions.
For static calibration purposes, 10 scenarios were set up in the model, one for each flow test. Boundary conditions during each test, such as pump status and water levels in tanks and reservoirs, were collected from the City’s SCADA records and entered into the corresponding model scenario.
4. Run the Calibrator module and export the calibrated C values.
The InfoWater Calibrator module was then run and the C values were calibrated, one scenario at a time. During calibration, the Calibrator ran hundreds to thousands of iterations until the error was within the preset limit. During the simulation process, the Calibrator also automatically calculated the C values that best fit the measured versus modeled data within the predefined range. After each calibration run, calibrated C values were exported into the model. Average calibrated C values are included in Table 8.

CITY OF KIRKWOOD WATER DISTRIBUTION HYDRAULIC MODEL DEVELOPMENT AND CALIBRATION
16
TABLE 8
Pipe Groups and Calibrated C Values
Group Number
Material Diameter Installation Period
Average Calibrated C Values
1 CIP <=6" Pre 1970 72
2 CIP 8, 10, 12, 14 1970-1980 97
3 CIP 16, 20, 24 1950 101
4 DIP any 1970-2008 129
5 PVC any 2008- 149
Table 9 presents a comparison of field data and model results for the flow and residual hydrants. The model achieved a high level of steady-state calibration.
After initial model calibration, two sites (Tests 6 and 7) were repeated on September 5, 2013, to verify test results. Both of the test results could not be duplicated in the model as the residual pressure was extremely low (11 psi and 10 psi, respectively) with very small amount of flow at the flow hydrants (410 gpm and 70 gpm, respectively). Especially in Test 7, only 70 gpm was available at the flowing hydrant. This could be caused by one of the following factors:
• Closed valves at the vicinity of the hydrant locations
• Hydrant laterals are shown as 6” in GIS, but in reality are smaller
• Extensive corrosion in the pipes, causing effective pipe diameter to be less
On September 5, 2013, tests 6 and 7 locations were moved to nearby hydrants during retest. Test 6 was moved to two hydrants on Clay Road, and Test 7 was moved to Geyer Road. The results of re-tests were more reasonable and were used in model calibration.

CITY OF KIRKWOOD WATER DISTRIBUTION HYDRAULIC MODEL DEVELOPMENT AND CALIBRATION
17
TABLE 9
Summary of Hydrant Flow Test Results
Test ID Flow
Condition Hydrant
Time of Test
Pressure, psi
Flowrate, gpm
Modeled Pressure,
psi
% Difference
Numeric Difference,
psi
Test #1
Static Residual
7/24/13 1:50 PM
55
57 -3.1% -1.7
Flow 56
54 4.3% 2.4
Flow Residual 46
46 0.7% 0.3
Flow
960
Test #2
Static Residual
7/24/13 3:00 PM
76
78 -2.9% -2.2
Flow 70
69 1.1% 0.8
Flow Residual 62
61 1.2% 0.7
Flow
915
Test #3
Static Residual
7/24/13 3:40 PM
72
74 -2.1% -1.5
Flow 78
78 0.6% 0.5
Flow Residual 38
39 -2.6% -1.0
Flow
865
Test #4
Static Residual
7/24/13 2:20 PM
50
51 -2.1% -1.0
Flow 56
54 3.2% 1.8
Flow Residual 27
27 -1.1% -0.3
Flow
785
Test #5
Static Residual
7/24/13 8:26 AM
48
48 0.8% 0.4
Flow 50
49 1.5% 0.7
Flow Residual 30
31 -2.1% -0.6
Flow
700
Test #6 Retest
Static Residual
9/5/13 10:13 AM
44
46 -3.5% -1.5
Flow 45
46 -1.2% -0.5
Flow Residual 32
32 -0.5% -0.2
Flow
610
Test #7 Retest
Static Residual
9/5/13 11:20 AM
53
56 -6.4% -3.4
Flow 58
59 -1.1% -0.6
Flow Residual 34
35 -3.5% -1.2
Flow
785
Test #8
Static Residual
7/24/13 12:32 PM
77
75 2.5% 1.9
Flow 80
76 5.4% 4.3
Flow Residual 31
30 1.9% 0.6
Flow
740
Test #9
Static Residual
7/24/13 1:15 PM
122
122 0.0% 0.0
Flow 126
124 1.2% 1.5
Flow Residual 90
89 1.2% 1.0
Flow
1,270
Test #10
Static Residual
7/24/13 10:46 AM
63
63 0.6% 0.4
Flow 60
58 3.7% 2.2
Flow Residual 54
55 -1.2% -0.6
Flow
865

CITY OF KIRKWOOD WATER DISTRIBUTION HYDRAULIC MODEL DEVELOPMENT AND CALIBRATION
18
4.2 Extended Period Simulation Model Calibration
After the model was calibrated for steady-state conditions, the next step was to calibrate the extended period simulation (EPS) aspect of the model. Unlike steady-state calibration, which matches field data taken from a snapshot in time, EPS calibration verifies that the model accurately replicates the function of the distribution system over a period of 7 days, or 168 hours. The EPS calibration verifies that the correct operation controls of the system are included in the model. The field data used for EPS calibration were pressure recorder data during the week of July 29 through August 4, 2013. Tank level data were obtained from the City’s SCADA records.
Accurate EPS calibration of the City’s distribution system was demonstrated by three factors: pressure recorder data, tank level, and tank fill and draft behavior. In all cases, the model corresponded well compared with the field data. Figures 6 through Figure 14 demonstrate modeled results vs. field results on the five pressure recorders and tank/reservoir levels. Please note a water level of 2.3 feet is equivalent to 1 psi.
FIGURE 6
Model Results vs. Pressure Recorder Data – Location #1 at Emerson and Lily
0
20
40
60
80
100
120
0 24 48 72 96 120 144 168
Pre
ssu
re,
psi
Hours
Pressure Recorder Modeled

CITY OF KIRKWOOD WATER DISTRIBUTION HYDRAULIC MODEL DEVELOPMENT AND CALIBRATION
19
FIGURE 7 Model Results vs. Pressure Recorder Data – Location #2 on Forest Glen
FIGURE 8 Model Results vs. Pressure Recorder Data – Location #3 at Adams and Douglass
0
10
20
30
40
50
60
0 24 48 72 96 120 144 168
Pre
ssu
re,
psi
Hours
Pressure Recorder Modeled
0
10
20
30
40
50
60
70
0 24 48 72 96 120 144 168
Pre
ssu
re,
psi
Hours
Pressure Recorder Modeled

CITY OF KIRKWOOD WATER DISTRIBUTION HYDRAULIC MODEL DEVELOPMENT AND CALIBRATION
20
FIGURE 9 Model Results vs. Pressure Recorder Data – Location #4 at Eastwood and Dickson
FIGURE 10
Model Results vs. Pressure Recorder Data – Location #5 on Pamela Cul-de-sac
0
10
20
30
40
50
60
70
80
90
0 24 48 72 96 120 144 168
Pre
ssu
re,
psi
Hours
Pressure Recorder Modeled
0
10
20
30
40
50
60
70
80
90
0 24 48 72 96 120 144 168
Pre
ssu
re,
psi
Hours
Pressure Recorder Modeled

CITY OF KIRKWOOD WATER DISTRIBUTION HYDRAULIC MODEL DEVELOPMENT AND CALIBRATION
21
FIGURE 11 Model Results vs. SCADA Data – Tank Level at Park 1
FIGURE 12 Model Results vs. SCADA Data – Tank Level at Park 2
0
5
10
15
20
25
30
35
40
45
50
0 24 48 72 96 120 144 168
Wa
ter
Lev
el,
ft
Time
SCADA Modeled
0
5
10
15
20
25
30
35
40
45
0 24 48 72 96 120 144 168
Wa
ter
Lev
el,
ft
Time
SCADA Modeled

CITY OF KIRKWOOD WATER DISTRIBUTION HYDRAULIC MODEL DEVELOPMENT AND CALIBRATION
22
FIGURE 13 Model Results vs. SCADA Data – Tank Level at Rose Hill
FIGURE 14 Model Results vs. SCADA Data – Tank Level at Dougherty Ferry
0
20
40
60
80
100
120
0 24 48 72 96 120 144 168
Wa
ter
Lev
el,
ft
Time
SCADA Modeled
0
50
100
150
200
0 24 48 72 96 120 144 168
Wa
ter
Le
ve
l, f
t
Time
SCADA Modeled

CITY OF KIRKWOOD WATER DISTRIBUTION HYDRAULIC MODEL DEVELOPMENT AND CALIBRATION
23
Appendix A Hydrant Flow Test Field Data Sheet

CITY OF KIRKWOOD WATER DISTRIBUTION HYDRAULIC MODEL DEVELOPMENT AND CALIBRATION
24

Appendix C Deficiency Analysis and
Recommended Improvements

1
T E C H N I C A L M E M O R A N D U M
City of Kirkwood Water Distribution Deficiency Analysis and Recommended Improvements
PREPARED FOR: City of Kirkwood
PREPARED BY: CH2M HILL
DATE: November 11, 2013 The purpose of this technical memorandum is to summarize the outcome of the model runs used to identify deficiencies in the City of Kirkwood’s water distribution system. Once an understanding of the deficiencies throughout the distribution system for different operating scenarios and demand conditions are identified and causes understood, improvements are recommended to correct the deficiencies.
The model used for the analysis was the calibrated extended period simulation (EPS) model. Water demand used to conduct the deficiency analysis included both maximum day demands (MDD), and maximum day demands plus fire flows (20 locations).
The findings of the analysis include a review of system performance with respect to pressure, water velocity/headloss, water age, as well as evaluations of the storage and pumping capacities.
1. Distribution System Performance Criteria
System performance criteria are established to improve the safety and satisfaction of City water system customers. These criteria include variables used to determine sizing of the water system network components and cover aspects of water production, system pressures, pipeline velocities, pipeline headloss, storage volumes, and fire fighting capabilities. The system performance criteria used for the City of Kirkwood’s system are summarized in Table-1.
TABLE 1
Summary of Distribution System Performance Criteria
Description Performance Criteria
Water pumping requirements Capacity to meet Maximum Day Demand
System pressure, psi
• Minimum pressure 35
• Maximum pressure 150
• During Fire flow 20
Storage capacities Equal to average day demand
Maximum headloss, ft/1,000 ft 10
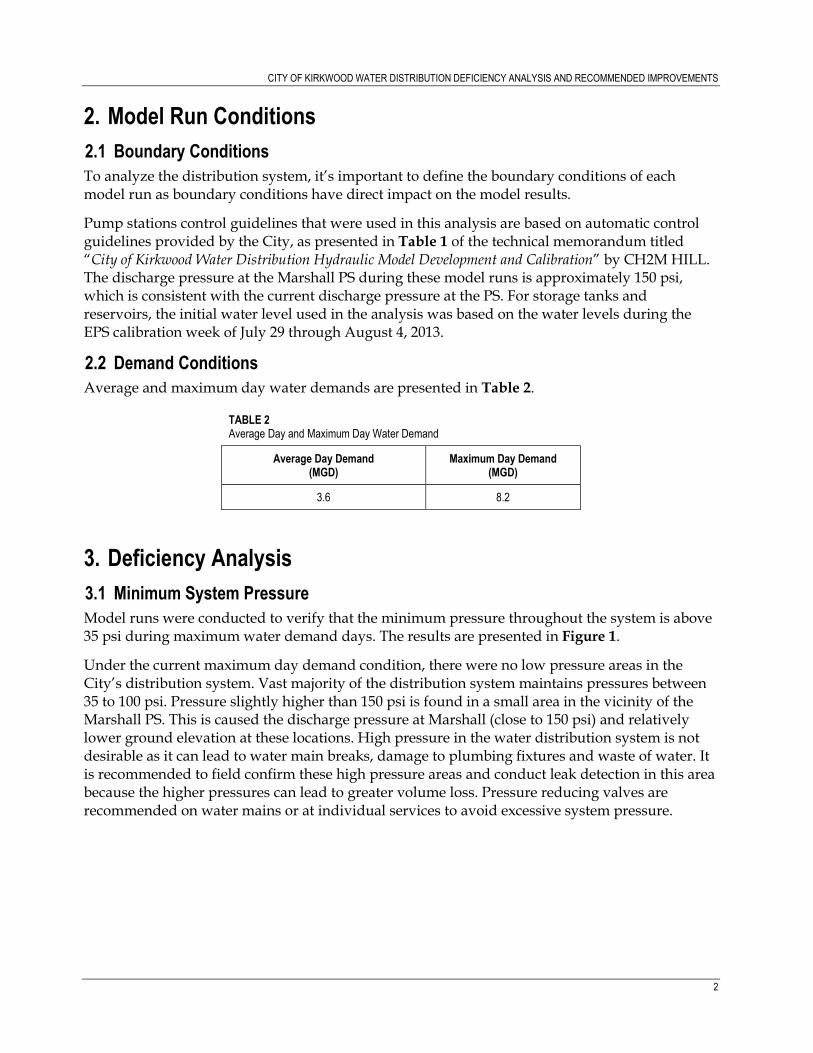
CITY OF KIRKWOOD WATER DISTRIBUTION DEFICIENCY ANALYSIS AND RECOMMENDED IMPROVEMENTS
2
2. Model Run Conditions
2.1 Boundary Conditions To analyze the distribution system, it’s important to define the boundary conditions of each model run as boundary conditions have direct impact on the model results.
Pump stations control guidelines that were used in this analysis are based on automatic control guidelines provided by the City, as presented in Table 1 of the technical memorandum titled “City of Kirkwood Water Distribution Hydraulic Model Development and Calibration” by CH2M HILL. The discharge pressure at the Marshall PS during these model runs is approximately 150 psi, which is consistent with the current discharge pressure at the PS. For storage tanks and reservoirs, the initial water level used in the analysis was based on the water levels during the EPS calibration week of July 29 through August 4, 2013.
2.2 Demand Conditions
Average and maximum day water demands are presented in Table 2.
TABLE 2 Average Day and Maximum Day Water Demand
Average Day Demand (MGD)
Maximum Day Demand (MGD)
3.6 8.2
3. Deficiency Analysis
3.1 Minimum System Pressure
Model runs were conducted to verify that the minimum pressure throughout the system is above 35 psi during maximum water demand days. The results are presented in Figure 1.
Under the current maximum day demand condition, there were no low pressure areas in the City’s distribution system. Vast majority of the distribution system maintains pressures between 35 to 100 psi. Pressure slightly higher than 150 psi is found in a small area in the vicinity of the Marshall PS. This is caused the discharge pressure at Marshall (close to 150 psi) and relatively lower ground elevation at these locations. High pressure in the water distribution system is not desirable as it can lead to water main breaks, damage to plumbing fixtures and waste of water. It is recommended to field confirm these high pressure areas and conduct leak detection in this area because the higher pressures can lead to greater volume loss. Pressure reducing valves are recommended on water mains or at individual services to avoid excessive system pressure.

CITY OF KIRKWOOD WATER DISTRIBUTION DEFICIENCY ANALYSIS AND RECOMMENDED IMPROVEMENTS
3
FIGURE 1
Minimum System Pressure during MDD

CITY OF KIRKWOOD WATER DISTRIBUTION DEFICIENCY ANALYSIS AND RECOMMENDED IMPROVEMENTS
4
3.2 Velocities and Headloss
Water velocities and pressure headloss are directly related for a specific diameter pipe and flow. For a given pipe diameter, the greater the flow of water, the higher the velocity of the water, and the higher the pressure headloss per unit length of pipe. Headloss is also associated with the roughness of the pipe (Hazen-Williams C values), the lower the C values, the higher the headloss. Headloss per 1,000 ft of pipe is commonly used as the performance criteria to determine appropriate pipe sizing. For the City’s system, a maximum headloss of 10 ft headloss/1,000 ft pipe is the criterion.
The 10 ft headloss/1,000 ft pipe criterion simply helps determine areas in the system where trends of excessive headloss are occurring, which is mostly in older areas and in smaller diameter pipes. High headloss in the water distribution piping normally indicates reduced operating efficiency of the system as much of the energy is consumed to overcome the friction loss, but high headloss alone doesn’t necessarily indicate a problem unless the area also experiences low pressure.
Pipes with headloss higher than 10 ft/1,000 ft pipe are highlighted in red, as presented in Figure 2.

CITY OF KIRKWOOD WATER DISTRIBUTION DEFICIENCY ANALYSIS AND RECOMMENDED IMPROVEMENTS
5
FIGURE 2
Headloss (ft/1000 ft of pipe) during MDD

CITY OF KIRKWOOD WATER DISTRIBUTION DEFICIENCY ANALYSIS AND RECOMMENDED IMPROVEMENTS
6
3.3 Storage Analysis
Sufficient storage must be maintained under average day, maximum day, and fire-flow conditions throughout the distribution system. The storage facilities will provide diurnal balancing of water use and allowance for fire-fighting or other emergencies. There are many acceptable, industry standard, methods for determining adequate storage in the system. One common way of determining adequate storage in the system is that it is equal to the average daily demand over 24 hours. This is the standard used for the City’s storage analysis.
Storage facilities in the City include two elevated tanks and two ground reservoirs, with a total capacity of 5.63 MG. The existing average day demand for the City of Kirkwood is 3.6 MGD. This value was derived from averaging daily water pumping rates for the year 2012.
Table 3 presents the results of the storage analysis.
TABLE 3 Storage Analysis
Tanks and Reservoirs Type Storage Capacity (MG)
Dougherty Ferry Elevated Tank 0.25
Rose Hill Elevated Tank 0.5
Park 1 Ground Reservoir 2.38
Park 2 Ground Reservoir 2.5
Total Storage Capacity 5.63
Average Day Demand, MGD 3.6
This analysis demonstrates that the City has adequate storage for existing demand conditions. The overall system storage requirement is met since the combined system storage of 5.63 MG exceeds the average day demand of 3.6 MGD.
3.4 Pumping Capacity
To adequately supply the water distribution system, firm capacity of the pump stations should exceed the maximum day demand. The City has sufficient pumping capacity to meet the current demand. Detailed pump station data is presented in Table 1 of the technical memorandum titled “City of Kirkwood Water Distribution Hydraulic Model Development and Calibration” by CH2M HILL.
3.5 Water Age
Water age was analyzed to determine if there are areas of excessive water age, as low chlorine residuals and greater disinfection by product formation potential in the distribution system are common results of high water age.
Disinfection by product (DBP) formation is directly related to water age. In general, increased water age and higher water temperature lead to higher DBP (TTHM and HAA) concentrations. Therefore, water age is often used as a surrogate for DBP concentrations. Similar to water age, high DBP sites are often located at downstream of storage tanks, near the ends of the distribution system, and at dead-ends where water flow is very low or stagnant.

CITY OF KIRKWOOD WATER DISTRIBUTION DEFICIENCY ANALYSIS AND RECOMMENDED IMPROVEMENTS
7
A water age analysis requires longer duration run times to allow the system to reach equilibrium. This long simulation time is required because every node in the model initially has a water age of zero. Therefore, the simulation must be run long enough to allow water from the source to reach the extents of the system in the model and water age to reach equilibrium. This can be observed by tracking the water age in the tanks.
Figure 3 illustrates under current controls, most of the tanks/reservoirs did not reach equilibrium within 480 hours of run time, which is an indication of excessive water age. The modeled water age range of each tank/reservoir is as follows:
• Dougherty Ferry: 136 to 144 hours
• Rose Hill: 349 to 356 hours
• Park 1: 297 to 318 hours
• Park 2: 281 to 303 hours
As shown in Figure 3, under current controls, Rose Hill tank has the highest water age of over 300 hours, and Dougherty Ferry tank has the lowest water age of 136 to 144 hours. According to the American Water Works Association* (AWWA), three to five day (72 to 120 hour) complete water turnover is recommended for water distribution storage tanks (AWWA, 2006, Water Chlorination/Chloramination Practices and Principles, AWWA Manual M20, Second Edition). Therefore, the turnover time for all four tanks exceeds the recommended 120 hour limit by various degrees.

CITY OF KIRKWOOD WATER DISTRIBUTION DEFICIENCY ANALYSIS AND RECOMMENDED IMPROVEMENTS
8
FIGURE 3
Water Age at Tanks and Reservoirs
The distribution system water age under current average day condition is displayed in Figure 4. Modeling results indicated water age longer than 5 days (120 hours) is found in the central part of the City, which is consistent with the long water age found at the storage tanks and reservoirs. Long water age is also associated with the fact that the City’s system contains higher than required storage capacities. It is important to note that long water age (up to run time) can occur at model nodes at the end of a pipe where no (or very little) demand is assigned. In this situation, the age of water located within a dead end pipe is equal to model run time.
0
50
100
150
200
250
300
350
400
0 24 48 72 96 120 144 168 192 216 240 264 288 312 336 360 384 408 432 456 480
Wa
ter
Ag
e,
Ho
ur
Run Time, Hour
Dougherty Park 1 Park 2 Rose Hill
AWWA recommended maximum
water age of 120 hours

CITY OF KIRKWOOD WATER DISTRIBUTION DEFICIENCY ANALYSIS AND RECOMMENDED IMPROVEMENTS
9
FIGURE 4
Water Age Map

CITY OF KIRKWOOD WATER DISTRIBUTION DEFICIENCY ANALYSIS AND RECOMMENDED IMPROVEMENTS
10
3.6 Future Development Analysis
The City provided two locations of potential future development, which were analyzed in the model to confirm sufficient water service is available to serve the sites.
Since there are no specific plans on file on the developments, assumptions were made to calculate the water demands. The two developments are located at:
• Kirkwood/Manchester area: office/commercial use
• Taylor/Monroe/Fillmore area: mixed use of multi-story residential and office/commercial
3.6.1 Unit Demand Factor
To estimate the water consumption for the future development, CH2M HILL established a unit demand factor for commercial users.
CH2M HILL reviewed the historical water billing data for commercial users for the past 3 years (2010 through 2012). Summary of the result is presented in Table 4.
TABLE 4
Historical Water Billing Data by User Type, in CCF
Year Commercial Residential WL Total
2010 338,971 954,199 43,411 1,336,581
2011 362,120 965,964 40,686 1,368,770
2012 413,116 1,075,727 47,205 1,536,048
The water billing data presented a slight upward trend over the past 3 years; therefore, to be conservative, year 2012 billing data was used. Year 2012 billed consumption by commercial customers is 413,116 CCF, or 0.85 MGD on average day. To include water loss of 15%, total consumption by commercial customers (including water loss) is 1.0 MGD on average day.
CH2M HILL reviewed the parcel GIS files for the St. Louis County and identified 1,083.5 acres of commercial/industrial land within the City of Kirkwood, as presented in Table 5.

CITY OF KIRKWOOD WATER DISTRIBUTION DEFICIENCY ANALYSIS AND RECOMMENDED IMPROVEMENTS
11
TABLE 5
Summary of City of Kirkwood Landuse
Landuse Code Number of Parcels Area, Acres
Commercial* 311 251.7
Common Ground* 42 40.3
Duplex/Townhome 45 23.1
Industrial/Utility* 109 97.5
Institution* 84 434.6
Multi-Family 137 210.0
Park* 7 124.9
Recreation* 4 134.6
Single Family 9,432 3208.4
Vacant/Agriculture 498 296.3
Total 10,669 4821.4
*: included in calculating commercial/industrial acres of 1,083.5 acres.
Therefore, a unit demand factor of 923 gpd/acre for commercial/industrial users was calculated by dividing the 1.0 MGD water demand by 1,083.5 acres. For planning purposes, a unit demand factor is rounded up to 1,000 gpd/acre, which is in line with commonly used values.
3.6.2 Kirkwood/Manchester Area
Location of this development is presented in Figure 5.

CITY OF KIRKWOOD WATER DISTRIBUTION DEFICIENCY ANALYSIS AND RECOMMENDED IMPROVEMENTS
12
FIGURE 5
Future Development - Kirkwood/Manchester Area
Total available area for the development is 15.4 acres, as calculated by GIS. Average day water demand for the development is calculated to be 15,400 gpd, or 10.7 gpm, by multiplier 15.4 acres by the unit demand factor of 1,000 gpd/acre.
A maximum day water demand of 24.6 gpm (maximum day/ average day factor of 2.3 multiplied by 10.7 gpm) was entered into the model to represent the new development. The model result indicated slight pressure decrease in this area, but remained between 60-65 psi throughout the day.
Therefore, it was concluded that the current distribution system is capable of supplying the additional demand at this location.

CITY OF KIRKWOOD WATER DISTRIBUTION DEFICIENCY ANALYSIS AND RECOMMENDED IMPROVEMENTS
13
3.6.3 Taylor/Monroe/Fillmore Area
Location of this development is presented in Figure 6.
FIGURE 6
Future Development - Kirkwood/Manchester Area
Total available area for the development is 16.9 acres. Average day water demand for the development is calculated to be 16,900 gpd, or 11.7 gpm, by multiplier 16.9 acres by the unit demand factor of 1,000 gpd/acre.
A maximum day water demand of 27.0 gpm (maximum day/ average day factor of 2.3 multiplied by 11.7 gpm) was entered into the model to represent the new development. The model result indicated slight pressure decrease in this area, but remained between 63-67 psi throughout the day.
Therefore, it was concluded that the current distribution system is capable of supplying the additional demand at this location.

CITY OF KIRKWOOD WATER DISTRIBUTION DEFICIENCY ANALYSIS AND RECOMMENDED IMPROVEMENTS
14
3.7 Fire-Flow Analysis The ability of the system to provide nominal fire-flow at two different locations selected by City of Kirkwood was analyzed. Both locations are single family residential areas, and they are located at:
• Fillmore/ Clinton Area
• Woodbine/ Magnolia Area
Locations of the fire flow analysis are presented in Figure 7 and Figure 8.
FIGURE 7
Fire Flow Location - Fillmore/ Clinton Area

CITY OF KIRKWOOD WATER DISTRIBUTION DEFICIENCY ANALYSIS AND RECOMMENDED IMPROVEMENTS
15
FIGURE 8
Fire Flow Location - Woodbine/ Magnolia Area
Since there is no common time of the day when fires would occur most frequently, the fire-flow analysis was conducted during an average hour of the maximum day demand. Fire flow model runs were conducted to calculate available fire flow to maintain a residual pressure of 20 psi. Results of the fire flow analysis are summarized in Table 6.
Please note the model run results represent a snapshot of the system, and the results are directly related to the operational conditions of the system, such as water demand, pump on/off and tank filling/draining situations.

CITY OF KIRKWOOD WATER DISTRIBUTION DEFICIENCY ANALYSIS AND RECOMMENDED IMPROVEMENTS
16
TABLE 6
Fire Flow Analysis Results
Fire Location Static Pressure, psi Available Flow at 20
psi, gpm Discussion
Fillmore/ Clinton Area 66 3,580
• At the intercession of 10” and 6” pipe
• Available fire flow at 20 psi: 5,500 gpm.
• See Figure 9 for fire flow data of this area. Available fire flow decreases as it moves away from the 10” on Fillmore.
Woodbine/Magnolia Area 63 470
• 4” pipe on Woodbine, unable to provide sufficient fire flow.
• Recommend upsize to 8” and connect to 8” on Andrews Ave and 12” on Geyer Rd. Approximately 1,240 ft.
FIGURE 9
Available Fire Flow at 20 psi - Fillmore/Clinton Area

CITY OF KIRKWOOD WATER DISTRIBUTION DEFICIENCY ANALYSIS AND RECOMMENDED IMPROVEMENTS
17
3.8 4” and 6” Mains Like many utilities in the US, the City of Kirkwood faces challenges of aging water mains and roughly 100 miles (26.3 miles of 4-inch and 75.9 miles of 6-inch), or over 66 percent, of the City’s distribution water lines are older 4-inch and 6-inch diameter pipes. This is a very high percentage of old and small diameter pipes. Table 7 summarizes the water main diameter data for the City’s distribution system.
TABLE 7
Summary of Water Mains – by Pipe Diameter
Diameter, inch Length, mile % of Total
4” or less 26.3 17.1%
6 75.9 49.5%
8 31.2 20.4%
10 4.1 2.7%
12 10.0 6.5%
14 1.3 0.8%
16 2.2 1.4%
20 2.3 1.5%
24 0.1 0.1%
Total Miles 153.3
100%
To replace all of the 4” or less and 6” water mains with a minimum 8-inch diameter pipe at one time is impractical due to the high costs involved. However, it is recommended that the City develop a program to replace existing water mains that are 6-inch or smaller with 8-inch pipe in a proactive and pragmatic fashion. This will allow the City to take a systematic approach in upgrading the existing water system infrastructure over time. Priority should be given to the 26 miles of mains that are 4” or smaller; even though these mains may not cause low pressure problems right now, they are too small to provide adequate fire flow during emergency situations. Any such renewals and replacement program should take into consideration and coordinate with other City projects, such as road work.
4. Recommended Improvements
In general, the City of Kirkwood’s water system is operated in an efficient fashion. The majority of the water distribution assets are in good working condition, however water loss is higher than desired. During maximum demand days, minimum pressure in the system exceeds 35 psi, with a small isolated area experiencing pressure slightly higher than 150 psi. The system also contains sufficient pumping and storage capacity based on current water demands.
Recommended improvements to the City’s distribution system include both pipe improvements and operational improvements.

CITY OF KIRKWOOD WATER DISTRIBUTION DEFICIENCY ANALYSIS AND RECOMMENDED IMPROVEMENTS
18
4.1 Pipe Improvements
Model results indicated no pipe improvements are required to meet the 35-psi minimum pressure under current water demand. The pipe improvements listed in this section are recommended to decrease head loss and improve operating efficiency. The pipe improvements are recommended where,
• Excessive head loss (greater than 10’/1000’ of pipe) is identified during the deficiency analysis
• The water mains are strategically important, e.g., near interconnections.
The proposed pipe improvements are grouped into two major areas, as presented below.
4.1.1 Swan Pump Station Area
Swan pump station is an important part of the water distribution system as the four pumps in the station provides a significant portion of the distribution flow. When the pump station is in operation, depending on number of pumps running, the flowrate at the pump station can be as high as 1,700 gpm (highest flowrate recorded in SCADA was 1,683 gpm in 2012). The pump station discharges into 8” water mains, which are undersized for this amount of flow.
Recommended pipe improvements in this area include the following segments, as presented in Figure 10:
• Upsize existing 8” on Swan Ave and N. Kirkwood Rd to 12”,
• Replace existing parallel pipes of 6” and 8” on N. Taylor Ave with one 12”,
• Upsize existing 6” on Quan Ave to 8”,
• Upsize existing 4” on N. Kirkwood Rd and E. Jewel Ave to 8”.

CITY OF KIRKWOOD WATER DISTRIBUTION DEFICIENCY ANALYSIS AND RECOMMENDED IMPROVEMENTS
19
FIGURE 10
Pipe Improvements – Swan Pump Station Area
4.1.2 Fillmore Pump Station Area
Fillmore pump station discharges to 8” on S. Fillmore Ave and 6” on Big Bend Blvd. It is recommended to upsize the 6” water main on Big Bend Blvd to 8” to improve the efficiency in that area, as presented in Figure 11.
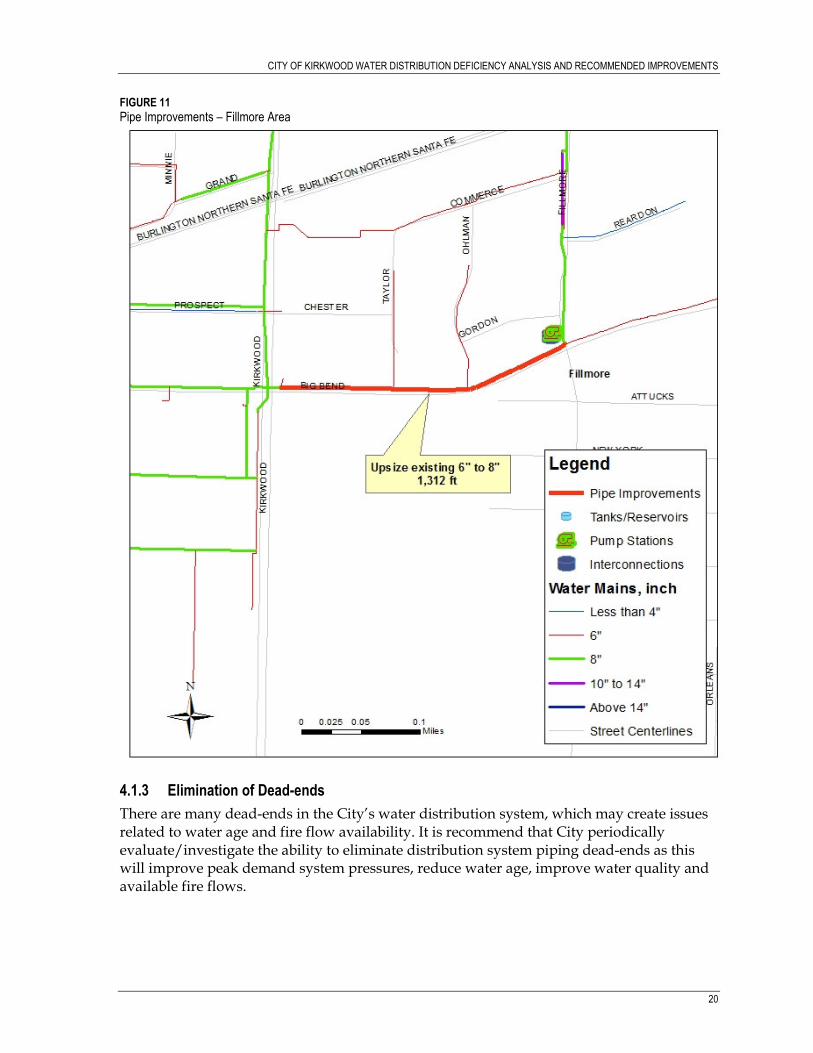
CITY OF KIRKWOOD WATER DISTRIBUTION DEFICIENCY ANALYSIS AND RECOMMENDED IMPROVEMENTS
20
FIGURE 11
Pipe Improvements – Fillmore Area
4.1.3 Elimination of Dead-ends
There are many dead-ends in the City’s water distribution system, which may create issues related to water age and fire flow availability. It is recommend that City periodically evaluate/investigate the ability to eliminate distribution system piping dead-ends as this will improve peak demand system pressures, reduce water age, improve water quality and available fire flows.

CITY OF KIRKWOOD WATER DISTRIBUTION DEFICIENCY ANALYSIS AND RECOMMENDED IMPROVEMENTS
21
4.2 Operational Improvements
Operational improvements are recommended to decrease water age in the distribution system. As described in Section 3.5, the storage tanks and reservoirs do not have sufficient turn over under the current operational controls, which caused long water age in the distribution system.
Based on current controls, the Park 1 reservoir is only allowed to drop 7’, while the tank overflow is 49’, which means only 14% of the total tank height is drained and filled each day. Similarly, the Park 2 reservoir is allowed to drop 6’ while the tank overflow is 42’.
Therefore, to reduce water age, it’s recommended to allow water levels to drop down further, e.g. 15 feet, at Park 1 and Park 2 reservoirs. This operational change will slightly lower the system pressure, but not sufficient to cause pressure drop to below 35 psi.
Additional improvements including the installation of inlet/outlet pipes, draft tubes, mixing systems or tank baffles should be considered to promote water mixing in the storage facilities. This will reduce water age and improve water quality.
4.3 Fire Flow Improvements
During hydrant flow tests on July 24, 2013, extremely low hydrant flow was observed at two test locations, test 6 and test 7. Test 6 is located at Hillcrest to the north of Woodbine, and test 7 was located at Orchard to the west of Greyer, as presented in Figure 6.
During the hydrant tests, when the flow hydrants were fully open, available flow was only 410 gpm, and 70 gpm, respectively. At test 6 location, the residual pressure dropped from 45 psi to 9 psi. At test location 7, the residual pressure dropped from 53 psi to 7 psi. The pressure drop is very significant especially considering only small amount of flow was drawn at the flowing hydrant. After initial model calibration, these two sites were repeated on September 5, 2013, and very similar test results were obtained.
This field test result indicated potential blockage in the pipe in the vicinity, e.g. closed valves. The City investigated in the field and no closed valves were found. However, some valves that were presented in the GIS could not be located in the field, therefore its position (open/close) could not be verified.
It is important to note that at locations where the water main carries adequate fire flow capacity, this doesn’t necessarily mean sufficient fire flow is available when hydrant is open, as closed valves could be present in very localized area, e.g., in the hydrant laterals.
Recommended pipe improvements are summarized in Table 7.
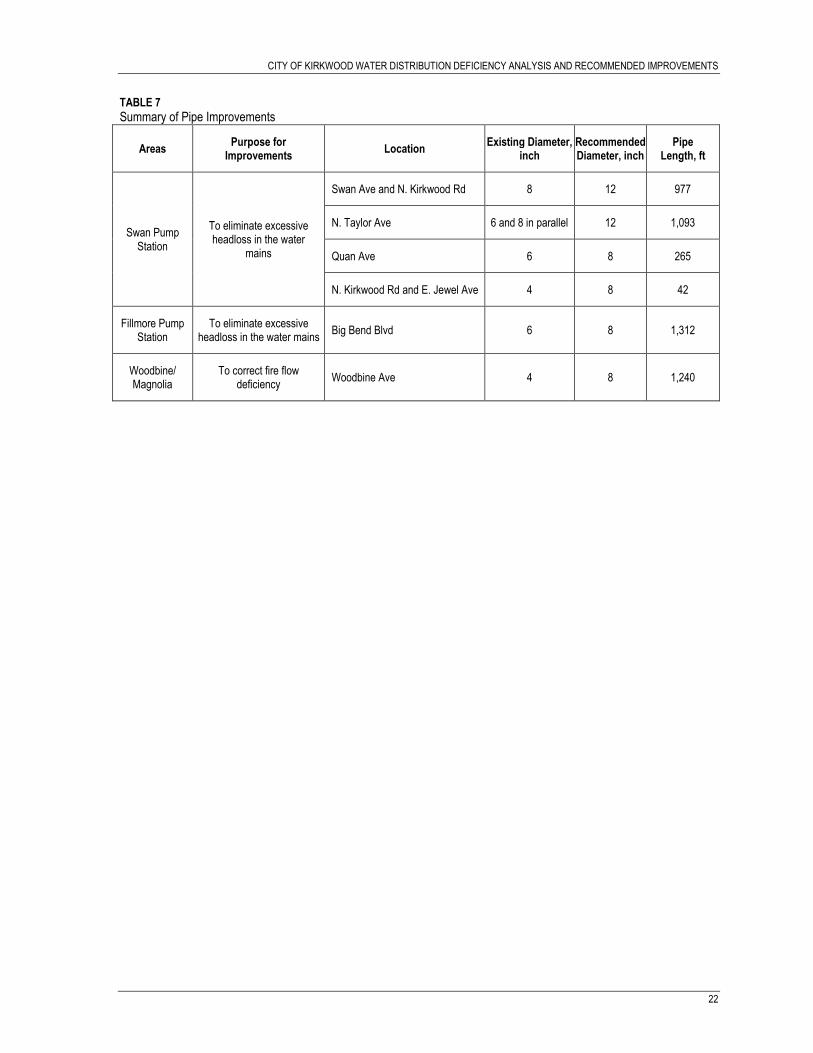
CITY OF KIRKWOOD WATER DISTRIBUTION DEFICIENCY ANALYSIS AND RECOMMENDED IMPROVEMENTS
22
TABLE 7
Summary of Pipe Improvements
Areas Purpose for
Improvements Location
Existing Diameter, inch
Recommended Diameter, inch
Pipe Length, ft
Swan Pump Station
To eliminate excessive headloss in the water
mains
Swan Ave and N. Kirkwood Rd 8 12 977
N. Taylor Ave 6 and 8 in parallel 12 1,093
Quan Ave 6 8 265
N. Kirkwood Rd and E. Jewel Ave 4 8 42
Fillmore Pump Station
To eliminate excessive headloss in the water mains
Big Bend Blvd 6 8 1,312
Woodbine/ Magnolia
To correct fire flow deficiency
Woodbine Ave 4 8 1,240

Appendix D Physical Assessment

F a c i l i t y A s s e s s m e n t R e p o r t
City of Kirkwood Water Master Plan Project No. 472012
Prepared for
City of Kirkwood, MO Water Department
October 2013

III
Table of Contents
Introduction ..................................................................................................................................... 1-1 1.1 Project Background ................................................................................................... 1-1 1.2 Project Objectives ....................................................................................................... 1-1 1.3 Project Field Assessment Field Work...................................................................... 1-1 1.4 Benchmark Useful Design Lives .............................................................................. 1-1
Pump Station, Storage, and Vault Assessment ......................................................................... 2-1 2.1 Marshall Road Pump Station ................................................................................... 2-1 2.2 Swan Pump Station ................................................................................................... 2-3 2.3 Dougherty Ferry Storage Tank ................................................................................ 2-6 2.4 Rose Hill Storage Tank ............................................................................................ 2-10 2.5 Park 1 Storage Tank ................................................................................................. 2-12 2.6 Park 2 Storage Tank and Pump Station ................................................................ 2-15 2.7 Marshall Road Valve Vault .................................................................................... 2-18 2.8 Highland Valve Vault ............................................................................................. 2-20 2.9 Barrett Station Valve Vault ..................................................................................... 2-22 2.10 Trailcrest Pump Station .......................................................................................... 2-23 2.11 Fillmore Pump Station ............................................................................................ 2-25 2.12 Pump House Seismic and Tank Discussion ......................................................... 2-27
O&M Facilities, Fire Hydrants, Meters, Valves ........................................................................ 3-1 3.1 O&M Facilities ............................................................................................................ 3-1 3.2 Fire Hydrants ............................................................................................................. 3-1 3.3 Flow Meters ................................................................................................................ 3-3 3.4 Valves .......................................................................................................................... 3-4

1-1
SECTION 1
Introduction
1.1 Project Background
The City of Kirkwood’s water distribution system currently serves a population over 27,000 people across a service area of approximately 10 square miles. The system operates as one pressure zone consisting of 135 miles of piping ranging from 2” to 24” in diameter. Kirkwood is supplied wholesale water from the Missouri American Water Company through six (6) interconnects with a contracted maximum daily rate of 9.5 million gallons per day. In addition, the distribution system consists of six (6) pump stations, two (2) elevated water tanks, and two (2) ground storage tanks with a total storage capacity of 5.75 million gallons.
CH2M HILL has been contracted by the City of Kirkwood to provide a Water System Master Plan. As part of this work, this Facility Assessment Report will provide the City with an inspection, evaluation and analysis of its pump stations and storage tanks.
1.2 Project Objectives The City desires to evaluate the entire distribution system to identify strengths, weaknesses, opportunities and threats to establish short and long-term improvements which provide for a reliable, sustainable system with a fair and equitable rate structure. One of the project’s four main components, the Facility Assessment will characterize the existing water system major assets so that a Renewals and Replacement plan can be developed to maximize the use of the existing facilities while minimizing the disruption and rate impacts to the City’s customers.
1.3 Project Field Assessment Field Work The physical assessments completed for this technical memorandum were completed by CH2M HILL during the week of June 10 – 14. The staff involved included senior civil, mechanical, instrumentation & control, and structural engineers. The narratives and photos included in this report were a result of these field investigations.
1.4 Benchmark Useful Design Lives The following benchmarks have been established based on Kirkwood experience, literature search, best professional judgment, and discussions with Kirkwood Water Department staff. These values will be used to evaluate the remaining useful life of physical assets so that the Renewals and Replacement plan can be developed. It is important to note, factors which are required to realize useful life are proper maintenance, design and environmental conditions. Any one of these factors or a combination of, can reduce useful life of a particular asset significantly.
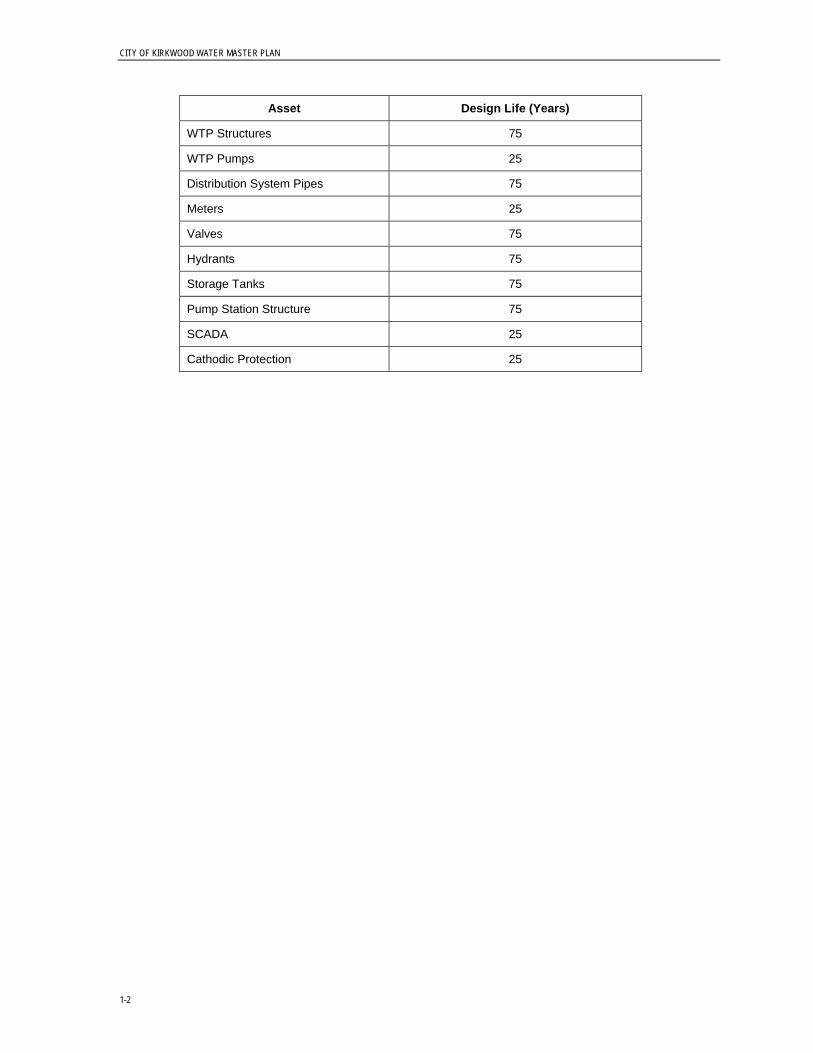
CITY OF KIRKWOOD WATER MASTER PLAN
1-2
Asset Design Life (Years)
WTP Structures 75
WTP Pumps 25
Distribution System Pipes 75
Meters 25
Valves 75
Hydrants 75
Storage Tanks 75
Pump Station Structure 75
SCADA 25
Cathodic Protection 25

SECTION 2
2-1
Pump Station, Storage, and Vault Assessment
2.1 Marshall Road Pump Station 2.1.1 Background Originally constructed in 1932 as the Kirkwood Water Treatment Plant, the Marshall Road Pump Station (MRPS) was converted to a 6-MGD pump station in 2007 and is located at 2102 Marshall Road. Water from Missouri American (MAWC) is delivered through the Marshall Road Vault and into the pump station through a 20-inch forcemain along Marshall Road.
2.1.2 Site/Civil The MRPS yard was completed in 2008 and is a large grass field between Marshall Road and the building. There are stormwater issues at the site.
The property is bordered by a barbed-wire fence which is in good condition. There are two access gates onto the site with the south gate being a padlocked gate primarily accessed by larger vehicle, and the north gate, which has a keypad entry system with automatic swing gate exit. Security cameras are also present at the site. There are two secured entry doors with alarms.
There are no issues with Site/Civil at this time. Site/civil would be expected to have an indefinite lifespan based on the continued maintenance of environmental factors such as drainage, security systems such as fencing and grounds upkeep.
2.1.3 Structural The structure consists of unreinforced concrete masonry unit (CMU) load-bearing shearwalls with exterior brick cladding. The structure was built in 1957. Some internal areas consist of gravity steel frames and reinforced concrete frame construction. The building was previously used as a water treatment facility, but now serves only as a pump station. Several pumps are located on the 1st floor of the NE corner of the building. Water piping and valves are located below the pumps in the basement. See Section 2.12.1 for seismic discussion of the pump house structure.
Generally the building maintenance appeared sufficient. Based on the condition analysis and expected useful life the structure has approximately 65-years of service remaining, with replacement in the year 2078. Two factors that should be considered are the level and cost for maintenance may be expected to increase as the facility ages, and full maintenance program consisting of predictive and preventative maintenance activities will be required to meet these estimates of useful life. Given the moderately harsh conditions (presence of air and moisture) aggressive maintenance of paint and other surface protectants will be necessary.
2.1.4 Mechanical The Marshall Road Pump Station consists of four pumps, each operating at 1390 gpm and 176’ TDH. The pumps and equipment were all installed as part of the station upgrade in 2007. There are no noted mechanical issues at this time.

CITY OF KIRKWOOD WATER MASTER PLAN
2-2
FIGURE 2-1 MRPS SCADA and PLCS
FIGURE 2-2 MRPS Basement Piping
Generally the mechanical equipment maintenance appeared sufficient. Review of the energy efficiencies of the pumps and motor is beyond the scope of this report, but should be considered given the age of the motors. Based on the condition analysis and expected useful life, the pumps and motors have approximately 15-years of service remaining, with replacement in the year 2028. Pump station valves and piping also appeared in good condition. Two factors that should be considered are the level and cost for maintenance may be expected to increase as the facility ages, and full maintenance program consisting of predictive and preventative maintenance activities will be required to meet these estimates of useful life. Given the moderately harsh conditions (presence of air and moisture) aggressive maintenance of paint systems will be necessary.
2.1.5 Electrical and Control Systems The Marshall Road Pump Station electrical service was updated with the station upgrade in 2007. A new Eaton/Cutler Hammer Motor Control Center (MCC) was installed, with 100 HP VFDs for each pump (Figure 2-3). The electrical gear is installed in a clean air conditioned space and is in good operating condition. There are no electrical issues noted at this time.
The Marshall Road Pump Station instrumentation consists of ABB magnetic flow meters and ABB supply and discharge pressure transmitters. The SCADA system consists of an Allen Bradley SLC 5/05 PLC coupled with a CalAmp licensed frequency radio (Figure 2-4). The radios were upgraded within the past year to bring them in compliance with current FCC frequency range requirements. An issue was noted with periodic PLC faults since the last SCADA upgrade (Figure 2-5), but these are expected to be resolved by the installing Contractor.
FIGURE 2-3 MRPS Electrical MCC

SECTION 2— PUMP STATION, STORAGE, AND VAULT ASSESSMENT
2-3
FIGURE 2-4 MRPS SCADA and PLCs
FIGURE 2-5 MRPS SCADA and PLCs
Generally the electrical equipment maintenance appeared sufficient. Based on the condition analysis and expected useful life, the electrical systems would have approximately 15-years of service remaining, with replacement in the year 2028. The SCADA and instrumentation system are new, and would be expected to have an additional 25-years of lifespan remaining, with replacement in the year 2038. Additional factors that should be considered are the level and cost for maintenance may be expected to increase as the electrical systems age, and full maintenance program consisting of predictive and preventative maintenance activities will be required to meet these estimates of useful life. Obsoletion and availability of repair and maintenance parts should also be considered, as architecture generally changes for this type of equipment more rapidly than other systems.
Missouri Department of Natural Resources (MDNR), Design Guide for Community Water Systems (2003) states the following: “Systems serving a population of 3,300 or greater shall have arrangements in place for standby or backup power and shall include these arrangements in their emergency operating plan.” The addition of standby or backup power for the Marshall Road Pump Station should be considered as administratively feasible.
2.2 Swan Pump Station 2.2.1 Background The Swan Pump Station was originally constructed in the 1950’s and is located at the northern end of the system at 126 Swan Avenue. This is the second largest interconnection with MAWC and provides a maximum of 3.0 MGD under current operating parameters.
2.2.2 Site/Civil The Swan Pump Station is located in a residential area and has been constructed to blend in with the neighboring homes. The city maintains landscaping in the front yard and rear yards. Aside from building alarms at the front door, there are no additional security measures in place including fencing, cameras, etc. The city may want to provide a security camera directed at the front door in the future.

CITY OF KIRKWOOD WATER MASTER PLAN
2-4
Site/civil would be expected to have an indefinite lifespan based on the continued maintenance of environmental factors such as drainage, security systems such as fencing and grounds upkeep.
2.2.3 Structural The structure consists of unreinforced concrete masonry unit (CMU) load-bearing shearwalls with exterior brick cladding. Several pumps are located inside the building. Some existing CMU door lintels and some of the CMU mortar joints have extensive cracking. Cracked CMU and brick joints can be repaired by repointing with new mortar. See Section 2.12.1 for seismic discussion of the pump house structure.
Generally the building maintenance appeared sufficient. Based on the condition analysis and expected useful life the structure has approximately 15-years of service remaining, with replacement in the year 2028. Two factors that should be considered are the level and cost for maintenance may be expected to increase as the facility ages, and full maintenance program consisting of predictive and preventative maintenance activities will be required to meet these estimates of useful life. Given the moderately harsh conditions (presence of air and moisture) aggressive maintenance of paint and other surface protectants will be necessary. These factors are of particular importance as an asset approaches the end of its useful life.
FIGURE 2-6 Swan PS Interior Wall
FIGURE 2-7 Swan PS Exterior Wall
2.2.4 Mechanical The Swan Pump Station consists of four pumps, two operating at 1000 gpm and 90’ TDH, and the other two operating at 400 gpm and 90’ TDH. The pumps and equipment all appear to be originally installed equipment, installed in the 1950’s. The pumps and piping equipment appear to be well maintained, but should be considered for maintenance upgrades based on their age alone. Renewal and replacement of the mechanical systems should be considered as administratively feasible. No additional mechanical issues were noted.

SECTION 2— PUMP STATION, STORAGE, AND VAULT ASSESSMENT
2-5
FIGURE 2-8 Swan PS Lower Pumps
FIGURE 2-9 Swan PS Upper Pumps
2.2.5 Electrical and Control Systems The Swan Pump Station electrical systems (Figures 2-10 and 2-11) were installed with the pump station. The electrical gear is installed in a clean air conditioned space and is in good operating condition. Renewal and replacement of the electrical systems should be considered as administratively feasible. No additional electrical issues were noted.
Missouri Department of Natural Resources (MDNR), Design Guide for Community Water Systems (2003) states the following: “Systems serving a population of 3,300 or greater shall have arrangements in place for standby or backup power and shall include these arrangements in their emergency operating plan.” The addition of standby or backup power for the Swan Pump Station should be considered as administratively feasible.
The Swan Pump Station instrumentation consists of ABB magnetic flow meters and ABB supply and discharge pressure transmitters. The SCADA system consists of an Allen Bradley SLC 5/05 PLC coupled with a CalAmp licensed frequency radio (Figure 2-12). The radios were upgraded within the past year to bring them in compliance with current FCC frequency range requirements. The SCADA and instrumentation system are new, and would be expected to have an additional 25-years of lifespan remaining, with replacement in the year 2038. Obsoletion and availability of repair and maintenance parts should also be considered, as architecture generally changes for this type of equipment more rapidly than other systems.

CITY OF KIRKWOOD WATER MASTER PLAN
2-6
FIGURE 2-10 Swan PS Electrical Systems
FIGURE 2-11 Swan PS Electrical Systems
FIGURE 2-12 Swan PS SCADA and Radio
2.3 Dougherty Ferry Storage Tank 2.3.1 Background The Dougherty Ferry Storage Tank was constructed in 1967 and has a capacity of 250,000 gallons. It is located at 1500 Cornhill Lane although access to the tank is gained through a secured fence on Dougherty Ferry Road.
2.3.2 Site/Civil The Dougherty Ferry tank is located within a residential neighborhood. The property is bordered by a barbed-wire fence which is in good condition. The entry point is a padlocked, double swing gate in good condition.

SECTION 2— PUMP STATION, STORAGE, AND VAULT ASSESSMENT
2-7
The rear of the property shows signs of erosion and flooding and was saturated during the field visit. It was noted that the neighboring property has not complained of flooding in the past but this could be potential concern if an overflow were to occur. Should a full failure occur, it is possible the nearest home downstream could be affected; there is a drainage swale between the tank and home that would direct most of the flow away from the home, however.
The wooden fence blocking the control building from the adjacent property shows signs of aging including warped boards and dry rotting, but City staff indicated this has not been an issue and the resident has not complained about the wooden fencing
There is no security surveillance at this time and the City did not indicate it was needed, however, the city may want to provide a security camera directed at the front door in the future. There is a security alarm on the door entry.
Site/civil would be expected to have an indefinite lifespan based on the continued maintenance of environmental factors such as drainage, security systems such as fencing and grounds upkeep.
FIGURE 2-14 Dougherty Ferry Tank Drainage Area
FIGURE 2-15 Dougherty Ferry Tank Fencing
2.3.3 Structural The tank exterior was inspected, and signs of corrosion were noted on some of the anchor bolts/nuts/lugs, base flange, and on the north sidewall near the base (Figure 2-16). No signs of corrosion were noted on the interior at the tank base. No signs of significant foundation settlement or differential settlement were apparent. Generally structural maintenance appeared sufficient, with the noted exceptions. Based on the condition analysis and expected useful life the structure has approximately 29-years of service remaining, with replacement in the year
FIGURE 2-13 Dougherty Ferry Tank Drainage

CITY OF KIRKWOOD WATER MASTER PLAN
2-8
2042. Two factors that should be considered are the level and cost for maintenance may be expected to increase as the facility ages, and full maintenance program consisting of predictive and preventative maintenance activities will be required to meet these estimates of useful life. Given the moderately harsh conditions (presence of air and moisture) aggressive maintenance of paint and other surface protectants will be necessary. Non-destructive analysis of the paint systems should be considered as administratively feasible. These factors are of particular importance as an asset begins to approach the end of its useful life. See 2.12.2 for discussion on tank inspection/maintenance and seismic analysis.
Seismic analysis of the tank should be a consideration. Verification of structural design, construction and condition is essential given the tanks location within the New Madrid Seismic Zone (NMSZ). Additional seismic considerations are the installation of a seismic valve to protect the tank from draining due to water main leaks in the distribution system. A seismic valve automatically closes and isolates the tanks in the event of a major earthquake.
FIGURE 2-16 Corrosion on Tank Wall and Anchor Bolts

SECTION 2— PUMP STATION, STORAGE, AND VAULT ASSESSMENT
2-9
FIGURE 2-17 Dougherty Ferry/Essex Elevated Water Tank
2.3.4 Mechanical The Dougherty Ferry elevated storage tank piping consists of a vault under the tank with a Pratt altitude valve (Figure 2-18). The valve is not operational, and is not used for control of tank level. The valve is left in the open position. As noted the valve has failed and has exceeded its useful life. The valve should be considered for replacement as soon as administratively feasible. Piping was in generally good condition, and based on the condition analysis and expected useful life, the piping has approximately 29-years of service remaining, with replacement in the year 2042. Two factors that should be considered are the level and cost for maintenance may be expected to increase as the facility ages, and full maintenance program consisting of predictive and preventative maintenance activities will be required to meet these estimates of useful life. Given the moderately harsh conditions (presence of air and moisture) aggressive maintenance of paint and other surface protectants will be necessary.
FIGURE 2-18 Dougherty Ferry EST, Vault Under the Tank with a Pratt Altitude Valve

CITY OF KIRKWOOD WATER MASTER PLAN
2-10
2.3.5 Electrical and Control Systems The Dougherty Ferry elevated storage tank instrumentation consists only of a Foxboro level transmitter. The SCADA system consists of an Allen Bradley MicroLogix PLC coupled with a CalAmp licensed frequency radio. The radios were upgraded within the past year to bring them in compliance with current FCC frequency range requirements.
The electrical gear is installed in poorly ventilated space with no air conditioning but is in generally good operating condition at this time (see Figure 2-19). Renewal and replacement of the electrical systems should be considered as administratively feasible. Installation of an air conditioning unit should be considered. No additional electrical issues were noted.
There are no power issues noted at this time, but a backup emergency generator is in use for the SCADA RTU. Monitoring and control of the tank level is considered critical at this site.
The SCADA and instrumentation system are new, and would be expected to have an additional 25-years of lifespan remaining, with replacement in the year 2038. Additional factors that should be considered are the level and cost for maintenance may be expected to increase as the SCADA and instrumentation systems age, and full maintenance program consisting of predictive and preventative maintenance activities will be required to meet these estimates
of useful life. Obsoletion and availability of repair and maintenance parts should also be considered, as architecture generally changes for this type of equipment more rapidly than other systems.
2.4 Rose Hill Storage Tank 2.4.1 Background The Rose Hill Storage Tank is the newest facility within the Kirkwood system, having been constructed in 2010 (see Figure 2-20). It is an elevated welded steel tank with a capacity of 600,000 gallons. It is located at 591 Andrews Avenue.
2.4.2 Site/Civil The Rose Hill tank is located across from Meramec Community College and within a residential neighborhood. The property is bordered by a barbed-wire fence which is in good condition. The entry point is a padlocked, double swing gate in good condition. There are no Site/Civil issues at this time.
There is no security surveillance at this time and the City did not indicate it was needed, however, the city may want to provide a security camera directed at the front door in the future. There is a security alarm on the door entry.
FIGURE 2-19 Dougherty Ferry EST Controls

SECTION 2— PUMP STATION, STORAGE, AND VAULT ASSESSMENT
2-11
Site/civil would be expected to have an indefinite lifespan based on the continued maintenance of environmental factors such as drainage, security systems such as fencing and grounds upkeep.
2.4.3 Structural It consists of an elevated steel water tank, supported by a reinforced concrete slab and drilled pier foundation. No signs of significant foundation settlement or differential settlement were apparent. The tank exterior and interior were inspected, with no noticeable signs of corrosion.
Generally structural maintenance appeared sufficient. Based on the condition analysis and expected useful life the structure has approximately 72-years of service remaining, with replacement in the year 2085. Two factors that should be considered are the level and cost for maintenance should be expected to increase as the facility ages, and full maintenance program consisting of predictive and preventative maintenance activities will be required to meet these estimates of useful life. Given the moderately harsh conditions (presence of air and moisture) aggressive maintenance of paint and other surface protectants will be necessary.
Since the Rose Hill water tank consists of a recent design, it is likely that this tank will perform well for a design seismic event. Verification for conformance with the latest version of the IBC should be verified, unless the currently adopted version is the same as used in the design. See 2.12.2 for discussion on tank inspection/maintenance and seismic analysis.
2.4.4 Mechanical The Rose Hill elevated storage tank piping consists of a vault under the tank with a manual tank isolation valve (see Figure 2-21). The tank was designed with two overflow elevations to accommodate future capacity requirements. The valve and piping segments are in good condition and renewal and replacement of the mechanical systems should be considered as administratively feasible. No additional mechanical issues noted at this time.
2.4.5 Electrical and Control Systems The elevated storage tank instrumentation consists only of a Foxboro level transmitter. The SCADA system consists of an Allen Bradley MicroLogix PLC coupled with a CalAmp
licensed frequency radio. The radios were upgraded within the past year to bring them in compliance with current FCC frequency range requirements. There are no electrical or controls issues noted at this time.
FIGURE 2-20 Rose Hill Elevated Water Tank
FIGURE 2-21 Rose Hill Vault

CITY OF KIRKWOOD WATER MASTER PLAN
2-12
The SCADA and instrumentation system are new, and would be expected to have an additional 25-years of lifespan remaining, with replacement in the year 2038.
2.5 Park 1 Storage Tank and Pump Station 2.5.1 Background The Park 1 Storage Tank was installed in 1955, and has a 2,500,000 gallon capacity (Figure 2-22).
2.5.2 Site/Civil The Park 1 tank is located at the north end of Sugar Creek Park and adjacent to the Kirkwood Parks Department building. The control building is approximately 50 feet east of the tank and secured by locked doors. The overflow for the tank is located on the north side and is directed at a grassy area between the tank and Parks building. During the site visit the overflow was active and had created surface flooding and ponding in the area. While no complaints have been received from adjacent neighbors, excessive overflow conditions may result in Site/Civil failure, potentially impacting structural and mechanical systems. Analysis of root cause should be addressed as soon as administratively feasible.
There is no security surveillance at this time and the City did not indicate it was needed, however, the city may want to provide a security camera directed at the front door in the future. There is a security alarm on the door entry.
Well designed and maintained Site/civil would be expected to have an indefinite lifespan based on the continued maintenance of environmental factors such as drainage, security systems such as fencing and grounds upkeep.
2.5.3 Structural The Park 1 Storage Tank was installed in 1955, and has a 2,500,000 gallon capacity. The tank exterior was recoated about 2 years ago, with the interior recently recoated. No noticeable signs of corrosion were noted on the exterior. No signs of significant foundation settlement or differential settlement were apparent. Based on the condition analysis and expected useful life the structure has approximately 17-years of service remaining, with replacement in the year 2030. Two factors that should be considered are the level and cost for maintenance should be expected to increase as the facility ages, and full maintenance program consisting of predictive and preventative maintenance activities will be required to meet these estimates of useful life. Given the moderately harsh conditions (presence of air and moisture) aggressive maintenance of paint and other surface protectants will be necessary.
FIGURE 2-22 Park 1 Storage Tank

SECTION 2— PUMP STATION, STORAGE, AND VAULT ASSESSMENT
2-13
It was noted that the tank is self-supporting, which means there are no anchor bolts to tie the tank to the foundation for lateral or overturning forces. Acceptance of this would have to be verified with the currently adopted IBC for both empty wind conditions, and operational seismic conditions.
Seismic analysis of the tank should be a consideration. Verification of structural design, construction and condition is essential given the tanks location within the New Madrid Seismic Zone (NMSZ). Additional seismic considerations are the installation of a seismic valve to protect the tank from draining due to water main leaks in the distribution system. A seismic valve automatically closes and isolates the tanks in the event of a major earthquake. See 2.12.2 for discussion on tank inspection/maintenance and seismic analysis.
2.5.4 Mechanical The Park 1 Pump Station is an above ground booster pump station constructed near the storage tank. It consists of three pumps (Figure 2-23). Two of the pumps operate at 2000 gpm, 160’TDH, while the third pump operates at 1500 gpm, 155’ TDH. The pump station control valve, and an air compressor. The smaller capacity pump is equipped with a gas drive for emergency operation. The pumps are reportedly well maintained, replacing pump seals, etc, as required. The condition analysis and age of the facility suggest it is at or nearing the end of its useful life, and should be planned for renewal or replacement as administratively feasible. Two factors that should be considered are the level and cost for maintenance should be expected to increase as the facility ages, and full maintenance program consisting of predictive and preventative maintenance activities will be required to meet these estimates of useful life. Given the moderately harsh conditions (presence of air and moisture) aggressive maintenance of paint and other surface protectants will be necessary. Additionally, given the age of the mechanical systems, obsoletion and availability of repair and maintenance parts should be considered. No other mechanical issues are noted at this time.
FIGURE 2-23 Park 1 Storage Tank Mechanical

CITY OF KIRKWOOD WATER MASTER PLAN
2-14
2.5.5 Electrical and Control Systems The Park 1 Pump Station electrical systems (Figures 2-24 and 2-25) were installed with the pump station. The electrical gear is installed in a non-air conditioned space but is in good operating condition.
The condition analysis and age of the electrical system suggest it is at or nearing the end of its useful life, and should be planned for renewal or replacement as administratively feasible. Two factors that should be considered are the level and cost for maintenance should be expected to increase as the facility ages, and full maintenance program consisting of predictive and preventative maintenance activities will be required to meet these estimates of useful life. Given the moderately harsh conditions (presence of air and moisture) aggressive maintenance will be necessary. Additionally, given the age of the electrical systems, obsoletion and availability of repair and maintenance parts should be considered.
Missouri Department of Natural Resources (MDNR), Design Guide for Community Water Systems (2003) states the following: “Systems serving a population of 3,300 or greater shall have arrangements in place for standby or backup power and shall include these arrangements in their emergency operating plan.” The addition of standby or backup power for the Park 1 Pump station should be considered as administratively feasible.
FIGURE 2-24 Park 1 Pump Station Electrical and Instrumentation
FIGURE 2-25 Park 1 Pump Station Electrical and Instrumentation
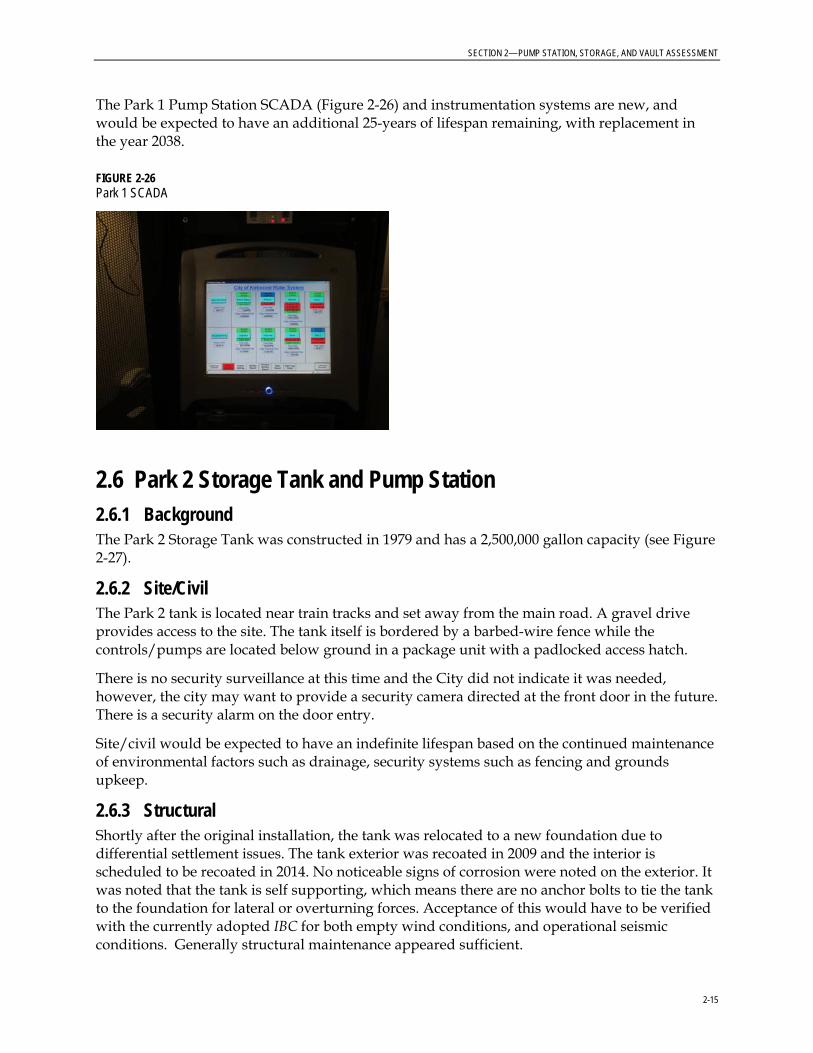
SECTION 2— PUMP STATION, STORAGE, AND VAULT ASSESSMENT
2-15
The Park 1 Pump Station SCADA (Figure 2-26) and instrumentation systems are new, and would be expected to have an additional 25-years of lifespan remaining, with replacement in the year 2038.
FIGURE 2-26 Park 1 SCADA
2.6 Park 2 Storage Tank and Pump Station 2.6.1 Background The Park 2 Storage Tank was constructed in 1979 and has a 2,500,000 gallon capacity (see Figure 2-27).
2.6.2 Site/Civil The Park 2 tank is located near train tracks and set away from the main road. A gravel drive provides access to the site. The tank itself is bordered by a barbed-wire fence while the controls/pumps are located below ground in a package unit with a padlocked access hatch.
There is no security surveillance at this time and the City did not indicate it was needed, however, the city may want to provide a security camera directed at the front door in the future. There is a security alarm on the door entry.
Site/civil would be expected to have an indefinite lifespan based on the continued maintenance of environmental factors such as drainage, security systems such as fencing and grounds upkeep.
2.6.3 Structural Shortly after the original installation, the tank was relocated to a new foundation due to differential settlement issues. The tank exterior was recoated in 2009 and the interior is scheduled to be recoated in 2014. No noticeable signs of corrosion were noted on the exterior. It was noted that the tank is self supporting, which means there are no anchor bolts to tie the tank to the foundation for lateral or overturning forces. Acceptance of this would have to be verified with the currently adopted IBC for both empty wind conditions, and operational seismic conditions. Generally structural maintenance appeared sufficient.

CITY OF KIRKWOOD WATER MASTER PLAN
2-16
Based on the condition analysis and expected useful life the structure has approximately 41-years of service remaining, with replacement in the year 2054. Two factors that should be considered are the level and cost for maintenance should be expected to increase as the facility ages, and full maintenance program consisting of predictive and preventative maintenance activities will be required to meet these estimates of useful life. Given the moderately harsh conditions (presence of air and moisture) aggressive maintenance of paint and other surface protectants will be necessary.
Seismic analysis of the tank should be a consideration. Verification of structural design, construction and condition is essential given the tanks location within the New Madrid Seismic Zone (NMSZ). Additional seismic considerations are the installation of a seismic valve to protect the tank from draining due to water main leaks in the distribution system. A seismic valve automatically closes and isolates the tanks in the event of a major earthquake. See 2.12.2 for discussion on tank inspection/maintenance and seismic analysis.
FIGURE 2-27 Park 2 Water Storage Tank
2.6.4 Mechanical The Park 2 Pump Station is an in ground packaged booster pump station manufactured by Engineered Fluid Process. It consists of three pumps, each operating at 1675 gpm, 170’ TDH, and a pressure control valve. Moderate corrosion was noted on the piping and valve around the pressure control valve. The pumps are reportedly well maintained, replacing pump seals, etc, as required. Generally mechanical maintenance appeared sufficient. The condition analysis and age of the facility suggest mechanical systems are at or nearing the end of its useful life, and should be planned for renewal or replacement as administratively feasible. Two factors that should be considered are the level and cost for maintenance should be expected to increase as the facility ages, and full maintenance program consisting of predictive and preventative maintenance activities will be required to meet these estimates of useful life.

SECTION 2— PUMP STATION, STORAGE, AND VAULT ASSESSMENT
2-17
Given the moderately harsh conditions (presence of air and moisture) aggressive maintenance of paint and other surface protectants will be necessary.
Additionally, given the age of the mechanical systems, obsoletion and availability of repair and maintenance parts should be considered. No other mechanical issues are noted at this time.
FIGURE 2-28 Park 2 Pumps
FIGURE 2-29 Park 2 Valve
2.6.5 Electrical and Control Systems The Park 2 Pump Station instrumentation consists of a storage tank level transmitter, storage tank low level switch, and station discharge pressure switch and transmitter. The pump station starters and local controls appear to be original. The Park 2 Pump Station electrical systems (See Figure 2-30) were installed with the pump station. The electrical gear is installed in poorly ventilated space with no air conditioning but is in generally good operating condition at this time.
The condition analysis and age of the electrical system suggest it is at or nearing the end of its useful life, and should be planned for renewal or replacement as administratively feasible. Two factors that should be considered are the level and cost for maintenance should be expected to increase as the facility ages, and full maintenance program consisting of predictive and preventative maintenance activities will be required to meet these estimates of useful life. Given the moderately harsh conditions (presence of air and moisture) aggressive maintenance will be necessary. Additionally, given the age of the electrical systems, obsoletion and availability of repair and maintenance
FIGURE 2-30 Park #2 Electrical

CITY OF KIRKWOOD WATER MASTER PLAN
2-18
parts should be considered.
There are no electrical or controls issues noted at this time.
Missouri Department of Natural Resources (MDNR), Design Guide for Community Water Systems (2003) states the following: “Systems serving a population of 3,300 or greater shall have arrangements in place for standby or backup power and shall include these arrangements in their emergency operating plan.” The addition of standby or backup power for the Park 2 Pump station should be considered as administratively feasible.
One of the panels within the pump station was modified to add the SCADA system which consists of an Allen Bradley MicroLogix PLC coupled with a CalAmp licensed frequency radio. The radios were upgraded within the past year to bring them in compliance with current FCC frequency range requirements. The Park 2 Pump Station SCADA and instrumentation systems are new, and would be expected to have an additional 25-years of lifespan remaining, with replacement in the year 2038.
2.7 Marshall Road Valve Vault Interconnect 2.7.1 Background The Marshall Road valve vault was constructed as part of the MRPS conversion project in 2007 and is the primary connection point between the MAWC and Kirkwood water systems. It was designed to convey 6.0mgd into the 20-inch forcemain running to MRPS.
2.7.2 Site/Civil The valve vault is located in a grassy area between Marshall Road and an asphalt road in the park and protected by bollards.
There is no security surveillance at this time and site security for the Marshall Road valve vault should be further reviewed for improvements, such as site control (fencing), and intrusion monitoring such as CCTV, ground sensors or proximity radar. These site improvements would be considered consistent with the US Department of Homeland Security requirements for water system security.
Site/civil would be expected to have an indefinite lifespan based on the continued maintenance of environmental factors such as drainage, security systems such as fencing and grounds upkeep. There are no additional Site/Civil issues at this time.
2.7.3 Mechanical The Marshall Road valve vault mechanical systems include meters, valve and piping. The mechanical systems were generally in good condition. The mechanical equipment maintenance appeared sufficient. Based on the condition analysis and expected useful life, the Marshall Road valve vault mechanical systems have approximately 19-years of service remaining, with replacement in the year 2032. Two factors that should be considered are the level and cost for maintenance may be expected to increase as the facility ages, and full maintenance program consisting of predictive and preventative maintenance activities will be required to meet these estimates of useful life. Given the moderately harsh conditions (presence of air and moisture) aggressive maintenance of paint systems will be necessary.

SECTION 2— PUMP STATION, STORAGE, AND VAULT ASSESSMENT
2-19
Seismic analysis of the mechanical systems should be a considered. Verification of structural design, construction and condition is essential given the tanks location within the New Madrid Seismic Zone (NMSZ).
Additional seismic considerations are the installation of a seismic valve to protect the valve vault from damages during a major earthquake. A seismic valve automatically closes and isolates the vault in the event of a major earthquake may be appropriate.
2.7.4 Electrical and Control Systems The valve vault instrumentation consists of Foxboro supply and system pressure transmitters, a control valve, and flow signal provided by MAWC. The SCADA system consists of an Allen Bradley MicroLogix PLC coupled with a CalAmp licensed frequency radio. The radios were upgraded within the past year to bring them in compliance with current FCC frequency range requirements. The SCADA and instrumentation system are new, and would be expected to have an additional 25-years of lifespan remaining, with replacement in the year 2038. There are no electrical or controls issues noted at this time.
Missouri Department of Natural Resources (MDNR), Design Guide for Community Water Systems (2003) states the following: “Systems serving a population of 3,300 or greater shall have arrangements in place for standby or backup power and shall include these arrangements in their emergency operating plan.” The addition of standby or backup power for the Marshall Road Pump Station should be considered as administratively feasible.

CITY OF KIRKWOOD WATER MASTER PLAN
2-20
2.8 Highland Valve Vault Interconnect 2.8.1 Background The Highland valve vault was constructed as part of the MRPS conversion project in 2007 and is a connection point between the MAWC and Kirkwood water systems (see Figure 2-31). It was designed to convey 0.3mgd into the Kirkwood system.
2.8.2 Site/Civil The vault is located in the ROW and away from the road and up an incline. It is protected by bollards. There is no security surveillance at this time and site security for the Highland valve vault should be further reviewed for improvements, such as site control (fencing), and intrusion monitoring such as CCTV, ground sensors or proximity radar. These site improvements would be considered consistent with the US Department of Homeland Security requirements for water system security.
Site/civils would be expected to have an indefinite lifespan based on the continued maintenance of environmental factors such as drainage, security systems such as fencing and grounds upkeep.
2.8.3 Mechanical The Highland valve vault mechanical systems include meters, valve and piping. The piping and valves within the vault are ductile iron pipe and fittings.
The piping is only factory primed and shows signs of surface corrosion. The vault itself holds water, and is a high humidity environment. The mechanical systems were generally in fair condition. The mechanical equipment maintenance appeared sufficient. Based on the condition analysis and expected useful life, the Highland Valve Vault mechanical systems have approximately 19-years of service remaining, with replacement in the year 2032. Two factors that should be considered are the level and cost for maintenance may be expected to increase as the facility ages, and full maintenance program consisting of predictive and preventative maintenance activities will be required to meet these estimates of useful life. Given the moderately harsh conditions (presence of air and moisture) aggressive maintenance of paint systems will be necessary. Renewal or replacement of the paint systems and a positive means for draining the vault should be considered as soon as administratively feasible.
Seismic analysis of the mechanical systems should be a considered. Verification of structural design, construction and condition is essential given the tanks location within the New Madrid Seismic Zone (NMSZ). Additional seismic considerations are the installation of a seismic valve to protect the valve vault from damages during a major earthquake. A seismic valve automatically closes and isolates the vault in the event of a major earthquake may be appropriate. No additional mechanical issues noted at this time.
FIGURE 2-31 Highland Valve Vault

SECTION 2— PUMP STATION, STORAGE, AND VAULT ASSESSMENT
2-21
2.8.4 Electrical and Control Systems The valve vault instrumentation consists of Foxboro supply and system pressure transmitters, a control valve, and flow signal provided by MAWC. The SCADA system consists of an Allen Bradley MicroLogix PLC coupled with a CalAmp licensed frequency radio. The radios were upgraded within the past year to bring them in compliance with current FCC frequency range requirements. The SCADA and instrumentation system are new, and would be expected to have an additional 25-years of lifespan remaining, with replacement in the year 2038.
Missouri Department of Natural Resources (MDNR), Design Guide for Community Water Systems (2003) states the following: “Systems serving a population of 3,300 or greater shall have arrangements in place for standby or backup power and shall include these arrangements in their emergency operating plan.” The addition of standby or backup power for the Highland Valve Vault should be considered as administratively feasible. There are no electrical or controls issues noted at this time.

CITY OF KIRKWOOD WATER MASTER PLAN
2-22
2.9 Barrett Station Valve Vault Interconnect 2.9.1 Background The Barrett Station valve vault was constructed as part of the MRPS conversion project in 2007 and is a connection point between the MAWC and Kirkwood water systems (See Figure 2-32). It was designed to convey 0.3mgd into the Kirkwood system.
2.9.2 Site/Civil The vault is located in the ROW between the sidewalk and the street. There is no security surveillance at this time and site security for the Barrett Station valve vault should be further reviewed for improvements, such as site control (fencing), and intrusion monitoring such as CCTV, ground sensors or proximity radar. These site improvements would be considered consistent with the US Department of Homeland Security requirements for water system security.
Site/civils would be expected to have an indefinite lifespan based on the continued maintenance of environmental factors such as drainage, security systems such as fencing and grounds upkeep. There are no Site/Civil issues at this time.
2.9.3 Mechanical The piping and valves within the vault are ductile iron pipe and fittings. The piping is only factory primed and shows signs of surface corrosion. The vault itself holds water, and is a high humidity environment.
The mechanical systems were generally in fair condition (see Figure 2-33). The mechanical equipment maintenance appeared sufficient. Based on the condition analysis and expected useful life, the Barrett Station valve vault mechanical systems have approximately 19-years of service remaining, with replacement in the year 2032. Two factors that should be considered are the level and cost for maintenance may be expected to increase as the facility ages, and full maintenance program consisting of predictive and preventative maintenance activities will be required to meet these estimates of useful life. Given the moderately harsh conditions (presence of air and moisture) aggressive maintenance of paint systems will be necessary. Renewal or replacement of the paint systems and a positive means for draining the vault should be considered as soon as administratively feasible.
Seismic analysis of the mechanical systems should be a considered. Verification of structural design, construction and condition is essential given the tanks location within the New Madrid Seismic Zone (NMSZ). Additional seismic considerations are the installation of a seismic valve to protect the valve vault from damages during a major earthquake. A seismic valve automatically closes and isolates the vault in the event of a major earthquake may be appropriate. No additional mechanical issues noted at this time.
FIGURE 2-32 Barrett Station Valve Vault

SECTION 2— PUMP STATION, STORAGE, AND VAULT ASSESSMENT
2-23
2.9.4 Electrical and Control Systems The Barrett Station Meter valve vault instrumentation consists of Foxboro supply and system pressure transmitters, a control valve, and flow signal provided by MAWC. The SCADA system consists of an Allen Bradley MicroLogix PLC coupled with a CalAmp licensed frequency radio. The radios were upgraded within the past year to bring them in compliance with current FCC frequency range requirements. The SCADA and instrumentation system are new, and would be expected to have an additional 25-years of lifespan remaining, with replacement in the year 2038.
Missouri Department of Natural Resources (MDNR), Design Guide for Community Water Systems (2003) states the following: “Systems serving a population of 3,300 or greater shall have arrangements in place for standby or backup power and shall include these arrangements in their emergency operating plan.” The addition of standby or backup power for the Barrett Station Meter valve vault should be considered as administratively feasible. There are no electrical or controls issues noted at this time.
2.10 Trailcrest Pump Station Interconnect 2.10.1 Background The Trailcrest booster pump station (BPS) was constructed as part of the MRPS conversion project in 2007 and is a connection point between the MAWC and Kirkwood water systems. It was designed to convey 0.3mgd into the Kirkwood system (see Figure 2-34).
2.10.2 Site/Civil The BPS is located below ground and in the ROW between the sidewalk and a landscaped area. Site security for the Trailcrest Pump Station should be further reviewed for improvements, such as site control (fencing), and intrusion monitoring such as CCTV, ground sensors or proximity radar. These site improvements would be considered consistent with the US Department of Homeland Security requirements for water system security.
Site/civils would be expected to have an indefinite lifespan based on the continued maintenance of environmental factors such as drainage, security systems such as fencing and grounds upkeep.
FIGURE 2-33 Barrett Station Vault
FIGURE 2-34 Trailcrest Pump Station

CITY OF KIRKWOOD WATER MASTER PLAN
2-24
2.10.3 Mechanical The Trailcrest Pump Station is a packaged in-line booster pump station manufactured by Engineered Fluid, Inc. It consists of a single pump operating at 208 gpm, and 34” TDH, and a Cla-Val pressure reducing/sustaining valve. No mechanical issues were noted with piping or valves. However, it appears that the pump motor is undersized for the pump causing the motor to overheat. The pump station is currently operated with the pump discharge valve throttled to prevent pump/motor failure.
The mechanical systems were generally in fair condition. The mechanical equipment maintenance appeared sufficient. Based on the condition analysis and expected useful life, the Trailcrest Pump Station mechanical systems have approximately 19-years of service remaining, with replacement in the year 2032. Two factors that should be considered are the level and cost for maintenance may be expected to increase as the facility ages, and full maintenance program consisting of predictive and preventative maintenance activities will be required to meet these estimates of useful life. Given the moderately harsh conditions (presence of air and moisture) aggressive maintenance of paint systems will be necessary. Renewal or replacement of the paint systems and a positive means for draining the vault should be considered as soon as administratively feasible.
Seismic analysis of the mechanical systems should be a considered. Verification of structural design, construction and condition is essential given the tanks location within the New Madrid Seismic Zone (NMSZ).
Additional seismic considerations are the installation of a seismic valve to protect the valve vault from damages during a major earthquake. A seismic valve automatically closes and isolates the vault in the event of a major earthquake may be appropriate. No additional mechanical issues noted at this time.
The current operating approach to the pump station is appropriate under the circumstances, but would be considered “at risk” for equipment damage or catastrophic failures. Analysis of the pumping conditions, and pump and motor design should be started as soon as administratively feasible, with follow on replacement as appropriate.
2.10.4 Electrical and Control Systems The booster pump station electrical systems were installed with the pump station and are generally in good condition. Generally the electrical equipment maintenance appeared sufficient. Based on the condition analysis and expected useful life, the electrical systems would have approximately 19-years of service remaining, with replacement in the year 2032.
Missouri Department of Natural Resources (MDNR), Design Guide for Community Water Systems (2003) states the following: “Systems serving a population of 3,300 or greater shall have arrangements in place for standby or backup power and shall include these arrangements in their emergency operating plan.” The addition of standby or backup power for the Trailcrest Pump Station should be considered as administratively feasible.
The Trailcrest Pump Station instrumentation consists of Foxboro supply and system pressure transmitters, and flow signal provided by MAWC. The SCADA system consists of an Allen Bradley MicroLogix PLC coupled with a CalAmp licensed frequency radio.

SECTION 2— PUMP STATION, STORAGE, AND VAULT ASSESSMENT
2-25
The radios were upgraded within the past year to bring them in compliance with current FCC frequency range requirements. Intermittent communication failures were noted for the SCADA communication system.
The SCADA and instrumentation system are new, and would be expected to have an additional 25-years of lifespan remaining, with replacement in the year 2038. Radio path, radio equipment and antenna height and orientation should be reviewed as soon as administratively feasible, with follow on replacement as appropriate.
2.11 Fillmore Pump Station Interconnect
2.11.1 Background The Fillmore booster pump station (BPS) was constructed as part of the MRPS conversion project in 2007 and is a connection point between the MAWC and Kirkwood water systems. It was designed to convey 0.3mgd into the Kirkwood system (See Figure 2-35).
2.11.2 Site/Civil The BPS is located below ground and in the ROW just off the sidewalk. Site security for the Fillmore booster pump station should be further reviewed for improvements, such as site control (fencing), and intrusion monitoring such as CCTV, ground sensors or proximity radar. These site improvements would be considered consistent with the US Department of Homeland Security requirements for water system security.
Site/civils would be expected to have an indefinite lifespan based on the continued maintenance of environmental factors such as drainage, security systems such as fencing and grounds upkeep.
2.11.3 Mechanical The Fillmore Pump Station is a packaged in-line booster pump station manufactured by Engineered Fluid, Inc. It consists of a single pump operating at 208 gpm, and 34” TDH, and a Cla-Val pressure reducing/sustaining valve. No mechanical issues were noted with piping or valves. At the time of inspection, the pump had been removed from the pump station due to failure of the pump motor. It appears that the pump motor is undersized for the pump causing the motor to overheat.
The mechanical systems were generally in fair condition. The mechanical equipment maintenance appeared sufficient. Based on the condition analysis and expected useful life, the Fillmore Pump Station mechanical systems have approximately 19-years of service remaining, with replacement in the year 2032. Two factors that should be considered are the level and cost for maintenance may be expected to increase as the facility ages, and full maintenance program consisting of predictive and preventative maintenance activities will be required to meet these estimates of useful life. Given the moderately harsh conditions (presence of air and moisture) aggressive maintenance of paint systems will be necessary.
FIGURE 2-35 Fillmore Pump Station
\

CITY OF KIRKWOOD WATER MASTER PLAN
2-26
Renewal or replacement of the paint systems and a positive means for draining the vault should be considered as soon as administratively feasible.
Seismic analysis of the mechanical systems should be a consideration. Verification of structural design, construction and condition is essential given the tanks location within the New Madrid Seismic Zone (NMSZ). Additional seismic considerations are the installation of a seismic valve to protect the valve vault from damages during a major earthquake.
A seismic valve that automatically closes and isolates the vault in the event of a major earthquake may be appropriate. No additional mechanical issues noted at this time.
Based on operator input and maintenance history, analysis of the pumping conditions, and pump and motor design should be started as soon as administratively feasible, with follow on replacement as appropriate.
2.11.4 Electrical and Control Systems The Fillmore pump station electrical systems were installed with the pump station and are generally in good condition. Generally the electrical equipment maintenance appeared sufficient. Based on the condition analysis and expected useful life, the electrical systems would have approximately 19-years of service remaining, with replacement in the year 2032.
Missouri Department of Natural Resources (MDNR), Design Guide for Community Water Systems (2003) states the following: “Systems serving a population of 3,300 or greater shall have arrangements in place for standby or backup power and shall include these arrangements in their emergency operating plan.” The addition of standby or backup power for the Fillmore pump station should be considered as administratively feasible.
The booster pump station instrumentation consists of Foxboro supply and system pressure transmitters, and flow signal provided by MAWC. The SCADA system consists of an Allen Bradley MicroLogix PLC coupled with a CalAmp licensed frequency radio. The radios were upgraded within the past year to bring them in compliance with current FCC frequency range requirements. The SCADA and instrumentation system are new, and would be expected to have an additional 25-years of lifespan remaining, with replacement in the year 2038. There are no electrical or controls issues noted at this time.
FIGURE 2-36 Fillmore Pump Station
FIGURE 2-37 Fillmore Electrical

SECTION 2— PUMP STATION, STORAGE, AND VAULT ASSESSMENT
2-27
2.12 Pump House Seismic and Tank Discussion 2.12.1 Pump House Seismic Analysis Historically, this type of construction (unreinforced CMU) has experienced large amounts of damage, or collapse, when subjected to large seismic ground motions. International Building Code (IBC) seismic requirements have evolved significantly over the last 20+ years. It should be noted that this type of load-bearing wall lateral system is not allowed for new construction in the St. Louis region, due to poor seismic performance and high design seismic ground motions. If these pump house facilities are critical to maintaining water pressure for fire suppression after a seismic event, we recommend that the buildings be analyzed for the current building code seismic ground motions, and be upgraded to maintain operation after a design seismic event. A couple possible options include internal steel frames or structural plywood sheathing and studs anchored to the existing CMU walls. The existing foundations will also require investigation. Mechanical and electrical components may require upgrades as well, such as piping seismic bracing, flexible pipe connections, etc.
2.12.2 Tank Inspection/Maintenance and Analysis Our scope included visual inspection of exterior coatings (and interiors for elevated tanks) of tanks for signs of corrosion. This does not replace a proper full inspection as part of a maintenance program as recommended below. The American Water Works Association (AWWA) standard ANSI/AWWA D100-11, Welded Carbon Steel Tanks for Water Storage, states “Properly operated and maintained welded steel water tanks can have almost unlimited service life.” It goes on to recommend “Inspection of the interior and exterior of the entire tank with corrective maintenance at three-year intervals.” It is recommended that all of the water tanks be inspected and maintained in accordance with AWWA Manual M42, Steel Water-Storage Tanks. ANSI/AWWA D102-11, Coating Steel Water Storage Tanks, provides methods for coating or recoating steel water storage tanks.
Our scope included visual inspection of tanks for any structural issues, such as tank shell buckling, foundation differential settlement, etc. No structural issues were noted for any of the elevated or ground supported tanks. It is recommended that the existing water tank structural shells and foundations be verified for conformance to IBC and ANSI/AWWA D100-11, for performance during a design seismic event. Since three of the tanks (all but the Rose Hill water tank) are over 30 years old, verification of the existing tank/foundation construction could prove difficult if original construction documents are not available.

SECTION 3
3-1
O&M Facilities, Fire Hydrants, Meters, Valves
3.1 O&M Facilities The Water Department is housed in two locations: the primary office being located at 212 South Taylor Avenue (also shared with the Electrical Department) and the water O&M Facility located at 345 South Fillmore Avenue which is shared with the Public Works Department. The Water Department currently has one building with six (6) bays. The entire facility is located within a secure, fenced-in area. There are no plans for expansion at this time.
3.2 Fire Hydrants The Water Department currently maintains 1,183 fire hydrants. Although fire hydrants are often used for other purposes, their primary function is for the supply of water for fire protection. Any other use is considered of secondary importance and should be controlled rigorously. The ability for fire hydrants to serve the purpose of protecting the health and welfare of the public and protection of property is based on:
Proper location Proper standards for installation Proper maintenance Properly sized distribution system pipelines serving the fire hydrant
The city’s code of ordinances; Appendix B requires fire hydrants to be installed fire hydrants shall be located as required by the Insurance Services Offices (ISO) of Missouri and the City of Kirkwood Fire Marshal and Water Department Director. Fire hydrants shall be spaced no more than six hundred (600) feet apart and, water mains shall be a minimum of six (6) inches in size. The Fire Suppression Rating Schedule (FSRS) administered by ISO, measures the major elements of a community’s fire-suppression system. Fire hydrants: size, type, and installation account for 5% of the overall rating by ISO. The FSRS is a key metric in the determination of the fire segment, of property insurance.
The four primary external industry standards for fire hydrants are:
Insurance Services Offices of Missouri (ISO) Missouri Department of Natural Resources (MDNR) National Fire Protection Association (NFPA) American Water Works Association (AWWA)
MDNR minimum design standards for Missouri public water systems states: Hydrants should be provided at each street intersection and at intermediate points between intersections to meet the classification criteria of the state ISO or local authority. Generally, hydrant spacing may range from 350 to 600 feet, depending on the area being served. Hydrants in partially built-out areas should be spaced not to exceed 500 feet of vehicle travel distance from a building. In un-built areas, fire hydrants should be spaced not more than 1500 feet apart.
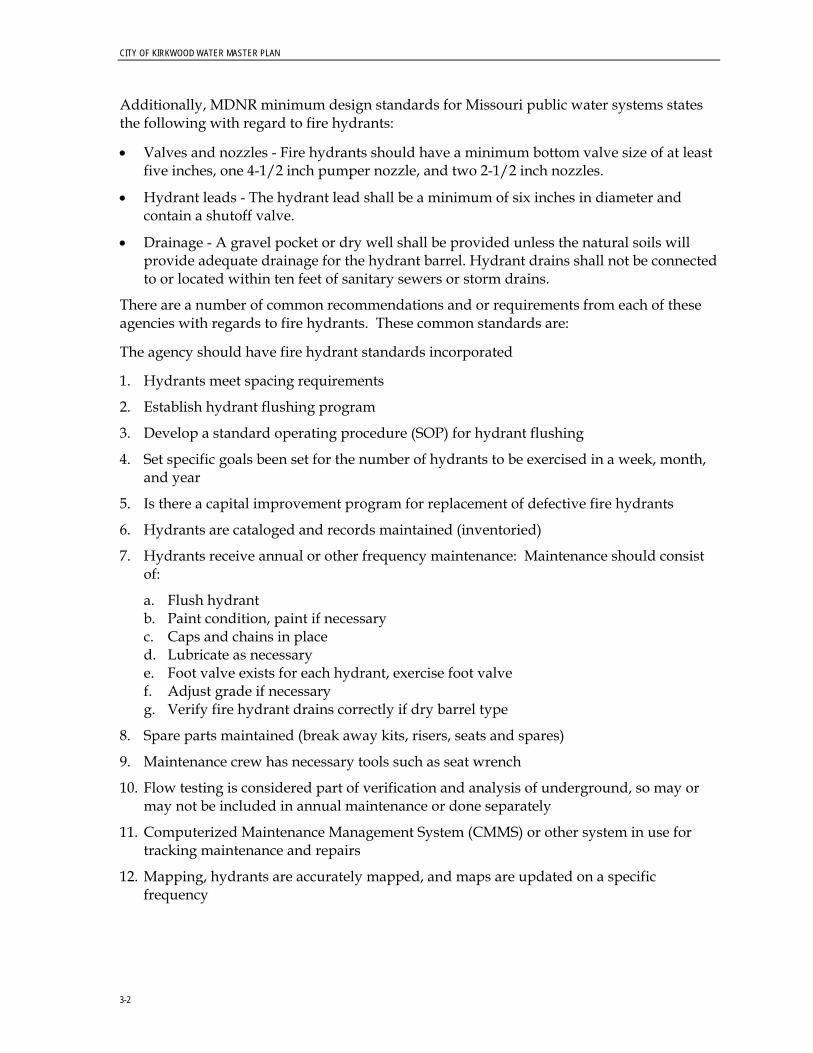
CITY OF KIRKWOOD WATER MASTER PLAN
3-2
Additionally, MDNR minimum design standards for Missouri public water systems states the following with regard to fire hydrants:
Valves and nozzles - Fire hydrants should have a minimum bottom valve size of at least five inches, one 4-1/2 inch pumper nozzle, and two 2-1/2 inch nozzles.
Hydrant leads - The hydrant lead shall be a minimum of six inches in diameter and contain a shutoff valve.
Drainage - A gravel pocket or dry well shall be provided unless the natural soils will provide adequate drainage for the hydrant barrel. Hydrant drains shall not be connected to or located within ten feet of sanitary sewers or storm drains.
There are a number of common recommendations and or requirements from each of these agencies with regards to fire hydrants. These common standards are:
The agency should have fire hydrant standards incorporated
1. Hydrants meet spacing requirements
2. Establish hydrant flushing program
3. Develop a standard operating procedure (SOP) for hydrant flushing
4. Set specific goals been set for the number of hydrants to be exercised in a week, month, and year
5. Is there a capital improvement program for replacement of defective fire hydrants
6. Hydrants are cataloged and records maintained (inventoried)
7. Hydrants receive annual or other frequency maintenance: Maintenance should consist of:
a. Flush hydrant b. Paint condition, paint if necessary c. Caps and chains in place d. Lubricate as necessary e. Foot valve exists for each hydrant, exercise foot valve f. Adjust grade if necessary g. Verify fire hydrant drains correctly if dry barrel type
8. Spare parts maintained (break away kits, risers, seats and spares)
9. Maintenance crew has necessary tools such as seat wrench
10. Flow testing is considered part of verification and analysis of underground, so may or may not be included in annual maintenance or done separately
11. Computerized Maintenance Management System (CMMS) or other system in use for tracking maintenance and repairs
12. Mapping, hydrants are accurately mapped, and maps are updated on a specific frequency

SECTION 2— PUMP STATION, STORAGE, AND VAULT ASSESSMENT
3-3
13. If hydrants are used for purposes other than fire protection, valves should be available for use on the fire hydrant for intermittent operations (the fire hydrant operating nut is not designed for intermittent use
14. Meters are available for other uses should they be allowed for accounting for and or billing water use for purposes other than fire protection
15. Backflow preventers should also be available for uses other than fire protection
3.3 Flow Meters The Water Department currently maintains 10,374 flow meters. Water use metering is an essential element of efficiency and conservation management, and is necessary in order to conduct a system audit. Metering is a requirement for loss control, accounting and rate making, verification of water and cost savings, and the evaluation of the effectiveness of efficiency and conservation measures. Metering must be provided at all important water production processes and delivery locations including at the supply source, at critical in-plant control points, at wholesale delivery points, and at service connections. An effective metering program allows comparison of measured flows in the system and metered deliveries to customers, which can be used to identify leaks.
Meters can only provide these benefits if they are accurate. Unfortunately, water meters are not 100 percent accurate and can lose their sensitivity over time and fail to accurately monitor how much water customers are consuming. Inaccurate water meters not only result in lost income for the utility, they also prevent the utility from realizing the potential for greater savings. Accurate assessment of water usage is vital in accurate utility bills, and conserving water in drought conditions. In order to assure water is being accounted for accurately, meters need to be selected, installed, operated and maintained using generally accepted industry standards. Meters should be regularly calibrated and tested in accordance with the manufacturer’s recommendations or the guidelines recommended by the American Water Works Association (AWWA), Manual for Water Meters-Selection, Installation, Testing, and Maintenance (AWWA M6). MDNR also requires each new service connection shall be individually metered. Accurate metering of bulk water meters (master meters) is critical for both financial stability and for use in determination of unaccounted for water (water purchased – water billed = unaccounted for water).
The city’s 2011 water department Performance Measures suggests that non-revenue water has been increasing year over year (2009-2011), amounting to an increase of 6% from the years 2009 to 2011. Non-revenue water was reported as 22.1% in the year 2011. Generally non-revenue water losses greater than 20% are considered significant opportunities for improvement. Kirkwood’s non-revenue water percentage and increasing trend suggests opportunity for Kirkwood to decrease costs and or increase revenue. A comprehensive water audit should be considered to identify these opportunities.
Best management practices for water meters include:
1. Meter standards incorporated
2. Meter specifications (right meters for service)

CITY OF KIRKWOOD WATER MASTER PLAN
3-4
3. Meter verification/calibration (small meters every 5-10 years, and large meters every 1-4 years)
4. Meters available and in use for construction (fire hydrants and or temporary connections)
5. CMMS or other system in use for tracking maintenance and repairs
6. Mapping, meters are accurately mapped, and maps are updated on a specific frequency
7. System is in place for unusual usage (usually meter reading or billing program compare monthly usage with historic use, and generate a list of re-reads or work orders)
8. Spare parts maintained (meters, meter setters, meter boxes and meter registers)
9. Meter reading should be done on a fixed interval
3.4 Valves The Water Department currently maintains 11,002 water valves. Valves are an integral part of the water systems and are designed to control, regulate, stop and start water flowing in the pipes. In emergencies, the exact location and operability of the valves in the system is critical to shut down and isolate the affected section of main in the least amount of time to reduce flooding, the amount of water lost to the environment, and in minimizing the collateral damage to adjacent property and infrastructure during the break.
MDNR minimum design standards for Missouri public water systems states: Sufficient valves shall be provided on water mains so that inconvenience and sanitary hazards to customers will be minimized during repairs. Valves should be located at not more than 500 foot intervals in commercial districts and at not more than one block (or 800 foot) intervals in residential or other districts. Where systems serve widely scattered customers and where future development is not expected, the valve spacing should be at every water main branch on both the feeder main and the branch line.
According to AWWA, a valve exercising is a procedure that verifies proper location, operation, and material condition of valves, and initiates replacement as necessary. The physical operation of a valve and the documentation of the actions and procedures necessary to do so are equally important. An asset management system may need to be developed to facilitate the Valve Exercise Program.
Best management practices for valve management include:
1. Establish valve exercise program
2. Develop a standard operating procedure (SOP) for valve exercising
3. Set specific goals been set for the number of valves (of all kinds) to be exercised in a week, month, and year
4. Is there a capital improvement program for replacement of defective valves
5. Are valve activation directions standardized, or are valve turning directions (left & right-turn) adequately marked

SECTION 2— PUMP STATION, STORAGE, AND VAULT ASSESSMENT
3-5
6. Valve standards in place (right valve for application)
7. Valve spacing is adequate
8. Valves are exercised, should be no less that 20% annually
9. Valves are maintained (boxes cleaned, and maintained at grade)
10. CMMS or other system in use for tracking maintenance and repairs
11. Mapping, valves are accurately mapped, and maps are updated on a specific frequency
12. Spare parts maintained (valves, valve boxes, valve box riser rings, packing gland materials
13. System is in place for determination of valves for system isolation and for making sure all valves are re-opened when isolation is complete

Appendix E Rate/Financial Impact Analysis

1
T E C H N I C A L M E M O R A N D U M
City of Kirkwood, MO Water Master Plan
Rate/Financial Impact Analysis
PREPARED FOR: City of Kirkwood
PREPARED BY: CH2M HILL
DATE: April 25, 2014
PROJECT NUMBER: 472012
Introduction
The City of Kirkwood owns and operates their water utility and is accountable for the following:
• Operation and Maintenance to Maintain Level of Service
• Capital Improvement Projects (CIP) to Meet Water Needs
• Renewal and Replacement (R&R) of Aging Assets
• Financial Planning to Meet Water Utility Needs
In order to plan for the renewal and replacement of aging assets, CH2M HILL conducted a Master Plan
Study. The study identified water system needs and developed cost estimates for CIP and R&R projects
based on 75-year and 100-year useful life durations for piping assets to compare against the current City of
Kirkwood Strategic Plan. Based on the results of the Master Plan Study, a rate impact analysis was
conducted to evaluate rates and perform financial planning for the water utility.
This technical memorandum describes the following:
• Master Plan CIP and R&R alternatives evaluated as part of the rate impact analysis.
• Rate impacts based on the current rate structure.
• Rate impacts based on an infrastructure charge based on volume of consumption.
• Rate impacts based on infrastructure charge based on monthly flat rate.
Master Plan Study
Hydraulic modeling and facility assessments were conducted to establish the costs of CIPs and R&Rs for the
water utility assets. The following general project categories were considered, but specific details regarding
individual projects can be found in other technical memoranda developed for the Master Plan.
Project Categories
Capital Improvement Projects
• Studies
• Facility Security Upgrades
• Pump Station Upgrades (mechanical and electrical)
• Storage Tank Upgrades (inspections, recoating, and fencing)
Renewals and Replacements
• Water Mains
• Hydrants
• Meters
• Valves

RATE/FINANCIAL IMPACT ANALYSIS
2
Useful Life Options
The following three useful life scenarios were evaluated:
Option #1: 75-year Useful Life Scenario (Planning Level)
The 75-year useful life scenario assumes water distribution system assets have a design life (useful life) of 75
years. The total estimated costs over a 20-year period is $50,000,000 ($7,900,000 for CIP projects and
$42,100,000 for R&R projects). Figure 1 provides graphical summary of the annual costs for the 75-year
Useful Life Scenario.
FIGURE 1
Estimated Annual Costs for 75-year Useful Life Scenario (2014 Dollars)
$0.0
$0.5
$1.0
$1.5
$2.0
$2.5
$3.0
1 2 3 4 5 6 7 8 9 10 11 12 13 14 15 16 17 18 19 20
Mil
lio
ns
CIP R&R

RATE/FINANCIAL IMPACT ANALYSIS
DRAFT TM RATE ANALYSIS APRIL 25 3
Option #2: 100 year (Implementation Level)
The 100-year useful life scenario assumes water distribution system assets have a design life (useful life) of
100 years. The total estimated costs over a 20-year period is $37,500,000 ($5,600,000 for CIP projects and
$31,900,000 for R&R projects). Figure 2 provides graphical summary of the annual costs for the 100-year
Useful Life Scenario.
FIGURE 2
Estimated Annual Costs for 100-year Useful Life Scenario (2014 Dollars)
Option #3: City of Kirkwood Strategic Plan
The strategic plan scenario assumes a set dollar amount of $1,200,000 (2014 dollars) for renewal and
replacement projects. This translates to a useful life of greater than 200 years. The master plan CIP costs are
based on the 100-year useful life scenario. The total estimated costs over a 20-year period is $29,600,000
($5,600,000 for CIP projects and $24,000,000 for R&R projects). Figure 3 provides graphical summary of the
annual costs for the Strategic Plan Scenario.
$0.0
$0.5
$1.0
$1.5
$2.0
$2.5
$3.0
1 2 3 4 5 6 7 8 9 10 11 12 13 14 15 16 17 18 19 20
Mil
lio
ns
CIP R&R
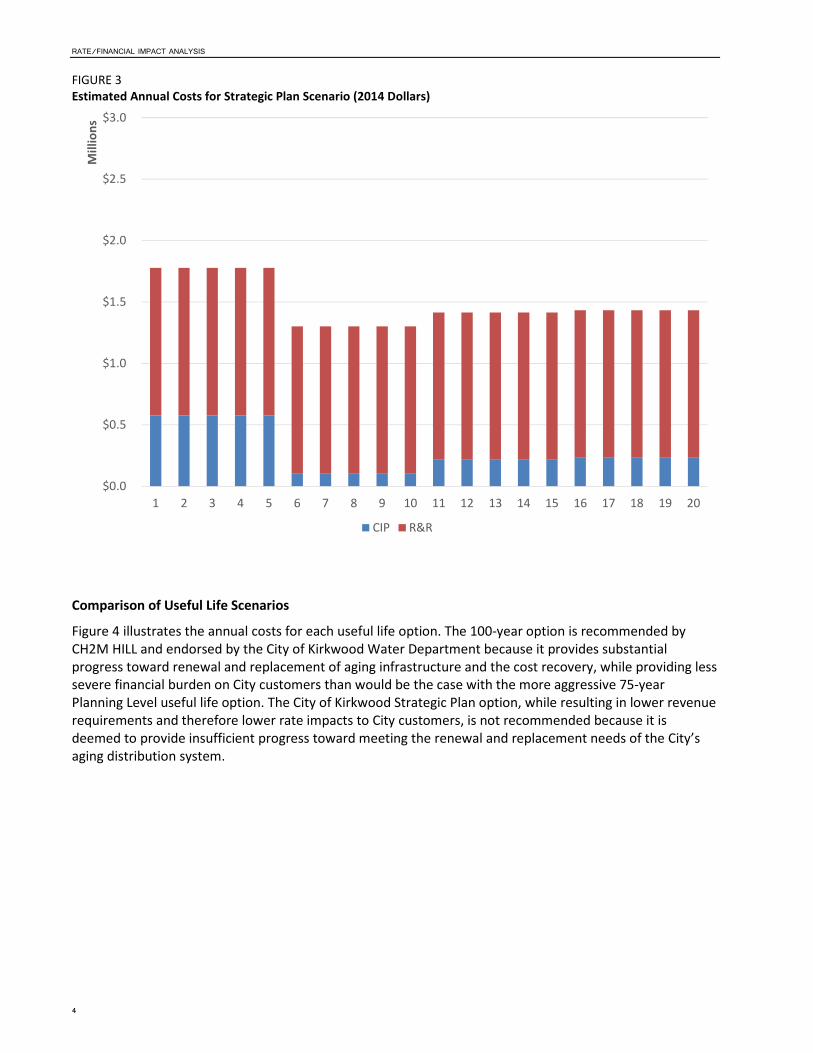
RATE/FINANCIAL IMPACT ANALYSIS
4
FIGURE 3
Estimated Annual Costs for Strategic Plan Scenario (2014 Dollars)
Comparison of Useful Life Scenarios
Figure 4 illustrates the annual costs for each useful life option. The 100-year option is recommended by
CH2M HILL and endorsed by the City of Kirkwood Water Department because it provides substantial
progress toward renewal and replacement of aging infrastructure and the cost recovery, while providing less
severe financial burden on City customers than would be the case with the more aggressive 75-year
Planning Level useful life option. The City of Kirkwood Strategic Plan option, while resulting in lower revenue
requirements and therefore lower rate impacts to City customers, is not recommended because it is
deemed to provide insufficient progress toward meeting the renewal and replacement needs of the City’s
aging distribution system.
$0.0
$0.5
$1.0
$1.5
$2.0
$2.5
$3.0
1 2 3 4 5 6 7 8 9 10 11 12 13 14 15 16 17 18 19 20
Mil
lio
ns
CIP R&R
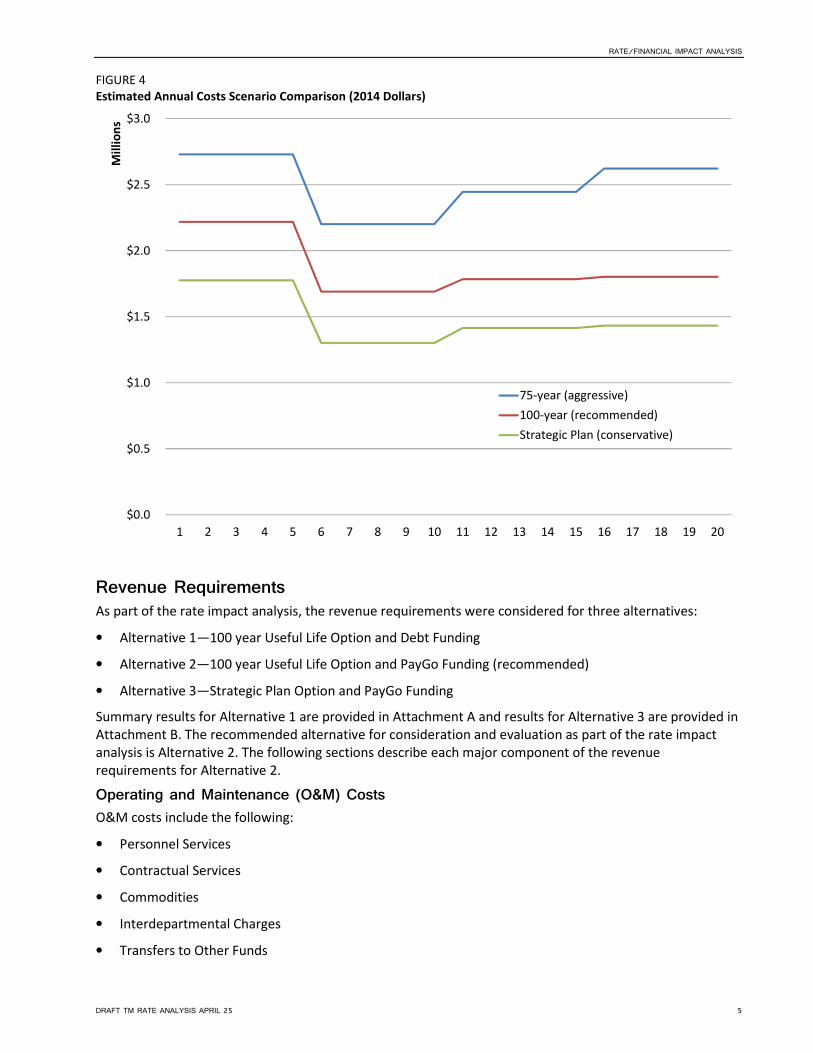
RATE/FINANCIAL IMPACT ANALYSIS
DRAFT TM RATE ANALYSIS APRIL 25 5
FIGURE 4
Estimated Annual Costs Scenario Comparison (2014 Dollars)
Revenue Requirements
As part of the rate impact analysis, the revenue requirements were considered for three alternatives:
• Alternative 1—100 year Useful Life Option and Debt Funding
• Alternative 2—100 year Useful Life Option and PayGo Funding (recommended)
• Alternative 3—Strategic Plan Option and PayGo Funding
Summary results for Alternative 1 are provided in Attachment A and results for Alternative 3 are provided in
Attachment B. The recommended alternative for consideration and evaluation as part of the rate impact
analysis is Alternative 2. The following sections describe each major component of the revenue
requirements for Alternative 2.
Operating and Maintenance (O&M) Costs
O&M costs include the following:
• Personnel Services
• Contractual Services
• Commodities
• Interdepartmental Charges
• Transfers to Other Funds
$0.0
$0.5
$1.0
$1.5
$2.0
$2.5
$3.0
1 2 3 4 5 6 7 8 9 10 11 12 13 14 15 16 17 18 19 20
Mil
lio
ns
Estimated Annual CIP and R&R Costs (2014 Dollars)
75-year (aggressive)
100-year (recommended)
Strategic Plan (conservative)

RATE/FINANCIAL IMPACT ANALYSIS
6
Starting in FY 2016, an annual adjustment (decrease) of $161,160 is made to account for reduction on meter
reading costs resulting from the AMR program.
TABLE 1
Projected O&M Expenditures
Expense Category
Projected
FY 2015 FY 2016 FY 2017 FY 2018 FY 2019
Personnel Services $ 1,398,461 $ 1,440,415 $ 1,483,627 $ 1,528,136 $ 1,573,980
Contractual Services 1,420,609 1,463,227 1,507,124 1,552,338 1,598,908
Commodities 271,195 279,331 287,711 296,342 305,232
Interdepartmental Charges 449,820 463,315 477,214 491,530 506,276
Transfers to Other Funds 210,000 210,000 210,000 210,000 210,000
Meter Reading Adjustment - (161,160) (164,383) (167,671) (171,024)
Total in Escalated Dollars* $ 3,750,085 $ 3,695,128 $ 3,801,293 $ 3,910,676 $ 4,023,373
* assumes 2 percent inflation
Debt Service
The rate impact analyses assume no new debt issuance for the CIP and R&R projects identified as part of the
Master Plan Study. Since the debt service is associated with Certificate of Participations there is no debt
coverage requirement. Table 2 summarizes the annual debt service for FY 2015 to FY 2019. The debt service
includes annual payments for the following:
• 2005 Certificate of Participation.
• 2009 Certificate of Participation.
• Projected debt service on Certificate of Participation for Automated Meter Reading (AMR) program
approved by City Council in 2014. The debt service schedule is based on the preliminary schedule
provided by the City.
TABLE 2
Existing and Projected Debt Service
Annual Payments FY 2015 FY 2016 FY 2017 FY 2018 FY 2019
2005 COP $ 264,093 $ 263,913 $ 263,475 $ 262,775 $ 261,808
2009 COP $ 541,284 $ 536,403 $ 535,483 $ 528,468 $ 525,680
Projected COP for AMR $ 297,015 $ 295,990 $ 294,248 $ 296,685 $ 293,273
Total Debt Service $1,102,392 $1,096,306 $1,093,205 $1,087,928 $1,080,761
Pay-As-You-Go (PayGo) Capital Costs
PayGo capital costs include the following:
• Current Plan (Draft Capital Budgets: Five Year Capital Plans for Fiscal Years 2014/15 – 2018/19)
• Master Plan CIP
• Master Plan R&R
Based on discussions with City staff, there are no plans to issue new debt and the preferred funding method
for projected CIP and R&R is PayGo.

RATE/FINANCIAL IMPACT ANALYSIS
DRAFT TM RATE ANALYSIS APRIL 25 7
Current CIP Plan
Current CIP projects that are identified in the City’s current capital budget plan are presented in the Council
Draft Capital Budgets: Five Year Capital Plans (Fiscal Years 2014/15 – 2018/19), dated January 22, 2014. Cost
adjustments were made for projects identified as Distribution System Improvements to avoid double
counting of Master Plan R&R projects. Table 3 provides a summary for the five year capital plan.
TABLE 3
Current Plan CIP
Capital Project Projected
FY 2015
FY 2016 FY 2017 FY 2018 FY 2019
Fire Hydrant Installations $10,000 $10,000 $10,000 $10,000 $10,000
Tower/Tank Repainting 265,000 225,000 0
Distribution System Improvements 529,550 885,500 592,000 1,079,700 1,169,050
Adjustment to Distribution System for Master Plan R&R (885,500) (592,000) (1,079,700) (1,169,050)
Billing Envelope Stuffer/Folder (1/3) 10,000 0 0 0 0
Pickup Truck w/ Service Bodies 54,000 32,000 27,000 27,000
Interior Painting of Purchasing/Utilities Building (1/3) 9,000 0 0 0
Purch/Utilities, Heat Pumps Replacement (1/3) 0 0 30,000 0
Backhoe/Loader 0 0 145,000 0
Total $823,550 $64,000 $442,000 $37,000 $37,000
Master Plan CIP
Master Plan CIP projects estimated costs are presented in the Master Plan Study section. There were three
useful life scenarios evaluated. The recommendation presented to City Council assumed 100-year useful life
for the Master Plan CIP items. Table 4 provides a list of CIP projects evaluated as part of the Master Plan CIP.
TABLE 4
Estimated Annual Master Plan Costs (100-year useful life) (escalated dollars, 3 percent inflation rate)
Project Name Project Description FY 2015 2016 2017 2018 2019
Leak Detection Study 15,000 15,300 15,606 15,918 16,236
Swan PS Area Pipes 307 LF - 8", 2,070 LF - 12" water
main
108,400 110,568 112,779 115,035 117,336
Fillmore PS Area Pipes 1,312 LF - 8" water main 54,800 55,896 57,014 58,154 59,317
Woodbine Area Pipes 1,240 LF - 8" water main 51,800 52,836 53,893 54,971 56,070
Facility Security Upgrades Install security cameras at 10
facilities
11,000 11,220 11,444 11,673 11,907
Swan PS Mechanical Replace pumps and
appurtenances
16,000 16,320 16,646 16,979 17,319
Swan PS Electrical Provide generator for backup
power
42,480 43,330 44,196 45,080 45,982
Dougherty Ferry Tank
Inspection
Inspect tank 6,000 6,120 6,242 6,367 6,495
Dougherty Ferry Tank Recoating Repaint/recoat of tank 30,060 30,661 31,274 31,900 32,538

RATE/FINANCIAL IMPACT ANALYSIS
8
TABLE 4
Estimated Annual Master Plan Costs (100-year useful life) (escalated dollars, 3 percent inflation rate)
Project Name Project Description FY 2015 2016 2017 2018 2019
Dougherty Ferry Civil Replacement of fencing 900 918 936 955 974
Dougherty Ferry Mechanical Replace valves and
appurtenances
14,400 14,688 14,982 15,281 15,587
Dougherty Ferry Electrical Replace electrical systems 10,000 10,200 10,404 10,612 10,824
Rose Hill Tank Inspection Inspect tank 16,800 17,136 17,479 17,828 18,185
Park #1 Tank Mechanical Replace pumps and
appurtenances
44,700 45,594 46,506 47,436 48,385
Park #1 Tank Electrical Replace electrical systems 20,000 20,400 20,808 21,224 21,649
Park #1 Tank Inspection Inspect tank 36,020 36,740 37,475 38,225 38,989
Park #2 Tank Mechanical Replace pumps and
appurtenances
47,900 48,858 49,835 50,832 51,849
Park #2 Tank Electrical Replace electrical systems 20,000 20,400 20,808 21,224 21,649
Park #2 Tank Inspection Inspect tank 18,100 18,462 18,831 19,208 19,592
Trailer Mounted Generator Provide generator for backup
power
11,680 11,914 12,152 12,395 12,643
Master Plan CIP Total 576,040 587,561 599,312 611,298 623,524
Master Plan R&R
Master Plan R&R projects estimated costs are presented in the Master Plan Study section. There were three
useful life scenarios evaluated. The recommendation presented to City Council assumed 100-year useful life
for the Master Plan R&R items. Table 5 provides a list of R&R projects evaluated as part of the Master Plan
Study.
TABLE 5
Estimated Annual Master Plan Costs (100-year useful life) (escalated dollars, 3 percent inflation rate)
Project Description FY 2015 2016 2017 2018 2019
6" Water Main* 0 $839,093 $855,875 $872,992 $890,452
8" Water Main 0 274,992 280,492 286,102 291,824
10" Water Main 0 38,780 39,556 40,347 41,154
12" Water Main 0 102,510 104,560 106,651 108,784
14" Water Main 0 13,648 13,921 14,199 14,483
16" Water Main 0 24,970 25,469 25,978 26,498
20" Water Main 0 30,580 31,191 31,815 32,451
24" Water Main 0 1,550 1,581 1,613 1,645
Fire Hydrants 0 52,734 53,789 54,864 55,962
5/8" Meter 0 11,832 12,069 12,310 12,556
3/4" Meter 0 48,144 49,107 50,089 51,091
1" Meter 0 17,401 17,749 18,104 18,466
1 1/2" Meter 0 1,571 1,602 1,634 1,667
2" Meter 0 4,182 4,266 4,351 4,438
3" Meter 0 10,914 11,132 11,355 11,582
4" Meter 0 27,683 28,236 28,801 29,377

RATE/FINANCIAL IMPACT ANALYSIS
DRAFT TM RATE ANALYSIS APRIL 25 9
TABLE 5
Estimated Annual Master Plan Costs (100-year useful life) (escalated dollars, 3 percent inflation rate)
Project Description FY 2015 2016 2017 2018 2019
6" Meter 0 21,026 21,447 21,876 22,313
6" Gate Valve 0 49,919 50,917 51,936 52,974
8" Gate Valve 0 20,747 21,162 21,585 22,017
10" Gate Valve 0 4,488 4,578 4,669 4,763
12" Gate Valve 0 12,913 13,171 13,435 13,704
14" Gate Valve 0 4,366 4,453 4,542 4,633
16" Gate Valve 0 13,872 14,149 14,432 14,721
20" Gate Valve 0 22,379 22,826 23,283 23,749
24" Gate Valve 0 25,112 25,615 26,127 26,649
Total 0 $1,675,405 $1,708,913 $1,743,092 $1,777,953
* Includes all pipe 6" and smaller
Non-Rate Revenues
Based on cost of service and rate setting guidance, non-rate revenues are deducted. As part of the rate
impact analysis, Table 6 provides a summary of the assumed annual non-rate revenues. To be conservative,
amounts are not escalated given the uncertainty of future revenues.
TABLE 6
Non-Rate Revenue (2014 Dollars)
Non-Rate Revenue Line Items Annual Amount (FY2015-19)
Water Taps $10,000
Investment Income 37,500
Miscellaneous 10,000
Lease Rental 105,944
Interdepartmental / Usage 48,400
Federal Interest Subsidy 102,165
Sale of Fixed Assets 9,000
Total $323,009
Summary of Revenue Requirements
Table 7 provides a tabular summary of the revenue requirements, which includes the costs for the
recommended 100-year useful life scenario for the Master Plan CIP and R&R. Figure 5 summarizes the
distribution of the revenue requirement components for the period FY 2015 to 2019, expressed as a
percentage.

RATE/FINANCIAL IMPACT ANALYSIS
10
TABLE 7
Revenue Requirements (escalated dollars)
Revenue Requirements
Projected
FY 2015
FY 2016 FY 2017 FY 2018 FY 2019
Operating & Maintenance
Personnel Services $1,398,461 $1,440,415 $1,483,627 $1,528,136 $1,573,980
Contractual Services 1,420,609 1,463,227 1,507,124 1,552,338 1,598,908
Commodities 271,195 279,331 287,711 296,342 305,232
Interdepartmental Charges 449,820 463,315 477,214 491,530 506,276
Transfers to Other Funds 210,000 210,000 210,000 210,000 210,000
Capital Outlay
Debt Service on COPs
Existing 805,377 800,316 798,958 791,243 787,488
Projected AMR 297,015 295,990 294,248 296,685 293,273
PayGo (current plan CIP) 823,550 65,920 468,918 40,431 41,644
PayGO (Master Plan CIP) 576,040 587,561 599,312 611,298 623,524
PayGo (Master Plan R&R) 0 1,675,405 1,708,913 1,743,092 1,777,953
Non-Rate Revenues (323,009) (323,009) (323,009) (323,009) (323,009)
Net Revenue Requirements $5,929,058 $6,957,830 $7,503,954 $7,236,920 $7,393,676
FIGURE 5
Summary of Revenue Requirements (2015-2019)

RATE/FINANCIAL IMPACT ANALYSIS
DRAFT TM RATE ANALYSIS APRIL 25 11
Rate Impact Analysis
Based on the revenue requirements for Alternative 2 (presented in previous section), three rate impact
scenarios were developed to illustrate the impact of rate structure options under consideration by the City:
• Scenario 1—Current Rate Structure, 100-year Infrastructure Replacement, PayGo CIP Funding
• Scenario 2—Eliminate Hydrant Fee, Add Infrastructure Fee ($/CCF), 100-year Infrastructure
Replacement, PayGo CIP Funding
• Scenario 3—Eliminate Hydrant Fee, Add Infrastructure Fee ($/month), 100-year Infrastructure
Replacement, PayGo CIP Funding
Assumptions
The following assumptions were used to complete the rate impact analysis:
• As part of the AMR program, annual meter reading costs decrease by approximately $161,200 and
annual rate revenues increase by approximately $164,000.
• Annual revenues of $50,400 for unmetered fire protection.
• Recognition of Uncollected Rate Revenues equal to 0.5 percent of rate revenue (i.e., volume, monthly
service, and month hydrant charges).
• Revenue projections for the volume based charged is based on 1,333,000 CCF per year. This is consistent
with planning level assumptions used by the City.
• Revenue projections for the hydrant fee is based on 10,200 customers. This is consistent with planning
level assumptions used by the City.
• Revenue projects for the monthly service charge is based on meter size and corresponding rate. Table 8
summarizes the number of accounts by meter size. This is consistent with planning level assumptions
used by the City.
The following sections provide the results of the rate impact analysis for a five-year period (FY 2015 – 2019).
TABLE 8
Number of Accounts by Meter Size
Meter Size Number of Accounts
058 2555
075 6540
100 937
150 68
200 142
300 24
400 17
600 5

RATE/FINANCIAL IMPACT ANALYSIS
12
Scenario 1—Current Rate Structure, 100-year Infrastructure Replacement, PayGo CIP Funding
Scenario 1 evaluates the rate impacts based on the current rate structure, which consists of the following
rate components:
• Volume charge ($/CCF)
• Monthly service charge ($/month) by meter size
• Hydrant fee ($/month)
Table 9 summarizes the projected rates for the revenue requirements identified under Alternative 2. The
projected rates result in cost recovery as summarized in Figure 6. Table 10 provides the financial results for
Scenario 1. An estimated typical bill analysis associated with Scenario 1 is presented in Table 11 for 5.7 CCF
and 3/4-inch meter and Table 12 for 20 CCF and 2-inch meter.
TABLE 9
Projected Rates for Rate Scenario 1
Projected
FY 2015
FY 2016 FY 2017 FY 2018 FY 2019
Volume Charge ($/CCF) $2.777 $3.082 $3.391 $3.713 $4.047
Monthly Service Charge ($/month) by
Meter Size
058 $11.10 $12.76 $14.68 $16.88 $19.41
075 $12.39 $14.24 $16.38 $18.84 $21.66
100 $15.01 $17.26 $19.85 $22.82 $26.25
150 $21.46 $24.68 $28.38 $32.64 $37.53
200 $29.21 $33.59 $38.63 $44.42 $51.09
300 $49.93 $57.42 $66.04 $75.94 $87.33
400 $73.22 $84.20 $96.83 $111.36 $128.06
600 $137.97 $158.66 $182.46 $209.83 $241.30
Monthly Hydrant Fee ($/month) $2.45 $2.57 $2.70 $2.83 $2.97
FIGURE 6
Cost Recovery for Rate Scenario 1 by Rate Component (FY 2015 – 2019)
Volume
Charge
($/CCF)
66%
Monthly
Service
Charge
($/month)
29%
Hydrant Fee
5%

RATE/FINANCIAL IMPACT ANALYSIS
DRAFT TM RATE ANALYSIS APRIL 25 13
TABLE 10
Projected Financial Results—Scenario 1
FY 2015 FY 2016 FY 2017 FY 2018 FY 2019
Beginning Cash Balance: $6,000,000 $5,680,221 $5,289,930 $5,021,699 $5,763,925
SOURCES
Volume Charge $3,701,727 4,108,917 4,519,809 4,949,191 5,394,618
Monthly Service Charge $1,585,888 1,823,771 2,097,337 2,411,937 2,773,728
Hydrant Fee 299,452 314,424 330,145 346,653 363,985
Unmetered Fire Protection 50,400 50,400 50,400 50,400 50,400
Additional Revenue from AMR - 164,000 164,000 164,000 164,000
Recognition of Uncollected Rate
Revenues (28,187) (32,308) (35,808) (39,611) (43,734)
Non-Rate Revenue 323,009 323,009 323,009 323,009 323,009
TOTAL SOURCES $5,932,288 $6,752,214 $7,448,891 $8,205,578 $9,026,006
USES
Base O&M Expense 3,750,085 3,856,288 3,965,676 4,078,346 4,194,397
Reduce Meter Reading 0 (161,160) (164,383) (167,671) (171,024)
Existing COPs 805,377 800,316 798,958 791,243 787,488
New COPs (AMR) 297,015 295,990 294,248 296,685 293,273
PayGo CIP and R&R 1,399,590 2,351,072 2,822,624 2,464,749 2,538,691
TOTAL USES 6,252,067 7,142,505 7,717,122 7,463,352 7,642,824
Ending Cash Balance $5,680,221 $5,289,930 $5,021,699 $5,763,925 $7,147,107
TABLE 11
Scenario 1—Typical Bill based on 5.7 CCF per month and 3/4"-meter
Rate Component FY14 FY15 FY16 FY17 FY18 FY19
Volume Charge $14.28 $15.83 $17.57 $19.33 $21.16 $23.07
Monthly Service Charge $10.77 $12.39 $14.24 $16.38 $18.84 $21.66
Monthly Hydrant Fee $2.33 $2.45 $2.57 $2.70 $2.83 $2.97
Monthly Infrastructure Charge - - - - - -
Total $27.38 $30.66 $34.38 $38.40 $42.83 $47.70
Percent Increase 12% 12% 12% 12% 11%
TABLE 12
Scenario 1—Typical Bill based on 20 CCF per month and 2"-meter
Rate Component FY14 FY15 FY16 FY17 FY18 FY19
Volume Charge $50.09 $55.54 $61.65 $67.81 $74.26 $80.94
Monthly Service Charge $25.40 $29.21 $33.59 $38.63 $44.42 $51.09
Monthly Hydrant Fee $2.33 $2.45 $2.57 $2.70 $2.83 $2.97
Monthly Infrastructure Charge - - - - - -
Total $77.82 $87.20 $97.81 $109.14 $121.51 $135.00
Percent Increase 12% 12% 12% 11% 11%

RATE/FINANCIAL IMPACT ANALYSIS
14
Scenario 3—Eliminate Hydrant Fee, Add Infrastructure Fee ($/CCF), 677-year Infrastructure Replacement, PayGo CIP Funding
Scenario 2 evaluates the rate impacts based on the current rate structure, which consists of the following
rate components:
• Volume charge ($/CCF)
• Monthly service charge ($/month) by meter size
• Infrastructure Fee ($/CCF)
Table 13 summarizes the projected rates for the revenue requirements identified under Alternative 2. The
projected rates result in cost recovery as summarized in Figure 7. Table 14 provides the financial results for
Scenario 2. An estimated typical bill analysis associated with Scenario 1 is presented in Table 15 for 5.7 CCF
and 3/4-inch meter and Table 16 for 20 CCF and 2-inch meter.
TABLE 13
Projected Rates for Rate Scenario 2
Projected
FY 2015
FY 2016 FY 2017 FY 2018 FY 2019
Volume Charge ($/CCF) $2.630 $2.762 $2.900 $3.045 $3.197
Monthly Service Charge ($/month) by
Meter Size
058 $10.13 $10.64 $11.17 $11.73 $12.31
075 $11.31 $11.88 $12.47 $13.09 $13.74
100 $13.70 $14.39 $15.11 $15.86 $16.65
150 $19.60 $20.58 $21.61 $22.68 $23.81
200 $26.67 $28.02 $29.41 $30.87 $32.40
300 $45.60 $47.90 $50.27 $52.77 $55.39
400 $66.86 $70.23 $73.72 $77.39 $81.23
600 $125.99 $132.33 $138.91 $145.81 $153.05
Monthly Infrastructure Fee ($/CCF) $1.038 $1.090 $1.145 $1.202 $1.262
FIGURE 7
Cost Recovery for Rate Scenario 2 by Rate Component (FY 2015 – 2019)
Volume
Charge
($/CCF)
55%
Monthly
Service
Charge
($/month)
26%
Infrastruc
ture Fee
($/CCF)
19%
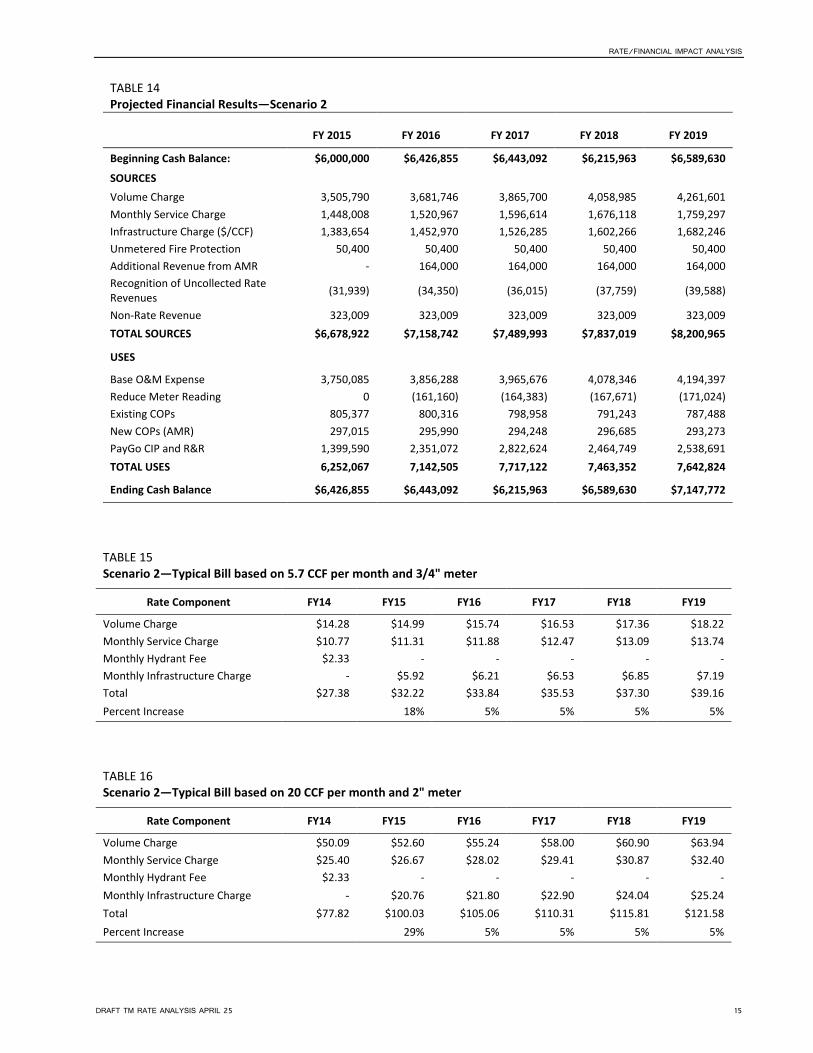
RATE/FINANCIAL IMPACT ANALYSIS
DRAFT TM RATE ANALYSIS APRIL 25 15
TABLE 14
Projected Financial Results—Scenario 2
FY 2015 FY 2016 FY 2017 FY 2018 FY 2019
Beginning Cash Balance: $6,000,000 $6,426,855 $6,443,092 $6,215,963 $6,589,630
SOURCES
Volume Charge 3,505,790 3,681,746 3,865,700 4,058,985 4,261,601
Monthly Service Charge 1,448,008 1,520,967 1,596,614 1,676,118 1,759,297
Infrastructure Charge ($/CCF) 1,383,654 1,452,970 1,526,285 1,602,266 1,682,246
Unmetered Fire Protection 50,400 50,400 50,400 50,400 50,400
Additional Revenue from AMR - 164,000 164,000 164,000 164,000
Recognition of Uncollected Rate
Revenues (31,939) (34,350) (36,015) (37,759) (39,588)
Non-Rate Revenue 323,009 323,009 323,009 323,009 323,009
TOTAL SOURCES $6,678,922 $7,158,742 $7,489,993 $7,837,019 $8,200,965
USES
Base O&M Expense 3,750,085 3,856,288 3,965,676 4,078,346 4,194,397
Reduce Meter Reading 0 (161,160) (164,383) (167,671) (171,024)
Existing COPs 805,377 800,316 798,958 791,243 787,488
New COPs (AMR) 297,015 295,990 294,248 296,685 293,273
PayGo CIP and R&R 1,399,590 2,351,072 2,822,624 2,464,749 2,538,691
TOTAL USES 6,252,067 7,142,505 7,717,122 7,463,352 7,642,824
Ending Cash Balance $6,426,855 $6,443,092 $6,215,963 $6,589,630 $7,147,772
TABLE 15
Scenario 2—Typical Bill based on 5.7 CCF per month and 3/4" meter
Rate Component FY14 FY15 FY16 FY17 FY18 FY19
Volume Charge $14.28 $14.99 $15.74 $16.53 $17.36 $18.22
Monthly Service Charge $10.77 $11.31 $11.88 $12.47 $13.09 $13.74
Monthly Hydrant Fee $2.33 - - - - -
Monthly Infrastructure Charge - $5.92 $6.21 $6.53 $6.85 $7.19
Total $27.38 $32.22 $33.84 $35.53 $37.30 $39.16
Percent Increase 18% 5% 5% 5% 5%
TABLE 16
Scenario 2—Typical Bill based on 20 CCF per month and 2" meter
Rate Component FY14 FY15 FY16 FY17 FY18 FY19
Volume Charge $50.09 $52.60 $55.24 $58.00 $60.90 $63.94
Monthly Service Charge $25.40 $26.67 $28.02 $29.41 $30.87 $32.40
Monthly Hydrant Fee $2.33 - - - - -
Monthly Infrastructure Charge - $20.76 $21.80 $22.90 $24.04 $25.24
Total $77.82 $100.03 $105.06 $110.31 $115.81 $121.58
Percent Increase 29% 5% 5% 5% 5%

RATE/FINANCIAL IMPACT ANALYSIS
16
Scenario 8— Eliminate Hydrant Fee, Add Infrastructure Fee ($/month), 677-year Infrastructure Replacement, PayGo CIP Funding
Scenario 3 evaluates the rate impacts based on the current rate structure, which consists of the following
rate components:
• Volume charge ($/CCF)
• Monthly service charge ($/month) by meter size
• Infrastructure Fee ($/month)
Table 17 summarizes the projected rates for the revenue requirements identified under Alternative 2. The
projected rates result in cost recovery as summarized in Figure 8. Table 18 provides the financial results for
Scenario 3. An estimated typical bill analysis associated with Scenario 1 is presented in Table 19 for 5.7 CCF
and 3/4-inch meter and Table 20 for 20 CCF and 2-inch meter.
TABLE 17
Projected Rates for Rate Scenario 3
Projected
FY 2015
FY 2016 FY 2017 FY 2018 FY 2019
Volume Charge ($/CCF) $2.630 $2.762 $2.900 $3.045 $3.197
Monthly Service Charge ($/month) by
Meter Size
058 $10.13 $10.64 $11.17 $11.73 $12.31
075 $11.31 $11.88 $12.47 $13.09 $13.74
100 $13.70 $14.39 $15.11 $15.86 $16.65
150 $19.60 $20.58 $21.61 $22.68 $23.81
200 $26.67 $28.02 $29.41 $30.87 $32.40
300 $45.60 $47.90 $50.27 $52.77 $55.39
400 $66.86 $70.23 $73.72 $77.39 $81.23
600 $125.99 $132.33 $138.91 $145.81 $153.05
Monthly Infrastructure Fee ($/month) $11.21 $11.77 $12.36 $12.98 $13.63
FIGURE 8
Cost Recovery for Rate Scenario 3 by Rate Component (FY 2015 – 2019)
Volume
Charge
($/CCF)
55%
Monthly
Service
Charge
($/month)
26%
Infrastruct
ure Fee
($/month)
19%

RATE/FINANCIAL IMPACT ANALYSIS
DRAFT TM RATE ANALYSIS APRIL 25 17
TABLE 18
Projected Financial Results—Scenario 3
FY 2015 FY 2016 FY 2017 FY 2018 FY 2019
Beginning Cash Balance: $6,000,000 $6,427,142 $6,443,485 $6,215,989 $6,589,848
SOURCES
Volume Charge 3,505,790 3,681,746 3,865,700 4,058,985 4,261,601
Monthly Service Charge 1,448,008 1,520,967 1,596,614 1,676,118 1,759,297
Infrastructure Charge ($/CCF) 1,383,942 1,453,077 1,525,916 1,602,459 1,682,705
Unmetered Fire Protection 50,400 50,400 50,400 50,400 50,400
Additional Revenue from AMR - 164,000 164,000 164,000 164,000
Recognition of Uncollected Rate
Revenues (31,941) (34,351) (36,013) (37,760) (39,590)
Non-Rate Revenue 323,009 323,009 323,009 323,009 323,009
TOTAL SOURCES $6,679,208 $7,158,848 $7,489,626 $7,837,211 $8,201,422
USES
Base O&M Expense 3,750,085 3,856,288 3,965,676 4,078,346 4,194,397
Reduce Meter Reading 0 (161,160) (164,383) (167,671) (171,024)
Existing COPs 805,377 800,316 798,958 791,243 787,488
New COPs (AMR) 297,015 295,990 294,248 296,685 293,273
PayGo CIP and R&R 1,399,590 2,351,072 2,822,624 2,464,749 2,538,691
TOTAL USES 6,252,067 7,142,505 7,717,122 7,463,352 7,642,824
Ending Cash Balance $6,427,142 $6,443,485 $6,215,989 $6,589,848 $7,148,447
TABLE 19
Scenario 3—Typical Bill based on 5.7 CCF per month and 3/4" meter
Rate Component FY14 FY15 FY16 FY17 FY18 FY19
Volume Charge $14.28 $14.71 $15.29 $15.90 $16.54 $17.20
Monthly Service Charge $10.77 $11.63 $12.56 $13.56 $14.64 $15.81
Monthly Hydrant Fee $2.33 - - - - -
Monthly Infrastructure Charge - $9.77 $10.06 $10.36 $10.67 $10.99
Total $27.38 $36.10 $37.91 $39.82 $41.85 $44.00
Percent Increase 32% 5% 5% 5% 5%
TABLE 20
Scenario 3—Typical Bill based on 20 CCF per month and 2" meter
Rate Component FY14 FY15 FY16 FY17 FY18 FY19
Volume Charge $50.09 $51.60 $53.66 $55.80 $58.04 $60.36
Monthly Service Charge $25.40 $27.43 $29.62 $31.98 $34.53 $37.29
Monthly Hydrant Fee $2.33 - - - - -
Monthly Infrastructure Charge - $9.77 $10.06 $10.36 $10.67 $10.99
Total $77.82 $88.80 $93.34 $98.14 $103.24 $108.64
Percent Increase 14% 5% 5% 5% 5%

RATE/FINANCIAL IMPACT ANALYSIS
18
Summary Comparison of Rate Scenarios
• Under Scenario 1, where the current rate structure is maintained, annual rate increases are needed to
fund the estimated Master Plan CIP and R&R projects. The average annual increase in rates for the
volume charge is 10 percent, 15 percent for the service charge, and 5 percent for the hydrant fee.
Compared to Scenarios 2 and 3, rates under Scenario 1 are higher after the 5-year period (FY 2015-
2019).
• Under Scenario 2, the hydrant fee is eliminated and replaced with an infrastructure charge ($/CCF). The
initial increase in volume charge and service charge is not as much as Scenario 1 because the Master
Plan R&R costs are recovered by the new infrastructure charge. Because it is based on the amount of
water consumption, customers with lower volumes of consumptions would not experience as large of
increase in their bill as customers with higher volumes of consumption.
• Under Scenario 3, the hydrant fee is eliminated and replaced with an infrastructure charge ($/month).
The initial increase in volume charge and service charge is not as much as Scenario 1 because the Master
Plan R&R costs are recovered by the new infrastructure charge. Because the Master Plan R&R cost are
distributed equally among customers, customers with lower volumes of consumptions would experience
a larger of increase in their bill compared to customers with higher volumes of consumption.
• Table 21 provides a summary comparison of rates for FY 2014 and FY 2015. As part of this comparison,
rates for Missouri American are provided. The City’s FY 2014 rates are lower compared to Missouri
American. However, the estimated FY 2015 rates the volume charge and infrastructure for City are
higher compared to Missouri American.
• Figure 9 provides a comparison of each rate scenario for a typical residential bill based on 5.7 CCF and
3/4-inch meter. Under Scenario 1, the relative bill amount would be higher at the end of five years
compared to Scenarios 2 and 3. Depending on the amount of monthly consumption, a residential
customer would benefit better under Scenario 2.
• Figure 10 provides a comparison of each rate scenario for a typical bill based on 20 CCF and 2-inch
meter. Under Scenario 1, the relative bill amount would be higher at the end of five years compared to
Scenarios 2 and 3. Depending on the amount of monthly consumption, a customer would benefit better
under Scenario 2 or 3.
TABLE 21
Comparison of Rate Scenarios FY 2014 and FY 2015
FY 2014 FY 2015: Rate Impact Analysis (Set 2)
MONTHLY BASIS PAY AS YOU GO
100 YEAR USEFUL LIFE
KIRKWOOD MO AMER. Scenario 1 Scenario 2 Scenario 3
Volume Charge ($/Ccf) $2.505 $2.577 $2.780 $2.630 $2.630
3/4" Meter Charge $10.77 $16.09 $12.39 $11.31 $11.31
Hydrant Fee $2.33 $2.45
Infrastructure Charge ($/Ccf) $0.27 $1.04
Infrastructure Charge ($/month) $11.21
Primacy Fee $0.18 $0.09 $0.18 $0.18 $0.18
Service Line (") $1.00 $1.00 $1.00 $1.00 $1.00
Average User (Ccf):
5.7 $28.56 $32.14 $31.87 $33.41 $38.69
11.4 $42.83 $46.83 $47.71 $54.33 $53.68

RATE/FINANCIAL IMPACT ANALYSIS
DRAFT TM RATE ANALYSIS APRIL 25 19
FIGURE 9
Comparison of Estimated Typical Monthly Bill for 5.7 CCF and 3/4-inch meter (FY 2015 – 2019)
FIGURE 10
Comparison of Estimate Typical Monthly Bill for 20 CCF and 2-inch meter (FY 2015 – 2019)
$0
$10
$20
$30
$40
$50
$60
FY14 FY15 FY16 FY17 FY18 FY19
New Infrastructure Fee ($/month) (Scenario 3)
New Infrastructure Fee ($/Ccf) (Scenario 2)
Current Rate Structure (Scenario 1)
$0
$20
$40
$60
$80
$100
$120
$140
$160
FY14 FY15 FY16 FY17 FY18 FY19
New Infrastructure Fee ($/month) (Scenario 3)
New Infrastructure Fee ($/Ccf) (Scenario 2)
Current Rate Structure (Scenario 1)

RATE/FINANCIAL IMPACT ANALYSIS
20
Attachment A: 677-year Useful Life and Long-Term Financing TABLE A-1
Alternative 1—Revenue Requirements (escalated dollars)
Revenue Requirements
Projected
FY 2015
FY 2016 FY 2017 FY 2018 FY 2019
Operating & Maintenance
Personnel Services $1,398,461 $1,440,415 $1,483,627 $1,528,136 $1,573,980
Contractual Services 1,420,609 1,463,227 1,507,124 1,552,338 1,598,908
Commodities 271,195 279,331 287,711 296,342 305,232
Interdepartmental Charges 449,820 463,315 477,214 491,530 506,276
Transfers to Other Funds 210,000 210,000 210,000 210,000 210,000
Capital Outlay
Debt Service on COPs
Existing 805,377 800,316 798,958 791,243 787,488
Projected AMR 297,015 295,990 294,248 296,685 293,273
Projected Master Plan CIP 0 46,223 93,370 141,461 190,513
Projected Master R&R CIP 0 0 134,439 271,566 411,437
PayGo (current plan CIP) 823,550 65,280 459,857 39,265 40,050
Non-Rate Revenues (323,009) (323,009) (323,009) (323,009) (323,009)
Net Revenue Requirements $5,353,018 $4,741,087 $5,423,538 $5,295,557 $5,594,148
Table A-2 Current Rate Structure with Hydrant Fee
Scn1 Units FY15 FY16 FY17 FY18 FY19
Commodity Charge ($/Ccf) $2.60 $2.60 $2.60 $2.60 $2.60
3.8% 0.0% 0.0% 0.0% 0.0%
Service Charge ($/month) $11.67 $12.50 $13.00 $13.34 $13.76
8.4% 7.1% 4.0% 2.6% 3.1%
Hydrant Fee ($/month) $2.33 $2.33 $2.33 $2.33 $2.33
0.0% 0.0% 0.0% 0.0% 0.0%
Table A-3 Eliminate Hydrant Fee, Add Infrastructure Fee ($/Ccf)
Scn2 Units FY15 FY16 FY17 FY18 FY19
Commodity Charge ($/Ccf) $2.60 $2.60 $2.60 $2.60 $2.60
3.8% 0.0% 0.0% 0.0% 0.0%
Service Charge ($/month) $11.67 $12.50 $13.00 $13.34 $13.76
8.4% 7.1% 4.0% 2.6% 3.1%
Infrastructure Fee ($/Ccf) $0.10 $0.13 $0.17 $0.20 $0.27
33.0% 24.8% 20.5% 35.0%
Table A-4 Eliminate Hydrant Fee, Add Infrastructure Fee ($/month)
Scn3 Units FY15 FY16 FY17 FY18 FY19
Commodity Charge ($/Ccf) $2.60 $2.60 $2.60 $2.60 $2.60
3.8% 0.0% 0.0% 0.0% 0.0%
Service Charge ($/month) $11.67 $12.50 $13.00 $13.34 $13.76
8.4% 7.1% 4.0% 2.6% 3.1%
Infrastructure Fee ($/month) $1.09 $1.46 $1.83 $2.20 $2.60
n/a 33.9% 25.3% 20.2% 18.2%

RATE/FINANCIAL IMPACT ANALYSIS
DRAFT TM RATE ANALYSIS APRIL 25 21
Attachment B: Strategic Plan and PayGo Financing TABLE B-1
Alternative 2— Projected Revenue Requirements (escalated dollars)
Revenue Requirements FY 2015 FY 2016 FY 2017 FY 2018 FY 2019
Operating & Maintenance
Personnel Services $1,398,461 $1,440,415 $1,483,627 $1,528,136 $1,573,980
Contractual Services 1,420,609 1,463,227 1,507,124 1,552,338 1,598,908
Commodities 271,195 279,331 287,711 296,342 305,232
Interdepartmental Charges 449,820 463,315 477,214 491,530 506,276
Transfers to Other Funds 210,000 210,000 210,000 210,000 210,000
Capital Outlay
Debt Service on COPs
Existing 805,377 800,316 798,958 791,243 787,488
Projected AMR 297,015 295,990 294,248 296,685 293,273
PayGo (current plan CIP) 823,550 65,920 468,918 40,431 41,644
PayGo (Master Plan CIP) 576,040 593,321 611,121 629,454 648,338
PayGo (Master R&R CIP) 0 1,236,000 1,273,080 1,311,272 1,350,611
Non-Rate Revenues (323,009) (323,009) (323,009) (323,009) (323,009)
Net Revenue Requirements $5,929,058 $6,524,825 $7,088,991 $6,824,423 $6,992,741
Table B-2 Current Rate Structure with Hydrant Fee
Scn1 Units FY15 FY16 FY17 FY18 FY19
Commodity Charge ($/Ccf) $2.742 $3.002 $3.287 $3.583 $3.905
9.5% 9.5% 9.5% 9.0% 9.0%
Service Charge ($/month) $12.01 $13.39 $14.93 $16.65 $18.56
11.5% 11.5% 11.5% 11.5% 11.5%
Hydrant Fee ($/month) $2.46 $2.59 $2.72 $2.86 $3.00
5.5% 5.5% 5.0% 5.0% 5.0%
Table B-3 Eliminate Hydrant Fee, Add Infrastructure Fee ($/Ccf)
Scn2 Units FY15 FY16 FY17 FY18 FY19
Commodity Charge ($/Ccf) $2.580 $2.683 $2.790 $2.902 $3.018
3.0% 4.0% 4.0% 4.0% 4.0%
Service Charge ($/month) $11.63 $12.56 $13.56 $14.64 $15.81
8.0% 8.0% 8.0% 8.0% 8.0%
Infrastructure Fee ($/Ccf) $0.904 $0.931 $0.959 $0.988 $1.018
3.0% 3.0% 3.0% 3.0%
Table B-4 Eliminate Hydrant Fee, Add Infrastructure Fee ($/month)
Scn3 Units FY15 FY16 FY17 FY18 FY19
Commodity Charge ($/Ccf) $2.580 $2.683 $2.790 $2.902 $3.018
3.0% 4.0% 4.0% 4.0% 4.0%
Service Charge ($/month) $11.63 $12.56 $13.56 $14.64 $15.81
8.0% 8.0% 8.0% 8.0% 8.0%
Infrastructure Fee ($/month) $9.77 $10.06 $10.36 $10.67 $10.99
n/a 3.0% 3.0% 3.0% 3.0%


