

City Water Balance
Basic Ideas and Model BuildingBasic Ideas and Model Building
ObjectivesObjectives
• To understand the basic concepts adopted in CWB
• To install CWB and to carry out a basic simulationTo install CWB and to carry out a basic simulation– Alexandria
• To understand the data structures for CWB
• To know how to set up the spatial data usingTo know how to set up the spatial data using ARCGIS
T d t d l t t t lt ti f t d t• To adapt a model to test alternative futures and to observe the results.
PART 1 – MODEL CONCEPTS

Core Concepts (Spatial Heirarchy)Core Concepts (Spatial Heirarchy)
• Spatial Discretisation– Unit Block
• A basic land unit area
– Minicluster• A land area covered by unit blocks of the same type
– Sub‐catchmentSub catchment• A common drainage area
– Study Area (=City)Study Area ( City)• The whole area to be modelled
Core Concepts (Unit Blocks)Core Concepts (Unit Blocks)
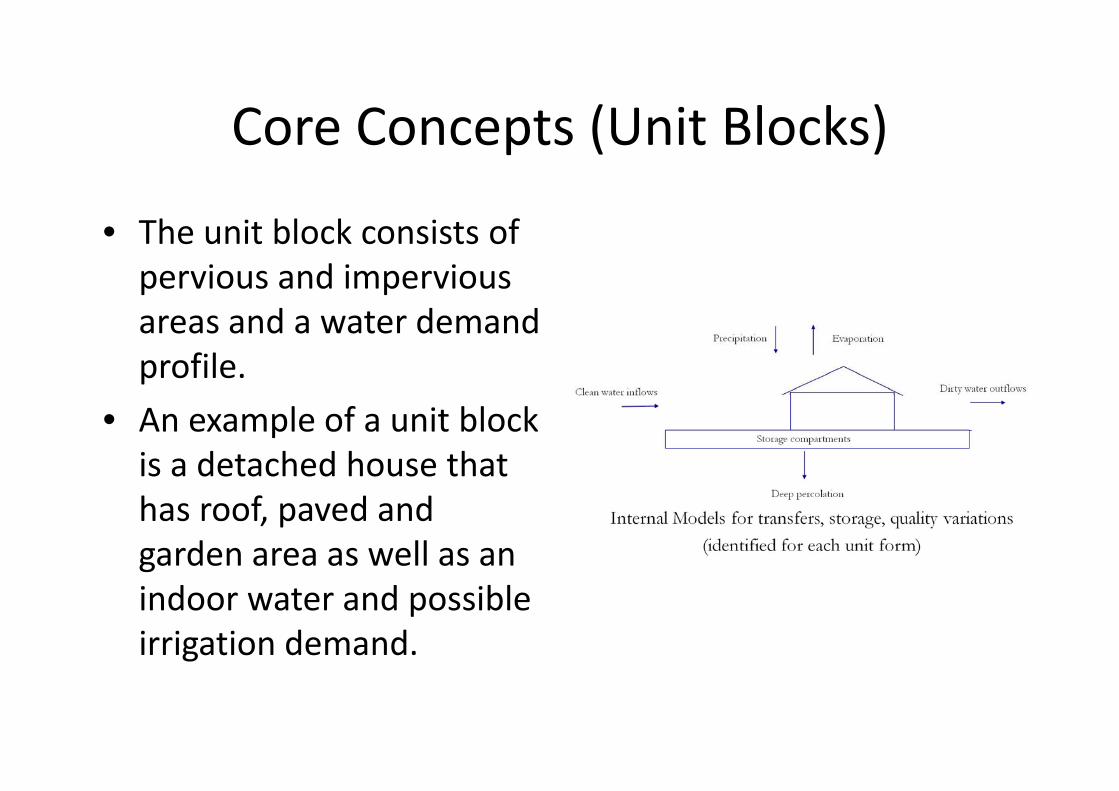
• The unit block consists of pervious and impervious areas and a water demand profile.
• An example of a unit block is a detached house that has roof, paved and garden area as well as an indoor water and possible irrigation demand.

Core concepts (Sub catchments)Core concepts (Sub catchments)
• Sub‐catchments define h d i i fthe drainage in terms of both stormwater and waste waterwaste water
• Rules govern the connections between subconnections between sub‐catchments.– High number catchmentsHigh number catchments cannot flow to low number catchments.

Core Concepts( Default Unit Block Types)Core Concepts( Default Unit Block Types)
Main category Sub‐category Main category Sub‐category
Cit t N R id ti l M iCity centre None Residential Mansion
Fire station None Detached (Large garden)
Hospital None Detached (Small garden)p ( g )
Hotel Hotel Semi‐detached (Large garden)
Hotel with grounds Semi‐detached (Small garden)
Industry Industry Terraced (Large garden)
Industry disused Terraced (Small garden)
lDepot Flats
Garage None Home (Retirement & Nursing)
Office None High‐riseOffice None High rise

Core Concepts (Time)Core Concepts (Time)• A daily timestep is appropriate for• A daily timestep is appropriate for
this type of model. • Although this level of aggregation
results in the loss of diurnal flow 50
60
Daily rainfall for 2008 (Winterbourne Climate Station)
results in the loss of diurnal flow variations, it still provides sufficient information for the comparison of different water management options 40
50
mm)
• Flooding cannot be modelled with this timestep
• Missing historical climate data must b i fill d 20
30
Daily Rainfall (m
Rainfall
be infilled. • Future climate data must be
simulatedI b d f h l
10
20
• It can be used for the long‐term simulations necessary for sustainability assessments.
0
0 100 200 300 400
Day

Core Concepts (Demand)Core Concepts (Demand)
• Four Generic Indoor Water uses
• Use is defined as a daily rate per unit quantity
– Correspond to uses demanding different water
lit
• For domestic dwellings– Unit quantity = person
quality
– Indoor Use 1 – Toilet
U 2 Ki h
• For industrial dwellings– Either person or area– Use 2 – Kitchen
– Use 3 – Bath
d
Either person or area
• Variations within a year can be defined on a– Use 4 ‐ Laundry
• + Irrigation
can be defined on a monthly basis.

Core Concepts (satisfying demand)Core Concepts (satisfying demand)
W l f i S l ibl• Water surpluses from previous days for Water Management Options can be used to satisfy
• Several possible water sources… demand is satisfied in the following orderp y
the following days demands….• Certain water sources can only
b d i
g– Unitblock (UB) Wastewater store– UB Raintank
UB B h lbe used to meet certain demands– E.g. rainwater harvesting OK for
– UB Borehole– Minicluster (MC) Wastewater
storeE.g. rainwater harvesting OK for Irrigation and WC’s but not OK for Potable water.
• Water generated in an area
– MC Stormwater store– Large Wastewater store– Large Stormwater store• Water generated in an area
can only be used in that area….Large Stormwater store
– Large Borehole– Mains supply
Core Concepts (Supply)Core Concepts (Supply)
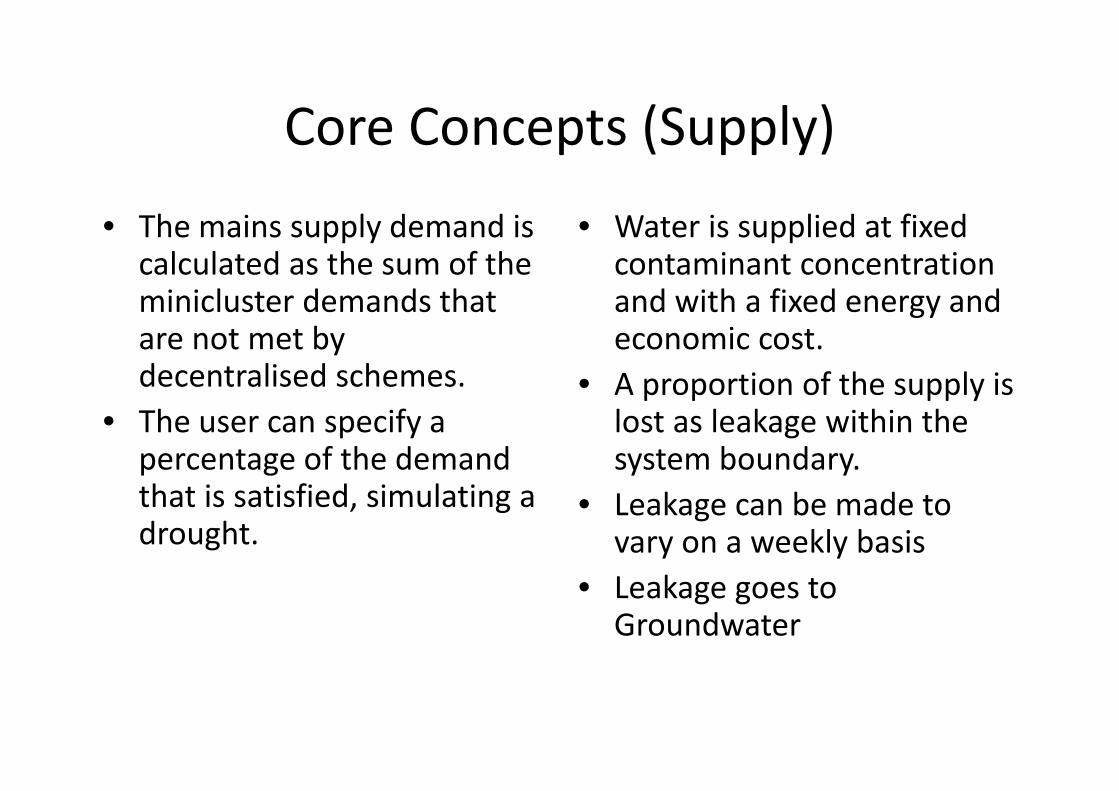
Th i l d d i W i li d fi d• The mains supply demand is calculated as the sum of the minicluster demands that
• Water is supplied at fixed contaminant concentration and with a fixed energy andminicluster demands that
are not met by decentralised schemes.
and with a fixed energy and economic cost.
• A proportion of the supply is • The user can specify a
percentage of the demand h i i fi d i l i
p p pp ylost as leakage within the system boundary.
that is satisfied, simulating a drought.
• Leakage can be made to vary on a weekly basis
k• Leakage goes to Groundwater

RunoffRunoff
Fi t f f th t Th ff ti i d fi d• Five types of surface that can generate runoff in CWB: – roof,
• The effective area is defined as the proportion of the total area generating runoff ,
– pavement, – garden,
road and
g gthat goes directly to the stormwater system.
• Runoff from non effective– road and – Public Open Space (POS).
• In each minicluster, the
• Runoff from non‐effective areas (NEAR) flows onto nearby pervious space or
i bl b d i,
degree to which these surfaces are connected to the piped stormwater
sustainable urban drainage systems (SUDS), if available.
• NEAR is only applicable tothe piped stormwatersystem varies.
NEAR is only applicable to impervious surfaces (road, roof and paved).

Initial LossesInitial Losses
• The three impervious surface types (roof, paved,
• The pervious areas (garden, POS and
road) have an initial loss associated with them,
infiltration urban drainage systems) rainfall is subject
representing depression storage and subsequent
to interception loss (if the area is wooded) and
evaporation. infiltration.

Runoff to SewersRunoff to Sewers
A i A i i h• A proportion (Inflow_prop) of any runoff after the MC
• A cross‐connection is the mistaken connection of a stormwater pipe to therunoff after the MC
soakaway (if present) is diverted to the
stormwater pipe to the foul sewer system.
• Combined sewer systemsdiverted to the wastewater system, representing cross‐
• Combined sewer systems can be modelled by setting the value ofp g
connections and leakage through manhole covers
setting the value of Inflow_prop to one.
• the remainder enters to the stormwater system.
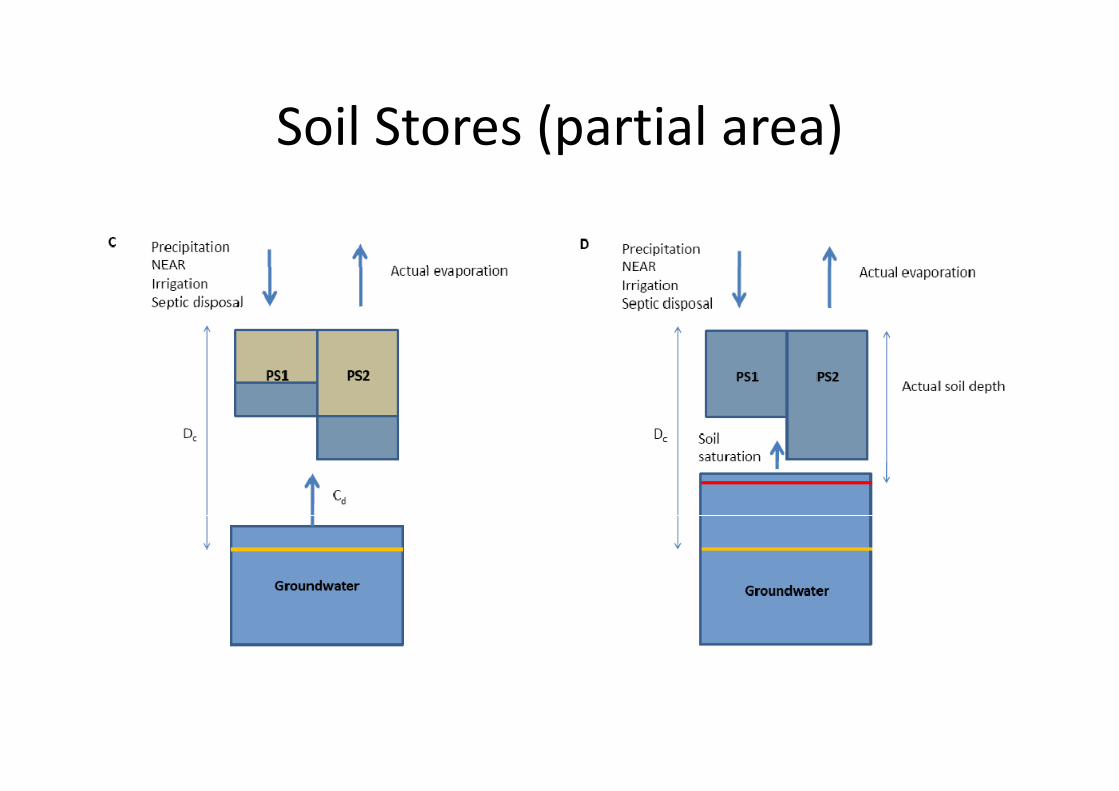
Soil Stores (partial area)Soil Stores (partial area)
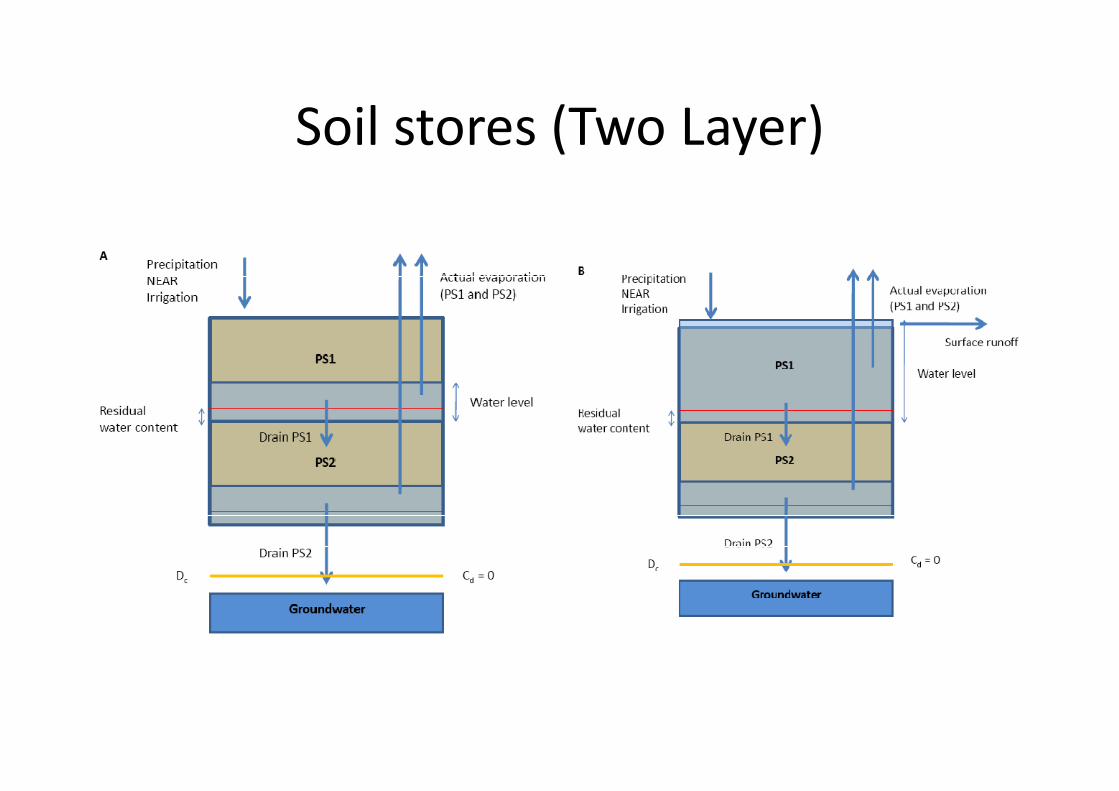
Soil stores (Two Layer)Soil stores (Two Layer)

Water Bodies (including groundwater)Water Bodies (including groundwater)
Study areaStormwaterdischarges
Fixed inputflow rate
Flow out of study area
Ri
LakeSegment 1 Segment 2 Segment 3Fixed inputflow rate
Flow out of study area
River

Water ManagementWater Management
• Scales– Unit Block
• Types– Rain tanks
– Minicluster
– Sub‐Catchment
– Waste water stores
– Stormwater stores
– BMP’s(SUDS)
– Boreholes
– Demand management
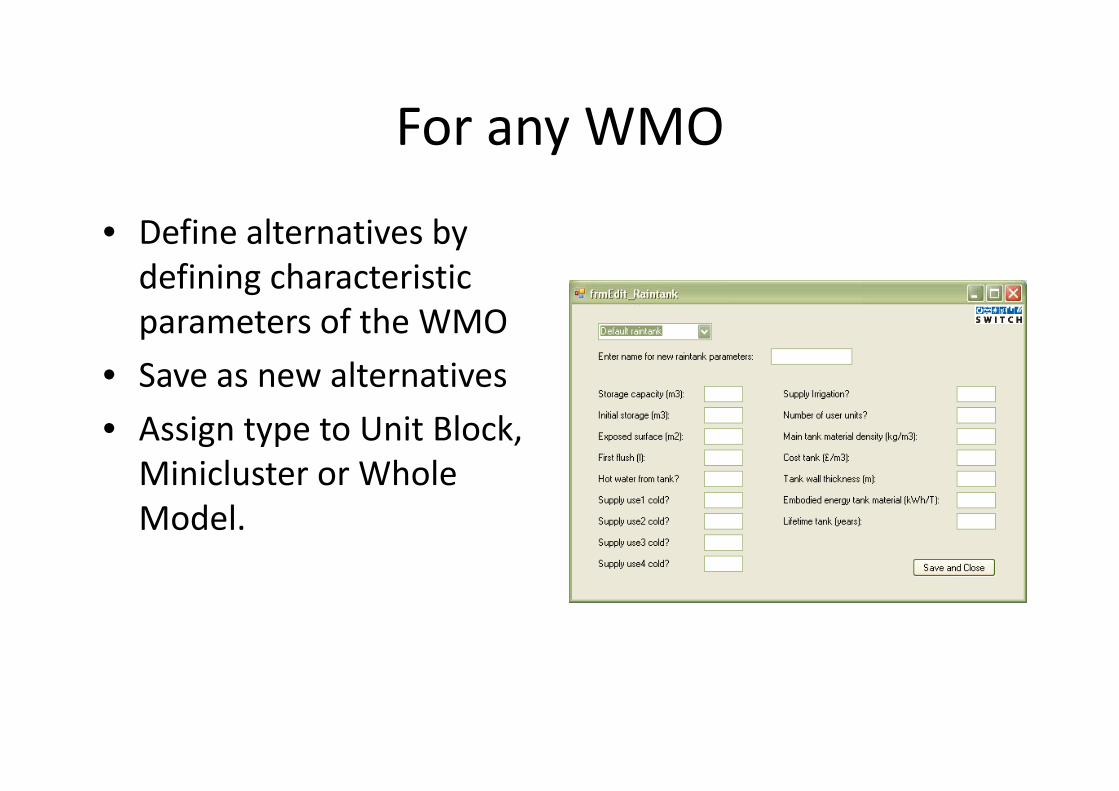
For any WMOFor any WMO
• Define alternatives by defining characteristic parameters of the WMO
• Save as new alternatives
• Assign type to Unit Block, Minicluster or Whole c us e o o eModel.

PART 2 – RUNNING CWB

Installing CWBInstalling CWB
1 C F ld CWB bli h d t PC1. Copy Folder CWB_published to your PC2. Copy the Folder Longbridge_demo to your PC3 Double click the CWB 1 icon (and wait until the model runs)3. Double click the CWB_1 icon (and wait until the model runs)
– At this point the setup has added CWB_1 to your list of applications on the Start MenuT CWB i i ti l t h Mi ft Offi 2007 i t ll d– To run CWB is is essential to have Microsoft Office 2007 installed. Earlier Microsoft versions do not run with the software
4. Note that you can remove CWB using Add/Remove programs in the Control Panel.
5. Note also that CWB makes use of Excel and Powerpoint for input and outputinput and output.
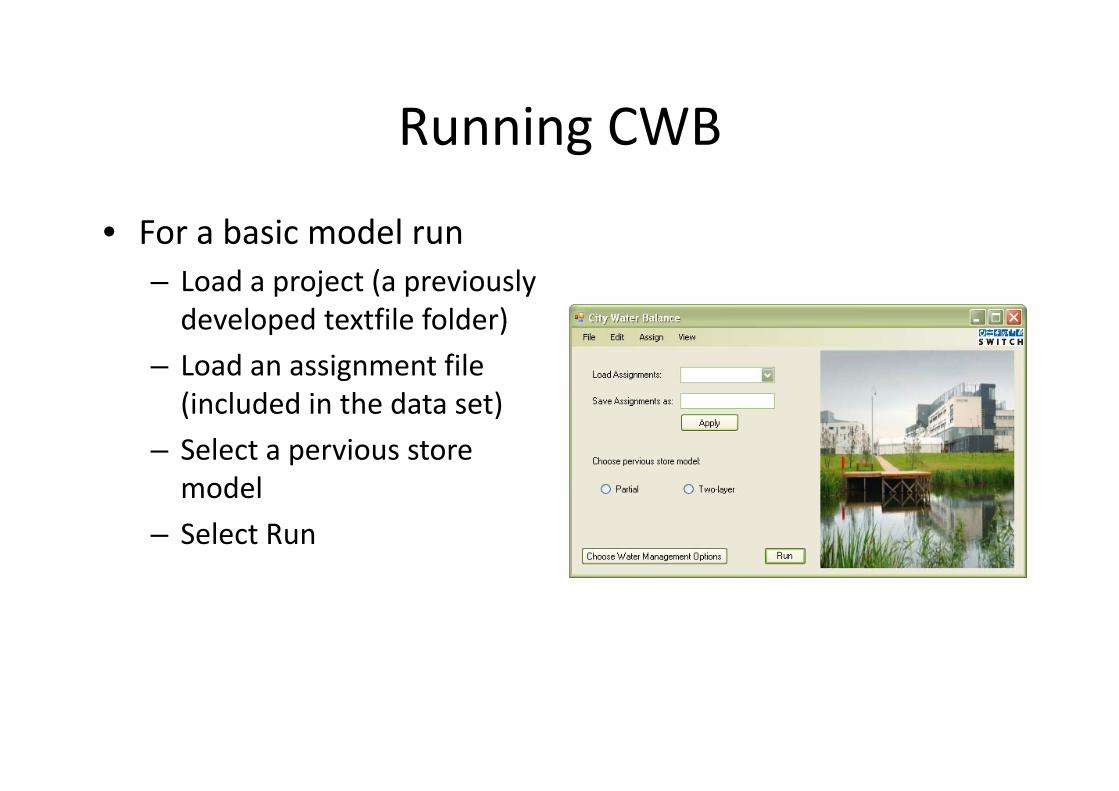
Running CWBRunning CWB
• For a basic model run– Load a project (a previously developed textfile folder)
– Load an assignment file (i l d d i th d t t)(included in the data set)
– Select a pervious store modelmodel
– Select Run

Run SimulationRun Simulation
• Select outputs required
• All – means outputs for the whole simulation period
• Deselect [Display previous results]
• Select <Run Simulation> and wait until simulation completes [three
f l ll bpowerpoint files will be produced ‐ but not saved]
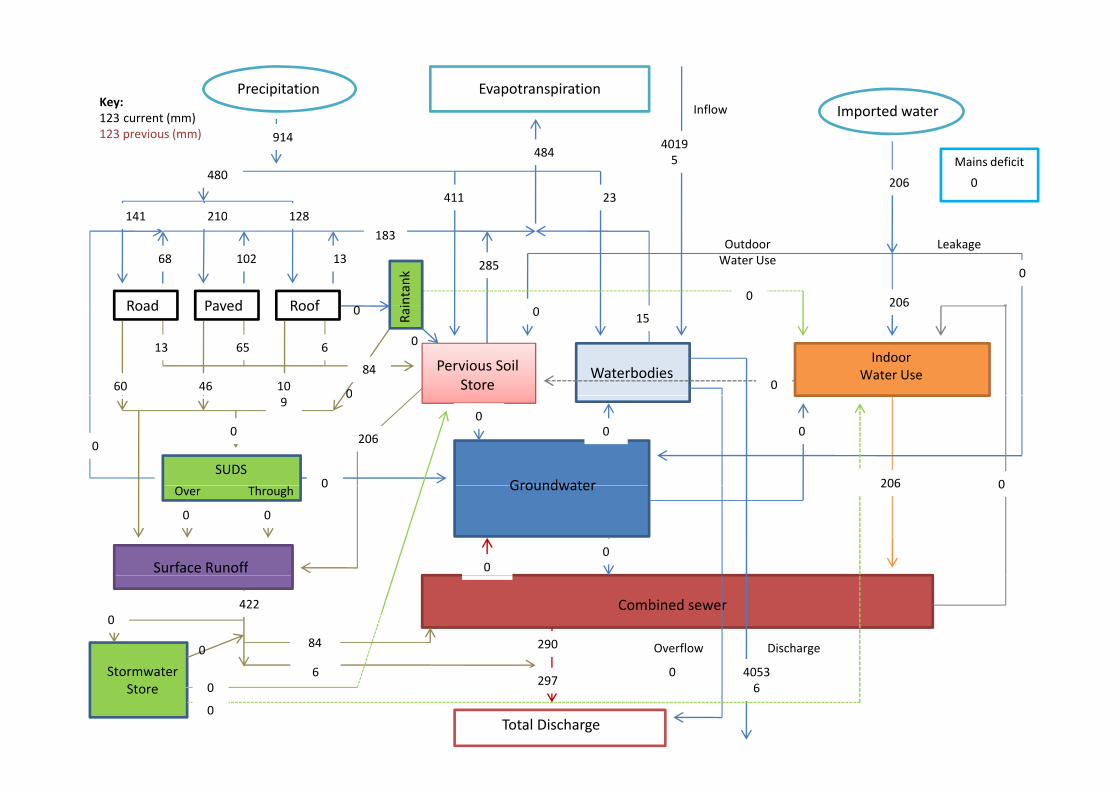
Precipitation EvapotranspirationImported water
Key:123 current (mm)
Inflow
123 previous (mm)
Mains deficit
206 0
484914
480
141 128210411 23
40195
Road Paved Roof
OutdoorWater Use
Leakage
intank
206
0
183
68 102 13 285
141 128210
0
Pervious SoilStore
Road Paved Roof
Waterbodies
Rai
IndoorWater Use
2060 15
60 104684
13 665 0
0
00
GroundwaterSUDS
206
9
206
000
0
0
0
0
0
Surface Runoff
GroundwaterThroughOver206
00
0
00
0
Combined sewer
DischargeOverflow84 290
4220
0
Total Discharge
Stormwater Store
2976 4053
60
0
0

PrecipitationEvapotranspiration Imported water
Key:123 (kg/Ha)
Contaminant species:
Inflow
TSS
123 (mg/l)123 previous
0.5
0.09.1
4.8
1 4 1 3 2 14.1 0.2
3014.6
Road Paved Roof
OutdoorWater Use
Leakage
intank
0.5
0.0
0.0 0.00.0 0.0
1.4 1.3 2.1
0.0
IndoorWater Use
Pervious SoilStore
Road Paved Roof
Waterbodies
Rai 0.5
0.0 0.0
39.2 64.130.754.8
8.7 3.4 42.7 0.00.0
0 00.0
0 00 72.71
GroundwaterSUDS0.0
2345.66.1
0.00.00.0
0.0
0.0
0.0
0 0
0.00
Surface Runoff
GroundwaterOver Through
WW store
0.00.0
0.0
0.00.0
0.0
0
NaN
Combined sewer
Overflow Discharge28.1 2373.7
140.30.0
0.0
Total Discharge
Stormwater Store
2374.30.7 302
5.90.0
0.0
0.0

Mains Supply Precipitation373
0
Water UseDecentralised WM Options
Runoff
0Water heating:
0
0967
0
WW TreatmentAnnual Totals: 537
0
WW Treatment
Key:123 ‐ Energy usage (MWh/yr)123 NPV Cost (Millions £/yr)
0911
0
123 – NPV Cost (Millions £/yr)123 – Previous results

Output ResultsOutput Results
I ddi i h 3• In addition to the 3 summary PPTs
S i il bl– Some views are available from the View>Results menu
• The adjacent slide shows View>Results>Study yArea>Volume
• Other data need to be viewed using Excel – See Notes on output files

Data Concepts 1Data Concepts 1.
• The model functions at 4 scales
• A study area comprises one or more sub catchments
– Unit Block
– Minicluster
S b t h t
• A sub catchment comprises one or more miniclusters
– Sub‐catchments
– Study Area• A minicluster comprises one
or more unit Blocks
• A unit Block has a general form that can be tailored to d b l ddescribe most land uses

Data Concepts 2Data Concepts 2.
• Unit Block– Land area is the sum of
f
– Water use is per occupant or per unit area• Roof
• Paved (e.g Hardstanding)
• Pervious (e.g garden)
per unit area• Occupancy factor
– Outdoor use is dependent on ( g g )
– Water use is split into 4 internal uses [dependent on
pirrigation of the pervious space
P t i i t dwater quality changes] • Toilet [Use 1]
• Kitchen [Use 2]
• Percentage irrigated area
• Trigger to irrigate [soil dryness]
– Wasteflows are defined byKitchen [Use 2]
• Bathroom [Use 3]
• Laundry [Use 4]
Wasteflows are defined by water use and by effective areas for precipitation

Data Concepts 3Data Concepts 3.
• Additional Unit Block Data– to define land use for
Minicluster – Example Schematic
miniclusters• Percent Road
• Percent Public Open SpacePOS (0.25)
• Percent Public Open Space
– Public Open Space• Split into wooded or non
Prop Wood(0.25)
• Split into wooded or non wooded
– Water Use for POSArea for Unit Blocks (<=0.65)
Must always be a whole number
Road (0.1)
• Percent area irrigated
• Trigger to irrigate
yOf unit blocks in a minicluster –Wasted area is treated as POS

Data Concepts 4Data Concepts 4
• Sub Catchments– Miniclusters cannot cross a – Stormwater flows can also subcatchment boundary
– Subcatchments are defined b t t d
go to rivers or other water bodies.
• Stormwater to rivers is takenby wastewater and stormwater catchments
• E g Drainage Study Areas
• Stormwater to rivers is taken from individual miniclusters
– Sub Catchments are • E.g. Drainage Study Areas
– Wastewater and Stormwater flows have to
numbered from 1 to Number of SC’s.
follow the same path between sub‐catchments
• Flows must always be from lower number SC’s to higher number SC’s.


