

BALKAN JOURNAL OF ELECTRICAL & COMPUTER ENGINEERING, Vol. 9, No. 1, January 2021
Copyright © BAJECE ISSN: 2147-284X http://dergipark.gov.tr/bajece
Abstract— Along with the data obtained from the developing
remote sensing technologies, the use of machine learning
techniques is widely employed in classification at a more
effective and precise level. In this study, support vector
machines (SVM) technique, one of the machine learning
approaches, was utilized with the help of data obtained from
satellite image, and it was aimed to classify agricultural
products. Moreover, lentil and wheat products were employed
for object detection, and Landsat-8 satellite was preferred as
satellite imagery. In order to determine the plant indexes in the
image, Landsat-8 image of the development period of
agricultural products dated May 6, 2018 was used and 98
sample points were taken with the help of GPS on the pilot area.
After that, the position of these points were transferred to
Landsat-8 satellite image employing the QGIS program and
NDVI values were calculated from these points, which
corresponds to Landsat-8 NDVI image pixels. The obtained
NDVI values were then utilized in the SVM as inputs. As a
result, the accuracy of the overall system for crop classification
on the pilot area was computed as 83.3%.
Index Terms— Remote Sensing, SVM, Landsat-8, NDVI,
Lentil, Wheat, Crop Classification
I. INTRODUCTION
E SENSE the world surrounding us with our five
senses. We are able to perceive a lot of information
around us remotely without requiring close contact by outer
objects with our sense of sight and hearing. In this point, we
are often using remote sensing. In general, remote sensing
expresses the activities of observing, recording and sensing
objects or events in remote positions [1].
EMRULLAH ACAR, is with Department of Electrical and Electronics
Engineering University of Batman, Batman, Turkey, (e-mail: [email protected]).
https://orcid.org/0000-0002-1897-9830
MÜSLİME ALTUN, is with Department of Electrical and Electronics
Engineering University of Batman, Batman, Turkey, (e-mail: [email protected]).
https://orcid.org/0000-0001-9787-3286
Manuscript received December 12, 2020; accepted January 29, 2021. DOI: 10.17694/bajece.863147
The most up-to-date data about the land ensured by the
remote sensing technology, merged with the Geographic
Information Systems (GIS) technology, ensures a great
convenience to the conventional techniques because it
reaches its target faster, cheaper with limited labor [2].
Remote sensing systems can be categorized into two kinds
as active and passive sensors. Of these, passive sensors enroll
solar radiation emitted or reflected from the surface of earth.
Photo cameras, electro-optic sensors, antenna sensors and
thermal IR sensors can be thought as samples of passive
sensors. Active sensors employ the energy, which sent from
the sensor. They ensure their own energy towards the object
to be investigated. The reflected energy from this object is
then recorded and detected via the sensors. Active sensors
can be employed in order to view the surface at any time
regardless of the season. An instance of active detection is the
radar that transmits an electromagnetic wave signal towards
the object as well as measures and detects the backscattered
signal [1].
Object detection and classification through machine
learning in satellite images has recently become widespread.
Support Vector Machines (SVM), one of the machine
learning methods, have been among the highest performing
approaches in the studies for object detection. SVM is a
concept associated with a series of supervised learning
methods in statistics and computer science. It is used for
pattern recognition, data analysis, classification and
regression analysis [3-4]. In this study, SVM model was
preferred for crop classification since its capability and
performance.
Many studies have been conducted in the literature using
remote sensing data and machine learning approaches for
object classification and detection [5-8].
In this study, two different agricultural products (lentil
and wheat) were classified using Landsat-8 data, one of the
optical remote sensors, and the SVM technique, one of the
machine learning approaches. Landsat-8 satellite image used
in the study was obtained in May 2018, which corresponds to
the development period of the products. Parcels belonging to
the village of Bıçakçı in Batman province, Turkey were
selected as the study area. GPS coordinate points of 98
sample points over these parcels were then transferred to the
pre-processed image. Finally, thanks to calculating the NDVI
values, which corresponds to these points and employing
them as inputs of SVM technique, the agricultural products
(wheat or lentil) were classified with a high performance.
Classification of the Agricultural Crops Using
Landsat-8 NDVI Parameters by Support Vector
Machine
E.ACAR, M.ALTUN
W
78

BALKAN JOURNAL OF ELECTRICAL & COMPUTER ENGINEERING, Vol. 9, No. 1, January 2021
Copyright © BAJECE ISSN: 2147-284X http://dergipark.gov.tr/bajece
II. MATERIAL
In this section, the determination of the study area; the
application of preprocessing to the Landsat-8 satellite image;
the importing of the GPS coordinate points to the Landsat-8
image; the calculation of the corresponding NDVI values and
finally the classification with machine learning technique are
mentioned.
A. Pilot Area and Data Collection
As the study area, the agricultural land where lentil and
wheat agricultural products were cultivated, covering an area
of 2x2 km2 within the borders of Bıçakçı Village of Batman
Center, which is under the control of Batman Agriculture
Directorate, was selected. GPS data of 96 different sample
points (40 lentil and 56 wheat points) determined within the
boundaries of the selected agricultural pilot area were
employed in this study. In Figure 1, the Google Earth view of
this study area and the distribution of GPS data of 96 sample
points in the pilot agricultural area are shown.
(a) (b)
Fig.1. (a) Google Earth view of this study area (b) the distribution of GPS data of 96 sample points in the pilot agricultural area
In addition to the ground measurements, Landsat-8 data was
utilized in order to generate NDVI parameters of the sample
points.
B. Landsat-8 Image Preprocessing
The satellite image of the Landsat-8 OLI satellite used
within the scope of this study was obtained from the website
of the American Geological Service (USGS) with geometric
and radiometric correction [9]. This image is in the Universal
Transverse Mercator (UTM) coordinate system slice 35 and
WGS84 datum. In the ENVI 5.0 software (Exelis Visual
Information Solutions, Boulder, Colorado), band composition,
band proportioning and image enhancement methods were
applied to the data. Gaussian Distribution Method was used in
the image enhancement process. In this method, the pixel
values were spread over the 0-255 color range via histogram
and the contrast values were increased. Band rationing is an
image enhancement analysis method in which new pixel
values are obtained by dividing the gray color value of a pixel
in one band by the value of the same pixel in another band or
by applying other mathematical operations [5, 10]. In addition,
by using this image enhancement method, the spectral
differences between the bands are enriched and the effect of
the terrain roughness on the images is reduced.
C. Feature Extraction
In the feature extraction stage, one of the most important
vegetation indexes, Normalized Difference Vegetation Index
(NDVI), was computed from Landsat-8 image in order to
form feature vectors for each sample point.
With the help of vegetation indices such as NDVI, it is
possible to observe the plant diversity and vegetation density
on the earth with remote sensing systems. In NDVI method,
visible and near infrared regions of the electromagnetic
spectrum were used [10-11].
In this study, the NDVI image was obtained by applying
arithmetic operations (Equation-1) to the near infrared and
red bands obtained from the Landsat-8 image, and the NDVI
values of the 96 sample points on this image were then
calculated.
NDVI = (𝑁𝐼𝑅−𝑅𝐸𝐷
𝑁𝐼𝑅+𝑅𝐸𝐷) (1)
Here, NIR and RED express the reflection values of the
near infrared and red (visible) bands, respectively.
III. METHOD
In our study, a machine learning approach (SVM) was
preferred to classify agricultural crops (lentil and wheat)
utilizing the NDVI data, which obtained from the Landsat-8
image. The detailed information about SVM classifier is
given as below.
A. Support Vector Machine (SVM)
Support Vector Machines (SVM) is a concept associated
with a range of supervised learning methods in statistics and
computer science. It is used for pattern recognition and data
analysis as well as classification and regression analysis. The
mathematical models of SVM have emerged in two classes
for the classification of linear data at the first stage. In later
times, new studies were conducted on the classification of
nonlinear multi-class data. SVM, which tries to predict the
most suitable transfer function to distinguish two different
classes from each other and creates a hyper plane to separate
them optimally [3, 12-13] as shown in Figure 2.
Fig. 2. The architecture of the linear SVM classifier
The aim of SVM is to ensure equal distance to both sample
groups with the hyperplane. For the linear separability case,
the differential hyperplane is defined in Equation-2.
79

BALKAN JOURNAL OF ELECTRICAL & COMPUTER ENGINEERING, Vol. 9, No. 1, January 2021
Copyright © BAJECE ISSN: 2147-284X http://dergipark.gov.tr/bajece
𝑔(∅) = 𝑤𝑇𝑥 + 𝑏 = ∑ 𝑤𝑖
𝑛
𝑖=1
𝑥𝑖 + 𝑏 (2)
Here x, b and w denote input feature vector, bias and weight
vectors, respectively.
IV. RESULTS AND DISCUSSION
In this section, the pre-processed Landsat-8 image and the
NDVI image obtained from Landsat-8 image bands were
presented. In addition, the data obtained from the NDVI image
were passed through the training-test phase in the SVM
technique and the performance values of the classification
result were tabulated.
A. Obtaining NDVI Image
In this part, images of red (visible) and near infrared bands
(band 4, band 5) to employ for obtaining NDVI image from
the Landsat-8 image, which derived in 06.05.2018 are shown
in Figure 3. These images were calculated in accordance with
the NDVI formula specified in Equation 1, thanks to the raster
calculator in the QGIS program. As a result of these
operations, the NDVI image in Figure 4 was obtained. The
obtained NDVI image was then converted into a "single band
pseudo color layer" and shown in Figure 5. In addition, the
import of GPS data to the image was carried out as shown in
Figure 6.
(a) Band 4 (b) Band 5
Fig. 3. Obtaıned Landsat-8 band images, which are (a) Band 4 (visible) and (b) Band 5 (near infrared)
Fig. 4. NDVI image of the pilot area, which obtained in 06.05.2018
Fig. 5. Single band pseudo color layer (SBPCL) of the obtained NDVI
image
Fig. 6. The import of GPS data to the obtained SBPCL image
B. The Results of Crop Classification by Employing NDVI
Parameters and SVM
At this stage, leave-one-out cross validation method was
applied to the data obtained to calculate the performance
value of the whole system and the results obtained were
presented in Table-1 using performance metrics (Sensitivity,
Specificity, Precision, Recall, F1 Score and Accuracy).
Moreover, the confusion matrix of the recommended system
was given in Figure 7.
Fig. 7. The confusion matrix of the proposed system
80
BALKAN JOURNAL OF ELECTRICAL & COMPUTER ENGINEERING, Vol. 9, No. 1, January 2021
Copyright © BAJECE ISSN: 2147-284X http://dergipark.gov.tr/bajece
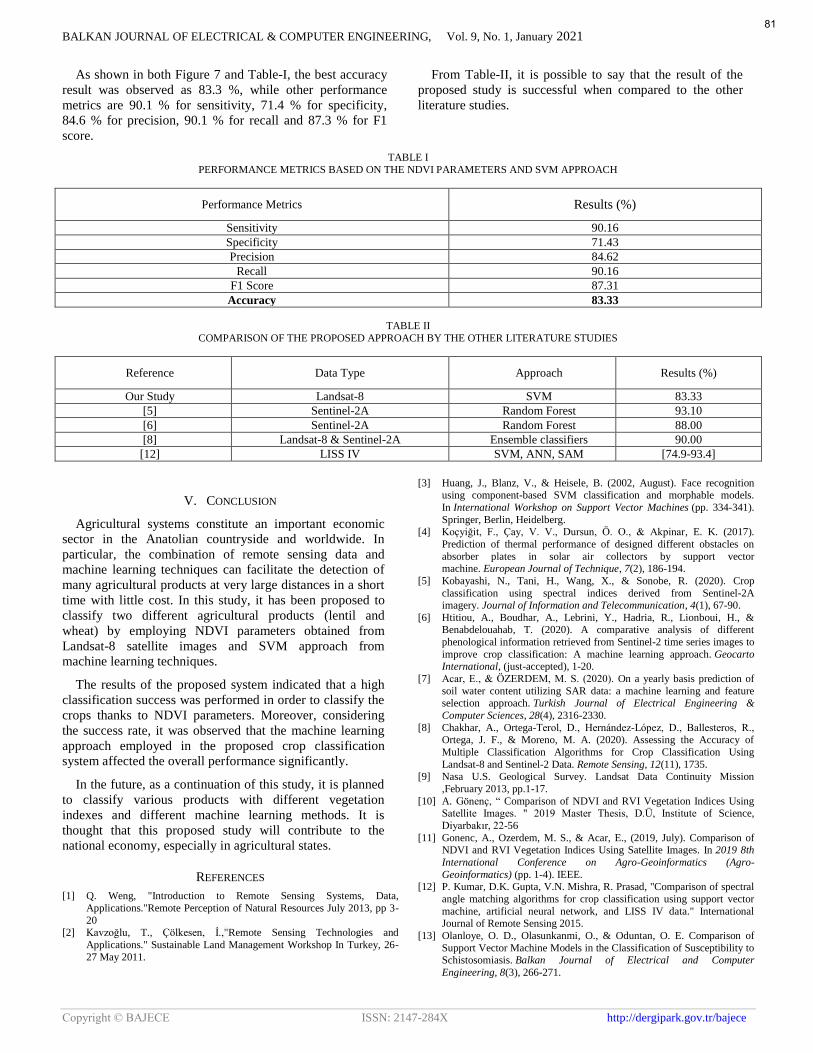
As shown in both Figure 7 and Table-I, the best accuracy
result was observed as 83.3 %, while other performance
metrics are 90.1 % for sensitivity, 71.4 % for specificity,
84.6 % for precision, 90.1 % for recall and 87.3 % for F1
score.
From Table-II, it is possible to say that the result of the
proposed study is successful when compared to the other
literature studies.
TABLE I
PERFORMANCE METRICS BASED ON THE NDVI PARAMETERS AND SVM APPROACH
Performance Metrics Results (%)
Sensitivity 90.16
Specificity 71.43
Precision 84.62
Recall 90.16
F1 Score 87.31
Accuracy 83.33
TABLE II
COMPARISON OF THE PROPOSED APPROACH BY THE OTHER LITERATURE STUDIES
Reference Data Type Approach Results (%)
Our Study Landsat-8 SVM 83.33
[5] Sentinel-2A Random Forest 93.10
[6] Sentinel-2A Random Forest 88.00
[8] Landsat-8 & Sentinel-2A Ensemble classifiers 90.00
[12] LISS IV SVM, ANN, SAM [74.9-93.4]
V. CONCLUSION
Agricultural systems constitute an important economic
sector in the Anatolian countryside and worldwide. In
particular, the combination of remote sensing data and
machine learning techniques can facilitate the detection of
many agricultural products at very large distances in a short
time with little cost. In this study, it has been proposed to
classify two different agricultural products (lentil and
wheat) by employing NDVI parameters obtained from
Landsat-8 satellite images and SVM approach from
machine learning techniques.
The results of the proposed system indicated that a high
classification success was performed in order to classify the
crops thanks to NDVI parameters. Moreover, considering
the success rate, it was observed that the machine learning
approach employed in the proposed crop classification
system affected the overall performance significantly.
In the future, as a continuation of this study, it is planned
to classify various products with different vegetation
indexes and different machine learning methods. It is
thought that this proposed study will contribute to the
national economy, especially in agricultural states.
REFERENCES
[1] Q. Weng, "Introduction to Remote Sensing Systems, Data,
Applications."Remote Perception of Natural Resources July 2013, pp 3-
20 [2] Kavzoğlu, T., Çölkesen, İ.,"Remote Sensing Technologies and
Applications." Sustainable Land Management Workshop In Turkey, 26-
27 May 2011.
[3] Huang, J., Blanz, V., & Heisele, B. (2002, August). Face recognition using component-based SVM classification and morphable models.
In International Workshop on Support Vector Machines (pp. 334-341).
Springer, Berlin, Heidelberg. [4] Koçyiğit, F., Çay, V. V., Dursun, Ö. O., & Akpinar, E. K. (2017).
Prediction of thermal performance of designed different obstacles on
absorber plates in solar air collectors by support vector machine. European Journal of Technique, 7(2), 186-194.
[5] Kobayashi, N., Tani, H., Wang, X., & Sonobe, R. (2020). Crop
classification using spectral indices derived from Sentinel-2A imagery. Journal of Information and Telecommunication, 4(1), 67-90.
[6] Htitiou, A., Boudhar, A., Lebrini, Y., Hadria, R., Lionboui, H., & Benabdelouahab, T. (2020). A comparative analysis of different
phenological information retrieved from Sentinel-2 time series images to
improve crop classification: A machine learning approach. Geocarto International, (just-accepted), 1-20.
[7] Acar, E., & ÖZERDEM, M. S. (2020). On a yearly basis prediction of
soil water content utilizing SAR data: a machine learning and feature selection approach. Turkish Journal of Electrical Engineering &
Computer Sciences, 28(4), 2316-2330.
[8] Chakhar, A., Ortega-Terol, D., Hernández-López, D., Ballesteros, R., Ortega, J. F., & Moreno, M. A. (2020). Assessing the Accuracy of
Multiple Classification Algorithms for Crop Classification Using
Landsat-8 and Sentinel-2 Data. Remote Sensing, 12(11), 1735.
[9] Nasa U.S. Geological Survey. Landsat Data Continuity Mission
,February 2013, pp.1-17.
[10] A. Gönenç, “ Comparison of NDVI and RVI Vegetation Indices Using Satellite Images. " 2019 Master Thesis, D.Ü, Institute of Science,
Diyarbakır, 22-56
[11] Gonenc, A., Ozerdem, M. S., & Acar, E., (2019, July). Comparison of NDVI and RVI Vegetation Indices Using Satellite Images. In 2019 8th
International Conference on Agro-Geoinformatics (Agro-
Geoinformatics) (pp. 1-4). IEEE. [12] P. Kumar, D.K. Gupta, V.N. Mishra, R. Prasad, "Comparison of spectral
angle matching algorithms for crop classification using support vector
machine, artificial neural network, and LISS IV data." International Journal of Remote Sensing 2015.
[13] Olanloye, O. D., Olasunkanmi, O., & Oduntan, O. E. Comparison of
Support Vector Machine Models in the Classification of Susceptibility to Schistosomiasis. Balkan Journal of Electrical and Computer
Engineering, 8(3), 266-271.
81
BALKAN JOURNAL OF ELECTRICAL & COMPUTER ENGINEERING, Vol. 7, No. 1, January 2021
Copyright © BAJECE ISSN: 2147-284X http://dergipark.gov.tr/bajece
BIOGRAPHIES
EMRULLAH ACAR received the B.S.
degree in electrical and electronics
engineering from Çukurova University,
Adana, Turkey in 2009. From 2008 to
2009, he was an exchange student in the
electrical engineering from Linkoping
University, Sweden. He received the
M.S in electrical and electronics
engineering from Istanbul Technical
University, Istanbul and Dicle University, Diyarbakir, Turkey
in 2012. After that, he received the PhD degree in electrical-
electronics engineering from Gaziantep University, Gaziantep
and Dicle University, Diyarbakir, Turkey in 2017.
He is an assistant professor at the Batman University of
electrical-electronics engineering and is the head of electronics
division. His research interest includes the digital image
processing, machine learning and remote sensing applications.
Mr. Emrullah’s awards and honors include the TUBITAK
(The Scientific and Technological Research Council of
Turkey) Grant, Erasmus Mobility Grant (Sweden) and
Erasmus Internship Grant (Germany).
MÜSLİME ALTUN received the B.S.
degree in electrical and electronics
engineering from Gaziantep University,
Gaziantep, Turkey in 2018. She
received the M.S in electrical and
electronics engineering from Batman
University Batman, Turkey in 2021.
Her research interest includes machine
learning and remote sensing applications.
82


