
Client Logo
Maldives6 Dec 2007
Workshop on ICT Indicators & Benchmarking
Comparative IndicatorsWhat is available? What are the problems?

2
Table Of Contents
What’s available and what to use
What are some of the problems in comparative benchmarking?
Indicators are important not just to the regulator
What indicators should you focus on?

3
There is a “lot” of data available from various official sources
Example: ITU data
– collected from member countries annually
– Available to anyone who purchases the database
– Some data available free via ITU’s ICTeye website.

4
A small subset is reported on the TAM web-site. No historical data (growth) or comparative data (benchmarks) against other countries
Fixed Telephone lines
– Separate by region (large islands vs. other inhabited islands vs. resorts vs. un-inhabited islands etc)
Total number of mobile subscribers
– Post-paid vs. Pre-paid
Teledensity
– Fixed Only, Overall Fixed + mobile)
Internet subscription customers
– ISDN lines, ADSL lines6, Leased lines
Public (card) phones: by region
Other: Paging customers, Telex Numbers
From www.tam.gov.mv ; Nov 29 2007 data as reported on website

5
Value of indicator data is to compare and benchmark: but need to use the RIGHT INDICATORS against COMPARABLE COUNTRIES
The Maldives needs to
– Pick the right indicators
– Track and benchmark yourselves against these
– Set targets (to beat the benchmark, perhaps)
– Report these benchmarks regularly (e.g. Pakistan PTA)
– Regulate based on the key indicators
What are the SUITABLE INDICATORS ?
– E.g. Does “market concentration” or HHI (which are measures of market power) make sense in micro-states like Bhutan?
– “Only” 2 mobile operators.
– But with around ½ Million people can the market support more than 2 mobile operators?
What are COMPARABLE COUNTRIES ?
– Who are comparable countries? What criteria do you use to select them?
– E.g. Indonesia? YES large number of dispersed islands). NO (much larger population)
6
Table of Contents
What’s available and what to use
What are some of the problems in comparative benchmarking?
Indicators are important not just to the regulator
What indicators should you focus on?

7
Definitions that leave room for interpretation – and errors
What is does Number of Mobile Subscribers mean?
– Most operators reporting SIM cards. Not # of human subscribers/users
– Many users own more than one SIM cards
– Some operators simply reporting all SIMs issued (irrespective of whether they are “active” or not).
– Stop referring to subscribers and talk about “# of mobile SIMs”.
– Should have a cut-off (i.e. SIM cards that have used a fee-paying service in the past 3 months)?
What is does Number of Fixed Lines/Phones mean?
– Is Fixed Wireless (e.g. CDMA) included?
– ITU includes CDMA on the fixed side
– India included CDMA under fixed till about 3 years ago, but now counts it under mobile (so historical graphs have a sudden “bump”)
8
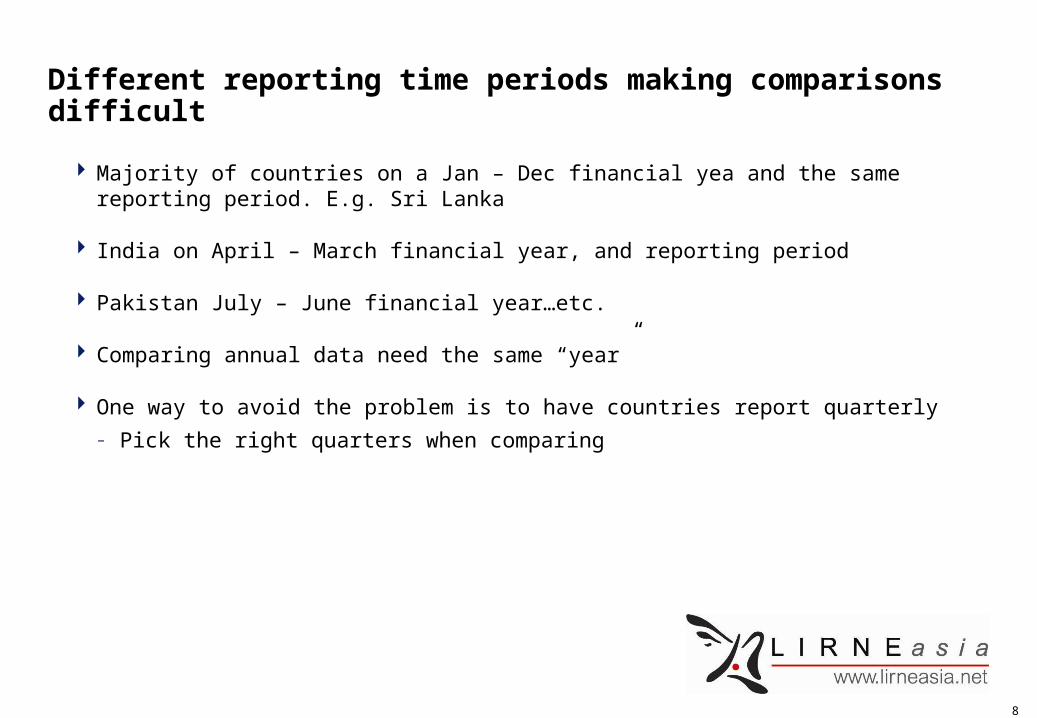
Different reporting time periods making comparisons difficult
Majority of countries on a Jan – Dec financial yea and the same reporting period. E.g. Sri Lanka
India on April – March financial year, and reporting period
Pakistan July – June financial year…etc.
Comparing annual data need the same “year”
One way to avoid the problem is to have countries report quarterly
– Pick the right quarters when comparing

9
Lack of definitive authority for a particular indicator different data for the same indicator being reported by multiple sources
# of internet subscribers (millions) Difference between…
Year NASSCOM data TRAI DataMinistry of
Statistics & PI
NASSCOM & TRAI
numbers
TRAI & Ministry numbers
1999 0.35 0.23 - -
2000 0.65 0.95 0.943 -46% 1%
2001 1.13 3.04 2.909 -169% 4%
2002 1.763 3.42 3.239 -94% 5%
2003 3.661 3.64 3.5 1% 4%
2004 4.403 4.55 4.05 -3% 11%
2005 6.674 5.55 5.3 17% 5%
2006 6.94 5.556 - 20%
Note: Based on Financial Year – e.g. “2000” refers to April 1999 – Mar 2000
Source: NASSCOM Strategic Review 2005; TRAI; Ministry of Statistics and Program Implementation, Govt. of India

10
That problems exist is recognized. Significant international attention being given to this.
UN Partnership on measuring ICTs for Development
ITU regular updates
11
Table of Contents
What’s available and what to use
What are some of the problems in comparative benchmarking?
Indicators are important - not just for the regulator
What indicators should you focus on?
12
Market share matters to investors (therefore operators). But market share based on what?
Often the subscriber with the most subscribers (i.e. market share based on # of subscribers) is used
Why not Market Share based on Revenue or Minutes (traffic)?
In early 2007 , market analysts’ claim that “largest” mobile operator is “losing market share” to competition. Viewed negatively
But according to CEO, – “observed trends of consumer behavior show that if SIM is given free (or with pre-loaded
value), customer uses the value, discards SIM, gets a new one….”– [His company] “never does this” (i.e. always charges for the SIM). But competitors DO.– The “competitors count all SIMs when reporting subscriber base” (including discarded
ones) so there’s significant over counting– CEO “waiting” for regulator to “publish market share/growth by MINUTES, to prove that it is
the largest and growing
Method of calculating Market share even more important when Significant Market Power regulation is involved

13
Table Of Contents
What’s available and what to use
What are some of the problems in comparative benchmarking?
Indicators are important not just to the regulator
What indicators should you focus on?
– Connectivity
– Industry structure, impact
– Price/affordability
– Revenue, profitability
– Quality of Service
– ICTs
– General
14
Connectivity Indicators
Connectivity is perhaps the most important indicator of the sector
Equitable access, affordability and even quality are all reflected in growth (or lack of) the connectivity indicators

15
A basic list could include:
FIXED
Number of fixed lines
Number of fixed wireline phones
Number of fixed wireless phones
Total fixed line subscribers per 100 inhabitants
MOBILE
Number of mobile SIM cards
Number of mobile SIM cards – prepaid
Number of mobile SIM cards – postpaid
Total mobile subscribers per 100 inhabitants
Total mobile subscribers per 100 inhabitants
Number of telephone connections per 100 inhabitants
DIGITAL DIVIDE
Number of urban telephone connections per 100 inhabitants
ICT
Number of rural telephone connections per 100 inhabitants
Total number of Internet connections
Number of broadband Internet connections
IN-COUNTRY ACCESS GROWTH
Backbone map for a country
Mobile coverage map per operator
Base station map per operator
16
Problems
Subscriber/user vs. SIMs
– Admit we are reporting SIMs.
– Only a survey can reveal Subscribers (or average # of SIMSs per user)
Include CDMA in Fixed numbers?
Installed capacity or actual lines?
– Philippines reports both: result of USO policy where new entrants were required to install lines with 10:1 urban to rural ratio
– Thailand: measures/reports installed, has large number of unused lines under condominiums while having long waiting lists in rural areas
How is an “active” mobile user (SIM) defined?
– Indonesia: Indonesia uses a 1 year cut-off period
– Sri Lanka: Mobitel uses 3 months. Dialog varies by value of top-up-card.
– Philippines: previously 4 months. In June 2004 changed to 1 month. Suddenly growth rate graphs “slow” down due to definition/methodology change

17
Change in “Active SIM” definition in the Philippines shows them in a negative light in comparative graphs
Mobile Subscribers (Pre+Post paid)
0.00
10.00
20.00
30.00
40.00
50.00
60.00
2000 2001 2002 2003 2004 2005
mill
ion
Pakistan India Thailand Philippine Indonesia Sri Lanka
18
Industry Structure and Industry Impact Indicators
Structure:
– monitoring for significant market power is important for regulators
Impact:
– telecom sectors often biggest contributor to GDP growth and biggest revenue generator to the government.
– Knowing this makes the sector more visible, less likely to be faced with negative policies (e.g. taxes that may slow growth).
– Important to Operators as well as regulators

19
A basic list could include:
Total annual investment in the telecom sector
Foreign Direct Investment into the sector
Total tax paid by the sector
Total employment in the telecom sector
Market share
– Using the HHI (Herfindhal-Hershman Index)
Market shares
– In 3 ways: based on subscribers, based on minutes, based on revenue

20
Investment should only include funds that improve network coverage and quality. Taxes should be disaggregated
Total Investment
– Only count investment made for acquiring property and network
– Only for services available to the public (not for private use)
– Sum of Foreign Direct Investment (FDI) + locally originated investment
Foreign Direct investment
– should relate to investments in physical infrastructure, such as investments in property, equipment and networks.
– Does not refer to (and should not include) monies injected from a foreign firm that acquires a lasting management interest in a firm or enterprise (because such funds do not go toward improving network coverage or costs or telecommunication services through other means).
Total tax paid by the sector
– Differentiate between that paid by company vs. taxes passed onto consumer
– Separate into: Corporate Income Tax, Sales Tax & levies, License Fees & Spectrum Tax
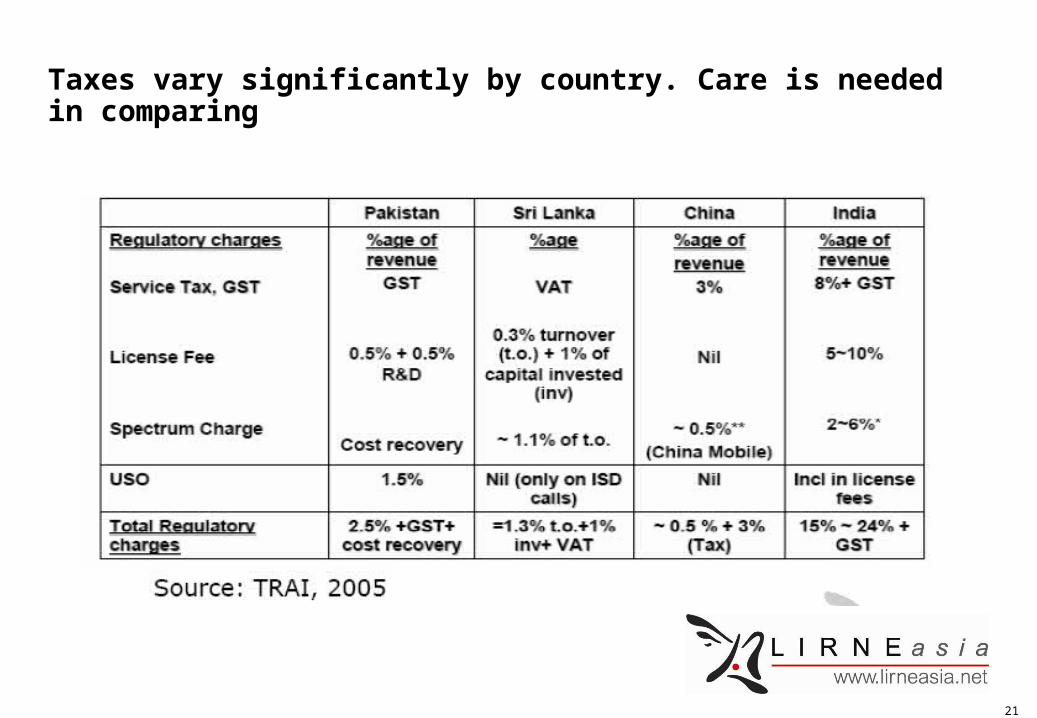
21
Taxes vary significantly by country. Care is needed in comparing
22
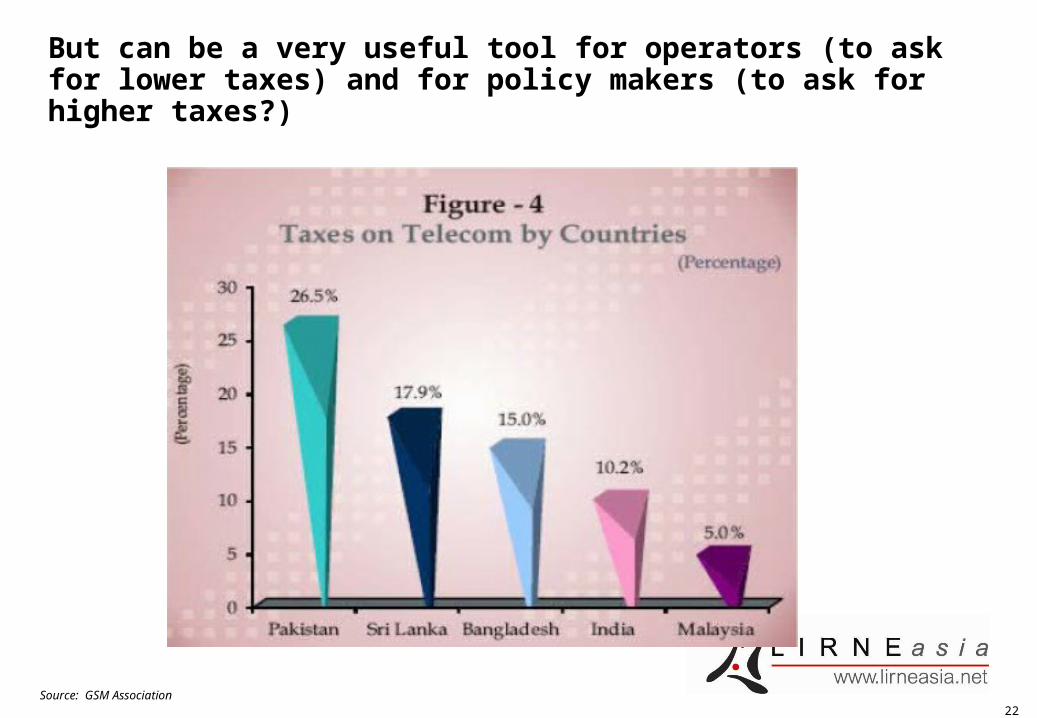
But can be a very useful tool for operators (to ask for lower taxes) and for policy makers (to ask for higher taxes?)
Source: GSM Association
23
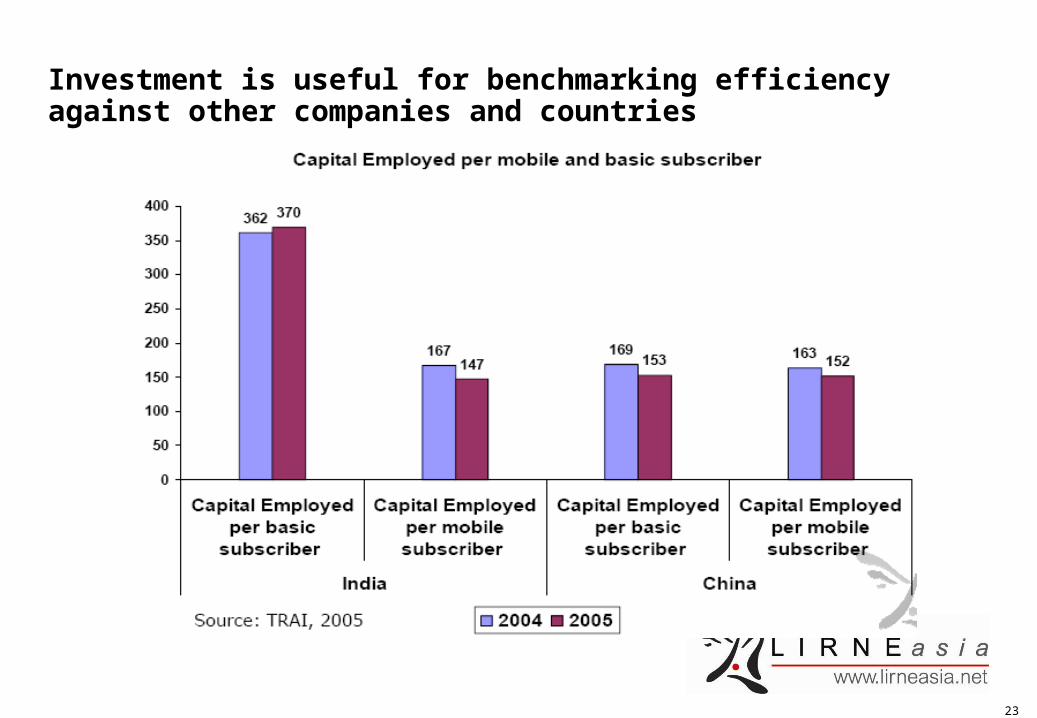
Investment is useful for benchmarking efficiency against other companies and countries
24
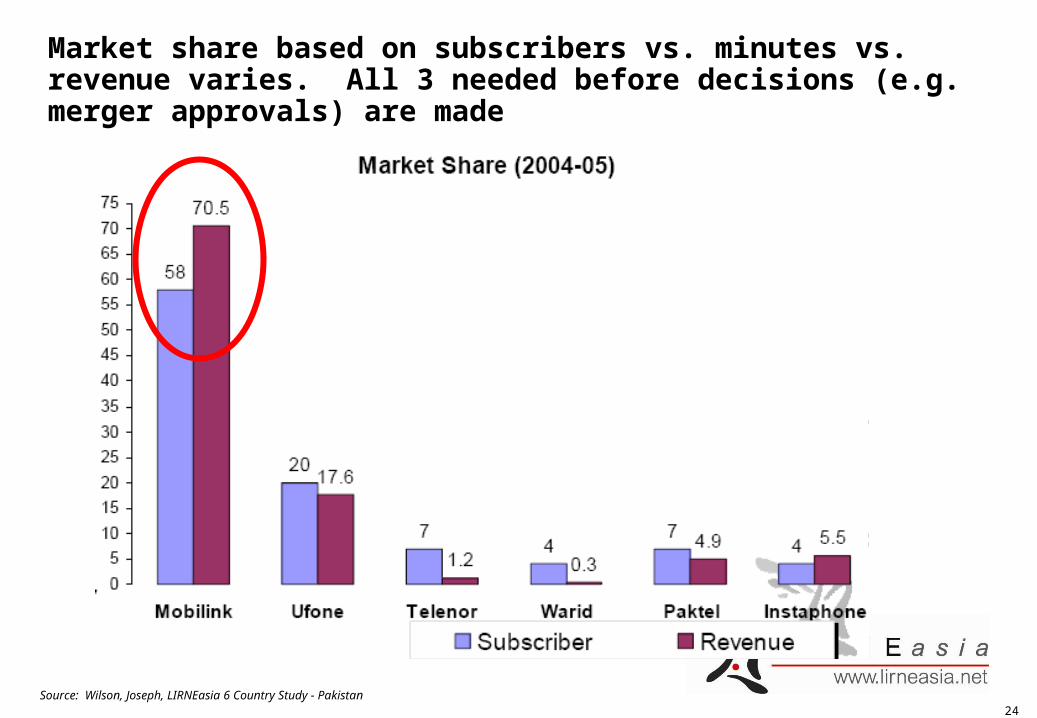
Market share based on subscribers vs. minutes vs. revenue varies. All 3 needed before decisions (e.g. merger approvals) are made
Source: Wilson, Joseph, LIRNEasia 6 Country Study - Pakistan

25
Price and Affordability Indicators
26
Price Baskets are a good way to compare prices
ITU reports many micro-measures – E.g. “price of a 3 minute on-net call”
But in selecting an operator, consumers are likely to think about ALL costs– Connection charge– Monthly charge– What you get “free” (i.e. X SMSs per month and Y minutes per month included in package)– Cost of additional SMS or Cost of Minute– Their own consumption patterns (e.g. total minutes of calling per month, more friends on the
same network therefore…)
The OECD basket captures all the above and MORE
Proposed method for benchmarking prices across operators and countries
For benchmarking countries, need a representative price basket per country– Rule: chose the largest operator’s most popular plan

27
ALL prices always need to be reported in a pure $ terms……
Cheapest prepaid Cheapest postpaid
2.894.20 4.06 4.61 4.39 4.06
5.83
7.876.96 7.23
9.7711.31 10.76
8.06
14.0214.67 14.76
12.99
20.18
23.9723.24
15.73
28.99
26.81
0.00
5.00
10.00
15.00
20.00
25.00
30.00
35.00
40.00
Pre
pa
id
Po
stp
aid
Pre
pa
id
Po
stp
aid
Pre
pa
id
Po
stp
aid
Pre
pa
id
Po
stp
aid
Pre
pa
id
Po
stp
aid
Pre
pa
id
Po
stp
aid
Pre
pa
id
Po
stp
aid
Pre
pa
id
Po
stp
aid
Pre
pa
id
Po
stp
aid
Pre
pa
id
Po
stp
aid
Pre
pa
id
Po
stp
aid
Pre
pa
id
Po
stp
aid
BD PK LK IN BD PK LK IN BD PK LK IN
Low User Medium User High User
US
D
28
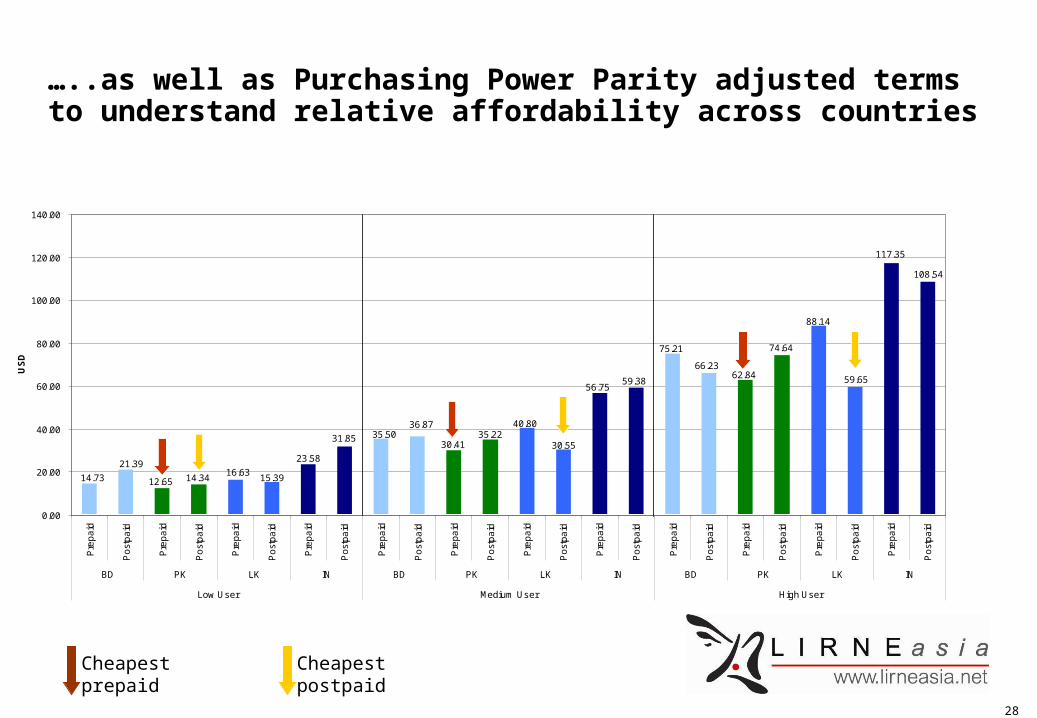
…..as well as Purchasing Power Parity adjusted terms to understand relative affordability across countries
Cheapest prepaid Cheapest postpaid
14.73
108.54
117.35
59.65
88.14
74.64
62.8466.23
75.21
59.3856.75
30.55
40.8035.22
30.41
36.8735.5031.85
23.58
15.3916.63
14.3412.65
21.39
0.00
20.00
40.00
60.00
80.00
100.00
120.00
140.00
Pre
pa
id
Po
stp
aid
Pre
pa
id
Po
stp
aid
Pre
pa
id
Po
stp
aid
Pre
pa
id
Po
stp
aid
Pre
pa
id
Po
stp
aid
Pre
pa
id
Po
stp
aid
Pre
pa
id
Po
stp
aid
Pre
pa
id
Po
stp
aid
Pre
pa
id
Po
stp
aid
Pre
pa
id
Po
stp
aid
Pre
pa
id
Po
stp
aid
Pre
pa
id
Po
stp
aid
BD PK LK IN BD PK LK IN BD PK LK IN
Low User Medium User High User
US
D
29
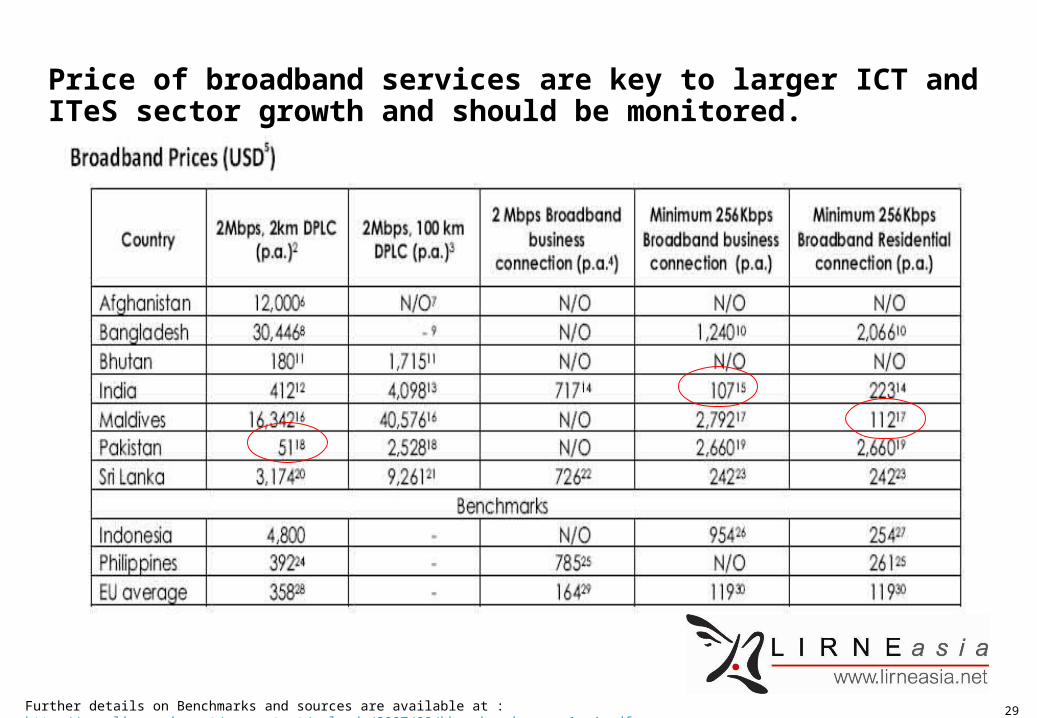
Price of broadband services are key to larger ICT and ITeS sector growth and should be monitored.
Further details on Benchmarks and sources are available at : http://www.lirneasia.net/wp-content/uploads/2007/09/bbenchmarks-page1-v4.pdf.

30
Revenue & Profitability
Measures the financial health of the sector
Gives an indication of how consumption is changing (e.g. comparing data vs. voice ARPU over time)
To be used with caution – operators express concerned that monitoring EBTIDA (or other profitability) margins may to “regulation” of profits
31
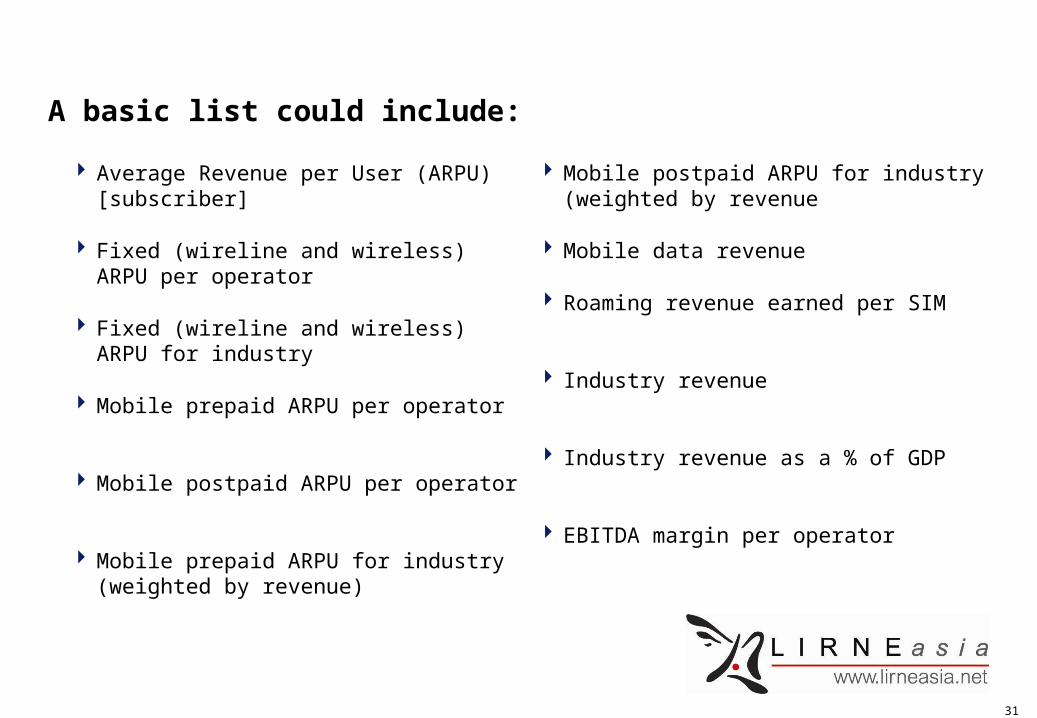
A basic list could include:
Average Revenue per User (ARPU) [subscriber]
Fixed (wireline and wireless) ARPU per operator
Fixed (wireline and wireless) ARPU for industry
Mobile prepaid ARPU per operator
Mobile postpaid ARPU per operator
Mobile prepaid ARPU for industry (weighted by revenue)
Mobile postpaid ARPU for industry (weighted by revenue
Mobile data revenue
Roaming revenue earned per SIM
Industry revenue
Industry revenue as a % of GDP
EBITDA margin per operator

32
Telecom sector revenue as a % of a country’s GDP is a powerful indicator of the importance of the sector
0
0.5
1
1.5
2
2.5
3
3.5
4
4.5
5
2000
2001
2002
2003
2004
2005
as
% o
f G
DP
india
indonesia
pakistan
philippinessri lanka
Source: India- TRAI, Indonesia- calculated, Philippines: WDI online; Sri Lanka: TRC and CBSL AR
Sector Revenue as % of DGD by Country
33
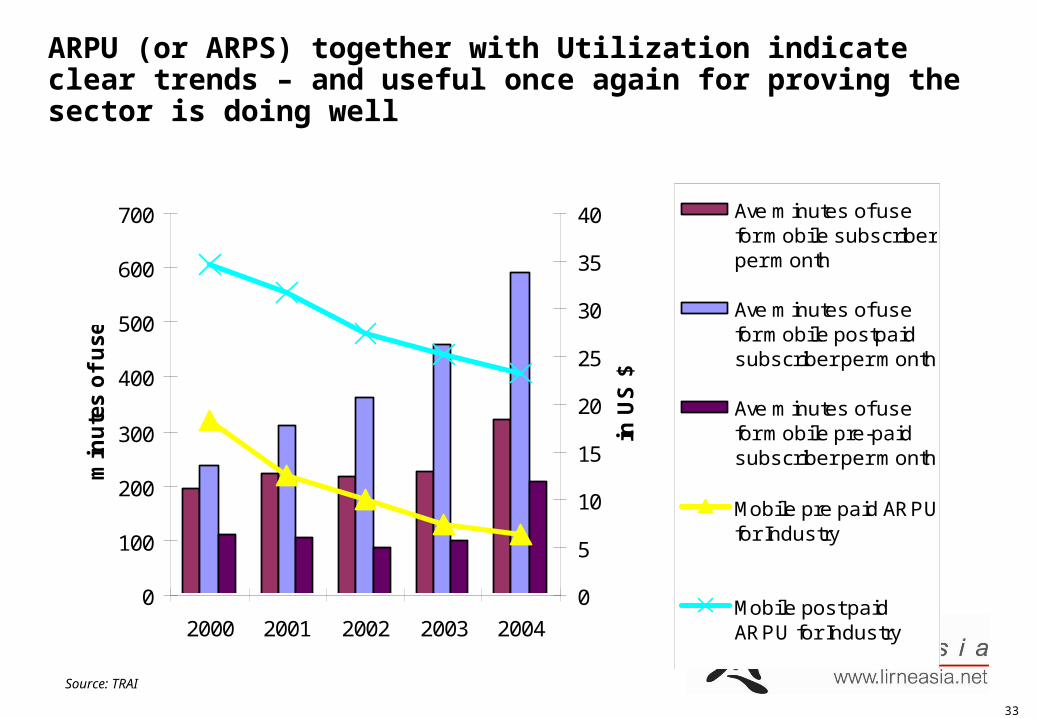
ARPU (or ARPS) together with Utilization indicate clear trends – and useful once again for proving the sector is doing well
0
100
200
300
400
500
600
700
2000 2001 2002 2003 2004
min
ute
s o
f u
se
0
5
10
15
20
25
30
35
40
in U
S $
Ave minutes of usefor mobile subscriberper month
Ave minutes of usefor mobile postpaidsubscriber per month
Ave minutes of usefor mobile pre-paidsubscriber per month
Mobile pre paid ARPUfor Industry
Mobile post paidARPU for Industry
Source: TRAI

34
Why EBITDA and not pure E (Earnings) for cross-country comparisons?
EBITDA = Earnings before Interest, Tax, Depreciation and Amortization
It’s the final list in the income statement that can effectively compare across countries because
– Taxes vary by country and distortionary
– Interest varies by company/country
– Accounting standards vary, therefore rules for Depreciation will vary by country

35
Quality of Service

36
A basic list could include
Telephony Quality
– Waiting list for main fixed lines
– Faults per 100 main (fixed lines) per year
– Percentage of telephone faults cleared by the next working day
– Call drop rates
– Percentage of connections with good voice clarity
– Call success rate
Broadband Quality
– Broadband download speed (kbps/Mbps)
– Broadband upload speed (kbps/Mbps)
– RTT (milli-second)- Round Trip Delay
– Jitter (milli-second)
– Packet- Loss (as a percentage)
– Broadband availability (as a percentage %)
Many of these indicators are reported regularly
already (through ITU etc
37
ICT access and usage
Great interest to almost all countries
Specially in light of e-Government, telecenter and similar initiatives
Gets to the heart of the DEMAND side (previous indicators were largely on the supply side)
38
Possible list of indicators, proposed international organizations
Percentage of population covered by mobile cellular telephony
Percentage of localities with public Internet access
– Urban vs. Rural
Percentage of households with:
– a fixed telephone, a mobile phone, a computer, internet access at home
Internet activities undertaken by individuals in the past 12 months
– See UN-Partnership’s list as starting point (page 4 of document)
Location of internet access of individuals on the last 12 months
– See UN-Partnership’s list as starting point (page 4)
Similar list of Use of ICT by businesses (see UN-ESCAP manual)
39
General Definitions
The basic data on demographics and the economy
Needed to analyze many of the previously stated indicators
40
The basic list should include:
Total Population of a country (from the NSO, preferably)
Number of households in a country
Number of Urban vs. Rural Households
Number of Urban vs. Rural population
Average number of people per household
GDP (from central bank or authoritative source)
Gross National Income

41
Client Logo
Maldives6 Dec 2007
Workshop on ICT Indicators & Benchmarking
Which Indicators for the Maldives?Picking a core list

42
YOU decide. Keep in mind...
The need is for indicators that: :
– Have definitions, collection frequencies, methodologies that can be agreed upon by everyone (operators, TAM, international standards)
– Give a comprehensive picture of the telecom/ICT sector in Maldives
– Enables meaningful comparison with chosen countries (no Maldives-only indicators)
Using benchmarks for regulation works with a list that is not too long.
– Track the key indicators regularly and benchmark
– Do collect a “longer” list for other purposes (e.g. the ITU list)
Strike the balance between getting perfect data vs. Imposing an overly heavy burden (cost) on collection
– Most likely the operators bear the cost of data collection/reporting
When reporting – use footnotes liberally


