

Closing the Gaps for Texas Closing the Gaps for Texas and Dallas County Childrenand Dallas County Children
Frances Deviney, PhDTexas KIDS COUNT Director
Center for Public Policy Priorities
Partners for ChildrenDallas, TX
July 14, 2009

Of the 450K kids in Dallas Co. Public Schools, more than two-thirds of Considered
Economically Disadvantaged
Non-economcially
Disadvantaged149,093 (33%)
Economically Disadvantaged301,099 (67%)
Source: 2008-2009 Enrollment Data, Texas Education Agency

GAPS IN ACHIEVEMENT: Fewer Economically Disadvantaged Kids in Dallas
Co. Pass the TAKS Tests
74
%
87
%
87
%
62
%68
%
79
% 86
%94
%
94
%
79
%
80
%
91
%
Reading Math Science SocialStudies
Writing AveragePassing Rate
Economically Disadvantaged Non-Economically Disadvantaged
Source: Percent Students Passing Across Grades Within Each Test, 2008 TAKS data, Texas Education Agency

How Many Economically Disadvantaged Kids Not Passing in
Dallas County?
• Reading = 32,000+
• Math = 51,000+
• Science = 23,000+
• Social Studies = 5,300+
• Writing = 5,000+

GAPS IN ATTAINMENT:
Dallas Co. Economically Disadvantaged and Minority Students Drop Out at Higher Rates
5.6
%8.1
%
21
.7%
19
.9%21
.8%
16
.5%
5.3
%
3.8
%
17
.6%
17
.2%
17
.3%
11
.4%
Overall Rate Econ. Disadv. AfricanAmerican
Hispanic White Asian/ PacificIslander
Dallas Co. Texas
Source: Class of 2007 four-year longitudinal dropout rate within group, Texas Education Agency

$50,532
$19,713
$26,415
$33,715
No High SchoolDiploma
High SchoolDiploma
Associate's Degree Bachelor's Degree
Source: Median Earnings in Past 12 Months for Dallas Co. Population 25 and Over, 2007 American Community Survey, U.S. Census Bureau (Table B20004)
GAPS IN EARNINGS:
Having a Degree Translates into Higher Annual Earnings

GAPS IN EARNINGS:
Nearly One of every Four Dallas Co. Dropouts Lives in Poverty
24%
15%
9%
4%
Less than H.S. H.S. Grad (includesequivalency)
Somecollege/Associate's
degree
Bachelor's degree orhigher
Source: Table C17003, 2007 American Community Survey, U.S. Census Bureau
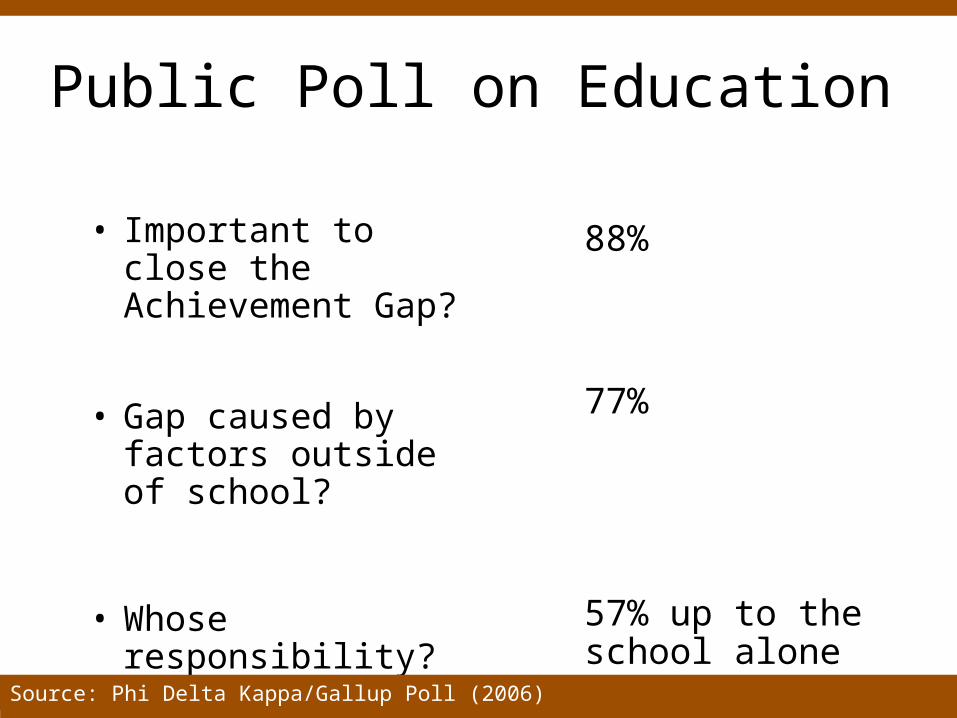
• Important to close the Achievement Gap?
• Gap caused by factors outside of school?
• Whose responsibility?
88%
77%
57% up to the school alone
Public Poll on Education
Source: Phi Delta Kappa/Gallup Poll (2006)

Family Economic Family Economic SecuritySecurity
Texas Children: Children in
Our Community

“It is unrealistic to expect tochange schools in any deep waywithout dealing with some of theissues that arise with poverty.”
Richard Rothstein as cited in “Why Segregation Matters”

Federal Poverty Guidelines
$22,050Family of 4 < $20,650/year
$18,310Family of 3 < $17,170/year
$14,570Family of 2 < $13,690/year2009 2007

One of Every Four Dallas County Children Lives in Poverty
Source: Children ages 0-17, Small Area Income and Poverty Estimates, U.S. Census Bureau
19.9%
25.5%
23.6%
23.1%
1997 1998 1999 2000 2001 2002 2003 2004 2005 2006 2007
Dallas Co. Texas

Monthly Costs for Single-Parent, Two-Child Family in Dallas-Plano-Irving
Total Monthly Expenses = $2,866 - $3,432Source: Family Budget Estimator, CPPP, www.cppp.org/fbe
$212-$710 $798 $927
$356 $285 $288-356

Necessary Income for Single-Parent, 2-Child Family in
Dallas-Plano-Irving
Annual = $35,776 - $45,032
OR208% to 257% of FPL
Source: Family Budget Estimator, CPPP, www.cppp.org/fbe

Dallas-Plano-Irving Family Budgets vs. Federal Poverty Guidelines (FPG)
$0
$10,000
$20,000
$30,000
$40,000
$50,000
Single Parent,One Child
Single Parent,Two Children
Two Parents,One Child
Two Parents,Two Children
Necessary income to cover expenses w/out assistance (FBE)
Max income for basic child care (185% FPG)
Max income for Food Stamps (130% FPG)
Poverty Guidelines
Source: US DHHS; State Plan for CCDF Services fro 2007-2009; CPPP’s Family Budget Estimator (2007) expenses assumes 100% of employee and 50% of dependent premiums paid by employer.
$20,650$17,170$17,170
$13,390
$26,845$22,321$22,321
$17,407
$38,203
$31,765$31,765
$24,772
$43,723 212% FPG$39,132
228% FPG$35,776 208% FPG$29,990
213% FPG

Early Care & EducationEarly Care & Education

Early Care and Education Options for Dallas County Children
• Subsidized Child Care Enrollment (ages 0-12)
– UP 43%, to over 23K or 4.8% (2000-2007)
• Subsidized Child Care Waiting List– Over 4,200 (DWFB, SFY 2008 monthly average)
• Head Start (ages 3-4)
– UP 5%, to over 4,100 (2000-2008)
Source: Texas Workforce Commission; U.S. Administration for Children and Families
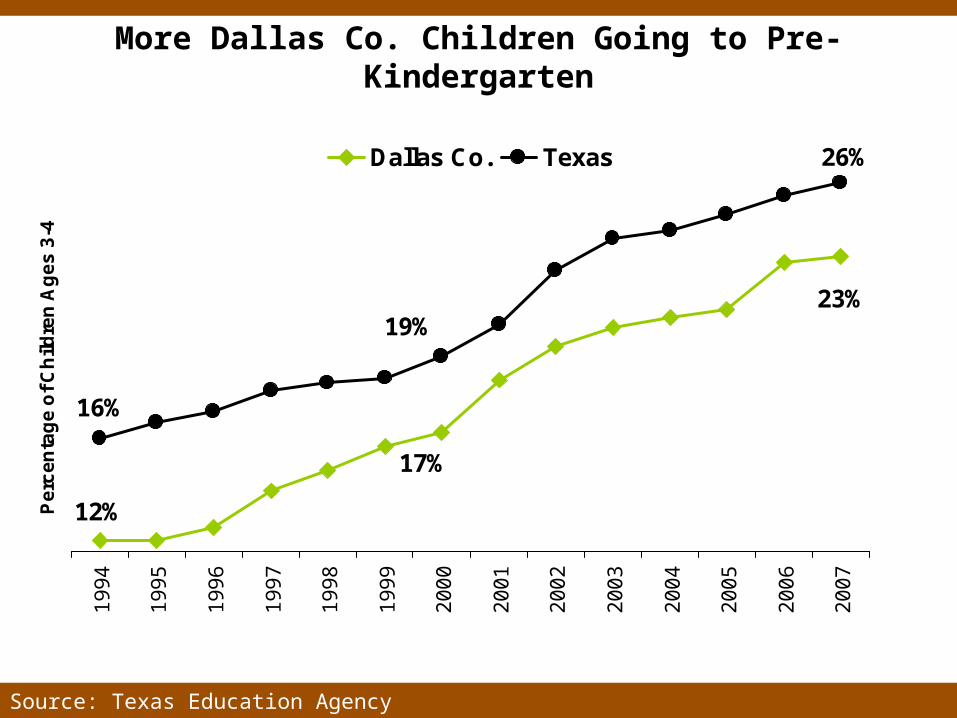
More Dallas Co. Children Going to Pre-Kindergarten
23%
12%
17%
26%
16%
19%
19
94
19
95
19
96
19
97
19
98
19
99
20
00
20
01
20
02
20
03
20
04
20
05
20
06
20
07
Pe
rce
nta
ge
of
Ch
ildre
n A
ge
s 3
-4
Dallas Co. Texas
Source: Texas Education Agency

Child NutritionChild Nutrition

Texas Ranks 48th in Food Insecurity
• 1 in 6 Texas families (with 1.4M kids)
• Hungry children:– Miss more school– Less attentive– More likely to fail and be held back– More likely to drop out
Source: Nord et al. (2007); Brown et al. (2007)

Dallas Co. Participation inHunger & Nutrition Programs
• WIC (ages 0-4) UP 41% – Nearly 80K or 39% of all kids 0-4 (2000 to 2007)
• Food Stamps UP 264% – Nearly 113K or 17% of all kids (2000 to 2007)
• Free or Reduced-Price Lunch UP 46% – 286,843 kids or 70% public school students
(2000 to 2008) Source: Texas Department of Health and Human Services; Texas Department of State Health Services, Texas Department of Agriculture

Infant and Child HealthInfant and Child Health

Health Insurance for Dallas Co. Children
• Medicaid UP 21% – Nearly 196K enrolled (Aug 2003-April 2009)
• CHIP UP 16% – Over 56K enrolled (Aug 2003-May 2009)
• CHIP Perinatal UP 32%– Nearly 11K Perinates and Moms covered
(Jan 2008-Apr 2009)
Source: Texas Health and Human Services Commission

Texas Has Had the Highest Rate of Uninsured Children in the Nation for Nine Years Running
24%
24%
22%
22%
21%
21%
20%
20% 21
%
14%
13%
12%
11%
11%
11%
11%
11% 12
%
1998 1999 2000 2001 2002 2003 2004 2005 2006
Texas United States
Source: Kids 0-18, KIDS COUNT State-Level Data Online, Annie E. Casey Foundation

Fewer Texas Kids Receiving Health Coverage Through Parent’s Employer
57.0%52.0%
47.0%
1999 2004 2007
Source: March Supplement data, Current Population Survey, U.S. Census Bureau

Of the 49,000 MORE Uninsured Texas Kids in 2006:
Nearly 6 out of 10
live in families
with low to moderate incomes
Source: 3-year average data (2004-2006 vs. 2005-2007) for children ages 0-18, Current Population Survey, U.S. Census Bureau
“The achievement gap can besubstantially narrowed only whenschool improvement is combinedwith social and economic reform”
Richard Rothstein, “Class and Schools”

What can we do?National Health Reform
www.texasvoiceforhealthreform.org

Texas Voice for Health Reform
Principles•Affordable access to good healthcare must be available for all Americans
•A decent standard of comprehensive care must be established
•Additionally, national health reform should also address:• safe and high quality care; •costs and cost-effectiveness of health care; •consumer choice; and •eliminating barriers to care
www.texasvoiceforhealthreform.org

What can we do?Increased outreach for state work
support programs
• CHIP, Medicaid, Food Stamps, TANF – All use the same state application
• Have to have a strong local support system in place because . . .– Eligibility system in crisis
• Local support network should . . . – Get families in the system (only 1st page of app. required)– Follow families to make sure they turn in whole application– Let families know about expedited process

• Family Economic Security– child tax credits– lengthened time on unemployment– assistance in paying for insurance through COBRA
• Early Childhood Education– Total ARRA Child Care allocations for FY2009 for Dallas
WFB = $18.5M• Texas Rising Star Provider Certification• Teacher and director training• Increase capacity or to obtain licensure for infant and toddler car• Materials to improve the quality of child care
What can we do? Access available ARRA $

What can we do?
Continue to support schools by supporting
community-based school improvement efforts

Sustained & Balanced Investment
by the Community in the Community
is the Key

Let’s make sure we’re not shortchanging our children.

www.cppp.org/kidscount

Contact InformationContact Information
Frances Deviney, PhD
Texas KIDS COUNT Director
(512) 320-0222 ext. 106
Sign up to receive notice of our work at: www.cppp.org

Use of This PresentationThe Center for Public Policy Priorities encourages you to reproduce and distribute these slides,
which were developed for use in making public presentations.
If you reproduce these slides, please give appropriate credit to CPPP.
The data presented here may become outdated.
For the most recent information or to sign up for our free E-Mail Updates, visit www.cppp.org.
© CPPP
Center for Public Policy Priorities900 Lydia StreetAustin, TX 78702
Phone 512-320-0222 Fax 512-320-0227


