
Priyadarshi Mahapatra, Benjamin OmellNational Energy Technology Laboratory, Pittsburgh, PA
2018 Capture Technology Project Review MeetingPittsburgh, PA
August 13, 2018
Development and Application of Advanced Process Control for UKy CO2 Capture Pilot-Plant

Overview
2
• Background– Motivation | Objectives– CCSI’s APC Framework Toolset– UKy-CAER CO2 Capture Pilot-Plant Facility
• Project Plan / Status• Past Accomplishments
– Identify “most-influential” I/O variables– Develop dynamic reduced models– Offline “simulation-based” control studies
• Current Activity / Accomplishments– Integration with pilot-plant DCS– Implement real-time APC
• Results• Summary

Motivation / Contribution to CCSI2
3
• Industrial APC Ain’t Easy– Computational cost– Need for accurate and fast real-time
prediction models– APC / NMPC module costs - $$$– Non-generic, embedded within DCS
• New Contribution– NMPC-based industrial control
• Optimal dynamic operation– Exploit more-efficient third-party
solvers (MATLAB – sparse matrix calculations, IPOPT, etc.)
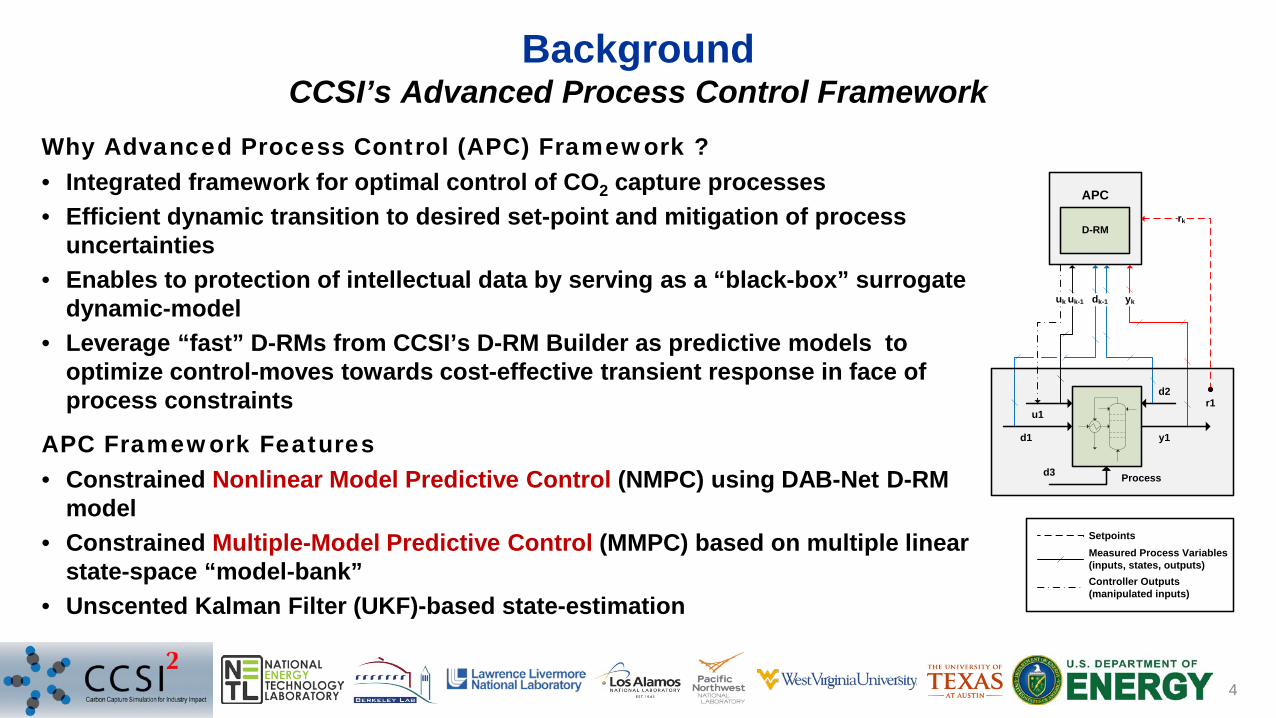
BackgroundCCSI’s Advanced Process Control Framework
4
D-RM
uk
APC
d2
y1
Process
u1
dk-1 yk
rk
uk-1
d1
d3
SetpointsMeasured Process Variables(inputs, states, outputs) Controller Outputs(manipulated inputs)
r1
Why Advanced Process Control (APC) Framework ?• Integrated framework for optimal control of CO2 capture processes• Efficient dynamic transition to desired set-point and mitigation of process
uncertainties• Enables to protection of intellectual data by serving as a “black-box” surrogate
dynamic-model• Leverage “fast” D-RMs from CCSI’s D-RM Builder as predictive models to
optimize control-moves towards cost-effective transient response in face ofprocess constraints
APC Framework Features• Constrained Nonlinear Model Predictive Control (NMPC) using DAB-Net D-RM
model• Constrained Multiple-Model Predictive Control (MMPC) based on multiple linear
state-space “model-bank”• Unscented Kalman Filter (UKF)-based state-estimation
Background
5
• University of Kentucky’s CCS Project– Center for Applied Energy Research (CAER)
• Other Participants: LG&E/KU, Hitachi, EPRI, etc.– 2 MWth (0.7 MWe) slip stream test facility– At E. W. Brown Generating Station
• Louisville Gas & Electric (LG&E) and Kentucky Utilities (KU)• In Harrodsburg, KY, 30 miles from UKy-CAER
– Sponsors• DOE/NETL ($14.55 Million)• Kentucky Department of Energy Development and Independence• Carbon Management Research Group (Consortium)
– Catch and release program• Opportunity: improve control responses time | residence time in
solvent/desiccant loops
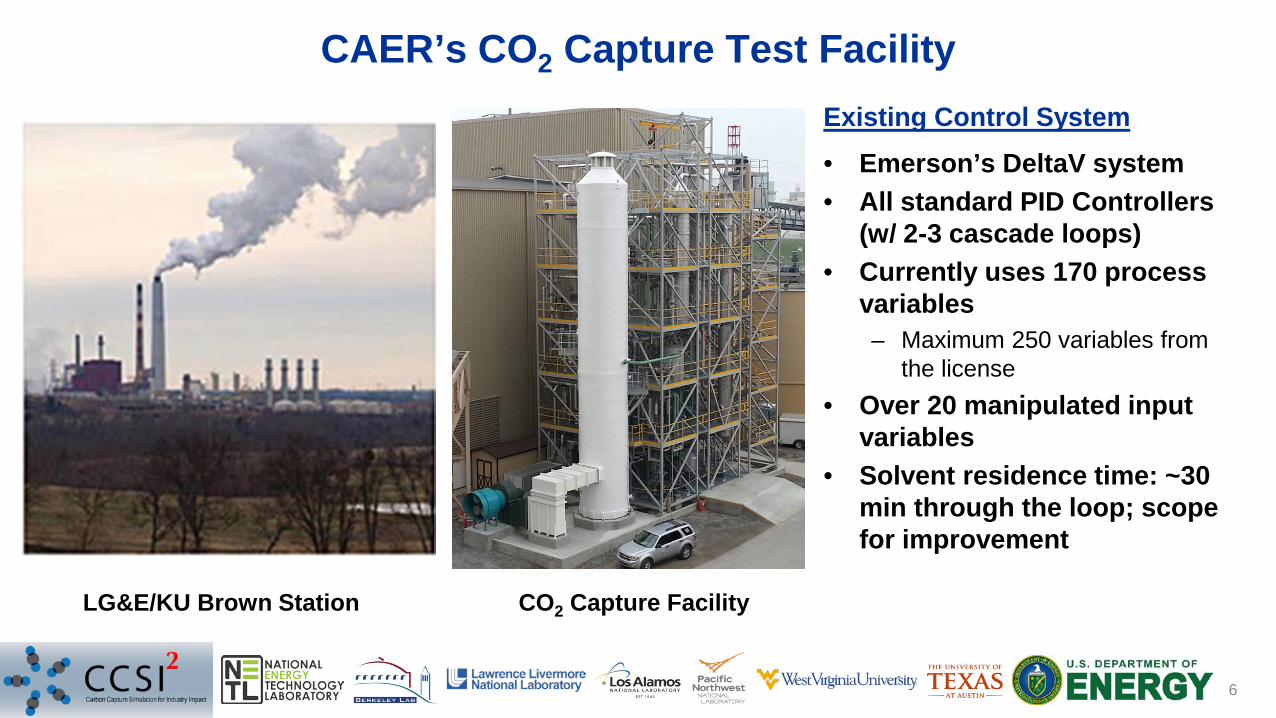
CAER’s CO2 Capture Test Facility
6
LG&E/KU Brown Station CO2 Capture Facility
Existing Control System• Emerson’s DeltaV system• All standard PID Controllers
(w/ 2-3 cascade loops)• Currently uses 170 process
variables– Maximum 250 variables from
the license• Over 20 manipulated input
variables• Solvent residence time: ~30
min through the loop; scope for improvement

Project Status/Plan
7
• Assess control requirements• Operability and controllability analysis
•Identify relevant I/O process variables•Design step-change sequence•Run step-tests
− Keep low-level PID controllers unchanged• Build D-RM for the system
•Validate approach on secondary-stripping column sub-section•Develop D-RM for entire plant
− Testing data | Validation data• Evaluate APC methodology for online real-time control
•Validate APC approach using offline “plant” based on D-RM – demonstrated benefits•Integrate CCSI’s APC Framework w/ pilot-plant’s DCS•Closed-loop identification based on historical data
• Implement real-time nonlinear MPC•Controller tuning and validation (preliminary)•Demonstrate operational improvement over existing methods
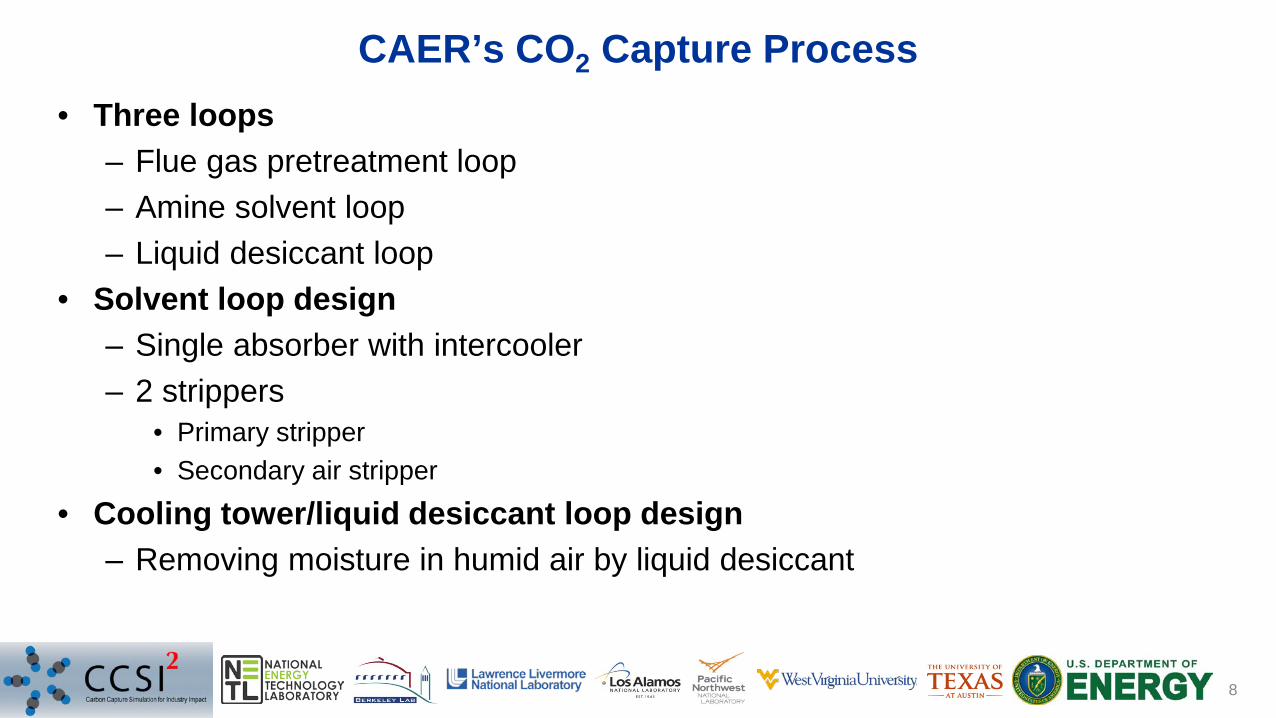
CAER’s CO2 Capture Process
8
• Three loops– Flue gas pretreatment loop– Amine solvent loop– Liquid desiccant loop
• Solvent loop design– Single absorber with intercooler– 2 strippers
• Primary stripper• Secondary air stripper
• Cooling tower/liquid desiccant loop design– Removing moisture in humid air by liquid desiccant

B-101
C-101
P-102
Flue Gas
E-102
T-101
To FGD
C-102
Pret
reat
men
t To
wer
Absorber
P-103
E-113
E-106
Sec. Heat Recovery
HX
Rich Heat Recover HX
C-105
Secondary Stripper
P-108
E-104
E-110
E-114Lean/Rich
HX
C-104
Primary Stripper
P-104
E-108
Pri. Heat Recovery
HX
To Stack
C-108
H2O Evaporator
P-106
E-109E-111
B-104
AirP-110
E-105
E-115
Liquid Desiccant
Cooler
Liquid Desiccant
Chiller
Air
B-103
Air
T-105
P-116
Desiccant Make-Up
Tank
T-103
P-113
Amine Make-Up
Tank
Flue Gas
Rich Amine
Lean Amine
CO2
CO2 + Air
H2O / Sat. Air
Liq. Desiccant
Air
Color Legend
P-112E-112
Process Flow Diagram
University of KentuckyCAER CO2 Capture Pilot Plant
Developed by:Priyadarshi Mahapatra, NETL
Jinliang Ma, NETL
Date: 1/19/2017
C-106
CWR
CWS
Cooling Tower
Soda Ash Make-Up
Tank
9
Proc
ess
Flow
Dia
gram
Mat
eria
l Str
eam
s +
IO V
aria
bles
Secondary Stripper
Level
Primary Heat Recovery HX Temperature
CO2Capture
Cooling Air Flowrate
Desiccant Flowrate
Rich Polishing
Steam
Secondary Stripper Air
Flowrate
Solvent Flowrate
Reboiler Steam
Evaporator Polishing
Steam
Primary Stripper Pressure
SS Overhead Temperature or CO2 Comp.
FluegasFlowrate
FluegasComposition
Ambient Humidity
Ambient Temperature
Variable Legend
DisturbanceManipulated
Control
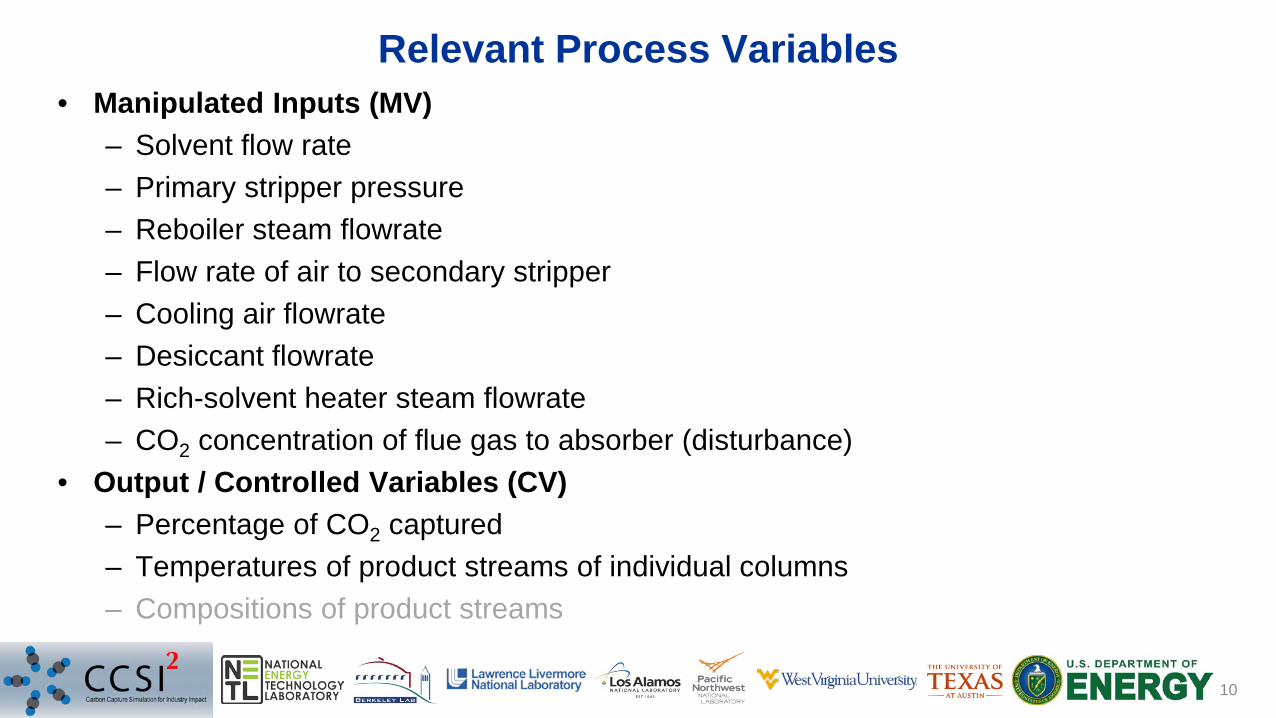
Relevant Process Variables
10
• Manipulated Inputs (MV)– Solvent flow rate– Primary stripper pressure– Reboiler steam flowrate– Flow rate of air to secondary stripper– Cooling air flowrate– Desiccant flowrate– Rich-solvent heater steam flowrate– CO2 concentration of flue gas to absorber (disturbance)
• Output / Controlled Variables (CV)– Percentage of CO2 captured– Temperatures of product streams of individual columns – Compositions of product streams

Previous “offline” Control Studies
11
0 50 100 150 200 250Time [min]
86.5
87
87.5
88
88.5
89
89.5
90
90.5
91
91.5
CO
2 C
aptu
re [%
]Conventional PIDNMPC w/ APC Framework
CO2 concentration disturbance in inlet flue gas (14% to 16%) at t = 0
NMPC Objective function
80% reduction in settling time
Less (~5%) steam duty
( ) ( )
( )
12 2 2 2... 1
1
min CO CO CO CO
Stm Stm
M
P TSP SPp p y p p
p
MReb RHR TM M m u m
m
J=
=
= − −
+ + +
∑
∑
Δu Δuw
Δu w Δu
0 50 100 150 200 250Time [min]
17
18
19
20
21
22
23
24
Solv
ent F
low
(L/G
)
0 50 100 150 200 250Time [min]
1500
1600
1700
Reb
oile
r Ste
am [l
b/hr
]
300
400
500
RH
R S
team
[lb/
hr]
Extracost
Extra cost
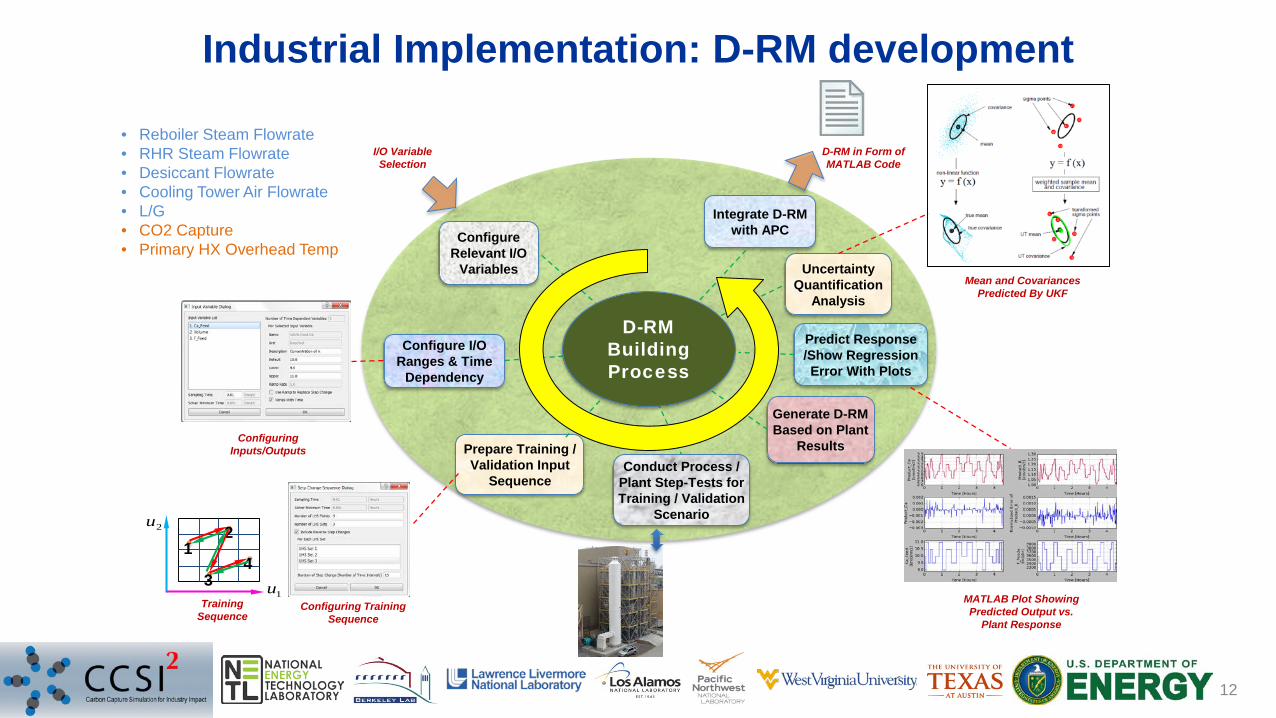
Industrial Implementation: D-RM development
12
Generate D-RM Based on Plant
Results
Configure I/O Ranges & Time
Dependency
Prepare Training / Validation Input
SequenceConduct Process /
Plant Step-Tests for Training / Validation
Scenario
Configure Relevant I/O
Variables
Integrate D-RM with APC
Predict Response/Show RegressionError With Plots
UncertaintyQuantification
Analysis
1u
2u
12
34
I/O Variable Selection
Configuring Inputs/Outputs
Configuring Training Sequence
TrainingSequence
MATLAB Plot Showing Predicted Output vs.
Plant Response
Mean and CovariancesPredicted By UKF
D-RM in Form of MATLAB Code
D-RM Building Process
• Reboiler Steam Flowrate• RHR Steam Flowrate• Desiccant Flowrate• Cooling Tower Air Flowrate• L/G• CO2 Capture• Primary HX Overhead Temp

500 600 700 800 900 1000 1100 1200 1300Time [min]
8
10
12
14
16
18
20
Solv
ent L
/G
500 600 700 800 900 1000 1100 1200 1300Time [min]
42
43
44
45
46
47
48
49
50
51
Des
icca
nt F
low
rate
[gpm
]
500 600 700 800 900 1000 1100 1200 1300Time [min]
900
1000
1100
1200
1300
1400
1500
1600
1700
1800
Reb
oile
r Ste
am [l
b/hr
]
0
100
200
300
400
500
600
Ric
h-H
eat-R
ecov
ery
Stea
m [l
b/hr
]500 600 700 800 900 1000 1100 1200 1300
Time [min]
2.45
2.5
2.55
2.6
2.65
2.7
2.75
2.8
2.85
Coo
ling
Tow
er A
ir [s
cfm
]
10 4
Results – System Identification / D-RM Building
13
5 Input Variables

Results – System Identification / D-RM Building
14
500 600 700 800 900 1000 1100 1200 1300Time [min]
110
115
120
125
130
135
140
Prim
ary
Hea
t-Rec
over
y H
X Te
mp
[° F]
Pilot-PlantD-RM Model
500 600 700 800 900 1000 1100 1200 1300Time [min]
0
10
20
30
40
50
60
70
80
90
100
CO
2 C
aptu
re [%
]
Pilot-PlantD-RM Model
Primary Control Variable – Minimize settling times Critical Constraint Variable – Values above 139F leads to solvent leakage from stack (closely monitored)
D-RM tracks the pilot-plant response well with slight offset for validation data
2 Output Variables
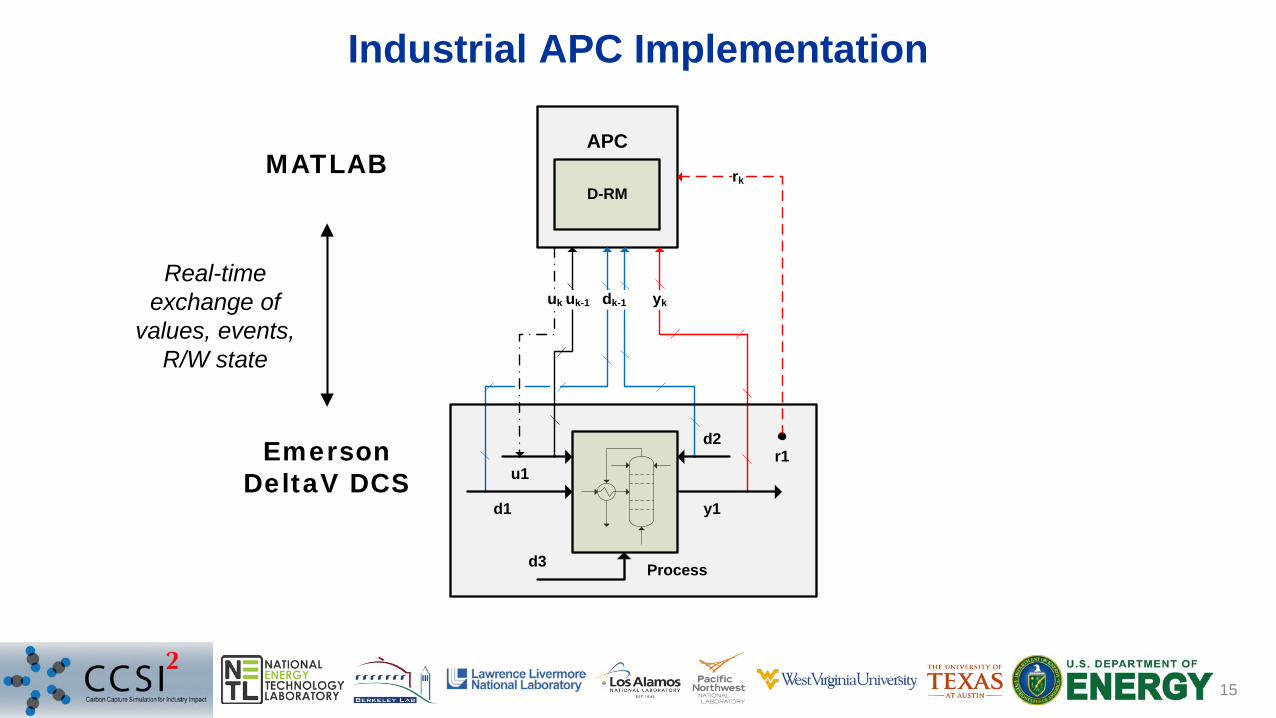
Industrial APC Implementation
15
D-RM
uk
APC
d2
y1
Process
u1
dk-1 yk
rk
uk-1
d1
d3
SetpointsMeasured Process Variables(inputs, states, outputs) Controller Outputs
r1
MATLAB
Emerson DeltaV DCS
Real-time exchange of
values, events, R/W state

Integration with pilot-plant DCS
16
• OPC (OLE for Process Control) Protocol•Identify existing Emerson Delta-V OPC server on pilot-plant DCS•Create OPC client within CCSI APC Framework•Establish connection from client to server•Identify process variables tags (r/w permissions) available on server – PLC/charm names•Create read-only PV tags and writable remote setpoint (SP) tags on client•Conduct step-tests on relevant remote SP and validate PV with DCS historian
• Develop event callbacks routines for solving real-time control optimization problem• Establish real-time communication at each sampling “clock” time
OPC Write (Sync):Bucket....Real8
OPC Read (Device):Bucket...e.Real8
V
Q
V
OPC ConfigReal-Time

0 50 100 150 200 250Time [min]
78
80
82
84
86
88
90
92
94C
O2
Cap
ture
[%]
Results – Real-time APC (preliminary study)
17
Controller satisfies upper-limit – prevents potential solvent leak
Restores 90% capture quickly using settling-time optimization
Con
trol
Var
iabl
esM
anip
ulat
ed In
puts
Study Details• 3 input – 2 output• CO2 concentration
disturbance in inlet flue gas (14% to 16%) at t = 600 min
• Control objective
• Sampling-time = 1 min• Prediction Horizon = 2 hr• Control Horizon = 10
steps
( ) ( )1
2 2 2 2... 1
1
min CO CO CO COM
P TSP SPp p y p p
p
MTm u m
m
J=
=
= − −
+
∑
∑
Δu Δuw
Δu w Δu
0 50 100 150 200 250Time [min]
1400
1450
1500
1550
1600
1650
1700
Reb
oile
r Ste
am [l
b/hr
]
350
400
450
500
RH
R S
team
[lb/
hr]
0 50 100 150 200 250Time [min]
38
40
42
44
46
48
50
52
54
56
Des
icca
nt F
low
(gpm
)
APC FrameworkConventional
0 50 100 150 200 250Time [min]
136
136.5
137
137.5
138
138.5
139
139.5
Prim
ary
Hea
t-Rec
over
y H
X Te
mp
[° F]
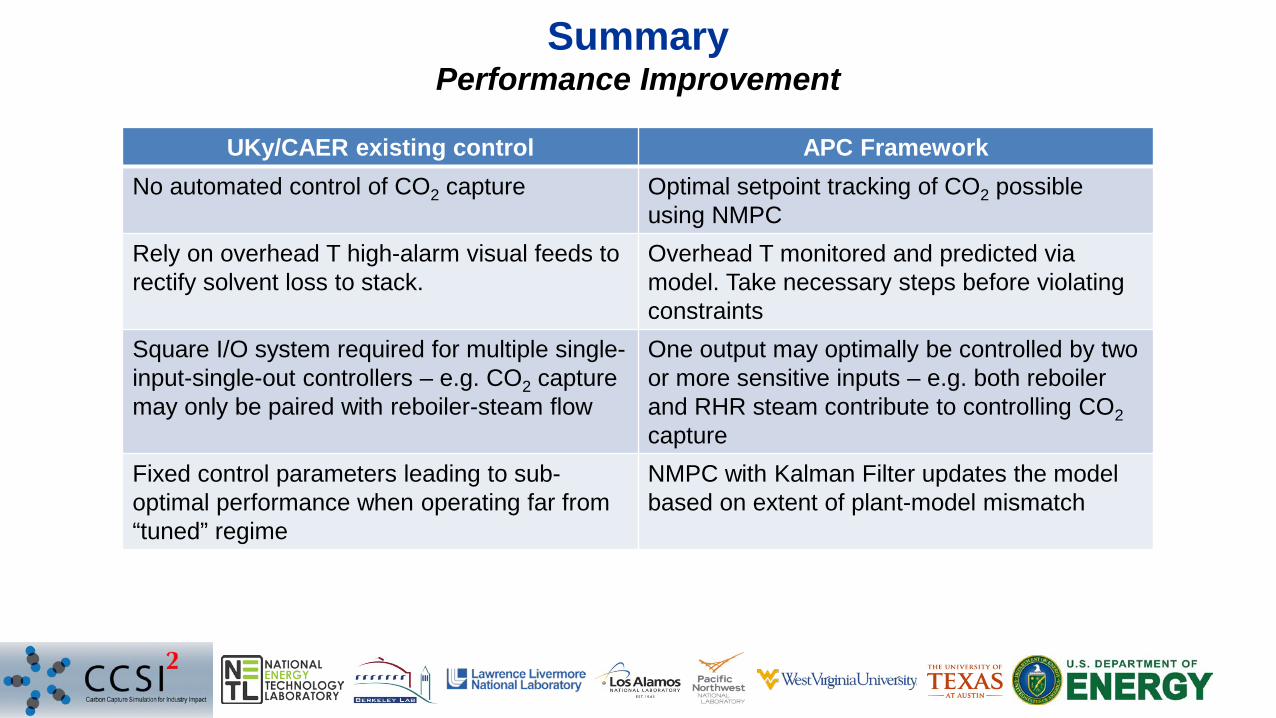
SummaryPerformance Improvement
UKy/CAER existing control APC FrameworkNo automated control of CO2 capture Optimal setpoint tracking of CO2 possible
using NMPCRely on overhead T high-alarm visual feeds to rectify solvent loss to stack.
Overhead T monitored and predicted via model. Take necessary steps before violating constraints
Square I/O system required for multiple single-input-single-out controllers – e.g. CO2 capture may only be paired with reboiler-steam flow
One output may optimally be controlled by two or more sensitive inputs – e.g. both reboiler and RHR steam contribute to controlling CO2capture
Fixed control parameters leading to sub-optimal performance when operating far from “tuned” regime
NMPC with Kalman Filter updates the model based on extent of plant-model mismatch
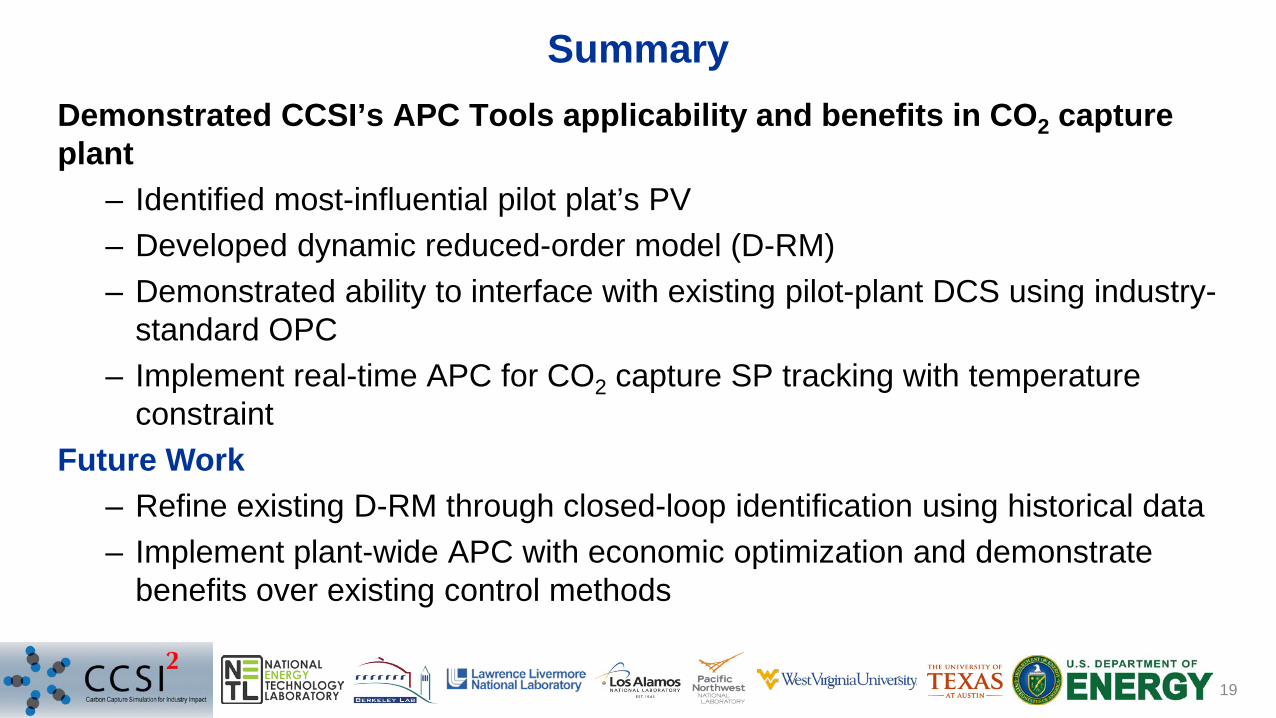
Summary
19
Demonstrated CCSI’s APC Tools applicability and benefits in CO2 capture plant
– Identified most-influential pilot plat’s PV– Developed dynamic reduced-order model (D-RM)– Demonstrated ability to interface with existing pilot-plant DCS using industry-
standard OPC– Implement real-time APC for CO2 capture SP tracking with temperature
constraintFuture Work
– Refine existing D-RM through closed-loop identification using historical data– Implement plant-wide APC with economic optimization and demonstrate
benefits over existing control methods
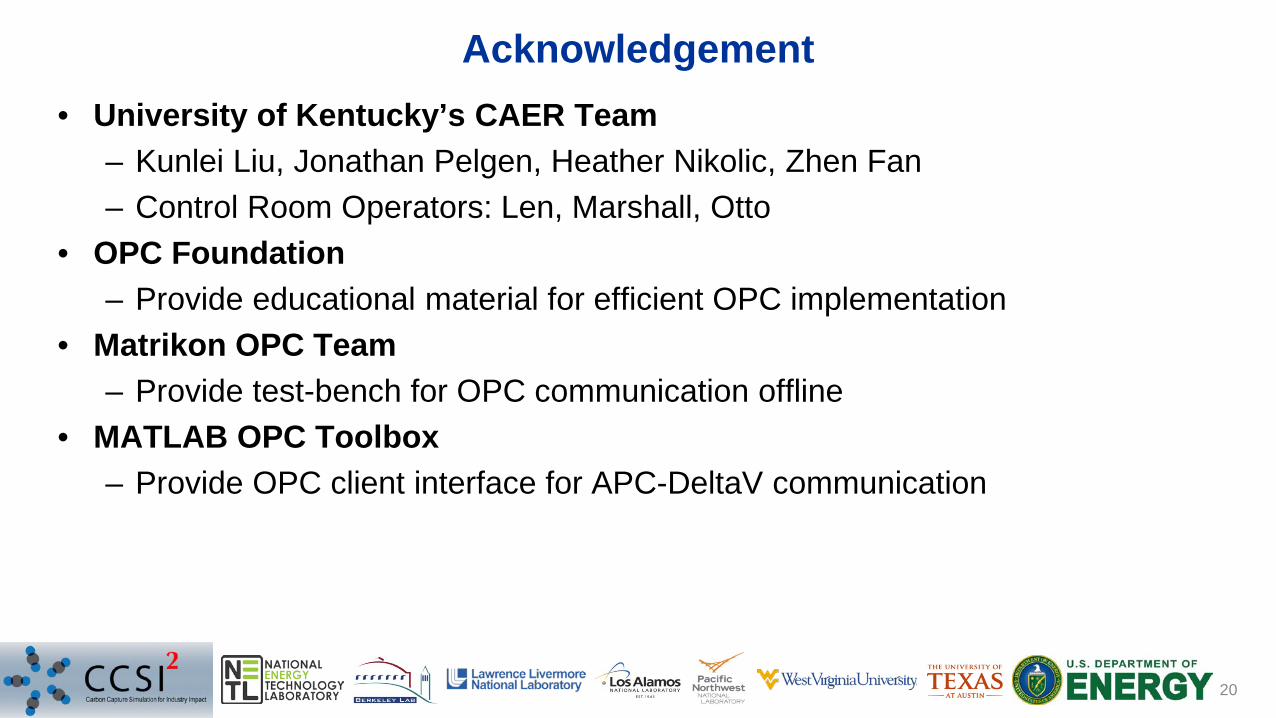
Acknowledgement
20
• University of Kentucky’s CAER Team– Kunlei Liu, Jonathan Pelgen, Heather Nikolic, Zhen Fan– Control Room Operators: Len, Marshall, Otto
• OPC Foundation– Provide educational material for efficient OPC implementation
• Matrikon OPC Team– Provide test-bench for OPC communication offline
• MATLAB OPC Toolbox– Provide OPC client interface for APC-DeltaV communication
Disclaimer
21
This presentation was prepared as an account of work sponsored by an agency of the United States Government. Neither the United States Government nor any agency thereof, nor any of their employees, makes any warranty, express or implied, or assumes any legal liability or responsibility for the accuracy, completeness, or usefulness of any information, apparatus, product, or process disclosed, or represents that its use would not infringe privately owned rights. Reference herein to any specific commercial product, process, or service by trade name, trademark, manufacturer, or otherwise does not necessarily constitute or imply its endorsement, recommendation, or favoring by the United States Government or any agency thereof. The views and opinions of authors expressed herein do not necessarily state or reflect those of the United States Government or any agency thereof.
For more informationhttps://www.acceleratecarboncapture.org/
Priyadarshi Mahapatra, NETL, [email protected]
Benjamin Omell, NETL, [email protected]


