

Coffee certification and forest quality: A case in Ethiopia By Ryo Takahashi and Yasuyuki Todo,
Waseda University
Shade coffee certification programs that aim to conserve the forest have attracted an
increasing amount of attention. However, there is heated debate whether certification
programs create an incentive for producers to expand their coffee-growing areas.
This study conducted in Ethiopia aimed to evaluate the impact of a shade coffee
certification on forest degradation. Additionally, to provide empirical evidence for the
debate, we examined the spillover effects of certification to surrounding forest. We
used remote sensing data to identify the forest quality and applied matching methods
to compare forest coffee areas with and without the certification. We found that the
certified areas significantly conserved forest quality compared with the areas without
certification. Furthermore, our empirical results revealed that the certification had a
positive impact on the forest areas within a 100 m radius. These results indicate that
the certification program is effective in alleviating forest degradation.

1. Introduction
Deforestation and loss of biodiversity are widespread problems in less developed countries,
particularly in the nations of sub-Saharan Africa and Latin America (Hosonuma et al. 2012;
Mayaux et al. 2013; Tilman et al. 2001). Concurrently, many studies have noted the importance
of traditional coffee production for forest conservation and biodiversity protection. Coffee is
traditionally grown in the understory of shade trees, and the agroecosystems of shaded coffee
preserve the forest and provide an important refuge for biodiversity (Buechley et al. 2015;
Greenberg et al. 1997; Hundera et al. 2013; Mas and Dietsch 2004; Moguel and Toledo 1999;
Perfecto et al. 1996; Perfecto and Snelling 1995; Tadesse et al. 2014; Wunderle Jr and Latta
1996).
However, because of the low yield of the shaded coffee system, many forest areas currently
operating under the shaded coffee system are rapidly being converted into plantations for modern
industrial coffee production (Jha et al. 2014). Although the modern coffee system improves
yields, this improvement comes with increased environmental costs, such as forest reduction,
increased erosion, chemical runoff (Perfecto et al. 1996; Rappole et al. 2003b; Staver et al. 2001).
To reduce coffee producers’ incentives to convert to the modern coffee system, shade coffee
certification programs have attracted increasing attention from conservation and development
organizations (Fleischer and Varangis 2002; Perfecto et al. 2005; Philpott and Dietsch 2003;
Taylor 2005). Certification programs seek to link environmental and economic goals by
providing a premium price to producers who maintain shade trees and thereby contributing to the
protection of forest cover and biodiversity.
Some empirical studies have examined the impact of certification programs. Blackman and
Rivera (2011) reviewed the literature on benefits of coffee certification programs. However,
previous studies cited in their study are mainly focusing on the economic benefits or impact of
organic and fair trade certification. Hence, the environmental impact of shade coffee certification
programs is still unclear.
Another study by Mas and Dietsch (2004) conducted Mexico attempted to evaluate the
effect of coffee certification on biodiversity conservation. Unfortunately, because they studied an

area that was likely to meet the criteria used by the major certification programs, their results
could not prove that the certification program was the cause of the conservation effects.
In recent years, Takahashi and Todo (2013) rigorously evaluated the impact of shade coffee
certification on deforestation in Ethiopia and found a significantly positive effect. Moreover,
they revealed that the certification program examined in their study particularly affects the
behaviors of economically poor producers in motivating them to conserve the forest (Takahashi
and Todo 2014). Additionally, Rueda et al. (2014) also reported the positive effect of
certification on forest cover using remote sensing data. However, the focus of these studies was
the impact of coffee certification on forest quantity (e.g., size of forest area), not on forest quality
(e.g., biomass and vegetation structure). Thus, whether coffee certification system successfully
preserves forest quality remains unclear.
Meanwhile, a heated debate continues as to whether coffee certification may trigger forest
degradation in surrounding non-coffee natural forest. As Rappole et al. (2003b) noted, one
potential problem with certification programs is that they can create incentives for producers to
convert an existing primary forest area into an area that produces shade coffee. However,
Philpott and Dietsch (2003) dispute the claims of Rappole et al. (2003b) and argue that such
degradation can be prevented. Because no studies have yet examined the spillover effect of the
coffee certification system, the debate between Philpott and Dietsch (2003) and Rappole et al.
(2003a) has not yet reached a consensus.
Therefore, the purpose of this study is to evaluate the impact of a shade coffee certification
program on forest degradation and to focus on its spillover effects involving the surrounding
forest without forest coffee. We selected Ethiopia as a case study. To evaluate the impact of
certification rigorously, we applied matching methods, such as the Mahalanobis matching and
the propensity score matching (PSM) with different algorithms, and controlled for selection bias.
We estimated the impact of certification by comparing the forest coffee areas with and without
the certification. Additionally, we tested the sensitivity of estimates to potential hidden biases.
2. Description of the Study Area
2.1. Description of the Belete-Gera RFPA
We selected the Belete-Gera Regional Forest Priority Area (RFPA) as the study area (Fig. 1).
This region is part of the highland rainforest, and the natural vegetation in this area is subject to
an annual precipitation of 1,500 mm and an annual average air temperature of approximately 20
degrees Celsius. The topography of the Belete-Gera RFPA is complex and consists of undulating
hills that range from 1,200 to 2,900 m in height, with steep mountainous terrain in certain
locations.
The Belete-Gera RFPA is one of the important biodiversity hot spots in Ethiopia. Within the
forest, we can observe wild mammals, such as baboons, monkeys, and giant forest hogs, and
different types of bird species. However, despite the government’s prohibition of wood
extraction in the forest area, the forest cover in the RFPA has decreased significantly in recent
years. The satellite images show that 40% of the forest area has been cleared between 1985 and
2010 (Todo and Takahashi 2011).
2.2. Wild coffee production and coffee certification
Coffee (Coffea arabica) is a native species that grows wild in the Belete-Gera RFPA. Because
coffee production is not economically practical at high elevations (above 2,300 m), wild coffee is
typically found in the forest at an altitude of approximately 2,000 m (indicated by the light and
dark gray areas in Fig. 1). The right to harvest each wild coffee area is granted to individual
producers in accordance with traditional agreements among villagers. The right holders
(producers) manage their coffee areas, e.g., maintaining shade trees and harvesting coffee
gradually, but they rarely apply any chemicals. Producers commonly dry the wild coffee after
harvesting it and sell it as sun-dried, shade-grown coffee to local markets, but the selling price
for this coffee has typically been fairly low (approximately 1 US dollar/kg in 2007 and 2008).
In 2006, the Japan International Cooperation Agency (JICA), a Japanese foreign aid agency,
began supporting a group of 555 coffee-producing households seeking to obtain shade coffee
certification (“forest coffee certification”) from the Rainforest Alliance. The Rainforest Alliance
is a major international non-governmental organization (NGO) based in the United States that
provides certifications for many type of products, such as coffee, tea, and bananas.
Although the Rainforest Alliance originally worked primarily with producers that owned
larger plantations (Méndez et al. 2010), it also provided the certification program—which
excludes modern industrial coffee producers—in an effort to encourage the shaded coffee system
and to encourage coffee producers to move toward greater sustainability (Mas and Dietsch 2004).
Hence, many studies defined the ecological certification provided by the Rainforest Alliance as
the shade coffee certification (Giovannucci and Ponte 2005; Mas and Dietsch 2004; Philpott et al.
2007; Philpott and Dietsch 2003). The criteria used in the program include shade criteria for tree
species richness and composition, tree height, tree density, number of strata in the canopy, and
canopy cover. The details of the certification criteria are provided in the study by Philpott et al.
(2007) and Rainforest Alliance (2009).
In 2007, two villages successfully received the certification from the NGO and obtained a
price with the certification that was 15-20% higher than the regular price. Although most
producers also produced coffee using the improved seeds at their homestead under the modern
coffee system, such coffee is, of course, strictly eliminated from the certified coffee. Once each
year, an auditor from the Rainforest Alliance visits to assess the condition of the certified area
and the surrounding forest regions. If an expansion of the forest coffee area or degradation of the
forest and biodiversity (e.g., logging of shade trees and loss of flora and fauna) is observed in the
certified area, the auditor demands the improvement of the situation. The certification would be
withdrawn if the situation is not improved in the following year.
3. Data
3.1. Remote sensing data and classification
For our analysis, we used the January 2005 and January 2010 satellite images of Landsat 7
ETM+ (path/row 170/55), with a resolution of 30 m. We used a two-step process to classify the
forest areas based on forest density.
First, we distinguished the forest areas from the non-forest areas (such as agricultural lands,
young fallow lands, rangelands, cleared areas, bare soil areas, and urban areas) by utilizing the
normalized difference vegetation index (NDVI). The NDVI is a measure of vegetation biomass
that is commonly used to identify forest degradation (Lyon et al. 1998; Mitchard and Flintrop
2013; Tucker et al. 1985). Following the studies by Southworth et al. (2004) and Takahashi and
Todo (2012), we determined a threshold value of the NDVI for the forest areas on the basis of
the information from the satellite images and fieldwork. We conducted ground-truthing to collect
locational data for 17 points on the boundaries that delineated the forest regions from the non-
forest areas that existed during the period of our study (according to interviews with several local
residents). We chose the area with the highest NDVI value for each year as the threshold value
for the forest areas.
Second, after eliminating the non-forest areas from the satellite images, we classified the
images using an unsupervised classification technique in which one of the clustering algorithms
split the images into classes based on the NDVI values. One advantage of using unsupervised
classification is that it does not require the user to have foreknowledge of the classes. We first set
the number of clusters and established the clustering criteria, such as the minimum number of
pixels per cluster and the closeness criterion. In this study, we used the following specifications:
the minimum number of pixels per cluster was 20, and the sample interval was 10 cells.
After establishing the criteria, cluster centers are randomly placed and each pixel is assigned
to the closest cluster by Euclidean distance. Then, the centroids of each cluster are recalculated.
Additionally, the established clusters are split into different clusters based on the standard
deviation of the cluster or merged if the distance between the clusters is closer. These processes
are repeated until the clustering criteria are satisfied. The unsupervised classification is
commonly used in remote sensing to classify forests (Bray et al. 2004; Mertens et al. 2000).
We classified the forest areas into five categories that represent the forest density: class 5
(i.e., the cluster with higher NDVI values) indicates a dense deep forest and class 1 (i.e., the
cluster with lower NDVI values) is a less dense forest. Because the NDVI is a measure of
vegetation biomass, scaling down of classification directly indicates the loss of biomass. Hence,
if the forest areas moved down the classification scale between 2005 and 2010, we defined such
decrement as forest degradation.
To confirm the forest condition of each classification, we conducted a ground truth survey
by using sample plots of 20 m by 20 m and collecting the following information: the number of
trees, the tree species, the tree height for each species, the number of strata of trees, and the
canopy cover. We tried to investigate the class 5 forest areas; however, we could not enter these
areas due to their rugged terrain. According to local residents, neither humans nor wild animals
can access the deep dense forest.
The description of each classification is presented in Table 1. We observed six different tree
species in the class 1 forest area with a canopy cover that ranged from 60 to 70%. Although the
number of trees in the lower classes (classes 1 and 2) was greater than in the upper ones (classes
3 and 4), the upper classes had more canopy cover than the lower ones because the upper classes
were formed by a great forest canopy with bigger trees. Approximately 85 and 90% of the class 3
and 4 forest areas was covered by forest canopy, respectively.
Additionally, name of tree species in each classification is provided in Table 2. We recorded
in total 12 tree species and all of them are indigenous forest trees. Although most of the villagers
plant exotic trees, such as Eucalyptus, around their homestead area, tree plantation is not
common in the forest area. In fact, other study conducted in the Belete-Gera RFPA by Ango et al.
(2014) found that only 2 tree species out of recorded 49 tree species were exotic trees
(Eucalyptus and Cupressus lusitanica) and they were mostly found in woodlot area, not in natural
forest area. Therefore, forest in each classification in our study is formed by the indigenous tree
species and invasion by the exotic tree is rarely happened in the study area.
Although it is important to assess the accuracy of the classification, we are not able to
estimate the accuracy statistics because of the lack of the reference data. However, this should
not cause significant problems. Even if the error existed, because same error would affect any
locational unit within the same year, the change in forest quality with and without the
certification would be over- or underestimated to the same extent. Therefore, the possible error in

the estimation from satellite images does not lead to a bias in the estimation of the impact of the
certification.
3.2. The forest coffee areas and observation grids
We selected four villages (the areas marked with a black color in Fig. 1) as the areas for our
study: two villages involved with the certification program as the treatment group and two
villages randomly selected from villages not involved with the certification program as the
control group. To identify the location of each forest coffee area, we conducted a field survey
using a global positioning system (GPS) device and collected data from all the forest coffee areas
in the villages, i.e., 240 forest coffee areas in total. Of these forest coffee areas, 148 areas were
certified in 2007.
The target forest areas were divided into square-shaped cells (30 m by 30 m). We used each
grid as an observation for the analysis. A total of 1,733 observation grids were divided into two
categories: the forest coffee areas with certification and the forest coffee areas without
certification. The observation numbers for the forest coffee areas with and without certification
are 1,141 and 592, respectively. The general characteristics of the observation grids are given in
Table 3.
4. Methods
We evaluated the impact of forest coffee certification on forest degradation using a matching
methods to reduce selection bias. Matching methods are commonly applied to estimate the causal
treatment effects by comparing outcome between treatment and control groups.
One of the common matching methods used in the evaluation study is the PSM method
(Caliendo and Kopeinig 2008). For example, Blackman and Naranjo (2012) rigorously analyzed
the environmental impacts of organic certification by using the PSM method. Usually, the
standard errors for the PSM estimation are estimated by using bootstrapping as suggested by
Lechner (2002). However, recent studies demonstrated that bootstrapped standard errors may not

be valid in the case of non-smooth, nearest neighbor matching (Abadie and Imbens 2008; Imbens
2004).
Therefore, we chose to use a covariate matching with the Mahalanobis distance metric and
the PSM estimations with different matching algorithms were used for the robustness check.
Specifically, we employed four different matching algorithms for the PSM estimations: (1)
nearest neighbor 1-to-1 matching with caliper which each certified grid is matched to the
uncertified grid with the closest propensity score; (2) nearest neighbor 1-to-4 matching with
caliper which each certified grid is matched to the four uncertified grids with the closest
propensity score and the counterfactual outcome is the average across these four; (3) nearest
neighbor 1-to-8 matching with caliper; (4) kernel matching which a weighted average of all
uncertified grids is used to estimate the counterfactual outcome. Following Bernhard et al.
(2008) and Fabling and Sanderson (2013), we used a caliper size of 0.001.
To obtain the PSM estimator of the effect of the treatment, we first used a probit model to
examine how a target area for the procurement of certification is selected. Based on the
propensity score from the probit estimation, we created a new control observation group to
ensure that the treatment group and the new control group would have similar environmental
characteristics. As mentioned, the standard error is obtained by bootstrapping in most studies
(Caliendo and Kopeinig 2008). Hence, we also used the bootstrapping standard error based on
100 replications, following Smith and Todd (2005).
To check the characteristics of the treatment group and the control group after the matching
procedure, we conducted two types of balancing tests. First, a t-test was used to compare the
mean of each covariate between the treatment and control groups after the matching procedure.
If the matching was successfully accomplished, the mean difference after matching should be
insignificant. Second, we compared the pseudo R-squared values between before and after the
matching procedure, suggested by Sianesi (2004). If the matching was successful, then the
pseudo R-squared after the matching should have a lower value than that before the matching.
In this study, we specifically examined the average effect of treatment on the treated (ATT),
as developed by Rosenbaum and Rubin (1983). In the matching estimations, we compared the

change in forest classification scales between the certified forest coffee areas and the areas
without certification that served as the control area. Following the study by Cropper et al. (1999)
and Takahashi and Todo (2013), the following variables were used as covariates in the
estimation: distance to the village, distance to the main road, average elevation, average slope, a
dummy variable for fertile soil, a dummy variable for facing south, and a dummy variable for
facing north.
The dummy variable for fertile soil includes the nitisol and fluvisol soil types, which are
suitable for crop production. The dummy variables for facing south take a value of 1 if the slope
face of a grid faces the south; this variable controls for the high likelihood of catching the sun.
Additionally, we included the dummy variable for facing north to control for the likelihood of
sunless conditions.
Although we controlled the selection bias by using the observable environmental variables,
the effects of the certification may be contaminated by unobserved factors (hidden bias). In our
case, because we do not have the village level variables, the village characteristics may be the
possible hidden bias and affect our results. To check the sensitivity of our results, we calculated
Rosenbaum bounds (Rosenbaum 2002). Rosenbaum bounds indicate how strongly unobservable
factors must influence the selection process in order to undermine the matching results.
In the case of the spillover effect of the certification, we employed the nearest neighbor 1-
to-1 matching method with caliper and compared the change in forest quality among the natural
forest areas (i.e., forest areas without forest coffee) around the forest coffee areas and natural
forest areas with similar environmental characteristics. In this study, we first created six buffer
zones from the forest coffee area boundary to 150 m by 25 m interval. Second, we created six
buffer dummy variables with a value of 1 if a grid was within the buffer. Then, we selected those
grids in the buffer zone as the treatment group and compared them with other grids outside of the
buffer. Thus, we performed six PSM estimations, using the grids in each buffer as a treatment
group, and evaluated the spillover effects by comparing the change in forest quality.
5. Results

5.1. Matching procedure
We performed probit estimations, and the majority of the variables had significant effects (Table
4). The goodness of fit can be measured by the pseudo R-squared value, and our probit
estimation showed fairly large pseudo R-squared values, such as 0.27.
Based on the propensity score from the probit estimation, we created a new control
observation group to ensure that the treatment group and the new control group would have
similar environmental characteristics. A common support condition must be implemented to
satisfy the overlap assumption. In other words, in the treatment group, we omitted observations
from the treatment group whose propensity scores were higher than the maximum score or lower
than the minimum score of the observations in the control group. The treatment effect was
calculated by comparing the average outcome for all treated observation on common support
with a weighted average of all control observations on the common support.
To check the characteristics of the treatment group and the control group after the matching
procedure, we conducted two types of balancing tests. The results of t-test showed that the
differences in all covariates became insignificant after the matching procedure, which indicates
that the characteristics of the control group were sufficiently similar after matching. Furthermore,
we found that the pseudo R-squared values drastically decreased from 0.27 to 0.01 after
matching, which indicates that the after-matching probit had no explanatory power. These
balancing tests confirmed that there was no systematic difference among the covariates used for
matching between the treatment and after-matching control groups (new control group).
5.2. Impact of the forest coffee certification
Mahalanobis matching indicated that the certified forest coffee areas conserved or slightly
increased their quality (Table 5), implying that the certified producers managed their coffee areas
in a sustainable manner.
By contrast, the forest areas without the certification suffered forest quality decline
measuring 1.61, which means that the difference between two groups is 1.75. Since our matching

estimation compared the change in forest classification scales (i.e., scale range between 0 and 5),
this result indicated that the non-certified forest coffee areas moved down the classification scale
by at least one level during the study period. One of the reasons for the drastic degradation in the
control group is transformation to the modern coffee system. The high yield of the modern coffee
system motivates non-certified producers to convert forest coffee areas to the modern system
with fewer shade trees, which results in forest degradation.
The results of the PSM estimations with different matching algorithms also showed the
similar results, indicating that the certified forest coffee areas conserved the forest quality
compared with the non-certified areas by approximately 1.86. These results suggest that our
results are robust.
Finally, we check the sensitivity of our results by calculating Rosenbaum bounds. The
amount of the hidden bias is specified as Γ. While Γ=1 is equivalent to the scenario of no-hidden
bias, Γ=1.5 indicates that hidden bias would increase the odds of obtaining the certification for
the treatment group compared to the control group by an additional 50%. In other words, large
value of Γ indicates the robustness of the existence of the certification effect, even under
unobserved elements. In this study, we calculate the critical value of Γ shown as Γ† in Table 5,
which alter the results of our statistical inference at 10% level.
The critical value of odds ratio (i.e., amount of the hidden bias) took values between 6.2 and
9.1 (Γ† row, Table 5). Although there is no-clear standard threshold value to determine the
existence of hidden bias, Apel et al. (2010) report that the estimation results in applied research
often become sensitive to Γ as small as 1.15. Therefore, we judge that our results are not
sensitive to unobserved characteristics.
In summary, obtaining the certification prevents the degradation of forest when compared
with areas without the certification. Thus, these results lead to the conclusion that the forest
coffee certification program had a significant impact on the forest degradation.
5.3. Spillover effects to the surrounding forest areas
To evaluate the spillover effect of the certification on the surrounding natural forest, we followed
the same matching procedure discussed above. We tested six PSM estimations and all of them
passed the balancing tests.
The results provided in Table 6 showed that although the quality of forest in the closest
buffer zone (such as with a range of 0 m to 25 m) slightly declined, forest degradation in the
matched control areas was larger than that of the treatment group. These results indicated that the
forest areas around the certified coffee areas preserved the forest quality compared with the
natural forest areas under same environmental conditions. Furthermore, the difference between
the treatment and control groups grows as the buffer area increased to the 25 m to 50 m range.
After 100 m distance from the forest coffee boundary, we could not find any significant
difference, which implies that the quality of forest in the treatment group is not significantly
different from the control group.
These results demonstrate that providing coffee certification did not induce the forest
degradation in the surrounding forest areas. In fact, the forest areas within a 100 m radius
showed significantly alleviated forest degradation.
6. Discussion
We applied the matching methods to evaluate the impact of a forest coffee certification program
on the forest degradation. Whereas the certified forest coffee areas slightly increased forest
density, forest coffee areas without the certification decreased in quality. Overall, the quality of
forest was preserved by 1.75 by obtaining the forest coffee certification.
Additionally, we investigated the spillover effects of the certification on the surrounding
forest areas without forest coffee. The results revealed that the forest areas within a 100 m radius
of a certified coffee boundary significantly reduced forest degradation when compared with other
forest areas under similar environmental conditions. However, such positive and significant
impact diminished after 100 m.

Our empirical results provide insights into the debate between Philpott and Dietsch (2003)
and Rappole et al. (2003a). Although Rappole et al. (2003b) noted the probability of converting
natural forest to shade coffee, Philpott and Dietsch (2003) argued that this type of degradation
can be prevented by providing financial incentives for coffee producers and establishing rigorous
certification criteria.
In the area under study, the certified producers sold their coffee at a price 15 to 20% higher
than regular coffee. Additionally, the Rainforest Alliance requests a high standard of criteria for
the certification and monitors the conditions of the certified areas once a year. We assume that
the economic incentive and rigorous certification criteria accompanied with the audit system may
motivate the certified producers to conserve their forest coffee areas.
From these results, we conclude that the forest coffee certification system had a positive
impact on preventing forest degradation in the certified areas and the surrounding forest regions.
Although we found empirical evidence to support the effectiveness of the certification system,
our current analysis could not assess which elements of the certification program have a
significant impact on preventing degradation. Therefore, further study is necessary to investigate
the mechanism by which forest quality is conserved.

References
Abadie, A., Imbens, G.W., 2008. On the failure of the bootstrap for matching estimators.
Econometrica 76, 1537-1557.
Ango, T.G., Börjeson, L., Senbeta, F., Hylander, K., 2014. Balancing ecosystem services and
disservices: Smallholder farmers’ use and management of forest and trees in an agricultural
landscape in southwestern Ethiopia. Ecol. Soc. 19, 30-46.
Apel, R., Blokland, A.A., Nieuwbeerta, P., van Schellen, M., 2010. The impact of imprisonment
on marriage and divorce: A risk set matching approach. J. Quant. Criminol. 26, 269-300.
Bernhard, S., Gartner, H., Stephan, G., 2008. Wage subsidies for needy job-seekers and their
effect on individual labour market outcomes after the German reforms, In IAB discussion
paper.
Blackman, A., Naranjo, M.A., 2012. Does eco-certification have environmental benefits?
Organic coffee in Costa Rica. Ecolog. Econ. 83, 58-66.
Blackman, A., Rivera, J., 2011. Producer-level benefits of sustainability certification. Conserv.
Biol. 25, 1176-1185.
Bray, D.B., Ellis, E.A., Armijo-Canto, N., Beck, C.T., 2004. The institutional drivers of
sustainable landscapes: A case study of the ‘Mayan Zone’in Quintana Roo, Mexico. Land
Use Policy 21, 333-346.
Buechley, E.R., Şekercioğlu, Ç.H., Atickem, A., Gebremichael, G., Ndungu, J.K., Mahamued,
B.A., Beyene, T., Mekonnen, T., Lens, L., 2015. Importance of Ethiopian shade coffee
farms for forest bird conservation. Biol. Conserv. in press.
Caliendo, M., Kopeinig, S., 2008. Some practical guidance for the implementation of propensity
score matching. J. Econ. Surveys 22, 31-72.
Cropper, M.L., Griffiths, C., Mani, M., 1999. Roads, population pressures and deforestation in
Thailand, 1976-1989. Land Econ. 75, 58-73.
Fabling, R., Sanderson, L., 2013. Exporting and firm performance: Market entry, investment and
expansion. J. Int. Econ. 89, 422-431.
Fleischer, G., Varangis, P., 2002. Toward more sustainable coffee: consumers fuel demand for
more sustainable agriculture. Agr. Technol. Notes 23.
Giovannucci, D., Ponte, S., 2005. Standards as a new form of social contract? Sustainability
initiatives in the coffee industry. Food Pol. 30, 284-301.
Greenberg, R., Bichier, P., Angon, A.C., Reitsma, R., 1997. Bird populations in shade and sun
coffee plantations in central Guatemala. Conserv. Biol. 11, 448-459.
Hosonuma, N., Herold, M., De Sy, V., De Fries, R.S., Brockhaus, M., Verchot, L., Angelsen, A.,
Romijn, E., 2012. An assessment of deforestation and forest degradation drivers in
developing countries. Environ. Res. Lett. 7, 1-12.
Hundera, K., Aerts, R., De Beenhouwer, M., Van Overtveld, K., Helsen, K., Muys, B., Honnay,
O., 2013. Both forest fragmentation and coffee cultivation negatively affect epiphytic orchid
diversity in Ethiopian moist evergreen Afromontane forests. Biol. Conserv. 159, 285-291.
Imbens, G.W., 2004. Nonparametric estimation of average treatment effects under exogeneity: A
review. Rev. Econ. Statist. 86, 4-29.
Jha, S., Bacon, C.M., Philpott, S.M., Méndez, V.E., Läderach, P., Rice, R.A., 2014. Shade
coffee: Update on a disappearing refuge for biodiversity. BioScience 64, 416-428.
Lechner, M., 2002. Some practical issues in the evaluation of heterogeneous labour market
programmes by matching methods. Journal of the Royal Statistical Society: Series A
(Statistics in Society) 165, 59-82.
Lyon, J.G., Yuan, D., Lunetta, R.S., Elvidge, C.D., 1998. A change detection experiment using
vegetation indices. Photogramm. Eng. Remote Sens. 64, 143-150.
Méndez, V.E., Bacon, C.M., Olson, M., Morris, K.S., Shattuck, A., 2010. Agrobiodiversity and
shade coffee smallholder livelihoods: A review and synthesis of ten years of research in
Central America. Prof. Geogr. 62, 357-376.
Mas, A.H., Dietsch, T.V., 2004. Linking shade coffee certification to biodiversity conservation:
Butterflies and birds in Chiapas, Mexico. Ecol. Appl. 14, 642-654.
Mayaux, P., Pekel, J.-F., Desclée, B., Donnay, F., Lupi, A., Achard, F., Clerici, M., Bodart, C.,
Brink, A., Nasi, R., 2013. State and evolution of the African rainforests between 1990 and
2010. Philosophical Transactions of the Royal Society B: Biological Sciences 368, 1-10.
Mertens, B.t., Sunderlin, W.D., Ndoye, O., Lambin, E.F., 2000. Impact of macroeconomic
change on deforestation in South Cameroon: Integration of household survey and remotely-
sensed data. World Devel. 28, 983-999.
Mitchard, E.T., Flintrop, C.M., 2013. Woody encroachment and forest degradation in sub-
Saharan Africa's woodlands and savannas 1982–2006. Philosophical Transactions of the
Royal Society B: Biological Sciences 368, 1-7.
Moguel, P., Toledo, V.M., 1999. Biodiversity conservation in traditional coffee systems of
Mexico. Conserv. Biol. 13, 11-21.
Perfecto, I., Rice, R.A., Greenberg, R., Van der Voort, M.E., 1996. Shade coffee: A disappearing
refuge for biodiversity. BioScience 46, 598-608.
Perfecto, I., Snelling, R., 1995. Biodiversity and the transformation of a tropical agroecosystem:
Ants in coffee plantations. Ecol. Appl. 5, 1084-1097.
Perfecto, I., Vandermeer, J., Mas, A., Pinto, L.S., 2005. Biodiversity, yield, and shade coffee
certification. Ecolog. Econ. 54, 435-446.
Philpott, S.M., Bichier, P., Rice, R., Greenberg, R., 2007. Field-testing ecological and economic
benefits of coffee certification programs. Conserv. Biol. 21, 975-985.
Philpott, S.M., Dietsch, T., 2003. Coffee and conservation: A global context and the value of
farmer involvement. Conserv. Biol. 17, 1844-1846.
Rainforest Alliance, 2009. Sustainable Agriculture Standard, In San José, Costa Rica:
Sustainable Agriculture Network, Rainforest Alliance.
Rappole, J.H., King, D.I., Rivera, J.H., 2003a. Coffee and conservation III: Reply to Philpott and
Dietsch. Conserv. Biol. 17, 1847-1849.
Rappole, J.H., King, D.I., Rivera, J.H.V., 2003b. Coffee and conservation. Conserv. Biol. 17,
334-336.
Rosenbaum, P.R., 2002. Observational studies. Springer.
Rosenbaum, P.R., Rubin, D.B., 1983. The central role of the propensity score in observational
studies for causal effects. Biometrika 70, 41-55.
Rueda, X., Thomas, N.E., Lambin, E.F., 2014. Eco-certification and coffee cultivation enhance
tree cover and forest connectivity in the Colombian coffee landscapes. Regional
Environmental Change, 1-9.
Sianesi, B., 2004. An evaluation of the Swedish system of active labor market programs in the
1990s. Rev. Econ. Statist. 86, 133-155.
Smith, J.A., Todd, P.E., 2005. Does matching overcome LaLonde's critique of nonexperimental
estimators? J. Econometrics 125, 305-353.
Southworth, J., Munroe, D., Nagendra, H., 2004. Land cover change and landscape
fragmentation—comparing the utility of continuous and discrete analyses for a western
Honduras region. Agric. Ecosyst. Environ. 101, 185-205.
Staver, C., Guharay, F., Monterroso, D., Muschler, R., 2001. Designing pest-suppressive
multistrata perennial crop systems: Shade-grown coffee in Central America. Agroforest.
Syst. 53, 151-170.
Tadesse, G., Zavaleta, E., Shennan, C., 2014. Coffee landscapes as refugia for native woody
biodiversity as forest loss continues in southwest Ethiopia. Biol. Conserv. 169, 384-391.
Takahashi, R., Todo, Y., 2012. Impact of Community-Based Forest Management on Forest
Protection: Evidence from an Aid-Funded Project in Ethiopia. Environmental Management
50, 396-404.
Takahashi, R., Todo, Y., 2013. The impact of a shade coffee certification program on forest
conservation: A case study from a wild coffee forest in Ethiopia. J. Environ. Manage. 130,
48-54.
Takahashi, R., Todo, Y., 2014. The impact of a shade coffee certification program on forest
conservation using remote sensing and household data. Environ. Impact Assess. Rev. 44, 76-
81.
Taylor, P.L., 2005. A fair trade approach to community forest certification? A framework for
discussion. J. Rural Stud. 21, 433-447.
Tilman, D., Fargione, J., Wolff, B., D'Antonio, C., Dobson, A., Howarth, R., Schindler, D.,
Schlesinger, W.H., Simberloff, D., Swackhamer, D., 2001. Forecasting agriculturally driven
global environmental change. Science 292, 281-284.
Todo, Y., Takahashi, R., 2011. Impact of farmer field schools on agricultural income and skills:
Evidence from an aid-funded project in rural Ethiopia. J. Int. Devel. 25, 362-381.
Tucker, C.J., Goff, T., Townshend, J., 1985. African land-cover classification using satellite data.
Science 227, 369-375.

Wunderle Jr, J.M., Latta, S.C., 1996. Avian abundance in sun and shade coffee plantations and
remnant pine forest in the Cordillera Central, Dominican Republic. Ornitol. Neotrop. 7, 19-
34.
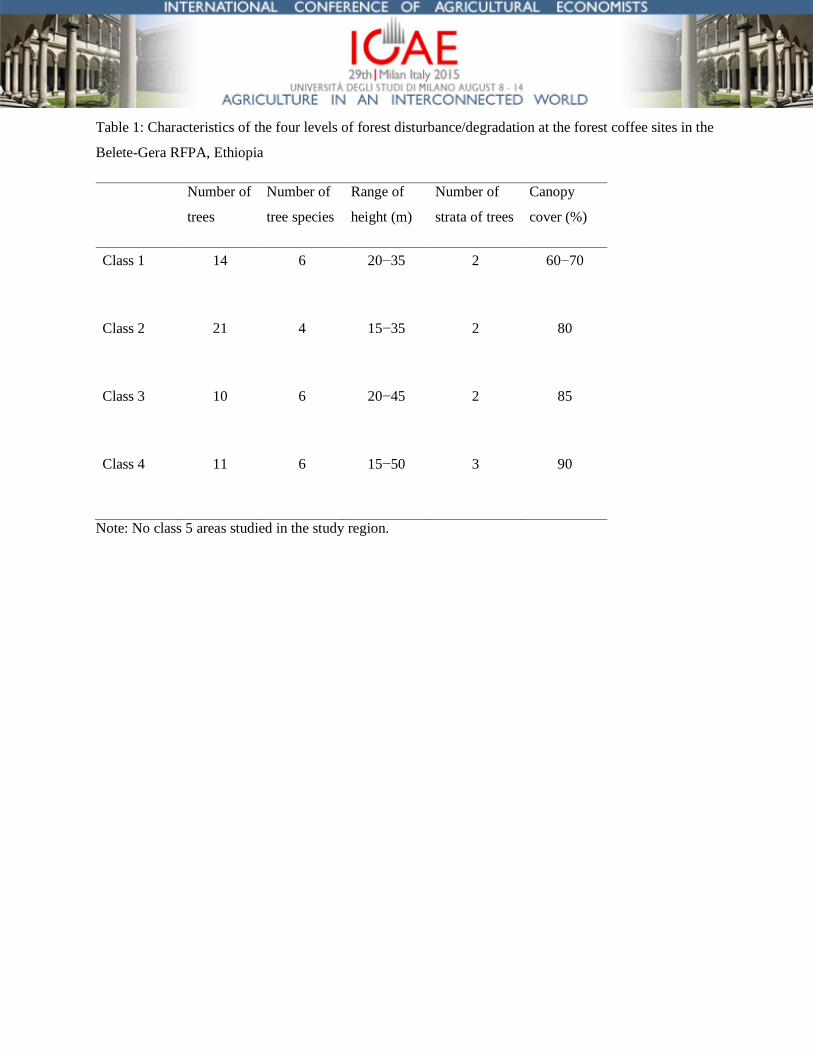
Table 1: Characteristics of the four levels of forest disturbance/degradation at the forest coffee sites in the
Belete-Gera RFPA, Ethiopia
Number of
trees
Number of
tree species
Range of
height (m)
Number of
strata of trees
Canopy
cover (%)
Class 1 14 6 20−35 2 60−70
Class 2 21 4 15−35 2 80
Class 3 10 6 20−45 2 85
Class 4 11 6 15−50 3 90
Note: No class 5 areas studied in the study region.

Table 2: The presence/absence of major tree species in forest areas under various degrees of degradation
in the Belete-Gera RFPA, Ethiopia
Class 1 Class 2 Class 3 Class 4
Syzygium guineense X X X X
Futeria − X X X
Olea welwitschii − X X X
Ficus sur X − X X
Polyscias fulva X X − −
Accacia abyssinica X − − −
Ficus vasta X − − −
Cordia africana X − − −
Millettia ferruginea − − X −
Albizia gummifera − − X −
Apodytes dimidiata − − − X
Schefflera abyssinica − − − X
Note: X indicates the presence of tree species, while – means absence of the species.

Table 3: Geographical characteristics of the studied plots in certified and non-certified forest coffee areas
in the Belete-Gera RFPA, Ethiopia
Characteristics
Forest coffee
areas with
certification
Forest coffee
areas without
certification Total
Number of plots 148 92 240
Size of forest coffee area (Are) 56.4 40.3 50.2
(107.7) (75.9) (96.9)
Number of observation grids 1,141 592 1,733
Distance to village (m) 377.7 235.4** 329.1
(417.0) (195.9) (363.4)
Distance to main road (km) 1.1 2.1** 1.5
(1.1) (1.2) (1.2)
Average elevation (m) 1,913.7 1,882.8** 1,903.2
(125.1) (96.3) (116.9)
Average slope (%) 11.9 12.2 12.0
(6.3) (5.3) (6.0)
Proportion of fertile soil over the observations (%) 98.0 97.9 97.9
Proportion of grid facing South (%) 58.3 21.1 33.8
Proportion of grid facing North (%) 0.3 3.1 2.1
Note: Numbers are means; numbers in parentheses are S.D. values. ** indicates statistically significant
differences at the p<0.01 level.

Table 4: Results from the probit estimation
Benchmark estimation
Distance to village (km) 0.971** (7.11)
Distance to main road (km) −0.556** (−13.03)
Average elevation (m) 0.004** (10.67)
Average slope (%) 0.017** (2.63)
Fertile soil dummy −0.117 (−0.32)
South dummy −0.786** (−10.27)
North dummy 1.336 (2.36)
Constant −7.467** (−8.01)
Observations 1,733 Pseudo R2 0.27
Note: Numbers in parentheses are z-statistics. ** indicates statistically significant differences at the
p<0.01 level.

Table 5: Forest quality comparison between forest coffee areas with and without certification in the Belete-
Gera RFPA, Ethiopia
Matching method
Mahalanobis
matching
Nearest
neighbor 1-1
Nearest
neighbor 1-4
Nearest
neighbor 1-8
Kernel
matching
Mean of treatment group 0.136 0.141 0.141 0.141 0.141
Mean of matched control group −1.613 −1.713 −1.724 −1.722 −1.719
Difference: ATT 1.748 1.854 1.865 1.863 1.86
Standard error 0.124 0.144 0.143 0.143 0.143
Student’s t 14.12 12.90 13.01 12.99 13.01
p−value 0.00 0.00 0.00 0.00 0.00
Rosenbaum bounds critical level
of odds ratio (Γ†) 6.2 8.8 9.0 9.1 9.1
Observations 1,184 1,184 1,184 1,184 1,184

Table 6: A comparison of forest quality between natural forest areas around the certified forest coffee plots at
various distances and other natural forest areas in the Belete-Gera RFPA, Ethiopia
Matching method
0 m – 25
m buffer
25 m – 50
m buffer
50 m – 75
m buffer
75 m - 100
m buffer
100 m -
125 m
buffer
125 m -
150 m
buffer
Mean of treatment group −0.265 −0.351 −0.437 −0.520 −0.614 −0.651
Mean of matched control group −0.531 −0.668 −0.688 −0.635 −0.693 −0.707
Difference: ATT 0.266 0.317 0.251 0.116 0.079 0.056
Standard error 0.063 0.053 0.06 0.056 0.054 0.061
Student’s t 4.24 5.96 4.20 2.07 1.45 0.93
p−value 0.00 0.00 0.00 0.04 0.15 0.35
Observations 2,880 5,508 4,794 4,668 4,572 4,048

Figure Captions
Figure 1: A map of the Belete-Gera Regional Forest Priority Area, Ethiopia, with an indication
of the studied forest coffee-growing areas
The areas shown in dark gray represent the sub-villages that produce forest coffee, and the light
gray areas are the sub-villages without forest coffee. The areas marked with a black color are the
study areas for this investigation.


![1,2, ID 1,2,3 · Kapeh : Good Coffee in the Mayan Quiché language; global certification program for sustainable coffee, cocoa and tea production) [24]. While conventional farming](https://static.documents.pub/doc/80x56/5f9e380e0a63f306f1092527/12-id-123-kapeh-good-coffee-in-the-mayan-quich-language-global-certification.jpg)
