

30
4
0.33 66 50 25
Density of water = 1000 kg/m3
1/(-2*LOG(e/(D*3.7) + 2.51/(Re*SQRT(B17+1E-300))))^2
1 L/sec = 0.72 Kg/sec
1 Kg/sec = 1.39 L/sec
f = friction factor, dimensionless (from Moody chart)
ɛ= absolute roughness of pipe wall in meters
Dh = inside diameter of pipe in mmRe =Reynolds number, dimensionless
viscosity of frash water at 7.5◦ c = 1.42 x 10^6 m2/s

1/sqrt(f)=-2*Log(Rr/3.7+2.51/Re*1/sqrt(f))
#DIV/0!#DIV/0!#DIV/0!
5.90063183892326#DIV/0!#DIV/0!#DIV/0!#DIV/0!#DIV/0!
R = DV/ζ R = Reynolds numberD = diameterv = velocityζ = kenimatic viscosity of fluid

0

Commercial steel pipe 0.046 mm


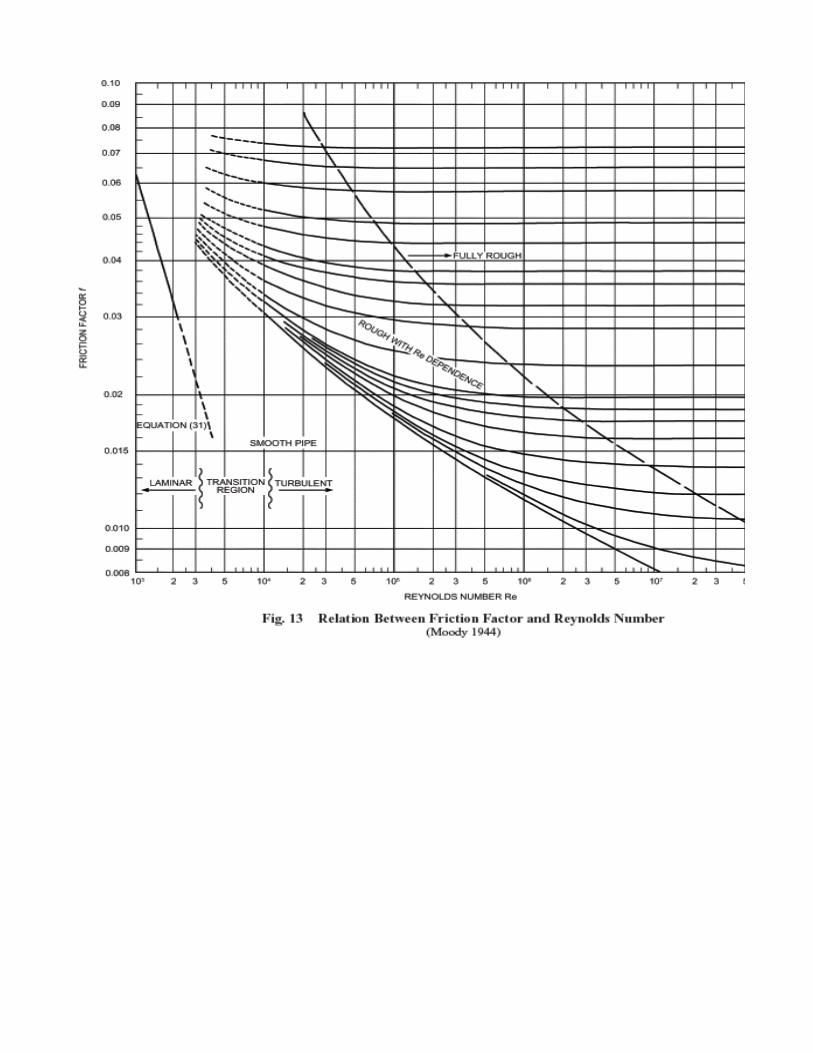

In 1944, Lewis Ferry Moody plotted the Darcy–Weisbach friction factor into Moody chart
Lewis Ferry Moody (1880–1953) was an American engineer and professor, best known for the Moody chart, a diagram capturing relationships between several variables used in calculating fluid flow through a pipe
He was the first Professor of Hydraulics in the School of Engineering at Princeton university

Lewis Ferry Moody (1880–1953) was an American engineer and professor, best known for the Moody chart, a diagram capturing relationships between several variables used in calculating fluid flow through a pipe

Lewis Ferry Moody (1880–1953) was an American engineer and professor, best known for the Moody chart, a diagram capturing relationships between several variables used in calculating fluid flow through a pipe

Book Reference : PIPING SYSTEM MANUAL by Brian silowashPage : 293


