

1
Taking Surveys with Smartphones: A Look at Usage Among College Students
Shimon Sarraf Jennifer Brooks James S Cole
Indiana University
Center for Postsecondary Research Paper presented at the 2014 Annual Conference for the American Association for Public Opinion Research, Anaheim, California.
2
Introduction
The widespread adoption of mobile technologies has dramatically impacted the landscape for
survey researchers (Buskirk & Andrus, 2012), and those focusing on college student populations are no
exception. The National Survey of Student Engagement (NSSE), one of the largest U.S. college survey
assessment projects, annually surveys hundreds of thousands of undergraduate students at college and
university campuses throughout the United States and Canada. Internal NSSE analyses show the number
of smartphone respondents is increasing each year.1 This analysis showed that in 2011, only about 4% of
NSSSE respondents used a smartphone, but by 2013 that figure had increased to 13%. Preliminary
results from the 2014 administration suggest the percentage continues to increase, with roughly 18% of
respondents using smartphones to complete the survey.
Using 2013 NSSE data, the purpose of this study is to examine college student demographics and
engagement results by smartphone respondent status. The results of this study will provide insights into
the prevalence of college‐aged survey respondents using smartphones, and the impact this technology
has on survey responses.
Background
Over the last two years, smartphone ownership has surpassed all other types of cell phones
among adults in the US. In May 2011, only 35% of adult Americans owned a smartphone but by spring of
2013, over half (56%) possessed a smartphone (Smith, 2012). Duggan and Smith (2013) note that
roughly one‐third (34%) of smartphone users primarily access the internet with their phone. Though
smartphone use is increasing, it is not the case that all American’s have equal access to smartphones. A
recent study indicates that smartphone ownership is stratified according to household income in the
adult population. However, smartphone adoption is evenly distributed among young adults (18‐29 years
old) (Smith, 2013). According to a 2013 report by the Pearson company, nearly three‐quarters (72%) of
college students own smartphones, up from just 50% in 2011, and two‐thirds report using their
smartphone for schoolwork. Hanley (2013) reported 92% of college students use smartphones to send
and receive email messages, which may particularly important for web‐administered surveys that utilize
email recruitment methods.
1 The term “smarthphone” will be used throughout to indicate those using iPhones or any type of android phone device. This category does not include those using iPads, android tablets, or other larger screen devices.

3
With the widespread adoption of smartphone usage among college students, survey researchers
now need to design the survey experience to accommodate mobile technology and respondent
behaviors, to facilitate maximum data quality. Earlier consensus on effective web survey design does not
account for the increasing prevalence of mobile respondents. Ideally, new modes of administering
surveys are tested rigorously before implementation, but the rapid consumer adoption of smartphones
means that mobile respondents are steadily increasing even though there is no consensus on optimal
design (Peytchev & Hill, 2010), especially as it relates to maintaining data quality. Assumptions are
necessarily borrowed from previous studies on survey design but researchers seek empirical evidence
that demonstrates how response quality may differ between mobile and non‐mobile respondents
(2010). Peytchev and Hill (2010) engineered several tests to assess differences in data quality for mobile
survey respondents. Randomizing response scales uncovered no bias between mobile and non‐mobile
respondents, nor did changing the order of questions. Other usability features common to mobile
respondents, such as the smaller screen size, and differing navigational tools, such as physical keyboards
or touchscreens , did adversely impact the quality of responses from mobile users (2010). For example,
when it was necessary to scroll to see all response options, mobile respondents more often chose the
first response value than did non‐mobile survey participants (2010). Findings from Stapleton (2013)
illustrate similar results; mobile respondents more often select the response that can readily be seen
even when the values of the satisfaction response scale are reversed. Stapleton also finds mobile
respondents abandon the survey more often than computer respondents, as did Maveltova in her 2013
study. Mavletova finds no significant differences in primacy effect between mobile and computer
respondents, however, nor are there differences between mobile and computer respondents when
answering difficult or sensitive questions (2013). De Bruigne and Wijnant (2013) find lower response
rate among mobile respondents, but no evidence of difference in response quality. An internal study
analyzing data from the 2011 NSSE administration examines data quality from mobile respondents in
several categories: survey drop off, item non‐response, data mismatch between institution‐reported
and student‐reported information, and a response quality indicator that aggregated three low‐quality
response criteria (Guidry, 2011). Guidry also finds higher abandonment rates in mobile users, though
the other data quality indicators assessed did not conclusively show differences between the mobile and
non‐mobile respondents (2011).
Buskirk and Andrus (2012) detail three viable options for researchers to accommodate the
likelihood that many respondents will access a web survey via smartphone. The do‐nothing approach
makes no special accommodation for mobile devices; the website simply displays as‐is on the smaller
4
screen, and the browser must scroll or navigate to view all content accordingly. Some college student
surveys such as NSSE use this approach though the exact number is unknown. Another option requires
development of a specialized app for the survey site. This approach is particularly effective at sizing
images and survey content to a smaller‐sized screen, but may be cost‐prohibitive because multiple
applications (“apps”) must be developed for different operating systems. The app approach can also
create a slower rate of advancement through the survey because each web page loads independently,
which may frustrate users. A third option discussed mimics the appearance of an app approach, but
utilizes programming options (e.g., server side scripting and Java Script) to enable a quicker load time for
web pages. The web pages advance more quickly and appear more responsive than a non‐mobile
optimized version. This approach requires staff with sufficient programming skills, however, and can be
compromised if a potential respondent has disabled JavaScript on their phone. Each of these
approaches offer benefits, but none resolve all issues encountered by survey researchers. Among
surveys aimed at college students it is currently unknown how many use the second and third approach.
Buskirk and Andrus (2012) conclude there is no singular “right approach”. Thus, as Peytchev and Hill
(2010) suggest, the best method of mobile optimization seems to be dependent upon the research
project and the sample composition. Survey length, question types and response options may also
influence a survey researcher’s perspective on the costs and benefits of the various approaches.
This paper details smartphone use among NSSE respondents, specifically examining the following
questions:
1) Are there differences in respondent characteristics between smartphone and computer
respondents? By smartphone type (Android OS/iPhone) as well?
2) Are there differences between smartphone and computer respondents in terms of a)
completion rates, b) missing survey items and c) survey measures?
Method
Data source
Data for this study came from more than 330,000 first‐year and senior students enrolled at 568
baccalaureate‐level colleges and universities from across the United States that completed the 2013
National Survey of Student Engagement (NSSE). NSSE is an annual survey that is administered online and

5
takes about 15 minutes to complete. The online survey with more than 100 survey items are presented
using four screens. The results provide data to colleges and universities to assess and improve
undergraduate education, inform quality assurance and accreditation efforts, and to facilitate national
and sector benchmarking. Since its launch in 2000, more than 4.5 million undergraduate students
enrolled at more than 1,500 four‐year colleges and universities in the US and Canada have participated
in NSSE. Participating institutions generally mirror the national distribution of the 2010 Basic Carnegie
Classification. Of the 568 institutions included in this study, 38% were public, 62% private, 36% offered a
bachelor’s degree as their highest degree, 44% offered master’s degree, and 20% offered doctorate
degrees. The average institutional response rate in 2013 was 30%. The highest response rate among U.S.
institutions was 80%, and 45% of institutions achieved a response rate of at least 30%. NSSE uses RR6
when calculating institution‐level response rates (American Association for Public Opinion Research,
2011). For this study a survey “completer” is someone that did not break‐off from the survey prior to the
fourth (final) screen and provided at least one data point on the fourth screen. A “partial completer” is
someone that started the survey, but broke off prior to answering any questions on the fourth screen.
Variables
To determine the frequency of smartphone usage by respondents when completing the survey,
respondents were categorized into mutually exclusive groups based on the type of operating system or
device type used. These categories included those that completed the survey using a desktop/laptop
computer (Mac or PC), iPhone, Android phone, or a tablet/iPad. For this study, “smartphone” included
the use of either an iPhone or Android phone. Mac/PC users are collectively referred to as “computer”
users. Figures 1 through 3 below show the typical view of the NSSE survey from a desktop computer and
a smartphone.

6
Figure 1. Typical desktop view of NSSE survey.
Figure 2. Typical smartphone view of NSSE survey (Samsung Galaxy S3).
2.78”
5.38” 2.
78”
5.38”
7
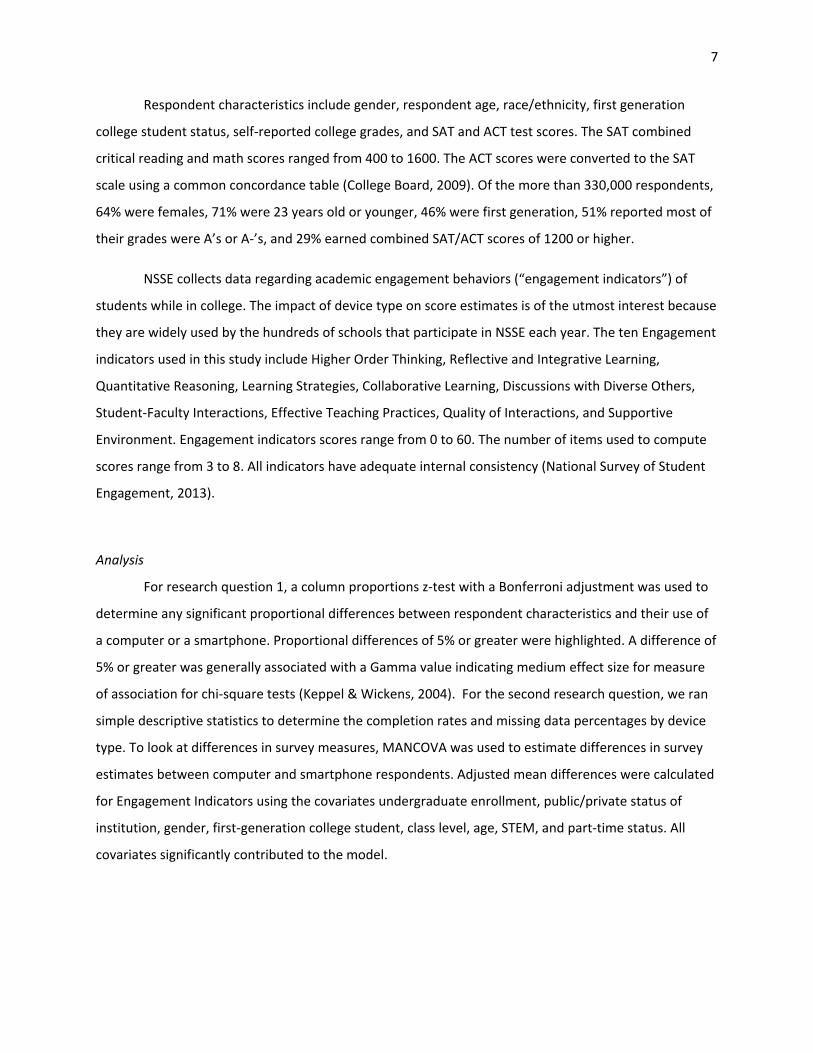
Respondent characteristics include gender, respondent age, race/ethnicity, first generation
college student status, self‐reported college grades, and SAT and ACT test scores. The SAT combined
critical reading and math scores ranged from 400 to 1600. The ACT scores were converted to the SAT
scale using a common concordance table (College Board, 2009). Of the more than 330,000 respondents,
64% were females, 71% were 23 years old or younger, 46% were first generation, 51% reported most of
their grades were A’s or A‐’s, and 29% earned combined SAT/ACT scores of 1200 or higher.
NSSE collects data regarding academic engagement behaviors (“engagement indicators”) of
students while in college. The impact of device type on score estimates is of the utmost interest because
they are widely used by the hundreds of schools that participate in NSSE each year. The ten Engagement
indicators used in this study include Higher Order Thinking, Reflective and Integrative Learning,
Quantitative Reasoning, Learning Strategies, Collaborative Learning, Discussions with Diverse Others,
Student‐Faculty Interactions, Effective Teaching Practices, Quality of Interactions, and Supportive
Environment. Engagement indicators scores range from 0 to 60. The number of items used to compute
scores range from 3 to 8. All indicators have adequate internal consistency (National Survey of Student
Engagement, 2013).
Analysis
For research question 1, a column proportions z‐test with a Bonferroni adjustment was used to
determine any significant proportional differences between respondent characteristics and their use of
a computer or a smartphone. Proportional differences of 5% or greater were highlighted. A difference of
5% or greater was generally associated with a Gamma value indicating medium effect size for measure
of association for chi‐square tests (Keppel & Wickens, 2004). For the second research question, we ran
simple descriptive statistics to determine the completion rates and missing data percentages by device
type. To look at differences in survey measures, MANCOVA was used to estimate differences in survey
estimates between computer and smartphone respondents. Adjusted mean differences were calculated
for Engagement Indicators using the covariates undergraduate enrollment, public/private status of
institution, gender, first‐generation college student, class level, age, STEM, and part‐time status. All
covariates significantly contributed to the model.

8
Results
As indicated in Table 1, close to 84% of the respondents completed the survey using a Mac or PC
computer, approximately 10% used an iPhone, and about 3% each used an Android or Tablet device.
Internal analysis of NSSE data from previous years indicates that the proportion of respondents using a
handheld device to complete the survey is increasing each year (4% in 2011 to about 18% in 2014).
Table 1. Response by device type.
Device Percent Count
Computer 83.8% 277,931
Android OS 3.2% 10,441
iPhone 9.8% 32,587
Tablet/iPad 3.2% 10,728
100.0% 331,687
Differences in respondent characteristics between computer respondents and other device
types are highlighted in Table 2. As often the case, females were more likely to respondent to the survey
compared to males. However, there were some significant proportional gender differences. The
proportion of males using an Android device (39%) compared to male computer users (36%) was
significantly higher and the proportion of females using an iPhone (66%) was significantly higher
compared to female computer users (64%). Though these differences were significant, they were
relatively small and never exceeded 3%. The proportion of first‐generation college students using an
Android phone to complete the survey (56%) was not only significantly higher than first generation using
a computer (46%), but also the difference exceeded 10%. Other important significant differences were
also found with SAT/ACT scores with those using a smartphone device generating scores lower on the
SAT/ACT exams compared to those that used a computer to complete the survey. Not surprisingly then,
smartphone users were significantly less likely to report earning moistly A’s in college. In addition,
iPhone users were significantly more likely to be 19 or younger compared to computer users (38% vs
33%), whereas Android users were significantly less likely to be 19 or younger (27% vs 33%). There were
few significant differences that exceeded 5% with regard to race/ethnicity with the exception that

9
Black/African American respondents were more likely to use an Android device (15% vs 10%) and White
respondents were less likely to use an Android device (64% vs 72%) or tablet (67% vs 72%).
Completions rates varied between device types (Figure 3). Approximately 84% of those that
started the survey on a desktop computer provided data up through screen 4 of the survey. Conversely,
about 16% of computer users broke‐off from the survey prior to reaching the final screen. By
comparison, significantly more iPhone (39%) and Android users (32%) broke‐off prior to the final screen
of the survey. There was no significant difference in completion rate between Tablet and desktop users.
Item missing results (Figure 4) mirror the results from Figure 3. Computer users had the lowest
rate of missing data, followed by Android users and then iPhone users.

10
Table 2. Comparing computer respondent characteristics to users of other device types.
Smartphone
Computer
(%)
Smartphone
(%)
Android
OS (%)
iPhone
(%)
Tablet/iPad
(%)
Gender Female 64 65 61 66 65~
Male 36 35 39 34 35~
First Generation Yes 46 48 56 45~ 49
SAT/ACT Scores 1000 or lower 30 37 39 36 38
1001 to 1200 39 41 37 42 39~
1201 to 1600 31 23 24 22 23
Age 19 or younger 33 35 27 38 27
20‐23 38 40 36 41 39~
24‐29 10 14 17 12 14
30 or older 18 11 19 10 19
Self‐Reported A or A‐ 52 46 44 47 49
Grades B or B+ 36 39 39 39 38
B‐ or lower 12 15 17 14 13
Race/Ethnicity Asian 6 6 5 6~ 7~
Black/Afr. Am 10 10~ 15 8 10~
Latino 9 12 14 11 13
White 72 71 64 73 67
1. Unless otherwise noted (~), all differences between computer and smartphone categories are statistically significant using
column proportions z‐test with Bonferroni adjustment.
2. Shaded cells indicate significantly different with proportional differences between computer and smartphone categories
equal to or greater than 5%

11
Figure 3. Survey completion by device type.
Figure 4. Item missing by device type.
84%
62%68%
61%
83%
0%
20%
40%
60%
80%
100%
Computer Smartphone Android OS iPhone Tablet
0%
10%
20%
30%
40%
askquest
attendart
CLstudy
RIintegrate
RIownview
RIconnect
SFdiscuss
HOapply
HOform
ETexam
ple
QRconclude
wrshort
DDrace
DDpolitical
LSsummary
leader
research
QIstuden
tQIstaff
SEacadem
icSEsocial
SEactivities
tmcocurr
tmservice
tmcommute
pgspeak
pgw
ork
pgdiverse
evalexp
fulltim
eMAJnum
edaspire
age
greek
veteran
NSSE Survey Items(listed in survey order from left to right)
Computer
Smartphone
iPhone
Android OS
Smartphone
12
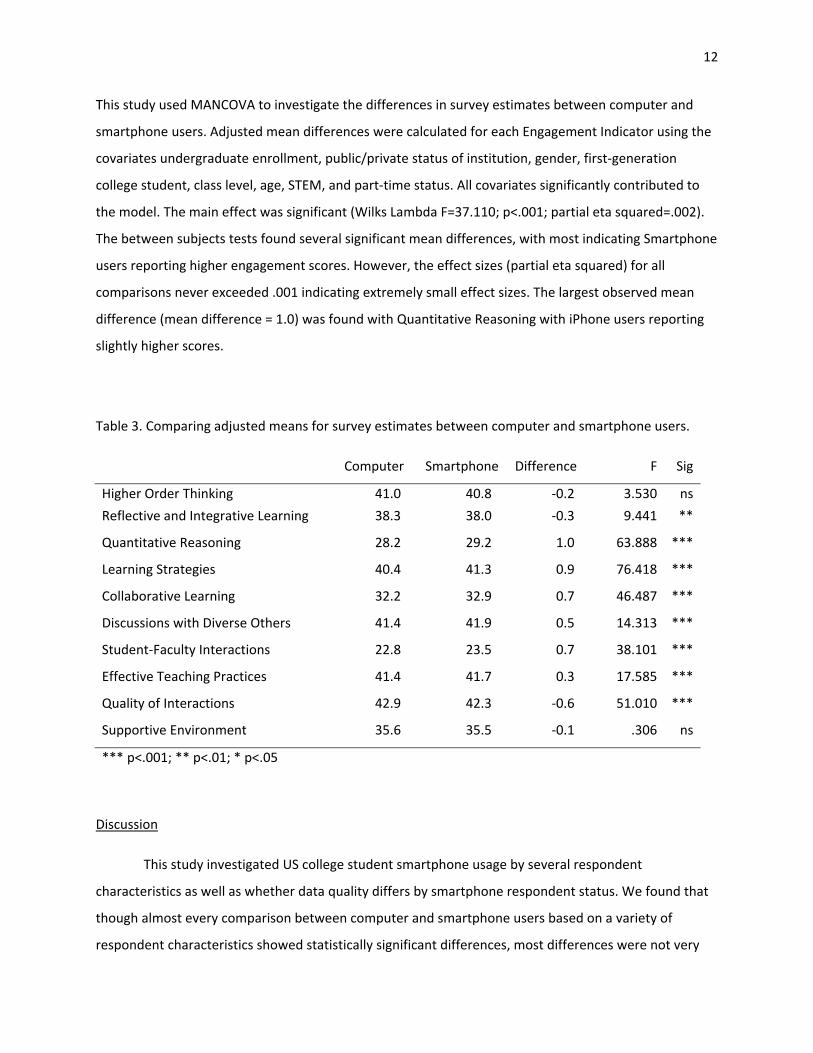
This study used MANCOVA to investigate the differences in survey estimates between computer and
smartphone users. Adjusted mean differences were calculated for each Engagement Indicator using the
covariates undergraduate enrollment, public/private status of institution, gender, first‐generation
college student, class level, age, STEM, and part‐time status. All covariates significantly contributed to
the model. The main effect was significant (Wilks Lambda F=37.110; p<.001; partial eta squared=.002).
The between subjects tests found several significant mean differences, with most indicating Smartphone
users reporting higher engagement scores. However, the effect sizes (partial eta squared) for all
comparisons never exceeded .001 indicating extremely small effect sizes. The largest observed mean
difference (mean difference = 1.0) was found with Quantitative Reasoning with iPhone users reporting
slightly higher scores.
Table 3. Comparing adjusted means for survey estimates between computer and smartphone users.
Computer Smartphone Difference F Sig
Higher Order Thinking 41.0 40.8 ‐0.2 3.530 ns
Reflective and Integrative Learning 38.3 38.0 ‐0.3 9.441 **
Quantitative Reasoning 28.2 29.2 1.0 63.888 ***
Learning Strategies 40.4 41.3 0.9 76.418 ***
Collaborative Learning 32.2 32.9 0.7 46.487 ***
Discussions with Diverse Others 41.4 41.9 0.5 14.313 ***
Student‐Faculty Interactions 22.8 23.5 0.7 38.101 ***
Effective Teaching Practices 41.4 41.7 0.3 17.585 ***
Quality of Interactions 42.9 42.3 ‐0.6 51.010 ***
Supportive Environment 35.6 35.5 ‐0.1 .306 ns
*** p<.001; ** p<.01; * p<.05
Discussion
This study investigated US college student smartphone usage by several respondent
characteristics as well as whether data quality differs by smartphone respondent status. We found that
though almost every comparison between computer and smartphone users based on a variety of
respondent characteristics showed statistically significant differences, most differences were not very

13
meaningful. Using a liberal 5‐percentage‐point difference criterion for what constitutes a meaningful
difference, some patterns did emerge, however, that showed smartphone respondents to have a
greater likelihood of reporting lower college grades, being older, and scoring lower on standardized test
scores. Looking at these same characteristics by Android‐iPhone status, we found more meaningful
differences between Android OS and computer users than between iPhone and computer users.
Android OS users were more likely than computer users to be first‐generation college students, have
lower standardized test scores, report lower college grades, and be a traditionally underrepresented
minority student.
To our knowledge, this is the first study to answer research questions regarding smartphone
usage by different college student populations, and therefore we have no basis from which to compare
and contrast our findings. Regardless, we do find it very interesting that smartphone users, especially
Android OS users, are more likely to have weaker academic achievement backgrounds than computer
users, and in the case of Android OS users are more likely to be minorities and first‐generation college
students. We speculate that these results reflect a slight preference by certain student groups to forgo
owning a computer in favor of a smartphone and/or attend under resourced institutions that do not
invest as heavily as others in information technology and computer labs, thus “forcing” students to use
their smartphones to complete campus surveys. It is also worth noting that these NSSE smartphone
results are largely driven by iPhone respondents outnumbering Android OS respondents 3 to 1, which is
the rationale for disaggregating results by smartphone type. iPhone domination of the college student
smartphone market may change over the coming years, and any significant shift in purchase decisions
may have a notable impact on the current results.
In terms of data quality differences, we found smartphone users to be distinct from computer
users in terms of completion rates and missing data for survey items but not in terms of actual survey
responses. Similar to the mobile respondent findings of Mavletova (2013) and Stapleton (2013),
smartphone respondents were less likely to complete NSSE, though tablet users completed at about the
same rate as computer users. Android OS users completed at a higher rate than iPhone users but still
noticeably lower than computer users. Unsurprisingly, missing survey item percentages across the
survey were dramatically different as well, showing much less missing data for computer users across
the last two thirds of the survey. iPhone users also had significantly more missing data than Android OS
users. Using five NSSE Engagement Indicators, we found many statistically significant difference
between computer and smartphone users, holding several institution and student characteristics

14
constant, but effect sizes indicate the differences are not meaningfully different. Other studies have
come to similar conclusions (Peytchev & Hill 2010; Mavletova 2013; and DeBruigne & Wijnant 2013).
From the perspective of staff involved with implementing the NSSE project, knowing that survey
population estimates will not likely change because of increasing smartphone usage provides a measure
of confidence.
These completion and missing data findings confirm our general expectation regarding the
willingness of smartphone respondents to complete a rather long survey that has not been optimized
for a small screen device. In fact, we find it surprising that tens of thousands of college students are
willing to use a smartphone to complete NSSE each year. Given these results, careful attention must be
paid to the amount of missing data emanating from smartphone respondents. As the proportion of NSSE
respondents using a smartphone has more than doubled over the past several years, along with the
prospect of this trend continuing for the foreseeable future, NSSE and possibly other long college
surveys should develop ways to mitigate the data loss. Obviously, the next major question to be
answered is how to go about doing this given the instrument’s length. The field has yet to define a best
practice for handling long surveys on smartphones (with general wisdom being to shorten the survey
first), so it would behoove projects such as NSSE to begin experimenting with optimization techniques.
Whether optimizing NSSE for a smartphone will alleviate these data quality issues has yet to be
determined. The missing data results showing the increasing gap between computers and smartphones
as one moves across the survey suggests that the longer the survey, the more important optimization
becomes. This makes intuitive sense as respondents would likely become more tired of “pinching” and
“zooming” to see all survey items and their responses as they move further and further towards a
survey’s final submission.
Given the completion results for tablet respondents, we conclude that there is not much
difference in their survey taking experience relative to computer respondents. Even with an
unoptimized instrument like NSSE, the smaller screen of a tablet does not appear to impact the ease
with which students can complete a longer instrument. Tablets are still a relatively small proportion of
the devices being used by college students, making up only 3% of all NSSE respondents. Though unlikely,
if tablets were to supplant smartphones as the up and coming device of choice, investment in mobile
optimization would likely be unwarranted.
Another lingering question based on these results is why Android OS respondents complete
NSSE at a noticeably higher rate and show less missing data than iPhone respondent’s show. Could this
15
be driven by the fact that the users of the two types of devices differ by certain characteristics such as
standardized test scores and first generation college student status? Or, are the differences the result of
technical issues? We do not know for sure at this time but this is an interesting research question that
could be addressed with focus groups and/or a close inspection of the actual respondent experience on
both types of devices.
This study represents an initial investigation to better understand smartphone respondents
from one prominent college student survey. A better understanding of college student behaviors as it
relates to smartphone usage should assist not only survey developers at post‐secondary institutions but
also other public opinion researchers since college students are very often the harbinger of future
trends across other markets and sub‐populations.
References
The American Association for Public Opinion Research (2011). Standard Definitions: Final Dispositions of
Case Codes and Outcome Rates for Surveys. 7th edition. AAPOR: Washington, DC.
Buskirk, T. D., & Andrus, C. (2012). Smart surveys for smart phones: Exploring various approaches for
conducing online mobile surveys via smartphones. Survey Practice, 5. Available at:
<http://36.22.354a.static.theplanet.com/index.php/SurveyPractice/article/view/63>. Date
accessed: May 12, 2014.
College Board. (2009). SAT–ACT Concordance Tables. Available at:
http://www.professionals.collegeboard.com /data‐reportsresearch/sat/sat‐act. Date accessed:
May 1, 2014.
Duggan, M., & Smith, A. (2013). Cell Internet Use 2013. Pew Research Center, Washington D.C. Available
at: http://pewinternet.org/Reports/2013/Cell‐Internet.aspx. Date accessed: March 28, 2014.
Hanley, M. (2013). College Student Smartphone Usage Hits 74%; Tablet Ownership at 30%. Available at:
http://th‐ebooks.s3.amazonaws.com/Hanley_Ball_State_College_Student_Cell_Phone_Study_
Summary_February%202013.pdf. Date accessed May 1, 2014.
Keppel, G., & Wickens, T. D. (2004). Design and analysis: A researcher’s handbook. Upper Saddle River,
NJ: Pearson Prentice Hall.

16
Mavletova, A. (2103). Data quality in PC and mobile Web surveys. Social Science Computer Review, 31,
725‐743.
National Survey of Student Engagement (2013). NSSE 2013 Engagement Indicators. Center for
Postsecondary Research, Indiana University. Available at:
http://nsse.iub.edu/2013_institutional_report/pdf/EI%20Intercorrelations%202013.pdf. Date
accessed: April 25. 2014.
Pearson. (2013). Student Mobile Device Survey 2013: National Report on College Students. Available at:
http://www.pearsoned.com/wp‐content/uploads/Pearson‐Student‐Mobile‐Device‐Survey‐2013‐
National‐Report‐on‐College‐Students‐public‐release.pdf. Date accessed: March 28, 2014.
Peytchev, A, & Hill, C. (2010). Experiments in mobile web survey Design: Similarities to other Modes and
Unique Considerations. Social Science Computer Review, 28, 319‐335.
Smith, A. (2012). Cell Internet Use 2012. Pew Research Center, Washington D.C. Available at:
http://pewinternet.org/Reports/2012/Cell‐Internet‐Use‐2012.aspx. Date accessed: March 28,
2014.
Smith, A. (2013). Smartphone Ownership 2013. Pew Research Center, Washington D.C. Available at:
http://www.pewinternet.org/Reports/2013/Smartphone‐Ownership‐2013.aspx. Date accessed
on March 28, 2014.
Smith, A, Rainie, L., & Zickuhr, K. (2011). College Students and Technology. Pew Research Center,
Washington D.C. Available at: http://www.pewinternet.org/2011/07/19/college‐students‐and‐
technology. Date accessed: April 17, 2014.
Stapleton, C. (2013). The Smart(Phone) way to college survey data. Survey Practice. 6 (2). Available at:
http://surveypractice.org/index.php/SurveyPractice/article/view/75/html. Date accessed:
March 28, 2014.


