

Comparative Performance Studies on Biomethane
Production from Biodegradable Wastes and
Cattle Manure Based on Inoculums Source
Department of Advanced Mechanical System Engineering, Graduate School of Science and Technology, Kumamoto
University, 2-39-1 Kurokami, Kumamoto 860-8555 Japan
Email: [email protected]
Abstract—Cattle manure (CM) is an excellent raw material
for anaerobic co-digestion of organic wastes with low
carbon content can improve the fermentation stability.
Several comparative assays were conducted on the
anaerobic co-digestion of cattle manure (CM) with three
organic wastes (ORs), namely, cafeteria waste (CW),
vegetable waste (VW) and fruit waste (FW), under different
mixing ratios in absence and presence of inoculum. All
digesters were implemented simultaneously under
mesophilic temperature at (30 ±2 °C) with a total solid
concentration of 8 to 15%. Result showed that the
combination of CM with CW, VW or FW significantly
improved biogas production at all ratios. The ratios
CW:CM (50:50), VW:CM (50:50), and FW:CM (25:75)
produced the highest biogas yields from different co-
substrates (20585, 16037 and 16624 mL, respectively) after
45 days of fermentation. The highest average methane yields
of CW:CM (50:50), VW:CM (50:50), and FW:CM (25:75)
were 63%, 61.2%, and 61.3% which showed that 1.0, 1.03
and 1.02 times higher than that of CW:CM (50:50),
VW:CM (50:50), and FW:CM (25:75) without inoculum,
respectively. In this study, compared effects of inoculum in
digestion of cattle manure and organic wastes treatments,
biogas was generated slightly higher than without
inoculums digestion. This result was caused by the high
methanogenic bacteria content in co-digestion medium,
which enhanced biodegradation.
Index Terms—anaerobic co-digestion, methane, inoculums,
cattle manure (CM), organic wastes (ORs).
I. INTRODUCTION
The industrialization process and the current
population growth have had an immense impact on the
energy and environment. The demands on petroleum-
based fuels are clear evidence of the increase on natural
resources. The dependence on fossil fuels as primary
energy source has led to global climate change,
environmental degradation, and human health problems.
80% of the world’s energy consumption still originates
from combusting fossil fuels [1]. Yet the reserves are
limited; means do not match with the fast population
growth, and their burning substantially increases the
Manscript received December 1, 2014; revised March 2, 2015.
greenhouse gas (GHG) concentrations that contributed
for global warming and climate change [2].
Conventionally, methane is one of the main GHG, by-
product of municipal wastes and livestock based
activities. Methane has an atmospheric life time of about
12 years and substantially contributes to stronger GHG
effect in comparison with CO2. Using a hundred year
time horizon the greenhouse effect of 1 kg methane is 23
times stronger than of 1 kg of CO2 [3]. So, bio-energy
(energy production from biomass) can be seen as one of
the key options. Among the many bio-energy related
processes being developed, latter 20th
century, anaerobic
digestion (AD) gained popularity as a solution to
environmental and energy concerns. AD embraces the
concept of sustainability and proximity. Twenty years
ago the process was mainly used for treatment of
wastewater sludge. It is a complex bioconversion process
(the use of microorganisms that degrade the material in
the absence of oxygen) that can produce abundant
benefits for treating organic wastes. However, anaerobic
digestion of organic wastes to produce energy in the form
of biogas is, arguably, the most likely option to be
obstacle in utilization of lignocellulosic content and the
subsequent low methane yield [4], provided that the
economics were favourable. Therefore, more recently the
farming sector, particularly in Asia and Europe embraced
biogas technology co-digesting farm wastes with some
imported feedstocks [5]–[7]. Co-digestion of organic
wastes and animal manures could achieve a nutrient-
balance and increase specific methane yield. Increasing
number of studies for co-digestion of organic wastes and
animal manures were focused on pretreatment, optimal
parameters, and evaluation of methane production in
batch mode [8]-[12]. Fruit and vegetable waste (FVW)
has also been evaluated as a digester feed-stock by a
number of workers [13], [14] with a methane production
of 0.37 m3/kg VS being reported [13]. However, it has
been suggested that the nitrogen and phosphorus in FVW
can be low and this is one reason why it has also been
used in co-digestions with other wastes, for example,
chicken manure [15]. Previously, a series of batch (1 L)
co-digestions were used as screening trials to determine
which wastes could best be used with cattle slurry (CS).
These showed that chicken manure, fish offal and FVW
Journal of Advanced Agricultural Technologies Vol. 2, No. 1, June 2015
50© 2015 Journal of Advanced Agricultural Technologiesdoi: 10.12720/joaat.2.1.50-56
Muhammad Rashed Al Mamun and Shuichi Torii
were the most promising [16]. Food wastes also a
desirable material to co-digest with dairy manure because
of its high biodegradability [17]-[19]. Study on the biogas
production potential of unscreened dairy manure and
different mixtures of unscreened dairy manure and food
waste using batch digesters at 35 °C showed that the
methane yield of unscreened manure and two mixtures of
unscreened manure and food waste (68/32 and 52/48),
after 30 days of digestion, was 241, 282 and 311 L/kg VS,
respectively [20].
This study was initiated to investigate the effectiveness
of inoculums for biogas production from the organic
wastes (ORs) namely cafeteria waste (CW), vegetable
waste (VW) and fruit waste (FW) with cattle manure
(CM) and the aims of the present research work were to
determine the optimal conditions for improved
production of biogas using co-digestion of cattle manure
and organic wastes and also identify the key parameters
influencing the increase of biogas and methane yield
based on inoculums source.
II. MATERIALS AND METHOD
A. Sample Collection and Preparation
Three organic solid wastes (Cafeteria, vegetable and
fruit) were collected August 2014. Cafeteria waste was
collected from the cafeteria of Graduate School of
Science and Technology at Kumamoto University, Japan.
Cafeteria food waste contained non degradable impurities
such as bones, eggshell, wastepaper, pineapple shell and
plastics were removed manually after sampling. Raw
vegetables and fruits wastes also separated from cafe
food wastes. The vegetable and fruit waste were collected
from Kokai vegetable market, Kumamoto, Japan. The
waste was sampled on three consecutive days by
manually collecting and placing the wastes in sealed
plastic bags. The cafeteria food waste was reported to be
rice, cooking beef, pork, potato, mushroom, chicken, corn,
pasta, ramen, udon, soba, nodules, fish, ham, and other
cooked vegetables. The vegetable waste consisted of
melon rinds, capsicum, cucumbers, onions, radish,
cauliflower, cabbage, potato, tomato, carrot, pumpkin and
leaf vegetables. And fruit wastes are apple, nashi, khaki,
banana, kiwi, malta and avogadro. Fresh cattle manure
(CM) was collected from dairy farm, Fukuoka, Japan. In
these sites there are special feeds and normal grazing
cattle. The special feeds are provided with special type of
feeding includes silage, concentrate, and hay forage,
agricultural residues and different grass types, byproducts.
On the other hand, normal grazers are not provided with
special type of feeding program rather they graze grasses
in the field and get only fodder and agricultural residues.
Finally the CM from both types of cattle (special and
normal grazers) was sorted separately on plastic
containers. The cattle manure was sorted manually to
prevent the inclusion of unwanted and possibly
contaminant materials (such as straw, grass, stone etc.).
Cattle manure from special feeds and normal grazers
were mixed by weighing equal amount from each source.
All collected feedstock were blended using mechanical
blender to an average particle size of 2 mm and kept in a
refrigerator at 4 °C. The blended cattle manure and
organic wastes were mixed separately with water in 1:5
(solid waste: water) volume ratio, in order to maintain the
total solid in the digester between 8 to 15%, which is the
desired value for wet anaerobic digestion. The properties
of feedstock slurries used in the experiment are given in
Table I.
TABLE I. PROPERTIES OF CAFETERIA WASTE, VEGETABLE WASTE AND
FRUIT WASTE USED IN THE EXPERIMENTS
Parameters Cafeteria waste
(CW)
Vegetable waste
(VW)
Fruit waste
(FW)
Cattle manure
(CM)
pH 5.7 5.5 4.8 6.8
Total solids (%, wb)
13.7 11.5 14.8 20.33
Volatile solids
(% of TS, db)
93 92.57 95.4 75.47
Moisture content
(%, wb)
86.3 88.5 85.2 79.67
B. Inoculum Preparation
Due to the presence of higher methanogenic bacteria in
the anaerobic sludge taken from the bottom settlement of
previous mesophilic anaerobic digester in thermal
laboratory, Kumamoto University was used as inoculum.
The digester was a 0.2 m3 polypropylene tank fed with
solid organic wastes. The sludge was kept in air-tight
buckets under ambient conditions (about 25 ℃) after
sampling. In five flasks the digestion inoculums effect
tests, the feedstock and inoculum were loaded into the
batch system at a feedstock/inoculums (F/I) ratio of 0.5.
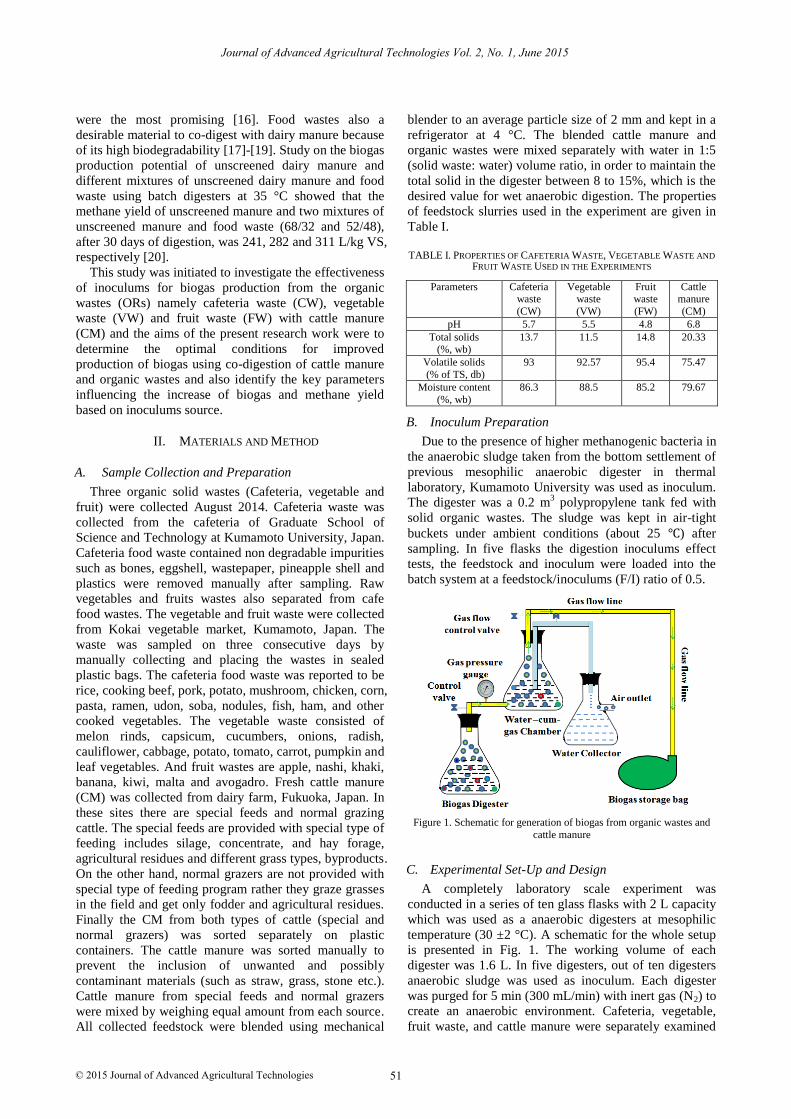
Figure 1. Schematic for generation of biogas from organic wastes and
cattle manure
C. Experimental Set-Up and Design
A completely laboratory scale experiment was
conducted in a series of ten glass flasks with 2 L capacity
which was used as a anaerobic digesters at mesophilic
temperature (30 ±2 °C). A schematic for the whole setup
is presented in Fig. 1. The working volume of each
digester was 1.6 L. In five digesters, out of ten digesters
anaerobic sludge was used as inoculum. Each digester
was purged for 5 min (300 mL/min) with inert gas (N2) to
create an anaerobic environment. Cafeteria, vegetable,
fruit waste, and cattle manure were separately examined
Journal of Advanced Agricultural Technologies Vol. 2, No. 1, June 2015
51© 2015 Journal of Advanced Agricultural Technologies

in absence and presence of inoculum using co-digestion
process. In co-digestion, the amount of organic wastes as
well as that of cattle manure in each digester was varied
when it was added. The CW:CM, VW:CM and FW:CM
ratios of digestion were 0:100, 25:75, 50:50, 75:25 and
100:0 respectively in both conditions. To determine the
performance of co-digestion, the co-digestion of cafeteria,
vegetable, food waste, with cattle manure was compared
in absence and presence of inoculum. In addition, to
provide mixing of the digester contents, all digesters were
shaken manually for about 1 minute once a day prior to
measurement of biogas volume.
D. Data Measurements for Analysis
Biogas production from the digester was measured at
daily basis using water displacement method. Gas
composition was analyzed off line by gas
chromatography (GC-8AIT / C-R8A SHIMADZU
Corporation, JAPAN). The gas chromatograph was fitted
with a Porapak N 80/100, 274 cm, 1/8 mesh
250×250×145 mm column, a molecular sieve (Mole sieve
5 A 60/80, 182 cm, 1/8), column oven maximum
temperature 399 °C , temperature stability ±0.1 °C a
stainless-steel column and a thermal conductivity
detector. Detector type was TCD made by Tungsten
rhenium filament. Maximum temperature and sensitivity
of the detector was 400 °C and 7000 [mVmL /mg]
respectively. Argon (Ar) was used as the carrier gas at a
flow rate of 30 mL/min. The column temperature was
60oC and the injector temperature was 80 ℃, with current
60 [mA]. For the batch tests, the entire content of the
reactor was measured for pH, total solids (TS), and
volatile solids (VS) at the digestion period. Total solids
(TS) and volatile solids (VS) were determined at 104 ℃
to constant weight and by the loss on ignition of the dried
sample at 550 ℃, respectively [21]. The pH and moisture
content was measured using digital pH meter (HM-25R)
and moisture meter (MOC63u), respectively. The
pressure was higher than atmospheric level measured by
gas pressure gauge. Each constituents of the biogas was
measured every day for 45 days digestion period.
III. RESULTS AND DISCUSSION
A. Biogas Yields at Different Mixing Ratios without
Inoculums Source
The daily biogas production by the co-digestion of
cattle manure and organic wastes during 45 days of
digestion was calculated under different mixing ratios as
shown in Fig. 2. Samples from the mixing ratios of
CW:CM 50:50, VW:CM 25:75 and FW:CM 25:75 were
measured, and their peak yield values were 819, 625 and
753 mL/day on the 27th
, 31th
and 33th
day, respectively
(Fig. 2A, 2B & 2C). The digestion of single CM substrate
(0:100) produced biogas 645, 531 and 610 mL/day which
was generated on the 26th
, 30th
and 26th
day, respectively.
By contrast, the digestion of any single CW, VW, and
FW substrate (100:0) was produced (CW:CM 528,
VW:CM 512 and FW:CM 584 mL/day) that occurred
delay than the other combinations (32th
to 34th day) and
decreased rapidly after the 34th
day (Fig. 2). However, the
average biogas yields (CW:CM, VW:CM and FW:CM
ratios of 0:100, 25:75, 50:50, 75:25 and 100:0) were 282,
319, 386, 302, 232, 248, 288, 250, 249, 207, 288, 347,
295, 288 and 225 mL/day, respectively. These results
indicate that the co-digestion of cattle manure and
organic wastes could the attainment of the highest gas
production than single digestion.
0
100
200
300
400
500
600
700
800
900
1 3 5 7 9 11 13 15 17 19 21 23 25 27 29 31 33 35 37 39 41 43 45
Da
ily
bio
ga
s y
ield
(m
L/
d)
Digestion time (Days)
ACW:CM 0:100
CW:CM 25:75
CW:CM 50:50
CW:CM 75:25
CW:CM 100:0
0
100
200
300
400
500
600
700
1 3 5 7 9 11 13 15 17 19 21 23 25 27 29 31 33 35 37 39 41 43 45
Da
ily
bio
ga
s y
ield
(m
L/
d)
Digestion time (Days)
BVW:CM 0:100
VW:CM 25:75
VW:CM 50:50
VW:CM 75:25
VW:CM 100:0
0
100
200
300
400
500
600
700
800
1 3 5 7 9 11 13 15 17 19 21 23 25 27 29 31 33 35 37 39 41 43 45
Da
ily
bio
ga
s y
ield
(m
L/
d)
Digestion time (Days)
CFW:CM 0:100
FW:CM 25:75
FW:CM 50:50
FW:CM 75:25
FW:CM 100:0
Figure 2. Daily biogas production from the co-digestion of CM with CW (A), VW (B) and FW (C) at different mixing ratios without
inoculum
B. Biogas Production Rates at Different Mixing Ratios
with Inoculums Source
The comparative daily biogas production rates from
the co-digestion of cattle manure and organic wastes
were observed in presence of inoculums under different
mixing ratios as shown in Fig. 3. The biogas production
process ran for 45 days until almost cease production was
investigated. The results showed that the mixing ratios of
CW:CM 50:50, VW:CM 25:75 and FW:CM 25:75 were
Journal of Advanced Agricultural Technologies Vol. 2, No. 1, June 2015
52© 2015 Journal of Advanced Agricultural Technologies

produced biogas 997, 701 and 789 mL/day on the 31th
,
34th
and 31th
day, respectively (Fig. 3A, 3B & 3C).
However, in this experiment the ratio of VW:CM 50:50
was obtained highest biogas 764 mL/day on the 32th
day.
The digestion of single CM substrate (0:100) produced
biogas greater than absence of inoculum and had
relatively high peaks (759, 689 and 675 mL/day) (Fig. 3).
Whereas, the digestion of any single CW, VW, and FW
substrate (100:0) had small peak than single CM peak
(CW:CM 715, VW:CM 632 and FW:CM 662 mL/day).
The average biogas yields CW:CM, VW:CM and
FW:CM ratios of (0:100, 25:75, 50:50, 75:25 and 100:0)
were 400, 357, 457, 353, 311, 298, 346, 356, 315, 284,
337, 369, 358, 335 and 258 mL/day respectively as
shown in Fig. 3. In both experiments the low biogas
generation at the starting and the end might be due to the
inhibition caused by the accumulation of volatile fatty
acids (VFA) by the microorganism which hinders the
releasing of the biogas.
0
200
400
600
800
1000
1200
1 3 5 7 9 11 13 15 17 19 21 23 25 27 29 31 33 35 37 39 41 43 45
Da
ily
bio
ga
s y
ield
(m
L/
d)
Digestion time (Days)
ACW:CM 0:100
CW:CM 25:75
CW:CM 50:50
CW:CM 75:25
CW:CM 100:0
0
100
200
300
400
500
600
700
800
900
1 3 5 7 9 11 13 15 17 19 21 23 25 27 29 31 33 35 37 39 41 43 45
Da
ily
bio
ga
s y
ield
(m
L/
d)
Digestion time (Days)
BVW:CM 0:100
VW:CM 25:75
VW:CM 50:50
VW:CM 75:25
VW:CM 100:0
0
100
200
300
400
500
600
700
800
900
1 3 5 7 9 11 13 15 17 19 21 23 25 27 29 31 33 35 37 39 41 43 45
Da
ily
bio
ga
s y
ield
(m
L/
d)
Digestion time (Days)
CFW:CM 0:100
FW:CM 25:75
FW:CM 50:50
FW:CM 75:25
FW:CM 100:0
Figure 3. Daily biogas production from the co-digestion of CM with CW (A), VW (B) and FW (C) at different mixing ratios with inoculum
C. Cumulative Biogas Production in Absence of
Inoculums
The final cumulative biogas productions by the co-
digestion of CM and ORs at different mixing ratios are
shown in Fig. 4. The cumulative biogas productions for
CW:CM 25:75, 50:50, and 75:25 were 14387, 17383 and
13621 mL, respectively (Fig. 4A). These results showed
an increase of 13%, 36% and 7% and 37%, 66%, and
30% compared with single CW (12713 mL) and CW
(10469 mL) respectively. The same trends were observed
for the VW:CM and FW:CM treatments, which had
considerably higher increases (Fig. 4B & 4C). These data
showed that the co-digestion of cattle manure and organic
wastes greatly improved biodegradability and biogas
production at most mixing ratios compared with single
substrate digestion.
0
2000
4000
6000
8000
10000
12000
14000
16000
18000
20000
1 3 5 7 9 11 13 15 17 19 21 23 25 27 29 31 33 35 37 39 41 43 45
Cu
mu
lati
ve
bio
ga
s y
ield
(m
L)
Digestion time (Days)
A
CW:CM 0:100
CW:CM 25:75
CW:CM 50:50
CW:CM 75:25
CW:CM 100:0
0
2000
4000
6000
8000
10000
12000
14000
1 3 5 7 9 11 13 15 17 19 21 23 25 27 29 31 33 35 37 39 41 43 45
Cu
mu
lati
ve
bio
ga
s y
ield
(m
L)
Digestion time (Days)
B
VW:CM 0:100
VW:CM 25:75
VW:CM 50:50
VW:CM 75:25
VW:CM 100:0
0
2000
4000
6000
8000
10000
12000
14000
16000
18000
1 3 5 7 9 11 13 15 17 19 21 23 25 27 29 31 33 35 37 39 41 43 45
Cu
mu
lati
ve
bio
ga
s y
ield
(m
L)
Digestion time (Days)
C
FW:CM 0:100
FW:CM 25:75
FW:CM 50:50
FW:CM 75:25
FW:CM 100:0
Figure 4. Cumulative biogas production from the co-digestion of CM with CW (A), VW (B) and FW (C) at different mixing ratios without
inoculum
Journal of Advanced Agricultural Technologies Vol. 2, No. 1, June 2015
53© 2015 Journal of Advanced Agricultural Technologies
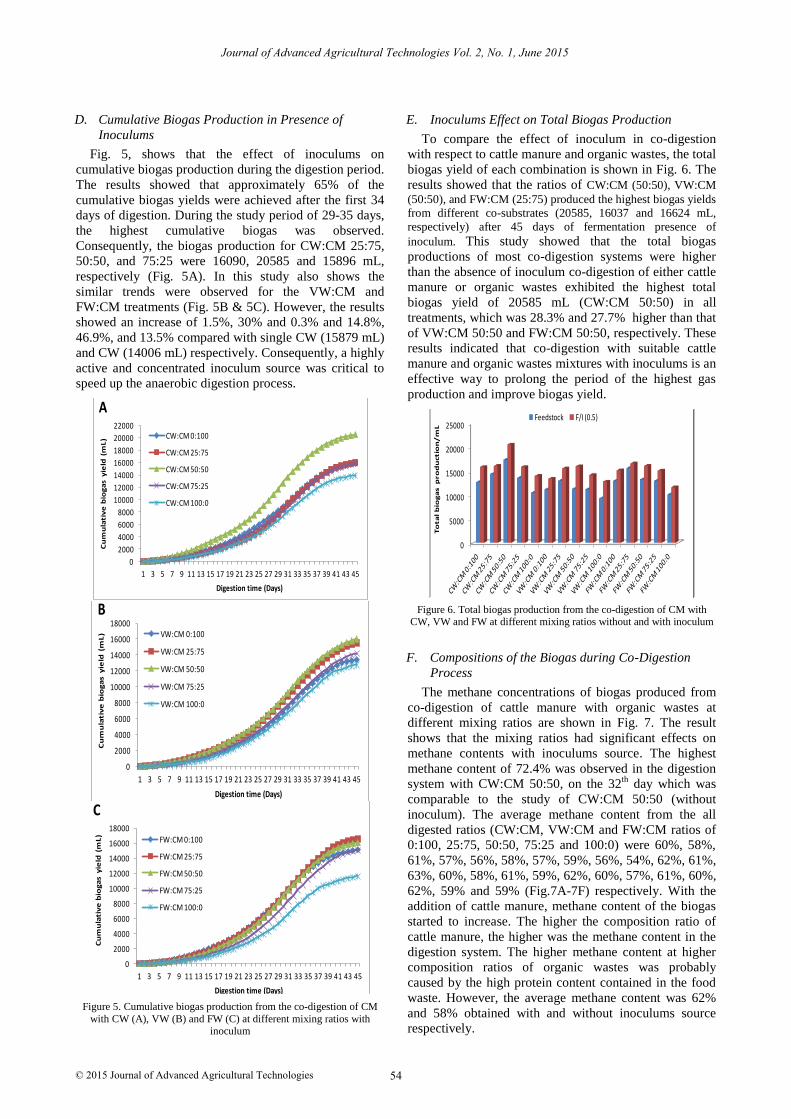
D. Cumulative Biogas Production in Presence of
Inoculums
Fig. 5, shows that the effect of inoculums on
cumulative biogas production during the digestion period.
The results showed that approximately 65% of the
cumulative biogas yields were achieved after the first 34
days of digestion. During the study period of 29-35 days,
the highest cumulative biogas was observed.
Consequently, the biogas production for CW:CM 25:75,
50:50, and 75:25 were 16090, 20585 and 15896 mL,
respectively (Fig. 5A). In this study also shows the
similar trends were observed for the VW:CM and
FW:CM treatments (Fig. 5B & 5C). However, the results
showed an increase of 1.5%, 30% and 0.3% and 14.8%,
46.9%, and 13.5% compared with single CW (15879 mL)
and CW (14006 mL) respectively. Consequently, a highly
active and concentrated inoculum source was critical to
speed up the anaerobic digestion process.
0
2000
4000
6000
8000
10000
12000
14000
16000
18000
20000
22000
1 3 5 7 9 11 13 15 17 19 21 23 25 27 29 31 33 35 37 39 41 43 45
Cu
mu
lati
ve
bio
ga
s y
ield
(m
L)
Digestion time (Days)
A
CW:CM 0:100
CW:CM 25:75
CW:CM 50:50
CW:CM 75:25
CW:CM 100:0
0
2000
4000
6000
8000
10000
12000
14000
16000
18000
1 3 5 7 9 11 13 15 17 19 21 23 25 27 29 31 33 35 37 39 41 43 45
Cu
mu
lati
ve
bio
ga
s y
ield
(m
L)
Digestion time (Days)
B
VW:CM 0:100
VW:CM 25:75
VW:CM 50:50
VW:CM 75:25
VW:CM 100:0
0
2000
4000
6000
8000
10000
12000
14000
16000
18000
1 3 5 7 9 11 13 15 17 19 21 23 25 27 29 31 33 35 37 39 41 43 45
Cu
mu
lati
ve
bio
ga
s y
ield
(m
L)
Digestion time (Days)
C
FW:CM 0:100
FW:CM 25:75
FW:CM 50:50
FW:CM 75:25
FW:CM 100:0
Figure 5. Cumulative biogas production from the co-digestion of CM
with CW (A), VW (B) and FW (C) at different mixing ratios with inoculum
E. Inoculums Effect on Total Biogas Production
To compare the effect of inoculum in co-digestion
with respect to cattle manure and organic wastes, the total
biogas yield of each combination is shown in Fig. 6. The
results showed that the ratios of CW:CM (50:50), VW:CM
(50:50), and FW:CM (25:75) produced the highest biogas yields
from different co-substrates (20585, 16037 and 16624 mL,
respectively) after 45 days of fermentation presence of
inoculum. This study showed that the total biogas
productions of most co-digestion systems were higher
than the absence of inoculum co-digestion of either cattle
manure or organic wastes exhibited the highest total
biogas yield of 20585 mL (CW:CM 50:50) in all
treatments, which was 28.3% and 27.7% higher than that
of VW:CM 50:50 and FW:CM 50:50, respectively. These
results indicated that co-digestion with suitable cattle
manure and organic wastes mixtures with inoculums is an
effective way to prolong the period of the highest gas
production and improve biogas yield.
0
5000
10000
15000
20000
25000T
ota
l b
iog
as p
ro
du
ctio
n/
mL
Feedstock F/I (0.5)
Figure 6. Total biogas production from the co-digestion of CM with CW, VW and FW at different mixing ratios without and with inoculum
F. Compositions of the Biogas during Co-Digestion
Process
The methane concentrations of biogas produced from
co-digestion of cattle manure with organic wastes at
different mixing ratios are shown in Fig. 7. The result
shows that the mixing ratios had significant effects on
methane contents with inoculums source. The highest
methane content of 72.4% was observed in the digestion
system with CW:CM 50:50, on the 32th
day which was
comparable to the study of CW:CM 50:50 (without
inoculum). The average methane content from the all
digested ratios (CW:CM, VW:CM and FW:CM ratios of
0:100, 25:75, 50:50, 75:25 and 100:0) were 60%, 58%,
61%, 57%, 56%, 58%, 57%, 59%, 56%, 54%, 62%, 61%,
63%, 60%, 58%, 61%, 59%, 62%, 60%, 57%, 61%, 60%,
62%, 59% and 59% (Fig.7A-7F) respectively. With the
addition of cattle manure, methane content of the biogas
started to increase. The higher the composition ratio of
cattle manure, the higher was the methane content in the
digestion system. The higher methane content at higher
composition ratios of organic wastes was probably
caused by the high protein content contained in the food
waste. However, the average methane content was 62%
and 58% obtained with and without inoculums source
respectively.
Journal of Advanced Agricultural Technologies Vol. 2, No. 1, June 2015
54© 2015 Journal of Advanced Agricultural Technologies

0
5
10
15
20
25
30
35
40
45
50
55
60
65
70
75
1 3 5 7 9 11 13 15 17 19 21 23 25 27 29 31 33 35 37 39 41 43 45
Me
tha
ne
co
nte
nts
of
bio
gas
(%)
Digestion time (Days)
A
CW:CM 0:100
CW:CM 25:75
CW:CM 50:50
CW:CM 75:25
CW:CM 100:0
05
10152025303540455055606570
1 3 5 7 9 11 13 15 17 19 21 23 25 27 29 31 33 35 37 39 41 43 45
Me
tha
ne
co
nte
nts
of
bio
ga
s (%
)
Digestion time (Days)
B
VW:CM 0:100
VW:CM 25:75
VW:CM 50:50
VW:CM 75:25
VW:CM 100:0
05
10152025303540455055606570
1 3 5 7 9 11 13 15 17 19 21 23 25 27 29 31 33 35 37 39 41 43 45
Me
tha
ne
co
nte
nts
of
bio
ga
s (%
)
Digestion time (Days)
C
FW:CM 0:100
FW:CM 25:75
FW:CM 50:50
FW:CM 75:25
FW:CM 100:0
05
101520253035404550556065707580
1 3 5 7 9 11 13 15 17 19 21 23 25 27 29 31 33 35 37 39 41 43 45
Me
tha
ne
co
nte
nts
of
bio
ga
s (%
)
Digestion time (Days)
D
CW:CM 0:100
CW:CM 25:75
CW:CM 50:50
CW:CM 75:25
CW:CM 100:0
05
1015202530354045505560657075
1 3 5 7 9 11 13 15 17 19 21 23 25 27 29 31 33 35 37 39 41 43 45
Me
tha
ne
co
nte
nts
of
bio
ga
s (%
)
Digestion time (Days)
E
VW:CM 0:100
VW:CM 25:75
VW:CM 50:50
VW:CM 75:25
VW:CM 100:0
0
10
20
30
40
50
60
70
80
1 3 5 7 9 11 13 15 17 19 21 23 25 27 29 31 33 35 37 39 41 43 45
Me
tha
ne
co
nte
nts
of
bio
ga
s (%
)
Digestion time (Days)
F
FW:CM 0:100
FW:CM 25:75
FW:CM 50:50
FW:CM 75:25
FW:CM 100:0
Figure 7. Methane content from the co-digestion of CM with CW , VW
and FW (A-F) at different mixing ratios without ant with inoculum
IV. CONCLUSIONS
The optimal performance for co-digestion of cattle
manure and organic wastes was achieved at their mixing
ratio of CW:CM 50:50. Under this preferred ratio, the
effect of inoculum content on anaerobic co-digestion was
investigated in batch systems. The results indicate that
methane concentrations (with inoculums) from co-
digestion of cattle manure and organic wastes were
higher or comparable to the output of (without
inoculums). The study results showed that the anaerobic
co-digestions of CM with CW, VW and FW were
efficient and produced more cumulative biogas by adding
inoculums source. The best ratios were CW:CM 50:50,
VW:CM 50:50 and FW:CM 25:75. Therefore, the
anaerobic co-digestion of CM and organic wastes with
inculums is a promising way for improving biogas
production. This co-digestion not only resolves the
environmental problems caused by fossil fuel, but also
overcomes energy crisis to enhance the AD process.
ACKNOWLEDGEMENT
This research was conducted at Kumamoto University,
Kumamoto, Japan with funding support from Graduate
School of Science and Technology (GSST). We thank
our biomass group lab mates for helping with the
measurements.
REFERENCES
[1] J. Goldemberg and T. B. Johansson, World Energy Assessment
Overview 2004 Update, New York: UNDP, pp. 88, 2004.
[2] L. D. Schamphelaire and W. Verstraete, “Revival of the biological sunlight-to-biogas energy conversion system,” Biotechnology and
Bioengineering, vol. 103, no. 2, pp. 296-304, 2009. [3] L. Reijnders and M. A. J. Huijbregts, “Life cycle emissions of
greenhouse gases associated with burning animal wastes in
countries of the European Union,” Journal of Cleaner Production, vol. 13, no. 1, pp. 51-6, 2005.
[4] Y. Q. Li, R. H. Zhang, X. Y. Liu, C. Chen, X. Xiao, L. Feng, et al., “Evaluating methane production from anaerobic mono- and co-
digestion of kitchen waste, corn stover, and chicken manure,”
Energy Fuel, vol. 27, pp.2085–2091, 2013a.
[5] T. H. Amon and J. Boxberger, “Biogas production from armyard
manure. In: Recycling of agricultural, municipal and industrial residues in agriculture,” FAO European Cooperative Research,
Ramiran, Gargnano/Italy, September 6–9, 2000.
Journal of Advanced Agricultural Technologies Vol. 2, No. 1, June 2015
55© 2015 Journal of Advanced Agricultural Technologies

[6] M. Macias-Corral, Z. Samani, A. Hanson, G. Smith, P. Funk, H. Yu, et al., “Anaerobic digestion of municipal solid waste and
agricultural waste and the effect of codigestion with dairy cow
manure,” Bioresour Technol, vol. 99, no. 17, pp. 8288–8293, 2008. [7] M. Plochl and M. Heiermann, “Biogas farming in Central and
Northern Europe: A strategy for developing countries? invited overview,” Agric Eng Int: CIGRE Journal, vol. 8, 2006.
[8] A. T. W. M. Hendriks and G. Zeeman, “Pretreatments to enhance
the digestibility of lignocellolosic biomass,” Bioresour. Technol., vol. 100, pp. 10–18, 2009.
[9] Y. Q. Li, R. H. Zhang, C. Chang, G. Q. Liu, Y. F. He, and X. Y. Liu, “Biogas production from co-digestion of corn stover and
chicken manure under anaerobic wet, hemi-solid, and solid state
conditions,” Bioresour. Technol., vol. 149, pp. 406–412, 2013. [10] X. J. Wang, G. H. Yang, Y. Z. Feng, G. X. Ren, and X. H. Han,
“Optimizing feeding composition and carbon–nitrogen ratios for improved methane yield during anaerobic co-digestion of dairy,
chicken manure and wheat straw,” Bioresour. Technol., vol. 120,
pp. 78–83, 2012. [11] A. J. Ward, P. J. Hobbs, P. J. Holliman, and D. L. Jones,
“Optimisation of the anaerobic digestion of agricultural resources,” Bioresour. Technol., vol. 99, no. 7, pp. 7928–7940,
2008.
[12] X. Wu, W. Y. Yao, J. Zhu, and C. Miller, “Biogas and CH4 productivity by co-digesting swine manure with three crop
residues as an external carbon source,” Bioresour. Technol., vol. 101, pp. 4042–4047, 2010.
[13] P. Viswanath, S. S. Devi, and K. Nand, “Anaerobic digestion of
fruit and vegetable processing wastes for biogas production,” Bioresource Technology, vol. 40, pp. 43–48, 1992.
[14] A. M. Viturtia, J. Mata-Alvarez, F. Cecchi, and G. Fazzini, “Two-phase anaerobic digestion of a mixture of fruit and vegetable
wastes,” Biological Wastes, vol. 29, pp. 189–99, 1989.
[15] A. G. Lane, “Anaerobic digestion of solid fruit waste supplemented with poultry manure in a horizontal plug-Pow
reactor,” Environmental Technology Letters, vol. 5, pp. 465–71, 1984.
[16] F. J. Callaghan, D. A. J. Wase, K. Thayanithy, and C. F. Forster,
“An examination of the continuous anaerobic co-digestion of cattle slurry and Fish offal,” Trans I Chem E, vol. 76, Part B, pp.
224–228, 1998. [17] R. Zhang, H. El-Mashad, K. Hartman, F. Wang, G. Liu, C. Choate,
and P. Gamble, “Characterization of food waste as feedstock for
anaerobic digestion,” Bioresource Technol., vol. 98, no. 4, pp. 929-935, 2006.
[18] R. Li, Y. Ge, K. Wang, X. Li, and Y. Pang, “Characteristics and anaerobic digestion performances of kitchen wastes,” Renew.
Energ. Res., vol. 28, pp. 76-80, 2010.
[19] C. Wan, Q. Zhou, G. Fu, and Y. Li, “Semi-continuous anaerobic co-digestion of thickened waste activated sludge and fat, oil and
grease,” Waste Manage, vol. 31, pp. 1752-1758, 2011. [20] H. El-Mashad and R. Zhang, “Biogas production from co-
digestion of dairy manure and food waste,” Bioresource Technol.,
vol. 101, no. 11, pp. 4021-4028, 2010. [21] APHA, Standard Methods for the Examination of Water and
Waste Water, 19th edn. APHA-AWWA-WPCF, Washington, DC, 1995, pp. 525-987.
Muhammad Rashed Al Mamun was born on February 8, 1982 in Kaliganj, Dhaka-Gazipur,
Bangladesh. Al Mamun successfully
completed B.Sc. in Agricultural Engineering and MS (Masters) degree in Farm Power and
Machinery from Bangladesh Agricultural University, Mymensingh, Bangladesh in 2005
and 2007 respectively.
Now he is studying PhD under the Department of Advanced Mechanical
System Engineering at Kumamoto University, Japan from April 2013. Before graduation he received secondary high school and high
school certificate from Kaliganj, Gazipur, Bangladesh, in 1997 and
1999 respectively. He is an ASSISTANT PROFESSOR in the Department of Farm Power
and Machinery, Faculty of Agricultural Engineering and Technology in Sylhet Agricultural University, Sylhet, Bangladesh. Prior to this
position, he worked as a LECTURER for the same University and
AGRICULTURAL ENGINEER at the Department of Agricultural Extension in Ministry of Agriculture, Dhaka, Bangladesh. He also worked
as the VISITING Professor at Shahjalal University of Science and Technology, Forestry Science and Technology School and Agricultural
Training Institute in Syhlet, Bangladesh. He was working in the field of
renewable energy based on biomass which supplies energy in rural areas and developed of improve utilization technology. His research
interests include renewable energy, agricultural machinery, precision agriculture, and GIS based agricultural policy management for
sustainable agriculture in rural areas.
Mr. Al Mamun is a member of Engineering Institute of Bangladesh (IEB), Krishibid Institute of Bangladesh (KIB) and Asia-Pacific
Chemical, Biological & Environmental Engineering Society (APCBEES).
Shuichi Torii was born on January 27, 1960
in Kumamoto, Japan.
He received his B.Sc. in Mechanical
Engineering from Kagoshima University,
Japan in 1983. He successfully completed his Masters and PhD degrees in Mechanical
Engineering from Kyushu University, Japan in 1985 and 1989 respectively.
He worked as a LECTURER at Kyushu
University, Japan. He also worked as the VISITING SCHOLAR at University of Michigan, where he studied the
solidification and oxidization in reactor using the experimental method and numerical simulation. In 1993, he became the ASSOCIATE
PROFESSOR at Kagoshima University, where he studied the thermal
fluid flow transport phenomena for rotating machinery and combustion and the development of turbulence model. Since 2003, he currently is a
PROFESSOR of Department of Mechanical Engineering at Kumamoto University. His research interest on production and development of
clean Energy and renewable Energy, thermal fluid flow transport
phenomena using nanofluids, advanced cooling device development
with the use of nanofluids and development of new clean fuel with the
aid of shock-wave.
Journal of Advanced Agricultural Technologies Vol. 2, No. 1, June 2015
56© 2015 Journal of Advanced Agricultural Technologies


