

(
Comparison of Dietary Fructose Versus Glucose During
pregnancy on Fetal Growth and Development
Marjorie Ferqusson School of Dietetics and Human Nutrition
MacDonald College McGill University, Montreal
A Thesis submitted to the Faculty of Graduate Studies and Research in partial fulfillment of the requirements for the
deqree of Masters of Science
Marjorie Ferqusson 1989
i
ft

(
. ( ..
l would like to thank my supervisor Dr. Kris Koski and also Louise Lanoue and Mona Cobrin. This thesis could not have been completed without their help and support.
Many thanks to D:r.:. E. Chavez, Dr. S. Kubow and Dr. L. Thibault for their constructive criticism.
The statistical advice of Dr. J.F. Hayes was grp.atly appreciated.
l would also like to thank Natalie Goyette, Chantal Garnache and Deborah Binder for their technical assistance .
ii
ft

' • ./>
Abstract
Dietary carbohydrate during pregnancy is essential but
whether this requirement is specifie to glucose or if fructose
could substitute for glucose in the diet of pregnant rat dams
was investigated. It was concluded that the carbohydrate
requirement for the rat during pregnancy is not specifie to
glucose and the level, not the type, of carbohydrate was
critical. The potential toxicity of high fructose diets was
also investigated. Dams fed high fructose had significantly
higher liver weights than dams fed high glucose while other
toxic indicators were not affected. A third aspect was the
comparison of isocaloric, low carbohydrate diets centaining
different sources of 4% glucose equivalents: glucose, fructose
or lipid-glycerol. Fructose and lipid-glycerol were net
adequate substi tutes for glucose. The measurement of amniotic
fluid glucose, which increased as either dietary glucose or
fructose increased in the maternaI diet may be a new,
accessible nutritional indicator of carbohydrate status.
iii

(
(
Résumé
Les glucides alimentaires sont essentiels pour la
reproduction chez le rat. Nous avons étudié si ce besoin est
spécifique au glucose ou s~ un autre glucide, le fructose peut
rer,placer le glucose de la diète de la ratte durant la
grossesse. Nos résultats démontrent que la quantité de
glucides contenue dans la diète maternelle est plus importante
que le type de sucre durant la gestat"ion. Nous avons
également évalué les risques de toxicité d'une diète à haute
teneure de fructose. Le poids du foie des rattes qui
consomment une diète riche en fructose durant la gestation est
significativement plus élevé que celui des rattes qui . consomment une diète riche en glucose; aucun au\'.re indicateurs
de toxicité est différent entre les deux groupes. Un
troisième volet de l'étude_est la comparison de trois diètes
ont un contenu équivalent à 4% de glucose. Le fructose et le
glycérol se sont avérés de pauvres substituts du glucose
alimentaire. Finalement, la mesure du taux de glucose du
liquide amniotique, qui augmente lorsque le contenu de glucose
ou de fructose de la diète mate~nelle augmente, pourrait être
un indicateur du statut nutritionnel.
iv

- Table of Contents Title Page ..•••••••. . . . . . . . . . . . . . . . . . . . ................ . i
Acknowledgements ••. · .................................. . ... i i Abstract ••••••••••.• . . . . . . . . . . . . . . . . . . . . . . . . . . . . . . . . . . . . . iii Table of Contents •. · .................................. . . ... v
List of Tables ••..• · .................................. . .viii
List of Figures ........................................... X1
Chapter 1. Review of Literature
I.Essentiality of glucose for reproduction
A. Ev idence .................. . ........................ .1
B.BiochemistryjPhysiology. ........................... .3
II. Fructose Metabolism
A.Biochemistry of fructpse during pregnancy •.•....... 8
B. Effects of dietary fructose •••.•.....•...•........ 14
statement of Purpose ..••.••.•••..
Chapter 2. Materials and Methods
I.Diet Formulation
........................
A.General principles •• · ............. . B.Calculation of glucose equivalents. .............. C.Diet selection .•... .............................. D.Diet composition ..•
E.Diet preparation ••••
II.Experimental AnimaIs
A.Animal care .•••••...
B.Tissue collection •••
· ........................... . · ........................... .
· ........................... . ......................
C.Calculation of food intake. ......................
v
.22
.23
.24
.25
.27
.31
.31
.32
.33

D.Selection criteria •.•••••••••••••••••••••.•••••... 33 (
III.Analytical Procedures
A. Liver glycogen .................................... 34
B.Plasma and amniotic fluid glucose ..••••••..•.•••.. 34
C.Plasma and amniotic fluid lactate •..•••••....•.... 35
D.Plasma triglyceride .••••••...•••••..••••••••.••••• 35
E. Liver Lipid ....................................... 36
F.Plasma and amniotic fluid urie acid .•••.•.....•... 36
G.Plasma and arnniotic fluid urea nitrogen •••••••••.. 36
H. Amniotic fluid ammonia ••••..•.•••....•••.....•••.. 37
IV.statistical Analysis ••••••••....••••..••••••...•.•.• 37
Chapter 3. Results
l.Maternal Parameters
( A.Food lntake'and Body Weight Gain ••...•••••...•••.. 49
B. Reproduct ive Per f o~ance ••.••.••••..••••••..•.••.. 51
C. Li ver Weight ...................................... 52
D. Carbohydrate Metabolism ••••.•.•••••.••••••..•.••.. 54
E. Lipid Metabolism .................... , ............. 56
F.Plasma Lactate ..........••....••......•........... 56
G.Plasma Nitrogen ••••..•••••••..•••.•••••.•.....••.. 57
II.Arnniotic Fluid Parameters
A.Glucose and Lactate •.••••••••••••.••••••••..•.•••. 58
B. Ni trogen .......................................... 60
III.Fetal Pararneters
A.weight of the Fetus, Placenta and Fetal-Placental
Unit .............................................. 61
-( vi

-
-
B. Carbohydrate Metabol ism ...••....•••........•...... 63
C.Lipid Metabolism •••••••....•..••.••.•........•...• 64
D.Plasma Lactate ••••
E.Plasma Uric Acid ..
Chapter 4. Discussion •.•.•
I.Fructose Toxicity •••
.64
.65
..99
.100
II.Fructose Replacement of Glucose •..••••.•...•....... 105
III.Carbohydrate source in very low carbohydrate diets.112
Appendix 1: statistical Methods ....••.....••.•........... 118
Bibl iography ............................................. 120
vii
-

(
(
List of Tables
1-1. Effect of high fructose diets on liver lipogenic enzyme.s ••...••.••••..•.•..••••.•..•..••....•...•..• 11
11-1. Composition of triglyceride and fatty acid based carbohydrate restricted diets •••.•..••......•••.... 40
11-2. Metabolizable energy value of dietary ingredients ........................................ 41
II-J. Equicaloric substitutions of dietary supplements for oleic acid and cellulose and triglyceride and
1I-4.
1I-5.
1I-6.
1I-7.
1I-8.
11-9.
111-1.
1II-2.
cellulose .......................................... 42
Composition of vitamin mixture •...............•...• 43
Formulation of vitamin mixture •..•.•.••....•......• 44
Composition of minera1 mix ••••••...•••....•••••.••• 45
Elemental composition of rnicroelements ••.•.••.•.... 46
Elemental composition, of salt mixture •••...•••....• 47
Caiculated prote in content of ICN case in according to Kjeldahi analyses •.••.•.•••••••.•.•••...•.•..... 48
Effect of glucose and fructose during pregnancy on maternaI food intake and weight gain ..•.....•.••... 66
Effect of low carbohydrate, 4% glucose equivalent diets during gestation on maternal food intake and weight gain ........................................ 67
III-J. Effect of glucose and fructose during gestation Jn reproductive performance in dmas C-sectioned at day 21 ............................................. 68
111-4. Effect of low carbohydrate, 4% glucose equivalent diets during gestation on reproductive performance in dams C-sectioned at day 21 ••.•.••.••.•.••.•••••• 69
1II-5. Effect of glucose and fructose during pregnancy on maternaI liver weight .••..•••••......••............ 70
1II-6. Effect of 60% carbohydrate diets during pregnancy on maternal liver lipid and water content ••.••.••..... 71
1II-7. Effect of low carbohydrate, 4% glucose equivalent diets during pregnancy on maternal liver weight .•.• 72
viii
.

III-S. Effect of glucose and fructose during pregnancy on maternai parameters ••.•..••.•....••................ 73
1II-9. Effect of low carbohydrate, 4% glucose equivalent diets during pregnancy on maternaI parameters ...... 74
III-IO.Effect of glucose and fructose auring pregnancy on maternaI lactate ••••.....•.•......•................ 75
III-ll.Effect of low carbohydrate, 4% glucose equivalent diets during gestation on maternaI lactate ......... 76
III-12.Effect of glucose and fructose during pregnancy on matbrnal blood nitrogen ..•..•..................... ,77
III-13.Effect of low cdrbohydrate, 4% glucose equivalent diets during pregnancy on maternaI nitrogen ........ 78
III-14.Effect of glucose and fructose during gestation on amniotic fluid glu~ose and lactate •................ 79
III-15.Effect of low carbohydrate, 4% glucose equivalent diets during gestation on amniotic fluid glucose and lactate ...........•............................ 80
III-16.Effect of glucose and fructose during pregnùncy on amniotic fluid nitrogen ............................ 81
III-17.Effect of low carbohydrate, 4% glucose equivalent diets during pregnancy on amniotic fluid nitrogen .. 82
III-18.Effect of glucose and fructose during gestation on the weight of the fetus, the placenta and the fetal-plactental unit at day 21 .................... 83
III-19.Effect of low carbohydrate, 4% glucose equivalent diets during gestation on the weight of the fetus, the placenta, and the fetal-placental unit at dùy 21 ................................................. 84
1II-20.Effect of glucose and fructose during gestation on fetal parameters ................................... 85
1II-21.Effect of low carbohydrate, 4% glucose equivalent diets during gestation fetal parameters ............ 86
1II-22.Effect of glucose and fructose during gestation fetal plasma lactate ..•..••........................ B7
1II-23.Effect of low carbohydrate, 4% glucose equivalent diets during gestation on fetal lactate .•.•.•...... 88
ix

III-24.Effect of glucose and fructose during gestation on fetal urie acid .................................... 89
III-25.Effect o~ low carbohydrate, 4% glucose equivalent diets during gestation on fetal uric acid .......... 90
(
( x
l

....
-
., ..
List t)f Figures
I-l.
1-2.
Metabolism of fructose vs glucose ................... 9
Effect of fru~tose on uric acid production ......... 13
III-l.Food Intake - Graded Levels of Dietary Glucose ..... 91
1II-2.Food Intake - Graded Levels of Dietary Fructose .... 92
1II-3.Weight Gain - Graded Levels of Dietary Glucose ..... 93
1II-4.Weight Gain - Graded l..evels of Dietary Fructose .... 94
1II-5.Food Intake - 4% Glucose Equivalents ............... 95
1II-6.Weight Gain - 4% Glucose Equivalents ............... 96
1II-7.Dam liver weight ....•............•................. 97
III-S.Dam Liver weight as % Body Weight •••............... 98
xi

(
(
(
CHAPTER 1: REVIEW OF LITERATURE
ESSENTIALITY OF GLUCOSE FOR REPRODUCTION
Evidence
Dietary carbohydrate is essential during pregnancy in
the rat (Koski et al 1986). Many parameters of reproductive
performance are adversely affected when carbohydrate is absent
from the diet or only present in low concentrations. It has
been demonstrated in the dog (Romsos et al 1981) and rat
(Koski et al 1986) that there is a critical need for
carbohydrate in the diet during pregnancy for (i) fetal growth
and development (Koski et al 1986), (ii) adequate fetal liver
glycogen deposition at term (Koski et al 1986) and (iii)
postnatal survival of the neonate (Koski and Hill 1986; Romsos
et al 1981).
The requirement during pregnancy for dietary carbohydrate
is apparent after the time of implantation in the ra~ (Taylor
et al 1983); the number of implantation sites is not affected
by the lack of dietary carbohydrate early in gestation in the
dog (Romsos et al 1981) and the rat (Taylor e~ al 1983; Koski
et al 1986;1989; and Koski and Hill 1986;1989). However,
fetal survival fOllowing i.mplantation is impaired, as measured
by an increased incidence of resorption and stillbirths, when
there is a low availability of dietary carbohydrate. The
resorption rate is partic.:ularly affected by an absence of
carbohydrate in the diet during the first eight days of
pregnancy in the rat (Koski et al 1989) while the stillbirth
1
.

-
rate is increased due to a lack of dietary carbohydrate near
term in dogs (Romsos et al 1981) and rats (Koski and Hill
1989: Koski et al 1989). In order to carry live fetuses to
term, dams require a level of 4% dietary glucose or i ts
equivalent (Koski et al 1986; Koski and Hill 1986).
Additionally fetal growth is retarded if dams are fed
diets lacking an adequate dietary carbohydrate. This is
demonstrated by a lower fetal weight at 19.5 days of gestation
in dams fed low carbohydrate diets (4% glucose) compared to
control levels of 62% carbohydrate (Koski and Mancini 1989).
The birth weight of rat pups (Koski and Hill 1986;1989; Koski
et al 1989) is also lower if the pups are delivered from a
mother ingesting a carbohydrate restricted diet (0 or 4 %
glucose) compared to a 62% earbohydrate diet. In the se
studies, as maternaI dietary earbohydrate inereased, so too
did birth weight. An absence of dietary car~ohydrate did not
affect the birth weight of newborn dogs (Romsos et al 1981),
but this carbohydrate deficiency was not fed throughout
pregnancy as was the case for the pregnant rats.
Finally, neonatal survival is dramatically decreased in
dogs (Romsos et al 1981) and rats (Koski and Hill 1986; 1989)
fed carbohydrate restrieted diets. In the rat, it has been
shown that increasing the concentration of dietary
earbohydrate deereases the postnatal mortality rate, thereby
establishing a specifie need for dietary carbohydrate in the
maternal diet.
2
(
( •
Biochemistry/Physioloqy
It has just been shown that dietary earbohydrate is
required during pregnancy and that without a eritical amount
of carbohydrate in the diet, an optimal pregnancy outeome is
not possible. However, the underlying physiological and
bioehemical mechanisms which result from a lack of dietary
earbohydrate and lead to fetal death and impaired fetal
development have not been thoroughly investigated. It is
generally thought that alterations in carbohydrate metabolism,
speeifieally perinatal hypoglyeemia, most likely underlie the
perinatal mortality which follows. This is based on the fact
that glucose is the principle metabolic fuel for the
developing embryo, the mammalian fetus, and the newborn
immediately after birth (Battaglia and Meschia ~988) and is
the preeursor for the large glyeogen reserves that aceurnulate
near terme It is presumed that these large glycogen reserves
are utilized for energy in the early postpartum period
(Shelley 1961).
MaternaI starvation during pregnancy, which also resul ts
in a lack of dietary carbohydrate, has similar effeets upon
glucose homeostasis during pregnancy as carbohydrate-free
diets. However, while maternaI starvation leads to a decrease
in the availability of aIl nutrientc;, the restriction of
maternaI dietary glucose is nutrient specifie. Two primary
indieators of glucose homeostasis ta be discussed in the
3

........
context of dietary and fasting models during pregnancy are
blood glucose and liver glycogen.
Glucose homeostasis is al tered by pregnancy. It is known
that during the second half of pregnancy a state of relative
maternal hypoglycemia develops because of an increase in
insulin resistance (Baird 1986; Leturque et al 1987). This
normal decrease in blood glucose appears to be exacerbated by
a lack of carbohydrate in the diet during pregnancy (Romsos
et al 1981; Taylor et al 1983; Koski et al 1986). Romsos et
al (1981) first observed this in dogs where bitches receiving
0% carbohydrate displayed low blood glucose compared to
control pregnant animals. Hypoglycemia in the bi tches was
accompanied by hypoalanemia and decreased blood lactate which
further suggested a perturbation in glucose homeostasis.
Decreased blood glucose was also observed in rat dams fed 0%
carbohydrate compared te control dams (Taylor et al 1983).
Koski et al (1986) noted a trend towards a lower blood glucose
in dams fed a carbohydrate free diet. However, this was not
significant. Maternal starvation also decreases maternal
blood glucose (Metzger et al 1971; Freinkel et al 1972;
Simmons et al 1974; Philipps et al 1978; Freund et al 1980).
It appears that a lack of dietary carbohydrate, wi th or
without the presence of ether nutrients, decreases maternaI
blood glucose levels.
It is known that the blood glucose level of the mother
will affect the fetal plasma glucose concentration (Ingermann
4

(
(
1987). The concentration of maternaI blood glucose alters the
maternal-fetal gradient of glucose; and the rate of transfer
of glucose acr05S the placenta to the fetus is believed to be
a function of the maternal-fetal gradient (Ingermann 1987).
Therefore a decrease in this gradient will result in a lower
rate of glucose transfer and fetal blood glucose levels are
dependent upon this transfer rate. Many studies have shown
that disturbances in the supply of dietary glucose, which is
responsible for the maintenancE:! of maternaI blood glucose
homeostasis, decrease fetal blood glucose in the rat. This
decrease occurs during maternaI fasting (Simmons et al 1974;
Philipps et al 1978; Freund et al 1980). Also with the
dietary model that specifically restricts dietary glucose,
Koski et ~l (1986) reported that as carbohydrate in the diet
decreased, fetal blood glucose tended to decrease, although
this was not statistically significant. It has been suggested
that a lack of circulating blood glucose, an important energy
source for the fetus (Battaglia and Meschia 1988), leads to
a high rate of stillbirths in dogs (Romsos et al 1981) and
rats (Koski and Mancini 1989).
While fetal blood glucose may be al tered by a lack of
carbohydrate, a more sensitive indicator of adversely affected
carbohydrate metabolism is the concentration of hepatic
glycogen in the fetus. During gestation, the maternaI system
supplies the fetus with blood glucose which, as we have seen,
can be compromised under certain conditions. One function of
5
.

-
-
this supp1y of glucose is to a110w the fetus to lay down
carbohydrate stores as glycogen. Glycogen is synthesized in
the 1iver near the end of gestation when there is a rapid rise
in the level of fetal liver glycogen (Shelley 1960: 1961: Watts
and Gain 1976: Margo1is 1983). More specifically, the fetal
rat accumu1ates 1iver glycogen during the 1ast three days of
gestation (Margolis 1983). Mobilization of liver glycogen by
the newborn is likely the main source of blood glucose af~er
birth when the neonate is eut off from the maternaI supply of
glucose (Shelley and Neligan 1966) because neonatal hepatic
glycogen levels decrease dramatically after parturition
(Shelley 1960:1961: Watts and Gain 1976: Margolis 1983).
Shelley (1960) suggested that factors which lower the fetal
hepatie glyeogen content, may jeopardize the survival of the
neonate.
Dietary carbohydrate may be required to maintain a
cri tical level of fetal hepatie glyeogen neeessary for
neonatal survival. Severe maternal fasting ean lead to
decreased fetal liver glycogen levels due to an inhibited
synthesis of glycogen but not beeause of increased glycogen
breakdown (Gilbert and Bourbon 1980: Freund et al 1980;
Miettinen and Kliegman 1983). This inability of the fetus te
breakdown hepatic glycogen before birth suggests that glyeogen
accumulation is critica1 for the survival of the animal
(Goodner and Thompson 1967: Gilbert and Bourbon 1980).
Carbohydrate free or low carbohydrate diets aIse produce
6

(
(
significantly lower levels of glycogen in the maternaI livers
of the rat at days 6-14 (Taylor et al 1983), day 19.5 (Koski
and Mancini 1989) and day 21.5 (Koski et al 1986) of
gestation. Two parallel studies examined fetal glycogen
levels and neonatal mortality in fetuses and neonates of dams
fed low carbohydrate and control diets. Interestingly, the
lower concentrations af hepatic glycagen in the day 21.5 fetus
in the gestational study (Kaski et al 1986) correlated with
100% neonatal mortality in the postnatal study (Koski and Hill
1986). This strongly suggests that fetal liver glycogen is
critical for neonatal survival. AIso, Romsas et al· (1981)
indicated that body mass glucose may be lower in bitches fed
a diet of 0% carbohydrate compared to contraIs and suggested
that this may be the cause of the high perinatal mortality.
Therefore it appears that glycogen stores are required by the
neonate to survive after birth.
In summary, i t can be concluded that adequate dietary
carbohydrate as glucose is essential during pregnancy for the
optimal development of the fetus. It has been demonstrated
that dietary carbohydrate affects the maternaI blood glucose
level which in turn affects the fetal blood glucose and
hepatic glycogen concentrations. without these sources of
carbohydrate for the fetus and neonate, respectively, fetal
and neonatal survival appears to be compromised.
7

FRUCTOSE METABOLXSM
Biochemistry of Fructose during praqnancy
The previous studies have demonstrated the essentiality
of dietary carbohydrate during pregnancy. It is not known
whether the requirement for carbohydrate is specific to
glucose or whether another carbohydrate such as fructose can
fully replace glucose. The metabolism of fructose and
glucose differ in location,
regulation. The liver is
biochemical pathways and in
the major site of fructose
metabolism in the man and rat while glucose may be metabolized
by extrahepatic peripheral tissues (Hallfrisch 1987). After
fructose enters the liver, it is metabolized by three enzymes
which are not involved in glucose metabolism. The three
important hepatic enzymes which are required for fructose
metabolism are (see Figure I-1): fructokinase, aldolase Band
triokinase. Ballard and Oliver (1964) have suggested that
pregnancy induces a decrease in hepatic fructokinase 1 the
first enzyme to metal"lolize fructose, in the maternal system.
The physiological significance of this is unknown.
Fructokinase phosphorylates fructose forming fructose-1-
phosphate. The high activity of this enzyme results in a
rapid rate of fructose phosphorylation. Aldolase B, the
second enzyme of fructose metabolism, splits fructose-l
phosphate, producing glyceraldehyde and dihydroxyacetone
phosphate (DHAP). The majority of glycèraldehyde formed is
then phosphorylated by the third enzyme triokinase (Van den
8

l i
.\ ,
d 1
(
(
(
Figure I-l.Metal:x:>lism of F'IUctose versus Glucose.
GLYlOGEN
GLUCOSE --G-L-U-C-O-K-IN-A-S-E-..... GL UCi E-l-P
FRUCTOSE FRU CTOSE-1-P ! FRUCTOK'NASE l r FRUCTOSE-1-P FR U CTOSE-1,S-P P
1UDOLASE. ~~HAP l GLYCERALOEHYOE-----". .. GLYCERALOEHYDE-3-P
PEPCK
TRIOKINASE Â
9
1 ~
PEP
PYRUVATE KINASt
FRUCTOSE-'· P0 ~ PYRUfATE
LACTATE

. .,... ...
Berghe 1986). At this point the triose phosphates, DHAP and
glyceraldehyde-3-phosphate, can be directed towards
gluconeogenesis or glycolysis, depending on the physiological
state of the animal. Because fructose follows a different
biochemical pathway than glucose (Figure 1-1), it is not as
well regulated as glucose. The breakdown of glucose involves
two important regulatory enzymes, glucokinase and
phosphofructokinase (Hallfrisch 1987). Fructose bypasses
these important enzymes, allowing a faster breakdown of
fructose than glucose in the liver.
These differences in carbohydrate metabolism can
potentially alter lipid metabolism and lactate and uric acid
production.
Lipid Matabolism: The liver, where the majority of fructose
is metabolized, is also the primary site of the lipid
synthesis from carbohydrate (Reiser 1987). It appears that
fructose is more readily converted to l ipogenic substances
than glucose and this is probably due to increased activity
of lipogenic enzymes in the presence of fructose (see Table
I-1) •
Lacticacidosis: Fructose can also be rapidly converted ta
lactate because of the lack of regulation of fructose by the
liver (see Figure I-1) (Reiser 1987). Fructose is quickly
phosphorylated by fructokinase and bypasses the regulatory
enzyme phosphofructokinase. In addition, fructose-l-phosphate
10

(
(~
(
Table I-l. Eft.ct ot Hiqh Fructose Diets on Liver Lipoqenic Enzymes
High fructose vs glucose diets: effect on enyzmes
Enzyme
Pyruvate Dehydroqenase
Pyruvate Kinase
Malic Enzyme
Glucose-6-P Dehydrogenase
AcetylCoA Carboxylase
Citric Cleavage Enzyme
Fatty Acid
Synthetase
Increased Activity
Vrana et al 1983 (females) Herzberq & Rogerson 1988b
HelIer et al 1977 Naismith & Rana 1974
Fields et al 1985 Michaelis & Szepesi 1973 Chevalier et al 1972 Fukuda et al 1983 Herzberg & Rogerson 1988a,b Sugawa-Katayama & Morita
1977 (males)
Fields et al 1985 Naismith & Rana 1974 Michaelis & Szepesi 1973 Bourne et al 1975
(pregnant females) Fukuda et al 1983 Herzberg & Rogerson 1988a,b Sugawa-Katayama & Morita
1977 (males)
Fukuda et al 1983 Waterman et al 1975
Chevalier et al 1972 Herzberg & Rogerson 1988a,b
Bourne et al 1975 (pregnant females)
Bruckdorfer et al 1972 Herzberg & Rogerson 1988a,b Waterman et al 1975
*unless noted aIl rats were males
11
ft
Not Affected
Zakim et al 1967 Sugawa-Katayama &
Morita 1977 (females)
Sugawa-Katayama & Morita 1977 (females)
Zakim et al 1967
Zakim et al 1967
-
-
-.....
stimulates pyruvate
fructose to lactate
kinase facilitating the
even further (Reiser 1987).
conversion
Uricacidosis: Fructose loading can result in an accumulation
of fructose-1-phosphate which may lead to a depletion of ATP
and inorganic phosphate in the liver (see Figure I-2) and an
eventual accumulation of uric acid. This is due to a
sequestering of phosphate as fructose-1-phosphate. ATP is
converted to ADP which in turn produces AMP. AMP breakdown
is increased because of a lack of inhibition of AMP dearninase
due ta lower concentrations of inorganic phosphate and GTP.
This is the first step in the breakdown of adenine
nucleotides. Uric acid is one breakdown product of adenine
nucleotides (Van den Berghe 1986). Thus, it appears that
dietary fructose may be a potentially toxic nutrient via its
affect upon lipid, lactate and uric acid metabolism.
Transplacental fructose movement is not significant in
the guinea pig (Karvonen and Raiha 1954), rat and rabbit
(Davies 1955). Hepatic fructokinase is low or absent (Walker
1963, Ballard and Oliver 1964, Grand et al 1974), liver
fructose-1-phosphate aldolase is not significantly active
(Burch et al 1963) and little fructose is incorporated into
glycogen in t~e fetal rat in vitro (Ballard and Oliver 1964).
This evidence suggests that fructose is a relatively foreign
nutrient ta the fetal rat that does not enter the fetal
compartment and is not metabolised by the fetus.
12

(
Figure I-2.Effect of Fructose on Urie Aeid Production.
FRUCTOSE FRU CT<.JSE-1-P
+ .~------ ADP AMP
GPI 1 DEAMINASE
GGTP+ IMP
t INOSINE
! HYPOXAN THINE
! URIC ACID
13

-....
Thus, the utilization of fructose by pregnant dams may
produce lactic acid or uric acid or may alter lipid
metabolism. This in turn may harm the fetus. Although,
fructose itself is probably not directly involved in fetal
metabolism, its effects via the dam may be potentially harmful
to the developing fetus. The different metabolic pathways and
regultion of the two monosaccharides raise sorne doubts as to
the efficacy of fructose as a substitute for glucose during
pregnancy.
Effects of Dietary Fructose
There are no comprehensive studies investigating the
effect of different levels of dietary fructose, as the only
source of carbohydrate, upon pregnancy and gestation. All
investigations examining the effect of dietary fructose versus
glucose in non-pregnant rats have used only high carbohydrate,
low fat diets. Furthermore, there has been only one study
carried out where pregnant rats were fed high levels of
dietary fructose (Bourne et al 1975). Other gestational
studies, investigating the effect of fructose, have used
dietary sucrose which provides the dam with a source of bath
fructose and glucose. Otherwise fructose studies have
focussed on lactation and the neonate. Bourne's study will
be described in detail and an overview of the fructose
studies, which have been more extensively studied in the non
pregnant rat, will be given.
14

(
Bourne et al (1975) fed pregnant rats diets of 68%
fructose or glucose throughout gestation. They examined the
impact of the different sugars upon both the maternaI and
fetal systems. They observed a tendency for the liver
weights of the fructose fed rats to be larger than the glucose
fed rats. Liver lipid concentration was not measured.
Plasma triglycerides were higher in the fructose fed dams.
No dietary differences were observed in plasma glucose. A
decrease in maternaI plasma insulin in fructose fed rats was
observed. From this study, it appeared that high levels of
fructose in the diet altered lipid metabolism in the mother
and possibly carbohydrate metabolism via insulin levels.
However, the fetal parameters measured (weight, l ipogenic
activity, plasma insulin and corticoste .• :oids) were not
affected by diet and the authors fel t the fructose in the
maternaI diet would not have a deleterious effect upon the
fetus or neonate. The authors concluded that more
investigation was required ta determine how changes in the
maternaI system affected pregnancy and whether these changes
were harmful to the dam or fetus.
The results of many investigations which will be
described below are taken from studies of the non-pregnant
rat in which a high fructose diet ranging from 50% to 80.68%
was compared to a high glucose diet. Fructose or glucose was
the only source of carbohydrate in the diet and the percent
carbohydrate was the same in both diets.
15

r -
........
Diets high in fructose have been reported to affect the
histopathology of the eye, kidney and liver of weanling and
adult rats (Poulsom 1986). weanling rats fed a 68% fructose
diet for six months displayed retinopathy (Boot-Handford and
Heath 1980). Retinal capillaries were tortuous and had
irregular diameters. The authors suggested that an increase
in retinal lactate in rats fed fructose may be involved in
the histopathology. The kidney is another organ affected by
high levels of dietary fructose (Boot-Handford and Heath
1981) • Weanling rats fed a 68% or 81% fructose diet have
increased kidney weights compared ta rats fed high glucose
(Allen and Leahy 1966; Kang et al 1979; Boot-Handford and
Heath 1981). Boot-Handford and Heath (1981) reported kidney
pathology in fructose-fed rats in the form of
glomerulosclerosis, tubular atrophy and lymphocyte
infiltrations. Of particular interest to us is the liver
morphology as this is the major site of fructose metabolism.
Hepatic steatosis develops in weanling and adult rats fed
diets of 68-69% fructose (Poulsom 1986). The liver acquires
abnormally thick lobes with blunted edges and the normal faint
mottling is replaced with heavy yellow mottling on its
surface. On closer examination, enlarged hepatocytes can be
seen with a large number of lipid containing vacuoles. This
can lead to displacement and distortion uf the hepatocyte
nuclei and cystic fusion of adjacent hepatocytes (Poulsom
1986) .
16
."' ..

(
(
In many studies, the li ver weight has been recorded
although the histopathology of the liver has not been closely
investigated. Rats (male and female) fed high fructose diets
had significantly higher liver weights th an glucose fed rats
(Allen and Leahy 1966; Bruckdorfer et al 1972; Michaelis and
szepesi 1973; Naismith and Rana 1974; Romsos and Leveille
1974; Waterman et al 1975; Aoyama et al 1980,1982,1987; Bird
and williams 1982; Vrana et al 1983; Fields et al 1985). The
increase in liver weight has been associated with and
attributed to an increase in lipid liver content (Allen and
Leahy 1966; Bruckdorfer et al 1972; Michaelis and Szepesi
1973; Naismith and Rana 1974; Romsos and Leveille 1974; Aoyama
et al 1980; 1982; Bird and Williams 1982). However, others
have not observed increased liver weight in fructose-fed
animaIs (Sugawa-Katayama and Morita 1977; Kang et al 1979;
Fukuda 1983; Herzberg and Rogerson 1988b) .
While some studies have not observed changes in lipid
metabolism in rats fed high levels of dietary fructose, the
majority of studies provide evidence of an increase in both
li ver and blood triglyceride levels in fructose fed rats.
Hepatic lipid levels have been reported to be higher in rats
fed fructose than those fed glucose (Allen and Leahy 1966;
Baron et al 1971; Bruckdorfer et al 1972; Maruhama and
MacDonald 1972; Chevalier et al 1972b: Michaelis and Szepesi
1973; Waddell and Fallon 1973: Romsos and Leveille 1974;
Naismith and Rana 1974; Vrana et al 1974ai Sugawa-Katayama
17

-------------
.... - and Morita 1977; Kang et al 1979; Aoyama et al 1980, 1982:
Bird and Williams 1982). Studies investigating fructose-fed
rats compared to glucose-fed rats have reported increased
activities of many lipogenic enzymes (see Table 1). The
greater activities of these enzymes probably lead to higher
lipid content in the liver (Reiser 1987). Others, however,
have not reported increased liver lipid concentrations in
fructose-fed rats (Zakim et al 1967; Herzberg and Rogerson
1986,1988a,b; Aoyama et al 1987).
In general, weanling and mature rats also have
significantly higher levels of serum or plasma triglycerides
when fed fructose (Zakim et al 1967; Bruckdorfer et al 1972:
Chevalier et al 1972b; Maruhama and MacDonald 1972; Waddell
and Fallon 1973; Vrana et al 1974a,b,1976, 1983,1988: Waterman
et al 1975; HelIer et al 1977; Kang et al 1979; Merkens et al
1980; Sleder et al 1980; Aoyama et al 1980,1981,1982, 1987:
Kannan et al 1981; Bird and Williams 1982; Zavaroni et al
1982; Hostmark et al 1982, 1984; Bird et al 1984; Verschoor
et al 1985; Herzberg and Rogerson 1986,1988a,b ). However,
three studies have not observed an increase in blood
triglycerides (Chevalier et al 1972b, Naismith and Rana 1974;
Kang et al 1979). It appears that weanling rats are less
likely to display an increase in blood triglycerides than more
mature rats and that meal-fed rats are more likely to show
higher blood triglycerides than ad libitum fed rats.
18
(
{ '~
The effect of dietary fructose upon carbohydrate
metabolism is not clear. While blood glucose levels in the
rat are not generally affected by dietary fructose, blood
insulin and liver glycogen are in some studies. Most
investigators have not observed differences in plasma glucose
when rats were diets high in fructose (Baron et al 1971;
Waterman et al 1975; Vrana et al 1978; Kang et al 1979: Sleder
et al 1980: Boot-Handford and Heath 1981; Zavaroni et al 1982:
Fukuda et al 1983). However, Herzberg and Rogerson
(1986;1988a,b) noted a decrease in serum glucose in fructose
fed rats which were meal-fed. In rats fed high dietary levels
of fructose, hepatic glycogen concentrations were reported to
be higher than in those fed equivalent amounts of glucose when
rats were meal-fed (Kang et al 1979; Herzberg and Rogerson
1988b) but not in rats fed ad libitum (Vrana et al 1978; Kang
et al 1979). Thus, it appears that blood glucose and liver
glycogen levels are not affected when rats are fed ad libitum
and the maj or disturb,:,,,"ces to carbohydrate metabol ism are seen
in meal-fed animaIs.
In rats fed fructose, compared to glucose, concentrations
of serum or plasma insulin have been reported to increase
(Sleder et al 1980), remain unchanged (Vrana et al 1974a;
Merkens et al 1980; Zavaroni et al 1982; Bird and Williams
1982; Fukuda et al 1983) or decrease (Bruckdorfer et al 1972;
sugawa-Katayama and Morita 1977; Herzberg and Rogerson 1986,
1988a). The reported increase in blood insulin was not
19
ft

- confirmed in a later study in the same laboratory and leads
us to question the validity of the observed rise in blood
insulin (Zavaroni et al 1982). It is not clear from these
results what effect dietary fructose has upon blood insulin
levels which in any case do not appear to affect glucose and
glycogen metabolism in ad libitum fed rats.
When fructose is administered intravenously or in oral
short-term high doses, lacticacidosis can develop because of
the potentially rapid, unregulated conversion of fructose to
lactic acid (see Figure I-l). However, long-term feeding
studies have not been done in the rat or the human to examine
this toxic effect of fructose (Reiser 1987).
Uricacidosis can also develop during fructose
administration because of the rapid accumulation of fructose-
1-phosphate which can lead to the breakdown of adenine
nucleotides (see Figure I-2) (Reiser 1987). The amount of
fructose required to produce these negative effects may not
be available through normal feeding patterns and hence the
toxicity of dietary fructose may not occur. Chronic studies
feeding fructose to the rat have not examined uric acid
levels. Human feeding studies are inconsistent because the
diets are not weIl controlled (sucrose is often fed or
fructose is not compared directly to glucose) or the subjects
are not considered healthy (obesity, carbohydrate sensitivity,
hypertriglyceridemia, gout) (Reiser 1987). Increased
concentrations of serum uric acid in three healthy subjects
20

( was demonstrated 3.n one twel ve-day study when fructose or
glucose represented about 50% of the calories (Ernmerson 1974) •
The diets used were purine-free, which do not occur naturally.
Because of the diet composition and the small number of
subjects, it is hard to conclude from this one study that
chronic ingestion of fructose is harmful ta humans.
Studies investigating carbohydrate metabolism usually do
not examine the nitrogen metabolism of these animaIs.
However, a few studies investigating dietary fructose in the
non-pregnant rat have observed that the prote in or nitrogen
concentration of the liver is similar in rats fed high glucose
and high fructose diets (Baron et al 1971; Bruckdorfer et al
1972; Sugawa-Katayama and Mor'ita 1977; Kang et al 1979; Vrana
et al 1983). The effect of low dietary carbohydrate during
pregnancy on nitrogen met~bolism has not been weIl examined.
During pregnancy in the ùog, carbohydrate free diets did not
affect the levels of plasma urea nitrogen (Romsos et al 1981) .
21
ft

-
-
STATEMENT OF PURPOSE
It has been shown that dietary carbohydrate in the form
of glucose is essential during pregnancy. It is not known
whether this requirement is specifie to glucose or whether
another carbohdyrate such as fructose can fulfill this
requirement, However, fructose is metabolized differently
than glucose, using a another biochemical pathway which is
less regulated. The differences of metabolism between the
two sugars may alter lipid and carbohydrate metabolism and
lactate and uric acid production. The effect of chronic
ingestion of graded levels of fructose, as the only source of
dietary carbohdyrate, compared to glucose during pregnancy has
not previously been investigated. A closer examination of
dietary fructose during pregnancy is required in order to know
if fructose can replace gl~cose during pregnancy and if this
replacement leads to a toxie effect because of the metabolism
of fructose. Our specifie objectives were to investigate
whether: l)at low levels fructose can fully replace glucose
and therefore be converted to glucose and glycogen in adequate
amounts to maintain glucose horneostasis in the mother and
fetusi 2)at low levels fructose can provide sufficient
precursor for glycogen deposition: and 3) at high levels
fructose will he toxic because of its effect on lipid
metabolism and lactic and uric acid production. A comparable
level of glucose was used as a control diet for each level of
dietary fructose fed to pregnant rat dams.
22

(
(~
(
CHAPTER 2: MATERIALS AND METHODS
DI ET FORMULATION
General principles
The formulation of a basal carbohydrate free diet for
pregnant rat dams was adapted from work done by Koski et al
(1986). These diets are based on the concept that glucose
must be the first limiting nutrient. Prote in is minimally
adequate to supply the levels of prote in , ni trogen and
essential amine acids normally required by the carbohydrate
sufficient rat and not in excess ta provide supplementary
glucogenic precursors that would reduce the severity of the
attainable carbohydrate deficiency. As a result, the major
dietary component of a carbohydrate-restricted diet is lipid.
However, two lipid choices, that differentially affect
carbohydrate metabolism, can be selected. Carbohydrate
restricted diets with minimal but adequate prote in can be
formulated using ei ther intact triglyceride or food grade
fatty acids. The use of triglyceride-rich diets preserves the
glycerol component, which can act as a glucose precursor, and
produces a less severe carbohydrate deficiency than the food
grade oleic acid diets which lack the glucose producing
glycerol moiety. Consequently consideration of the glucose
equivalents in any carbohydrate restricted diet i5 important.
Our rationale permits us to quantify glucose equivalents
recognizing that any glucogenic amino acids provided by a
supplementary source of protein, and any glycerol provided by
23

-supplementary lipid, will have the same effect as the amount
of glucose which can be derived metabolically from them.
Calculation of glucose equivalents
The term "glucose equivalent" used in this thesis refers
to the potential glucose yield from the qlycerol moiety of the
triglyceride and potential glucose yield from glycogenic amine
acids of proteine Since glycerol and the glucogenic amine
acids are precursors of glucose particularly under the
conditions where the metabolic machinery is geared to favor
gluconeogenesis as it is in the carbohydrate-free diet, it
becomes important to calculate precisely their respective
glucogenic potential. In the calculation of the glucose
equivalent of amino acids, it is assumed that one mole of
glucogenic and variable glucogenic amine acids (including
serine, threonine and valine) could potentially yield one-half
a mole of glucose, with the exception of glycine which is
assumed to yield one quarter of a mole of glucose
(Karimzadegan et al 1979; Akrabawia and Hill 1970). The
assumption has been further substantiated by the results of
a computer based method for the estimation of energy from
amine acids and protein (Schulz 1975). Glucose equivalents
that could be derived from the glycerol moiety are calculated
based on the observation that the glycerol moiety is 10% by
weight of the intact triglyer1cle and is 90-95% digestable
24

f J
(
(Brambila and Hill 1966; Renner and Hill 1961; Karimzadegan,
Clifford and Hill 1979).
To the basal carbohydrate free diets, graded levels of
glucose or fructose can be added. The metabolizable energy
of fructose is considered to be identical to glucose. The
heat of combustion of these two monosaccharides is very
similar at 2SoC with fructose at 672.0 vs glucose at 669.94
kg cal/g molecular weight (Handbook of Chemistry and Physics
1986-7). In addition, Renner (1966) and Karimzadegan (1979)
have both determined that fructose is as effective as glucose
in stimulating growth and reducing plasma ketones in chicks
and weanling rats respectively. This suggests strongly that
metabolically, fructose is used as effectively as glucose, and
that the metabolizable energy of the two sugars is the same.
Diet Selection
Graded levels of carbohydrate were fed to the rats using
triglyceride-based diets. Triglyceride was chosen as the
lipid base because although this lipid imposes a less severe
carbohydrate restriction upon the dams than a fatty acid based
diet, it serves as a more natural source of fat in the diets.
Most dietary lipid from natural sources occur as triglyceride
and not as fatty acids. The calorie density of food grade
oleic acid, which is used in the formulation of fatty acid
based diets, is 8.8 kcaljg. On the other hand, soybean oil,
used in the triglyceride-based diets, has a calorie density
25

of 9.24 kcaljg (Renner and Hill 1958). These numbers suggest
that the triglyceride-based diet is more easily digested and
metabolized. Therefore information gained from the
investigation of triglyeride-based diets creates a less
artificial situation as the stress imposed by the fatty acid
based diets is not present.
The levels of dietary
triglyceride-based diets were
carbohydrate
0, 4, 12
chosen
and 60%.
for the
These
concentrations of carbohydrate have been used in prev ious
investigations (Koski et al 1986; Koski and Hill 1986), except
that the control diet used by Koski contained 62%
carbohydrate.
significant.
This difference is not considered to be
Three different diets with similar levels of glucose
equivalents were also compared. These were: (1) 4% glucose,
fatty acid-based; (2) 4% fructose, fatty acid-basedi and (3)
0% carbohydrate, triglyceride based. These diets contain,
respectively, 4% glucose, fructose and glycerol. Therefore
these diets contain similar quantities of glucose equivalents.
This allows the examination of the essentiality of glucose and
the ability of fructose and glycerol to replace glucose during
pregnancy. Only fatty acid based diets permit this type of
investigation into the essentiality of glucose because
triglyceride-based diets provide glycerol and thus introdu~e
two sources of glucose equivalents to the diet, glucose or
fructose and glycerol. Fatty acid-based diets provide only
26

r 4
glucose or fructose as a gluconeogenic precursor. At 4%
carbohydrate, these diets are approximately equivalent to the
0% carbohydrate, triglyceride-based diet which contains close
to 4% glycerol.
Diet composition
The diets are described in Table II-1.
Diets were formulated on an equicaloric basis. Each diet
was calculated to conta in 4.15 kcal of metabolizable energy
(ME) per gram dry matter. Supplements of glucose or fructose
were added to the carbohydrate-restricted diet to replace an
equal weight of (a) an equicaloric amount of oleic acid or
triglyceride plus (b) a complementary amount of cellulose to
make up the weight of the supplement (Table 1I-3). The total
metabolizable energy supplied by each diet as weIl as the
relative calorie contribution of the individual dietary
ingredients were estimated on the basis of metabolizable
energy values obtained either from the literature or estimated
from their respecti ve heats of combustion and percentage
absorbability (Table II-2).
It must be mentioned that the food grade oleic acid used
in the experiments was not pure and contained the essential
fatty acids linoleic and linolenic acids. It was estimated
that the high amount of food grade oleic acid (ranging from
34 to 69%) that was used plus the 5% soy oil would meet the
essential fatty acid requirement for linoleic acid.
27
The other component which varied amoung the diets was
cellulose. In the control diet there was 5% cellulose pr~sent
which is considered to be the satisfactory level of fiber in
the diet (NRC 1978). The quantities of protein, vitamins and
mineraIs were held constant for each diet.
The essential amine acids were supplied by 11% caseine
The percent protein in the casein was detcrmined by the
Kjeldahl procedure (AOAC, 1984). A total of 28 different
samples were do ne on four different days (see Table II-9).
The overall average was 83.86 with a range from 80.9 to 90.6.
During one of the runs a prote in standard was also analyzed
by the Kjeldahl procedure and the amount of protein was
underestimated by 3.5%. Therefore the average of 83.86%
prote in was multiplied by a factor of 1.035 in order to
compensate for the apparent loss of protein by the method
used. From this factor we estimated that the percent protein
in the casein sample was 86.45%.
In the equation shown above the percent nitrogen of the
case in prote in was presumed to be 16%. However, the ICN
Biomedical Inc. stated that in this casein the percent
nitrogen was 14.9 even though it was high-nitrogen caseine
We decided to still use the above equation in order that the
percent protein not be underestimated. It was critical that
the animaIs not be fed ù protein deficient diet. A slight
overestimation of the amount of protein present in the diet
would not yield more than half a glucose equivalent. We felt
28
(
(
confident that the percent prote in was not underestimated
because: 1) the percent nitrogen in the case in was less than
that used in the calculations and therefore protein was
overestimated: and 2) four samples were run by an automatic
Kelfast method and the percent prote in was determined to be
89.18%. Therefore we felt that 86.45 (% protein in casein)
was a reasonable number to use as i t would not resul t in a
protein deficient diet and it would not produce a diet with
substantial extra gluconeogenic precursors.
Vitamins were added liberally (approximately four times
the NRC requirements for the water soluble and 1.5-2 times
the NRC requirements for the fat soluble). These
concentrations would allow the diet to provide ample vitamins
to the dams who had a lower food intake than the control
animals. Based on additional pertinent information, the
following modifications were made. Since the dietary
requirement for choline is influenced by the lipid content of
the diet (Best et al 1954; Patek et al 1966; Salmon and
Newberne 1962: Zaki et al 1965) it has been suggested that
the choline content of high fat diets be increased (NRC 1978) .
In adequate diets, which provide 4 to 4.5 kcal/g, the
requirement is approximately 0.1%. However, in high fat diets
that contain 20% or more fat or are low in methionine,
addition of choline up to 0.4% May be required. Consequently,
the higher value for choline was added to the diets.
29
ft

...... -
-
The salt mixture (Tables 1I-6, 11-7 and 1I-8) was devised
by Koski and Hill (1986) and was based on Bernhardt and
Tomarelli (1966) and guidelines established by AIN's Ad Hoc
committee on nutrition standards (AIN 1977). The salt mix was
added ~t a dietary level of 5.5%. In general, each essential
mineraI nutrient was provided at a dietary 1evel twice that
estimated as the requirement for gestation by NRC. Exceptions
were as follows. Values for calcium and phosphorus were
chosen based on the work by Cox and Imboden (1936), such that
the calcium value was 1.2 times the phosphorus value.
Manganese and zinc values corresponded to values reported by
Keen and colleagues (1983) to have historically demonstrated
adequate reproductive performance. The copper value was
chosen in excess of 9 ppm since reports have indicated values
below this may be inadequ~te for maintaining optimal copper
levels in the weanling pup (Cerelewski 1979). Additionally,
because Waibel and colleagues (1954) have reported destruction
of thiamine by dibasic potassium phosphate and calcium
carhonate, these compounds were eliminated from the mineraI
mix formulation. The composition and formulation of the
vitamin mixture are given in Tables 11-4 and II-S,
respecti vely. In addition to NP.~ requirements and the above
modifications, molybdenum was added to prote ct the animaIs
from any possible mo1ybdenum deficiency al though there is no
requirement according to the NRC (1978) • FinaIly,
supplementary sodium bicarbonate was added at 1% dietary level
30
( to correct for any metabolic acidosis that might arise from
feedinq a carbohydrate-free diet (Lumijarvi and Hill,
unpublished) •
Diet preparation
Diets were mixed in two stages. All ingredients except
for soybean oil and oleic acid were mixed. Then the dietary
fat was added to complete the diet and this was thoroughly
mixed.
EXPERXHENTAL ANIMALS
Animal Car.
Female rats of the Sprague-Dawley strain were used in
all experiments. The rats (180-200 qrams) were time-bred at
the Charles River Inc., st. Constant, Quebec and they arrived
on day 0 or day l of the pregnancy. Upon arrival, the
pregnant rats were housed in individual suspended wire sereen
cages and were fed the experimental diet to which they were
randomly assigned (ranging from 10 to 17 per diet). Water and
experimental diets were fed ad libitum. Rats were given diets
in stainless steel cups and water was provided from individual
plastic bottles. Individual body weights and food intake were
measured every second or third day. Food spillage was
recorded. The rats were maintained in a tempe rature
controlled room at 20°C. Fluorescent lighting was provided
31
ft

...... , -
-
.......
automatically for a period of 12 hours daily from 7 am te 7
pm.
Dams were delivered of fetuses by caesarian section (C
section) on day 21 of gestation. Day 1 represented for dams
the day after they were time-bred.
Tissue Collection
AlI dams were killed in a post-absorptive (fed) state
upon termination of the feeding periode The dams were
anaesthetized with Ketamine-HCI (Vetalar 100 mg/ml Parke
Davis) injected at a levei of 30 mg/kg into the jugular region
to avoid anaesthetizing the fetuses. MaternaI plasma (5-7
mls) was wi thdrawn by cardiac puncture.
centrifuged and the plasma stored frozen
AlI blood was
until analyzed.
FOllowing cardiac puncture the abdomen was opened and the
liver was removed, freeze-ciamped and kept frozen at -80°C.
Uteri were removed from the abdomen but kept intact. Amniotic
fluid was collected with a tuberculin (lcc, 27G) syringe and
th en frozen at -20°C. Individual fetuses with their attached
placentas were removed from the mother. AlI uteri were
examined for implantation and resorption si tes.
Fetuses were killed by exsanguination. Fetal blood was
obtained from the axillary artery via capillary tubes. The
blood was centrifuged and the plasma stored frozen at -20°C
until analyzed. Each fetal liver was removed, frozen in
liquid air and stored at -80°C •
32

Calculation of Food Intake
The food intake for each animal was calculated on the
even days, that is days 2, 4, 6, etc. These days were chosen
because the first values for food intake can not be determined
until day 2, as rats were recei ved at the end of day 0 or day
1. AIso, food intake affects the weight gain of an animal the
day after and therefore these days are staggered against the
days on which weight gain was calculated, which were days 1,
3, 5, etc.
We received rats at the beginning of day 1 or 2,
immediately after or one day after the night of breeding.
The days were considered to begin in the morning because,
usually, the rats at this time of day were delivered, fed and
killed. Though rats were sometimes fed near the end of the
day, cumulative food intake was not different among the diets.
Selection criteria
Rats of aIl diets were excluded for the following reasons:
1) not pregnant
2) escape of dam from cage
3) rejection of diet by dam
4) d~ath of dam before C-section
5) delivery of one or more pups before C-section
6) number of pups less than 8 per dam
7) pups present or concentrated in one uterine horn
33

-
-.....
In addition, rats in the control, 60% glucose diet were
excluded if the resorption rate was greater than 5%.
The final number of dams used in each dietary treatment ranged
from 7 to 10.
ANALYTICAL PROCEDURES
Livar Glycoqan
The determination of maternaI and fetal liver glycogen
was based on the method of Lo et al (1970) with the following
modifications: 1) a total of 1 ml of KOH saturated with Na2S04
was added to the sample before boiling, 400 ~l while frozen
and, after weighing, 600 J,lol; and 2) the samples were
centrifuged at 4000 rpm.
Plasma and Amniotic Fluid Glucose
MaternaI and fetal plasma glucose and amniotic fluid
glucose were measured by hexokinase determination (Sigma, St.
Louis) using the Abbott VP Super System (Irving, Texas).
Glucose was phosphorylated to glucose-6-phosphate (G6P) by
hexokinase. G6P was then oxidized to 6-phosphogluconate by
G6P dehydrogenase with a concomitant reduction of NAD to NADH.
NADH had an absorption maximum at 340 nm. The increase in
absorbance at 340 nm was proportional to the glucose
concentration. The procedure is similar to that described by
Bondar and Mead (1974).
34

(
(~
(
Plasma and Amniotic Fluid Lactate
Maternal and fetal plasma lactate and amniotic fluid
lactate were measured by lactate dehydrogenase determination
(Sigma, st. Louis) using the Abbott VP Super System (Irving,
Texas) • The plasma was deproteinized after thawing by
perchloric acid using a 1:1 ratio of 10% perchloric acid and
plasma. Lactate dehydrogenase, in the presence of excess NAD,
converts lactate to pyruvate and pyruvate is then trapped wi th
hydrazine. At the same time NAD i5 reduced to NADH. The
increased absorbance at 340 nm due to NA OH formation becomes
a measure of the lactate originally present. This procedure
is based on the procedure of Henry (1968).
Plasma Triqlyceride
Maternal and fetal plasma triglyceride was measured by
enzymatic determination (Sigma, st. Louis) using the Abbott
VP Super System (Irving, Texas). Triglycerides were
hydrolyzed by lipoprotein lipase to glycerol and free fatty
acids. The glycerol was phosphorylated by glycerol kinase to
form glycerol-l-phasphate which was oxidized ta
dihydroxyacetone phosphate, reducing NAD to NADH. NADH was
then oxidized with the concomitant reduction of 2-[p
iodophenyl)-3-p-nitrophenyl-S-phenyltetrazolium chloride to
formazan which has an absorbance maximum at 500 nm. The
intensity of color production was proportional ta the
35
.

,~ t' , $' -
triglyceride concentration in the sample. The procedure is
a modification of Bucolo and David (1973).
Liver Lipid
The lipid content of the maternaI livers was determined
by the Roese-Gottlieb method (AOAC, 1984).
Plasma and Amniotie Pluid Urie Acid
MaternaI and fetal plasma uric acid and amniotic fluid
uric acid were measured by enzymatic determination (Sigma,
st. Louis) using the Abbott VP Super System (Irving, Texas).
uric acid was oxidized by uricase to allantoin, producing
hydrogen peroxide. Hydrogen peroxide reacted in the presence
of peroxidase with 4-aminoantipyrine and 3, 5-dichloro-2-
hydroxybenzenesulfonate to form a quinoneimine dye wi th an
absorbance maximum at 520 nm. The intensity of color
production was proportional to the uric acid concentration in
the sample. The procedure was similar to the method of
Fossati et al (1980).
Plasma and Amniotic Pluid Urea Nitroqen
MaternaI plasma and amniotic fluid urea ni trogen were
measured by enzymatic determination (Sigma, st. Louis) using .
the Abbott VP Super System (Irving, Texas). Urea was
hydrolyzed by urease to ammonia and carbon dio>..ide. The
36

(
ammonia served to aminate a-ketogluturate to glutamate with
the concurrent oxidation of NADH to NAD. NADH had an
absorption maximum at 340 nm. The decrease in absorbance at
340 nm was proportional to the urea nitrogen concentration.
The procedure is based on the procedure of Talke and Schubert
(1965) •
Amniotic Plui4 Ammonia
Amniotic fluid ammonia was measured by glutamate
dehydrogenase determination (Sigma, st. Louis) using the
Abbott VP Super System (Irving, Texas). Ammonia aminates 2-
oxoglutarate with the concomitant reduction of NADH to NAD.
NADH had an absorption maximum at 340 nm. The decrease in
absorbance at 340 nm was proportional to the urea nitrogen
concentration. This method is based on the procedure of Oewan
(1938) •
STATISTICAL ANALYSIS
The analysis was divided into two protocols:
1) Triqlycerida ~ased diets:
The experimental design demanded a twa-way analysis of
variance, as four levels of carbohydrate (0%, 4%, 12%, 60%)
and two sources of carbohydrate (fructose or glucose) were
chosen. In the command statements summarized in Appendix 1,
CHOL was designated equivalent to carbohydrate levels in the
diet and CHOS was designated equivalent ta the source af
37

-
dietary carb~hydrate. Initially, the dams or fetuses in the
0% carbohydrate diet were randomly divided into two groups so
a 4x2 factorial design could be done. It was required that
no differences would exist between the means resulting from
this artificial division. The conunands used are given in
Appendix 1. AlI maternal data, amniotic fluid data ana fetal
data when there was one pooled fetal value (of 1-3 fetuses)
per dam, were analyzed by this 4x2 factorial design; all 0%
were regrouped and treated as one group in the presentation
of the resul ts •
If an interaction between level and source of
carbohydrate occurred, then a different set of contrasts was
used (given in Appendix 1) because the main effects could not
be analyzed separately when an interaction was pre::;ent. This
occurred with maternaI liver weight.
When the fetal data was recorded by individual fetus,
Le. fetal weight, placental weight, fetal-placental unit
weight and fetal glycogen, then the data was nested (Appendix
1). The data was examined by individual fetusi however the
variability of the data was attributed to the litter, not the
individual fetus. Contrasts were done on this nested data and
these F-values had to be estimated using hand calculations
because the SAS program declared these contrasts non
estimatable as SAS only handles fixed observations, which the
dams were note The hand calculation for the F-values is given
in Appendix 1.
38

{
(,
,(
Liver lipid were analyzed using the t-test because only
two diets ha~ data for this parameter, 60% glucose and 60%
fructose. The commands are given in the Appendix.
2) 4% glucose equivalent dieta:
The experimental design demanded a one-way analysis of
variance, as three 4% glucose equivalent diets were chosen.
CHas was designated equivalent to the source of dietary
carbohydrate or glucosE" equivalent (glucose, fructose or
lipid-glycerol). The commands used are given in Appendix 1.
This set of commands was used with aIl maternaI data, amniotic
fluid data and the fetal data when there was one pooled fetal
value (of 1-3 fetuses) per dam. When the fetal data was
recorded by individual fetus, Le. fetal weight, placental
weight, fetal-placental unit weight and fetal glycogen, then
the data was nested (Appendix 1). The data was examined by
fetus: however the variability of the data was attributed te
the litter.
A 4x1 analysis of variance was also done to compare the
three 4% glucose equivalent diets to the 60% glucose control
diet (Appendix 1). Here, CHOS was designated equivalent te
the diet, be it one of the 4% equivalent diets or the control
diet. This allowed us to evaluate whether the three 4%
glucose equivalent diets differed significantly from the
control diet.
39
ft

• !
;.,.;
--
Table 11-1 Co.position of t~iglyceride and f.tty acid based carbohydrate restricted diets
Carbohvdrate-restricted Ingredjents Control Triglyceride Based Fatty AC1d Based
2 Carbohydrate
. l3 Soy 01
l · . d 4 o elc aCI
5 Cellulose
6 Casein
Vitamin
Mineral
. 7 mlX
. 8 mlx
Meth i on i ne
Sodium bicarbonate
Weight (g) 9 ME (kcal/g)
g
60
16
5
11. 0
1.2
5.5
0.34
1.0
100.04 4.15
1 . h b . Dry welg t aSlS (grams).
9
o
39.64
41.36
11.0
1.2
5.5
0.34
1 .0
100.04 4.15
9 Il
4 12
38.06 34.91
38.94 34.09
11 .0 11 • 0
1 .2 1 .2
5.5 5.5
0.34 0.34
1 .0 1 .0
100.04 100.04 4.15 4 . 15
9
4
5
34.69
37.31
11 .0
1.2
5.5
0.34
1 .0
100.04 4.15
2Dextrose Canhydrous), n:N Biochemicals Canada Ltd., Montréal, Québec or D-fructose, ICN Biochemicals Canada Ltd., Montréal, Québec.
3 Degummed soybean 0 il, Canada Packers 1 nc., Montréa l, Québec.
4Single distilled oleic acid: 70X C18:1, 8X C18:2, 1X C18:3, 7X C16:1 and 8X mixture of C14:0-C18:0, Canada Packers Inc., Misslssauga, Ontario.
5 Alphacel, ICN Biochemicals Canada Ltd., Montréal, Québec.
6High-nitrogen casein, ICN Biochemicals Canada Ltd., Montréal, Québec contains 86.5X protain (N x 6.25) or 89.1X (Nx6.71).
7 See Tables 1-4 and 1-5.
8 Su Tables 1-6, 1-7 and 1-8.
9 See Tables 1-2 and 1-3 for ME of various ingredients and subst1tut10n rates.
40

t:
(
Table 11-2 Metabolizable energy value of dietary ingredients'
Ingredient
Glucose
2 Fructose
Casein
Amino acid
Soyb.an oil
Qlelc aeid
Starch
HE
kcal/g dry matter
3.64
3.64
4.45
4.00
9.24
8.80
4.00
Reference/assumption
(see Anderson et al., 1958)
(Renner, 1966; Karimzegan et al 1979; Handbook of Chemistry and Physics, 67th ed)
(see Kriss and Hiller, 1934)
assuming complete absorption
(see Renner and Hill, 1958; Young, 1961)
(see Renner and Hill, 1958)
assuming 95% digestion
1Metabolizable energy values were obtained from Koski (Ph.D. Dissertation, University of California, Davis, California,
2 1985 ). See discussion.
41
ft

......
-.......
Table 11-3 Equicaloric substitutions of dietary supple.ents f~r oleic acid and cellulose and triglyceride and cellulose"
Supplement
Glucose
Fructose
Casein
Amino acid
Corn starch
Amount of supplement
9
1. 00
1. 00
1. 00
1. 00
1. 00
1 Dry weight basis.
Substituted for Substituted for
Oleic acid Cellulose TG Cellulose
9 9 9 9
0.414 0.586 .394 .606
0.414 0.586 .394 .606
0.506 0.494 .481 .518
0.454 0.546 .433 .567
0.454 0.546 .433 .567
2 . The metabolizable energy (ME) values for dietary ingredients are shown in Table 1-2.
42

(
(
Table 11-4
Ingredient mg/kg diet
Ni ae i n 100
Calcium pantothenate 32
RibofLavln 12
Pyridoxine hvdrochloride 24
Thiamin hydrochloride '6
Folaein 4
Biotin
Cyanocobalamine (MW 1355.2) 0.2
Alpha- toeopheryl 2
60 acatate
Menaquinone 0.6
Choline chloride 4000
Chollealei ferol] 1500 lU
Vitalllin pa'mitete 4
8000 A lU
NRC requirtment mg/kg diet
20.00
8.0
3.0
6.0
4.0
1.0
0.05
30.0
0.05
tOoO
1000 lU
4000 [ U
Supplier
ICN
Anachemia
[CN
[CN
[CN
ICN
ICN
[CN
Anachemia
[CN
ICN
ICN
[CN
'Nutrition.' Requirements of Laboratorv Animals. Third Revised Edition NRC. National Academy of Sciences, washington, D.C., 1918.
2supplied as 250 lU/gram dl'alpha-tocopheryl acetate, Hoffman LaRoche, [ne., NutLev, NJ.
3supplied as 100,000 lU of vitamin 03
/ 9 , ICN Biochemicals Canada Ltd., Montréal, Québec.
4supplied as 250,000 lU/gram, ICN Biochemieals Canada Ltd., Montréal, Québec.
43
.

Teble 11-5 -Ingredient Grams g/kg diet
(A) fIt soluble
Vitelllin A plllllitate 6.1
Chollcllci ferol .292
Alphl-tocopheryl ecetete 9.1
Menequinone 0.120
Cellulose 1
784·38 Total 800.00 4
(B) Water soluble
Nilcin 20.0
CIlciu .. pentoth.nete 6.4
~
Ribofllvin 2.4 .... Pyridoxine hydrochloride 4.8
Thilllline hydrochloride 3.2
follcin 0.8
Biotin 0.2
Cyanocobelallline 40.0 mg
Butylated hydroxytoluene 20.0
Cellulose 1
l.2.L.l. Total 800.0 4
(C) !;holine !;hloride 4
1 Alphacel, ICN Nutritional Biochemicels Canada Ltd., Montréal, Québec.
44

(
(:
(
---------------------------------------------------------------------
1 nlredlent I/kll SIl t
II/kg dlet a5.5" Supplier
---------------------------------------------------------------------CaMp04 480.72 26.44 Sigma
KMC03 370.0 20.35 An.chemla
NaCI 51. 27 2.82 Il
MgS04 79.63 4.38 Il
crKCs04)2012H20 0.1163 .0064 Il
cuc03
OCUCOM)OM2
O 0.3600 .0198 Il
K!03 .0109 .0006 Il
FeS04
0 7H2
0 7.147 .3931 Il
MnC03 1.9018 .1046 \1
znco3 3.1381 .1726 Fisher
Na2
s.03 0.0091 .0005 leN
NaMo04
0 2H2
0 0.3218 .0177 Anachemia
KF o 2H2
O 0.2018 .0111 Il
Subtotal 994.46 54.71
Cci tric .cid) 5.53 .30 leN
Totll 1000.08 54.99 • 5.5"
---------------------------------------------------------------------1 2See Tlble 1-7 for elemental composition of salt mixture.
See Tlble 1-8 for elementll composition of micro elements.
45
ft

..... ~
Table 11-1
Ingredient (MW)
CaHPO (136j6)
ICHC03
(100.11)
Mg50 (120~38)
Mfcroalements
mg/100 g diet
2644
2035
282
438
(5399)
100
C. Mg Na K p Cl 5
•.••..••..•.• mg!100 g diet •..........
119 600
794
111 1 71
89 1 1 7
-----------------------------------------------------------------Tota l
1 5499 119 89 111 794 600 111 1 17 Ca) 5.49X
NRC·Reqt.1978 (b) 2
500 40 50 360 490 50 30
a:b 1.6 2.2 2.2 2.2 1.2 3.4 3.9
1Not including additional sodium as NaHC03
at a rate of 1 9 per 100 g diet ln order to correct the metabollc acidosis resulting
2fro. f •• ding lON carbohydrate diets. Nutrient Requirements of Laboratory Animals. Third Revised Edition. National Academy of Sciences, Washington, D.C., 1978.
46
(
{
(
, '
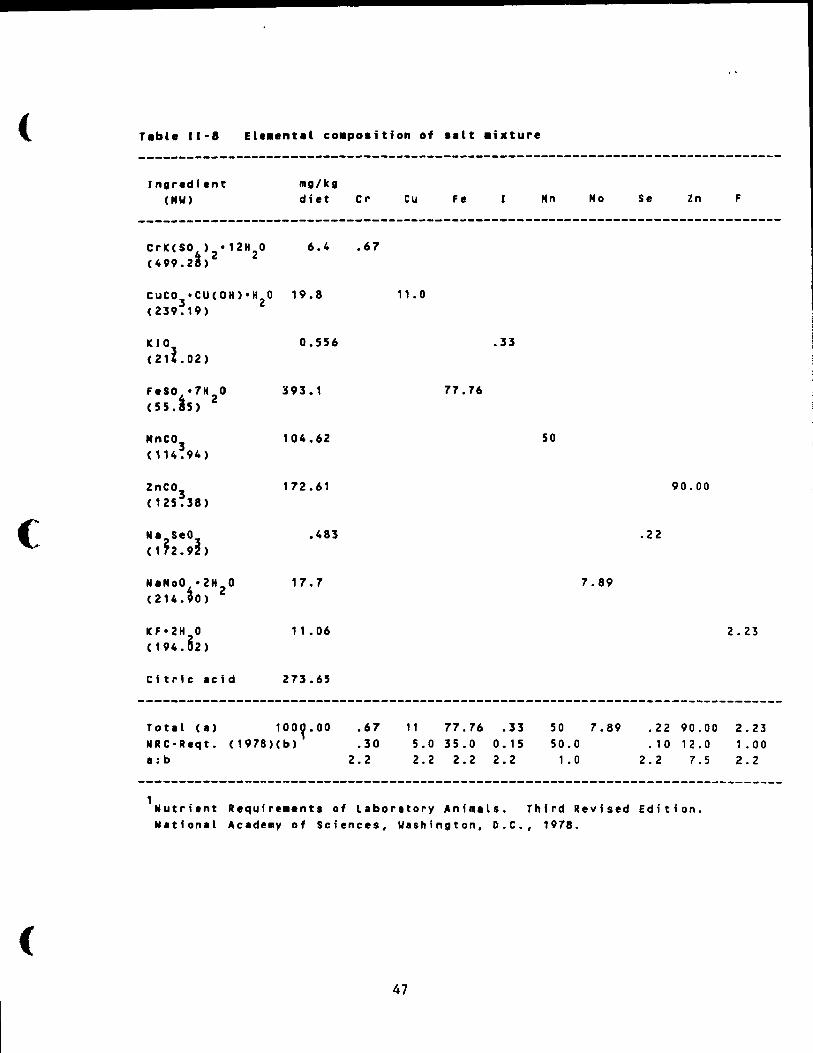
Table 11-8
--------------------------------------------------------------------------------Inllredient
(MW) mil/kil diet Cr Cu Fe Mn Mo Se Zn F
--------------------------------------------------------------------------------crK(S°i)2012H20 6.4 (499.2 )
CUC03
"CU(OH)"HZ
O 19.8 (239.19)
Kro (21LOZ)
0.556
Fesof7H 2 O ]93.1 (55. 5)
MnC03
104.62 (114.94)
znco3
172.61 (125.38)
Na SeO (1J2.9~)
.483
NaMoO*o2H 2 0 11.7 (214. 0)
KF o2H 0 (194J2)
11 .06
tttric Icid 273.65
Totll (1) 100Y,00 NRC-Reqt. (1978)(b) .:b
.67
.67
.30 2.2
11. 0
77.76
11 77.76 5.0 35.0 2.2 2.2
.33
.33 0_ 15 2.2
50
50 50.0
1 .0
7.89
7.89
90.00
.22
.22 90.00
.10 12.0 2.2 7.5
1Nutrient R.quirementl of Laboratory Animill. Third Revised Edition. Nltionll ACldemy of Sciences, washington, D.C., 1978.
47
2.23
2.23 1 .00 2.2

.,..
-.....
Calculated prote,n content of ICI ca •• in accordinl to Kjeld.hl analy •••
Date 25/05/88 26/05/88 27/05/88 29/05/88
X protein 87.54- 82.90 - 89. 15- 82.08 84.76 83.20 81.39 84.62-82.68 83.86 81.87 81.57-86.11 84.02 80.91 - 83.60 84.94 84.53 83.38 82.59 83.45 81.05
90.67- 83.77 84.85 81.58 84.70 84.16
M •• n (6) 84.77*SEM (9) 84.67* (9) 83.03* (4) 82.97*
Ov.rall Mean: (4) 83.86"*
48

(
(
CHAPTER XII: RESULTS
MATERNAL PARAMETERS
Maternal Pood Intaka and Body weight Gain:
Cumulative food intake and body weight gain were analyzed
and the data is presented in Tables 3.1-3.2. The daily
patterns of food intake and weight gain are shown in Figures
3.1-3.6.
Triglyceride-based di.ts:
Cumulative food intake during the entire pregnancy did
not differ among the triglyceride based diets (Table 3.1;
Figures 3.1-3.2). However, in the last two days of gestation
(days 20 and 21) there was a significant effect of the level
of carbohydrate (AOV: p < 0.0001; Table 3.1; Figures 3.1 and
3.2); as the carbohydrate content of the maternaI diet
increased, so did the food intake of the pregnant rat. The
source of carbohydrate had no effect on food intake during
this two day periode
MaternaI weight gain increased significantly with
increasing levels of either carbohydrate fed throughout
pregnancy (AOV: p < 0.0001; Table 1; Figures 3.3-3.4) and for
the last two days of gestation (AOV: p < 0.0001; Table 3.1;
Figures 3.3-3.4). No differences in weight gain could be
attributed to differences in the source of dietary
carbohydrate (glucose vs fructose).
49

., ..
-
-
4% Equivalent di.ta:
Among the four percent equivalent diets, there were
significant differences in cumulative food intake (AOV: p <
0.02; Table 3.2; Figure 3.5). When lipid-glycerol was the
source of glucose equivalent (Le. the 0% carbohydrate
triglyceride-based diet or 0% C-TG), the food intake of dams
ingesting this diet was significantly higher than those
ingesting the 4% fructose fatty acid-based diet (4% F-FA).
Food intake of rats fed the 4% glucose fatty acid-based diet
(4% G-FA) was interrnediate, and did not significantly differ
from either 0% C-TG or 4% F-FA. Food intake of the rats
during the last two days of pregnancy did not differ among
the three 4% glucose equivalent diets (Table 3.2).
MaternaI weight gain by day 21 of pregnancy differed
among the three diets (p < 0.05; Table 3.2; Figure 3.6). Rats
ingesting the 4% G-FA diet gained the greatest weight while
those ingesting the 4% F-FA diet gained the least. The
difference between these two diets was significant. The
weight gain of rats on the 0% C-TG diet fell between the other
two diets and did not differ from either of them. During the
last two days of pregnancy the dams fed the three 4% glucose
equivalent diets lost weight and this 1055 did not differ
among the three diets(Table 3.2). Far bath cumulative food
intake and total weight gain, dams fed 4% F-FA had the lowest
values. Dams fed 4% G-FA and 0% C-TG did not differ
significantly from each other.
50

(
c
(
Dams fed the high carbohydrate, 60% glucose diet had
significantly greater food intake and weight gain th an the
three low carbohydrate, 4% glucose equivalent diets.
I.productive Performance:
Reproducti ve performance of the dams was measured by the
number of implantations, the resorption rate, the stillbirth
rate and the percent of live pups. The latter three values
are given as the percent of implantations. The data is
summarized on Tables 3.3-3.4.
Triqlyc.ride-based diets:
The source of carbohydrate had no significant effect upon
reproductive performance as measured by number of
implantations, resorption rate, stillbirth rate and percent
of live pups. Among the triglyceride-based diets, the number
of implantations did not differ significantly. However, the
resorption rate, stillbirth rate and percent live pups were ,
aIl affected by the level of carbohydrate in the diet (AOV:
p < 0.01, 0.0001, 0.0001, respectively; Table 3.3). The
resorption rate was greatest in the dams receiving 0%
carbohydrate, significantly less in dams on the 4%
carbohydrate diet and least in dams ingesting 12%
carbohydrate. Dams on the 60% carbohydrate diet had a
resorption rate which fell between those dams eating 4 and
12% carbohydrate and did not differ significantly from either.
However, dams fed the 12% carbohydrate diets had significantly
lower resorption rates than dams fed 4% carbohydrate. The
51

.....
.. ,
stillbirth rate was significantly greater in the dams on the
0% carbohydrate diet versus the other three levels of
carbohydrate which did not differ statistically in numbers of
stillbirths. The percent of live fetuses delivered by c-
section was least in the 0% carbohydrate fed dams. Dams fed
60% carbohydrate had a percentage of live pups which did not
differ significantly from either the 4 and 12% diets.
However, dams fed the 12% carbohydrate diets had a percent of
live pups significantly greater than dams fed the 4%
carbohydrate diets.
4% Equivalent dieta:
Among the dams fed the three 4% glucose equivalent diets,
there were no statistically significant differences in the
number of implantations or in the resorption rate (Table 3.4) •
However, statistical analysis showed significant differences
in the stillbirth rate (AOV: p < 0.05; Table 3.4) and the
percent of live fetuses born (AOV: p < 0.05; Table 3.4). The
dams ingesting the 0% C-TG diet had a statistically higher
resorption rate and lower percent of live fetuses than the two
fatty acid-based diets having 4% glucose or fructose. The
reproductive performances of aIl three 4% glucose equivalent
diets were compared to the control, 60% glucose diet which was
not significantly different.
Materna! Liver weight:
Maternal liver weight was measured as an absolute value
and calculated as a percent of total body weight. In
52

I( 1
(~
(
addition, for the two 60% carbohydrate, triglyceride-based
diets, liver lipid and water concentrations were determined.
The data is summarized in Tables 3.5-3.7 and Figures 3.7-3.8.
Triglyceride-baaed dieta:
MaternaI Iiver weight as an absolute value (Table 3.5;
Figure 3.7) was affected by the levei of carbohydrate (AOV:
p<O.OOOl), source of carbohydrate (AOV: p<0.0005) and by the
level x source of carbohydrate (AOV: p<O. 05). MaternaI liver
weight as a percent of body weight (Table 3.5; Figure 3.8) was
affected by the level of carbohydrate (AOV: p<O.OOOl), source
of carbohydrate (AOV: p<O.OOOl and by the level x source of
carbohydrate (AOV: p<O.OOOl). Therefore there was an
interaction between the level and type (i. e. glucose or
fructose) of dietary carbohydrate for both measurements of
maternaI liver weight. Because of this interaction,
interactive contrasts were done on the data to determine where
the significance of the interaction laYe The effect of the
type of dietary carbohydrate becomes significant only in the
dams fed 60% carbohydrate level, where dams fed diets
containing 60% fructose had higher liver weights than dams fed
60% glucose. However, this effect is not present in dams fed
lower concentrations of glucose and fructose. Figures 3.7 and
3.8 illustrate that the differences between dams fed glucose
and dams fed fructose are greatest at the 60% level where the
difference is significant. This is true for liver weight as
an absolute value and also as expressed as a percent of body
S3
-
-
weiqht. The livers of the dams fed 60% glucose and fructose
were further analyzed for lipid and water content, in an
attempt to discover the reason dams fed the high levels of
fructose have a greater liver weight than those fed glucose.
However, no significant differences between the two diets were
found in liver lipid, principally triglyceride, or water
content (student's t-test; Table 3.6). Glycogen content was
analyzed and is reported later (see MaternaI Carbohydrate
Metabolism) •
4% Bquivalent di.ta:
MaternaI liver weight was not affected by the source of
glucose equivalent (Table 3.7). The liver weight was not
significantly greater in the dams fed the 4% G-FA diet, versus
the dams fed the other two diets. MaternaI liver weight as
a percent of body weight was not affected by the source of
glucose equivalent.
Dams fed the high carbohydrate, 60% glucose diet had
liver weights, expressed as an absolute value, significantly
higher th an dams fed low carbohydrate, 4% glucose equivalent
diets. Expressed as a percent of the total body weight, the
liver weights of the 60% glucose fed dams were significantly
lower than the three 4% glucose equivalent diets.
MaternaI carbohydrate Metabolism:
The carbohydrate metabolism of the dam was examined by
measuring plasma glucose and liver glycogen. The data is
surnrnarized in Tables 3.8-3.9.
54

(
(
Triglyceride-based diets:
There were no significant differences in plasma glucose
among the triglyceride-based diets (Table 3.8). However,
there was a significant effect of the level of carbohydrate
upon maternaI liver glycogen (AOV: p < O.OOOli Table 3.8).
As the concentration of dietary glucose or fructose increased
so did the content Cl ~ maternaI li ver glycogen. Dams fed diets
containing 60% carbohydrate had glycogen levels significantly
higher than those fed 12% carbohydrate and these in turn were
significantly higher than dams fed 4 or 0% carbohydrate.
There were no significant differences in liver glycogen levels
between dams fed a and 4% carbohydrate. The effect of dietary
fructose or glucose upon maternaI glycogen concentrations was
not statictically significant. However, there was a trend for
the dams fed 60% fructose to have higher concentrations of
hepatic glycogen than dams fed 60% glucose.
4% Equivalent diets:
There were no significant differences in maternal plasma
glucose or liver glycogen among the 4% equivalent diets (Table
3.9) •
The high carbohydrate, 60% glucose fed dams did not have
plasma glucose concentrations different than the dams fed low
carbohydrate, 4% glucose equivalent dietsi however, the
content of liver glycogen in the high carbohdyrate fed dams
was significantly higher than dams fed very low carbohydrate
diets.
55

-
Maternal Lipid Metabolism:
The carbohydrate metabolism of the dam was examined by
measuring plasma triglycerides. The data is summarized in
Tables 3.8-3.9.
Triqlyceride-based diets:
There was a significant effect of the level of
carbohydrate upon maternal plasma triglyceride concentration
(AOV: p<O.OOOli Table 3.8), though no effect of the source
from carbohydrate. The dams fed the 4% carbohydrate diets
had significantly higher concentrations of plasma triglycet'ide
than dams fed the three other levels of carbohydrate, among
which there were no significant differences.
4% Equivalent diets:
The source of glucose equivalent affected the plasma
triglyceride concentration (AOV: p<O.Ol; Table 3.9) with 0%
C-TG dams displaying a significantly lower concentration of
plasma triglyceride than the two fatty acid-based diets having
4% glucose or fructose.
Dams fed high carbohydrate, 60% glucose diets had plasma
triglyceride levels significantly lower ~han aIl three dams
fed 4% glucose equivalent diets.
Maternal Plasma Lactate:
The data is summarized in Tables 3.10-3.11.
Triqlyceride-based diets:
Maternal plasma lactate concentration was affected by
the level of carbohydrate (AOV: p<O.OOOl; Table 3.10), but
56

(
(
(
not the source of carbohydrate. The lactate concentrations
were significantly greater in dams fed 12 and 60% carbohydrate
compared to those fed 0 and 4% carbohydrate.
4\ Equivalent diets:
The source of glucose equivalent at the 4% level did not
affect the concentration of lactate in the maternaI plasma
(see Table 3.11).
The high carbohydrate, 60% glucose fed dams had plasma
lactate leveis which were significantly higher than the dams
fed these very low carbohydrate diets.
Kat.rnal Plasma Ni tro(Jen:
MaternaI plasma uric acid and urea nitrogen were
measc~ed. The data is summarized in Tables 3.12-3.13.
Triqlyceride-based diets:
MaternaI plasma uric acid was affected by the level of
carbohydrate in the diet (AOV: p<O.01: Table 3.12) but not
the sourc~ of carbohydrate. Dams fed the 4% carbohydrat(·
diets had the greatest concentration of uric acid and this
was significantly greater than the dams fed the 0 and 60%
carbohydrate diets, though not different from the dams fed
12% carbohydrate. The latter dJ.et did not differ
significantly from any other diet. MaternaI plasma urea
ni trogen was affected by the level of carbohydrate in the diet
(AOV: p<O.0002; Table 3.12), though not the source of
carbohydrate. As the level of carbohydrate increased, the
concentration cf urea nitrogen in the plasma decreased. Dams
S7

....
fed 0% carbohydrate had plasma urea nitrogen levels
significantly higher than the other dams. Dams fed 4%
carbohydrate had plasma urea nitrogen levels significantly
greater than dams fed 60% carbohydrate, while the dams fed
12% carbohydrate diets had intermediate values which fell
between the 4% and 60% carbohydrate diets and did not differ
significantly from elther.
4% Equivalent:
MaternaI plasma uric acid was significantly affected by
the source of glucose equivalent (AOV: p<0.02i Table 3.13).
Dams fed the 4% G-FA diet had uric acid levels significantly
higher than dams fed 4% F-FA and 0% C-TG. The latter two
diets did not differ signifieantly. Maternal plasma urea
nitrogen leveis were not affected by the source of glucose
equivalent (Table 3.13).
Dams fed 60% glucose diets had plasma urie aeid and urea
nitrogen levels significantly lower than the dams fed the
three 4% glucose equivalent diets.
AMNIOTIC PLUID PARAMETERS
AmDiotic Pluid Glucose and Lactate:
The data is summarized in Tables 3.14-3.15.
Triqlyceride-based diets:
The concentration of amniotic fluid glucose was affected
by the level of earbohydrate in the diet (AOV: p<O. 0001; Table
3.14), but not by the source of carbohydrate. As the level
58

(
(
(
of carbohydrate increased, so did the concentration of
glucose. Dams fed 60% carbohydrate had amniotic fluid glucose
concentrations significantly greater than dams fed the other
diets. Dams fed 12% carbohydrate diets had glucose levels
significantly greater than dams fed 0% carbohydrate, while the
dams fed 4% carbohydrate fell between the 0 and 12%
carbohydrate diets and did not differ significantly from
either. Amniotic fluid lactate concentrations were affected
by the level of carbohydrate in the diet (AOV: p<O.Ol: Table
3.14), but not by the source of carbohydrate. The lactate
concentration in the amniotic fluid of dams fed 60%
carbohydrate diets was significantly greater than that of dams
fed 4 and 12% carbohydrate but was not significantly greater
than that of dams fed 0% carbohydrate. There were no
significant differences among dams fed 0, 4 or 12%
carbohydrate.
4% Equivalent di.ta:
The concentration of amniotic fluid glucose was nct
affected by the source of glucose equivalent at the 4% level
(Table 3.15). The concentration of amniotic fluid lactate
was not affected by the source of glucose equivalent at the
4% level (Table 3.15) .
The dams fed high carbohydrate, 60% carbohydrate diets
had amniotic fluid glucose levels significantly higher than
dams fed the low carbohydrate, 4% glucose equivalent diets.
The high carbohydrate fed dams did not have lactate
59
ft

... •
concentrations in the amniotic fluid that differed
significantly from the dams fed very low carbohydrate diets.
Amniotic Fluid Nitrogen:
The concentrations of uric acid, urea nitrogen and
anunonia were measured in the amniotic fluid. The data is
summarized in Tables 3.16-3.17.
Triqlyceride-base4 diets:
The concentration of amniotic fluid uric aeid was
affected by the level of carbohydrate (AOV: p<O. 01; Table
3.16), but not by the source of carbohydrate. As the level
of carbohydrate in the diet increased up to 12% the urie acid
concentration in the amniotic fluid decreased. Dams fed 0%
carbohydrate had a concentration of amniotic fluid urie acid
significantly greater than dams fed 4% earbohydrate which in
turn had significantly hig~er uric acid levels than dams fed
12 and 60% carbohydrate. There were no significant
differences between the uric acid amniotic fluid
concentrations of dams fed 12 and 60% carbohydrate. The urea
nitrogen concentration in the amniotic fluid was affected by
the level of carbohydrate (AOV: p<O.005; Table 3.16), but not
by the source of carbohydrate. The concentration was
significantly greater in the amniotic fluid of dams fed the
0% carbohydrate diet compared to the other three levels of
earbohydrate, among which there were no significant
differences. The amniotic fluid ammonia concentration was not
60

(
(
(
affected by the level or source of carbohydrate in the diet
(Table 3.16).
4% Equivalent di.ts:
The source of 4% glucose equivalent did not affect the
amniotic fluid uric acid, urea nitrogen or ammonia
concentration (Table 3.17).
Amniotic fluid uric acid levels were significantly lower
in dams fed the high carbohydrate, 60% glucose diet than those
fed any of the low carbohydrate, 4% glucose equivalent diets.
Dams fed the 60% glucose diet did not have values of urea
nitrogen and ammonia which differed from dams fed 4% glucose
equivalent diets.
FE'1'AL PARAME'1'ERS
Weigbt of the Fetus, Placenta and Fetal-Placental Unit:
The data is summarized in Tables 3.18-3.19.
Triqlyceride-based diets:
Among the triglyceride-based diets, fetal wei'~ht at day
21 of gestation was affected by the level of carbohydrate in
the diet (AOV: p<0.0001; Table 3.18) but not by the source of
carbohydrate. As the concentration of carbohydrate increased
in the diet, the fetal weight increased. The weights of
fetuses of dams fed 12 and 60% carbohydrate did not differ
from each other, but were significantly higher than fetal
weights of dams fed 4% carbohydrate which in turn were
significantly higher than fetal weights of dams fed 0%
61

........
-
---."
carbohydrate. The placental weight did not differ arnong the
triglyceride-based diets (Table 3.18). The weight of fetal
placental unit was affected by the level of dietary
carbohydrate (AOV: p < O.OOOli Table 3.18) but not by the
source of carbohydrate. The pattern of the fetal-placental
unit weights was exactly the sarne as that of the fetal weigt-.ts
described above.
4% Equivalent dieta:
Among the 4% glucose equivalent diets, aIl three weights
were affected by the source of glucose equivalent as follows
(see Table 3.19): fetal weight (AOV: p < 0.05), placental
weight (AOV: p < 0.02) and fetal-placental weight (AOV: p <
0.05). Dams fed 4% G-FA produced the greatest, while dams fed
4% F-FA produced the lowest, fetal, placental and and fetal
placental unit weights. The differences between the two fatty
acid-based diets were always significant. Dams fed 0% C-TG
had values for these three weights which fell between the
other two diets. The 0% C-TG fetal weight value was not
significantly different from those of either fatty acid-based
diet. The 0% C-TG values for the placental and fetal
placental unit did not differ significantly from those of dams
fed 4% F-FA and were significantly lower than those fed 4% G
FA.
These weights were also compared to those of dams fed
high carbohydrate, 60% glucose values. The weights of fetuses
and fetal-placental units of dams fed high carbohydrate diets
62

(
(
(,
were significantly higher than those of dams fed low
carbohydrate, 4% glucose equivalent diets. The placental
weights of dams fed high carbohydrate diets did not differ
from placentas of the dams fed very low c~rbohydrate diets.
letal Carbohydrate Mataboliam:
The carbohydrate metabolism of the fetus was examined by
measuring plasma glucose and liver glycogen.
summarized in Tables 3.20-3.21.
Triglyc.rid.-baa.d di.ta:
The data is
There were no significant differences in fetal plasma
glucose among the triglyceride-based diets. The fetal liver
glycogen concentrations were signlficantly affected by the
level of carbohydrate in the diet (AOV: p < o. 001; Table
3.20), but not by the source of carbohydrate. Fetuses of dams
fed 60% carbohydrate had glycogen levels significantly higheL
than those fed 12% carbohydrate which in turn had fetal
glycogen levels significantly higher than dams fed 0%
carbohydrate. The fetal liver glycogen levels of dams fed 4%
carbohydrate had values which fell in between dams fed a and
12% carbohydratn. and which were not significantly different
from either diet.
4% Equivalent diets:
There were no significant differences in fetal plasma
glucose or liver glycogen concentrations among the 4%
equivalent diets.
63
ft
1 1 'j i ,]
1
......
-....
The plasma glucose and liver glycogen levels of fetuses
of dams fed high carbohydrate, 60% glucose diets were
significantly higher than fetuses of dams fed 4 % glucose
equivalent diets.
'etal Lipi4 Metaboliam:
The lipid metabolism of the fetus was examined by
measuring plasma triglycerides.
Tables 3.20-3.21.
Triqlyc.ri4e-based di.ta:
The data is summari~ed in
There were no significant differences in fetal plasma
triqlycerides among the triglyceride-based diets.
4% Equivalent di.ts:
There were no significant differences in fetal plasma
triglycerides among the 4% equivalent diets.
Between the high carbohydrate, 60% glucose diet and the
low carbohydrate 4% glucose equivalent diets, there was no
significant difference in fetal plasma triglycerides.
retal Plasma Lactate:
The data is summarized in Tables 3.22-3.23.
Triqlyceri4e-base4 diets:
There were no significant differences in fetal plasma
lactate among the triglyceride-based diets.
4% Bquivalent diets:
There were no significant differences in fetal plasma
lactate among the 4% equivalent diets.
64
(
(
(
Between the high carbohydrate, 60% glucose diet and the
4% glucose equivalent diets, there was no significant
difference in fetal plasma lactate.
'.tal Plasma Orio Aoi4:
The data is summarized in Tables 3.24-3.25.
Triqlyc~rid.-based diets:
There were no significant differences in fetal plasma
urie acid among the triglyeeride-based diets.
4% Bquivalent 4i.ts:
There were no signifieant differences in fetal plasma
urie acid among the 4% equivalent diets.
Between the high carbohydrate, 60% glucose diet and the
low carbohydrate, 4% glucose equivalent diets, there was no
significant differenee in fetal plasma urie acid.
65
.

0-0-
e } t ~
Dietary Ievel of cartxhvdram Cart:xil~te 0 4 12 60
awilative food intaJœ, ql Gll.JCXJSe 34B±13 (9) 373±11 (10) 362±14 (9) 403±12 (10) Fructose 374±12 (9) 3Bo±14 (7) 378±11 (la) Glu + FIu7 348±13 (9) 373±9 (19) 37l±11 (16) 390±9 (20)
food intalœ CD daya 20 + 21, qI Glucose 13±3 (9) 2B±3 (10) 3l±3 (7) 33±3 (10) Fructose 24±3 (10) 34±3 (7) 33±3 (la) Glu + FIu7 l3±3 (9)a 26±2 (20)b 32±2 (14)C 33±2 (20)C
awilative w9't gain, q5 Glucose 65±5 (9) l16±7 (10) l28±7 (9) 15o±7 (10) Fructose 106±7 (10) l4o±8 (7) l46±7 (10) Glu + FIu7 65±5 (9)a 11l±5 (20)b l33±5 (16)C l48±5 (20)C
.. j'Pt gdn CD c:Iays 20 +21, g6 + Glucose -22-4 (9) 3±4 (10) 19±4 (9) 19±4 (la)
Fructose 2±4 (10) 15±4 (7) 2o±4 (10) Glu + FIu7 -22±4 (9)a 2±2 (20,b 17±3 (16)c 19±2 (20)c
lValues are means ± SEH. Humber in paœntheses equals nJlllbpr of dams. 2Means within each parameter havi.n.J different letter superscripts followin) the nllliler differ significantly (p<O.OS). 3-6significanoe of main effects fraD analysis of variance (MN): 3MN: leve1 of cart:rltyc\rate (NS); sc:w:oe of ~te (NS); leve1 x scuroe of carbahydrate (NS). 4101: leve1 of ~te (P<O.OOOl); soo.roe of carlJà1yàrate (NS); level x sooroe of carbahydrate (NS). SNN: level of cartx:lhydrate (p<O.OOOl); soorœ of cartdlydrate (NS); level x scurœ of caz1:dlydrate (NS). 6N:N: level of carlxb~te (p<O.OOOl); souroe of cart:d1}'drate (NS); level x san-ce of carbahydrate (NS). 7~ there was no significant effect of source of ca.rbOOydrate, the statistica1 analysis treated all qluoose ard fructose at ead"l leve1 of carlx:tlydrate as a si.n.Jle groop. '1herefore, the significance is reported for these gro.lp9d means.
t !
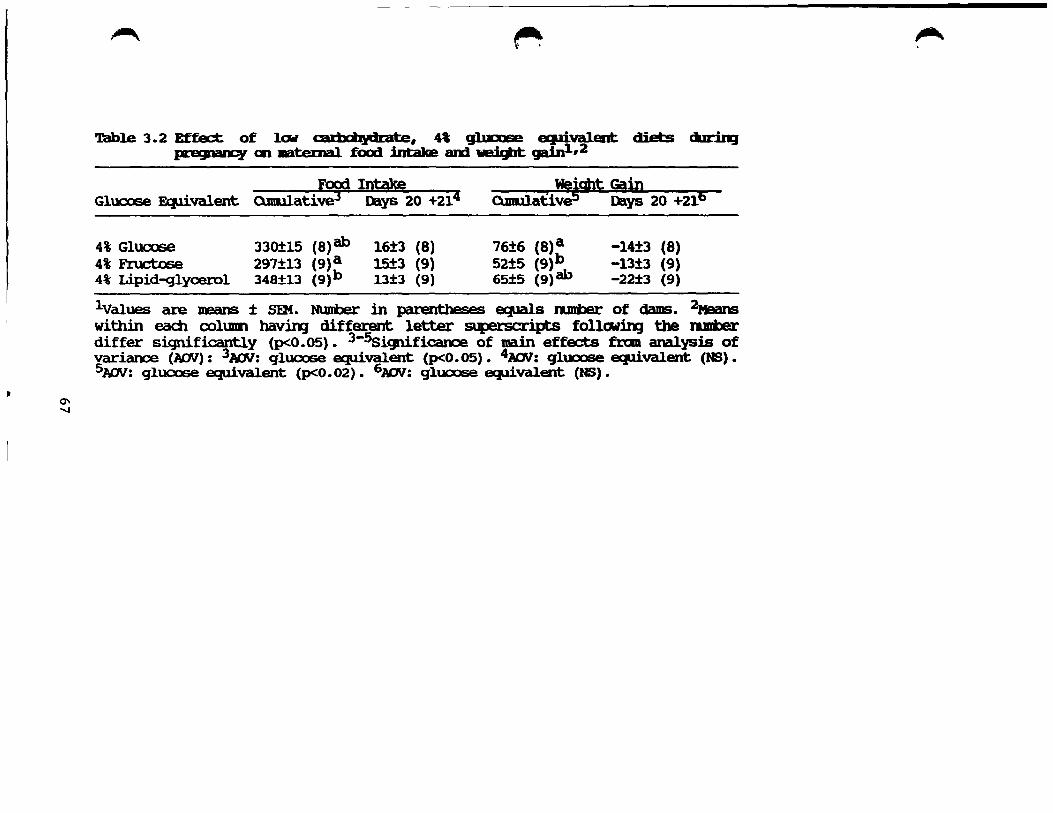
0'>
"
~ ~
Table 3.2 Effect: of lcw au::bciIydmte, 4\ glnmep eq4valent diets œring pœgnancy CD.at:eDlal. food intaJœ ani ~ gain1,2
Food Intalœ Glucose Ecpivalent Q.mulativeT -ilays20 +21.4
4% Glucose 4% Fructose 4% Lipid-glyoerol
330±l5 (8)ab 297±13 (9)a 348±13 (9)b
16±3 (8) 15±3 (9) 13±3 (9)
Weiabt Gain Qmul.at1ve5~ ~ Iliys 20+211)
76±6 (8)a 52±5 (9)b 65±S (9)ab
-14±3 (8) -13±3 (9) -22±3 (9)
lValues are means ± SDI. NlDIiler in paœntheses ecpùs nmtJer of damS. 2Means within eadl oolUllll havin;J different letter superscripts follCJWin:;J the DFer differ significantly (p<O.05). 3-5Significance of main effects traD analysis of variance (NN): 3NN: glucose equivalent (p<O.OS). 4NN: glucose Eqrlvalent (NS). 5NN: glucose equivalent (p<O.02). 6101: glucose equivalent (NS).
"'" ,

0\ 00
~ ~ ( ~
'!able 3.3 1be effect of g)lKXlSe and f:ructoae ci.Jrln:J ~ en :t:EIRcdrtive perfODlalD! in daIIB c-sect:i.a1ed at day 211 ,
Dietary Carlxbyd"ëlte
Glucose Fructose Glu + Fru7
Glucose Fructose Glu + Fru7
Glucose Fnlct:ose Glu + Fru7
Glucose Fructose Glu + Fru7
Level of Calbilvdrate __ _____ _ o 4 12 60
average nmber of iDp1antati.c::ms per daIItl 13±0.8 (9) 14±0.7 (10) 13±0.8 (9) 14±0.7 (10)
14±0.7 (10) 14tO.9 (7) < 13±0.7 (10) 13±0.8 (9) 14±0.5 (20) 14±0.5 (16) 14±0.5 (20)
USiOI:pt.ia'l zate (' of ÎIIpl.aJltat.ÏaJ' 9.3±3.2a 5.S±1.Sb 1.4±l.SC 4.7±l.Sbc
6.3±I.Sb 1.1±2.1c 5.3±1.8bc 9.3±3.2a 6.1±1.5b 1.3±1.~ 5.0±1.sbC
stillbirth rate (\ ilIIpl.ant:atiœ) 5
26.8±7.4a 2.7±1.Ob o.O±o.ob 0.7±I.Ob 2.7±1.2b
26.8±7.4a 1.7±3.1b 1.1±3.4b
live febases (~ of iIIplantat.iœs) 6 64.0±7.7a 91.6±1.9D 98.6±2.1c
93.0±1.gb 96.l±2.3c 64.0±7.7a 92.3±3.3b 97.5±3.7c
o.o±o.Ob 0.6±I.Ob 0.2±J.ob
95.4±1.gbc 94.l±1.gbc 94.7±3.3bc
IValues are tœanS ± SEM. Nl.utiler in parentheses equals llUl'IiJer of dans. 2Means within each parameter haviBJ different letter superscripts follOlod.rg the runber differ significantly (p<0.05). 3-6Significance of main effects fram analysis of variance (AOV): 3NJV: level of cartx:hydrate (NS); soorce of cartx:lbydrate (NS); level x source of cartdlydrate (NS). 4NN: level of carbahydrate ~0.01); scmœ of cartxX1ydrate (NS); level x source of cartx:lbydrate (NS). 'ACN: level of cartx:tlydrate (p<0.0001) ; sa.u:ce of carl:x:i1.ydrate (NS) ; level x source of cartx:tlydrate (NS). 6NN: leve1 of ca.rllahyàrate (P<0.0001); sa.u:oe of carbcilydrate (NS); level x source of cartx:nydrate (NS). 7lr1len there was no significant effect of souroe of cartx:nydrate, the statistical analysis treated all glUCXlSe am f:ructose at each level of cartx:ilydrate as a sllgle group. '1herefore, the significance is reported for these grouped means.
J < 4
,.Ir .....

0-\C
~ ~
'lable 3.4 'DIe effect of loir ~te, 4. g]lDl9P eIJ.lÏ.val.ent d:iet& WriDJ ~ti.cn al rE(lI'OCb:tive perfODBl'D! in dais C sectimed at clay 211,2
Glucose Equivalent Inplant:ation3 ~ian stUlbirth Live Rate4 Rate5 Fetuses6
(% of ÏlIplantatioos)
Mean % % %
4% Glucose 12±O.8 (a) 8.l±3.4 1.D±7.8a 90.9±8.1a 4% Fructose 15±O.8 (9) 7.l±3.2 2.1±7.4a 90.8±7.7a 4% Lipid-qlyoerol i3±O.8 (9) 9.2±3.2 26.8±7.4b 64.D±7.7b
lValues are means ± S~. NuniJer in parentheses equals nmtlp..r of dams. 2Means within eaàl column havinJ different letter supeniCripts followiR) the n1lli1er differ significantly (P<O.05). 3-5Significance of main effects fJ:an analysis of variance (NN): 3NN: glucose equ.j,valent (NB). 4N:N: glucose equivalent (NS). 5NJV: glucose equivalent (P<O.05). 6NN: glUCXlSe equivalent (P<O.05).
----~~,~ --,--
""'"

~ o
~ ~<.;
'lable 3.5
Dietary carbcbydrate
Glucose Fructose
Glucose Fructose
t ~
level of carbcbvdrate o 4 12
liver weight, g2
9.8±0.4 (9j 10.3±0.4 (10) 10.8±0.4 (10)
11.l±0.4 (9) 12.2±0.6 (6)
liver weight as % lxxly weight, %3
3.6±0.1 (9) 3.2±0.1 (10) 3.4±0.1 (10)
3.3±0.1 (9) 3.5±0.1 (6)
60
11.6±0.4 (10)* l4.7±0.4 (10)*
3.3±0.1 (10)* 4.2±0.1 (10)*
IValues are means ± SEM. NurIiler in parentheses equals nuniler of px-egnant: rat dams. 2-3Significaœe of main effects fran analysis of variance (ADV): 2ADV: level of carbahydrate (p<0.0001) ~ sau:oe of carbahydrate (P<0.OO05); level x source of carbahydrate (p<0.05). MN: level of carbahydrate (p<O.OOOl); scw:ce of carbahydrate (p<0.0001); level x source of carbahydrate (p<O.OOOl).*'lhe difference in liver weights between glucose aM fructose at 60% carl:xilydrate was significant.
~. f

~ 1-'
p.~ ~
'nIble 3.6 Effect of 60l ~t:e diets WriDJ Œ&aBIICY al a:d:oemal. liver lipid and wat:er cxmtent1
Dietary cartxnydrate N
Gluoose 8 FlUctœe 10
Lipid " DJ:y Weight
15.4tO.3 13.2tO.5
water
" 70.5tO.3 70.5±0.2
IValues are means ± SEX. T-test for each oo1U111'l was NS.
~,

........ N
} : ~
'nIble 3.7 Effect of low ~, 4' CJlucœe BJlÏ.valeDt djets clJring ~ cm lIIlteJ:nal liver ~1,2
GlUCXlSe Equivalent
4% glUCXlSe 4% fructose 4% lipid-glyoerol
Liver Weight3
(g)
lO.5±O.4 (8) lO.O±O.4 (9) 9.8±O.4 (9)
Liver Weight4
as % body wight
(%)
3.S±O.l (8) 3.9±O.l (9) 3.6±O.l (9)
lValues are means ± SEM. Nunber in parentheses ecpù.s l1UI1iJer of dams. 2MeaJls within each oolumn havin;J different letter superscripts followin;J the lUIiler differ significantly (p<O.05). 3-4Significanoe of min effects fran analysis of variance (AOV): 3NN: glucnse equivalent (NS). 4NN: glucose equivalent (NS) •
,

--.. w
~ ~
Table 3.8 Effect of Glucose and fi:uct:Œie œrirJJ pŒ9IiUICy en _temal parmEtersl,r
Diet:aJ:y lBVel of ~rtxilvdrate Carbàlydrate 0 4 12 60
plasma glUCXlSe, Dg/dl3
Glucose 100±5 (9) 107±6 (7) l12±7 (6) 100±6 (9) Fructose 98±6 (8) 120±7 (6) 11l±6 (9)
Glu + F'nl6 100±5 (9) 102±4 (15) l16±5 (12) 106±4 (18)
liver glycxgen, ngjcf' Glucose 4.94±0.95 (9) 3.45±2.66 (10) l8.53±2.8l (9) 40.l7±2.98 (8) Fructose 2.68±2.98 (8) 17.10±3.44 (6) 48.04±2.66 (10) Glu + Fru6 4.94±O.95 (9)a 3.1l±1.87 (18)a 17.96±2.05 (15)b 44.54±1.87 (18)c
plasma triglyoerides, Dg/dl.5
Glucose 484±148 (9) 985±147 (9) 487±166 (7) 269±139 (10) Fructose 889±147 (9) 511±180 (6) 235±139 (10)
Glu + Fnl6 484±148 (9)a 937±96 (18)b 498±lI3 (13)a 252±9I (20)a
IValues are œans ± SEM. N\lrli)er in paœntheses ecpùs nJJt)er of dalE. ~ within eadl parameter havirq diffeœnt letter superscripts followirg the nmber <liffer significantly (p<0.05). 3-6significance of main effects frai analysis of variance (ADV): 3N:N: level of carbohydplte (NS); sau:ce of cazbohydrate (NS); level x SCAlroe of cazbohydrate (NS). 4NN: level of cazbohydrate (p<û.OOO1); sourœ of cartxJhydrate (NS); level x scm:-oe of cartxJhydrate (NS). 5101: level of carl:xilydrate (p<O. 0001) ; SCAlroe of carl:xilydrate (NS) ; level x sruroe of carlx:t1ydrate (NS). ~ there was ~ significant effect of sruroe of carl:xilydrate, the statistica1 analysis treated aIl glUCXlSe and fructose at eadl level of carlx:t1ydrate as a sin;Jle group. 'lberefore, the significance is re;x>rted for these grouped means.
_ MYD" -Yiz ...... _~~ ........ ......:; ...... "-...... - -
lfiI'

....... ~
, ç. ,
Tcmle 3.9 Effect of 10w cadx:tJ,ydmte, 4' glua .... ~val.ent dipts œriJJ.J pœgnancy CD 1IIiltema1 ~1,2
Gluoose Equivalent
4% gluoose 4% fructose 4% lipid-glyoerol
Plasma Gluoose3
Dg/dl
92±8 (4) l06±5 (8) lOo±S (9)
Liver Plasma Glyoogen4 TriglyœridesS
Dg/g IIIJIdl
2.27±1.17 (6) 1268±157 (8)a 3.84±O.95 (9) 929±148 (9)a 4.94±O.95 (9) 484±148 (9)b
IValues are means ± SEM. Nlmiler in parenthesis ecpll.s J'VJIIiJer of dams. 2Means within eac:h ool\Dll'l havirg diffeœnt letter superscripts followirg the n1lllher differ significantly (p<O.OS). 3-6Signifiœnce of main effects fran analysis of variance (AOV): 3NN: glucose equivalent (NS). 4NN: glucose equivalent (NS). 6AOV: gluoase equivalent (p<O.Ol) •
ç
•
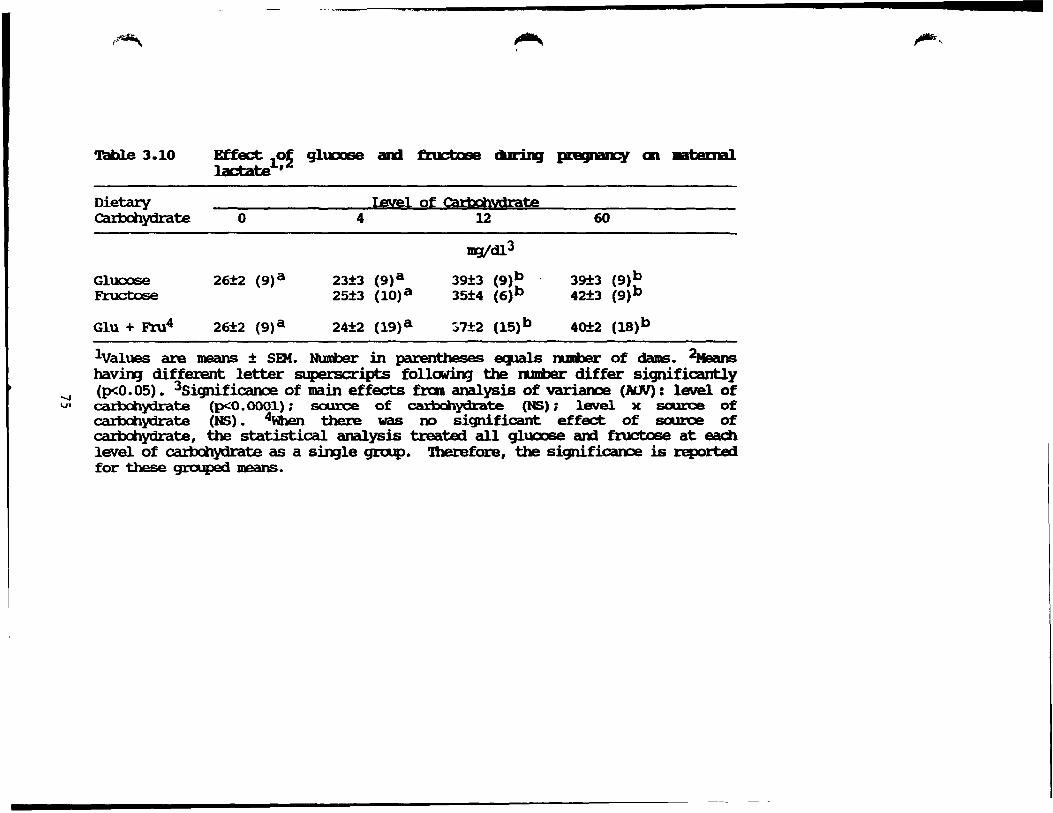
..... \J1
I~ ~
'DIb1e 3.10 =1~~ glucase an! tm:;tose cùr.iDj praJI1iII1CY CD Etemal
Dietary Ievei of Çêrtxi1vdrate cartxilyàrate 0 4 12 60
Dg/dll
Gluoose 26±2 (9)a 23±3 (9)a 39±3 (9)b 39±3 (9)b Fructose 25±3 (lO)a 35±4 (6)b 42±3 (9)b
Glu + Fnl4 26±2 (9)a 24±2 (19)a :i7±2 (lS)b 4o±2 (18)b
IValues are means ± SEM. N1.miJer in parentheses ecpals l'1IIliJer of dams. 2J1eans havin;J diffeœnt letter superscripts followin;J the n.miler differ significantly (P<0.05). 3SignificaJlCE of main effects frau analysis of variame (ALN): level of cart:xil~te (p<O.OOOl); sa.u:oe of caxbchydrate (NS): level. x source of c.arbà1ydrate (NS) • 4When theœ was no significant effect of source of c.arbà1yàrate, the statistical analysis treated all glucose ard fructose at eaàl level of c.aIt:làlyàrate as a sin:Jle group. 'lberefore, the significaooe is reported for these gra.JpE!d means.
",.,

..., Q\
~ ) t }
-nmle 3.11 Effect of la.r cadx:bydrate i'~ gluaJSe EfIlÏ.val.ent diets Gu:iDJ gestatim cm mtemal l.actate '
Glucose Equivalent
4% glucose 4% fructose 4% lipid-glycerol
Iactaœ (Dg/dl)
28±2 (7) 25±2 (9) 26±2 (9)
lValues are means ± SEK. Nl.DJi)er in parenthesis EqliÙs ramter of dams. 2Signifiœnce of main effects fran analysis of variaooe: glucose ecJlivalent (NS) •
1 ~

.......
.......
,-. ~
'nml.e 3.12 Effect of r'D&e an! f:nrtnae clJriDJ POq81Cy CD ..temal hlnrd nib.~'
Dietary Ievel of: cartxnvdrate carl:xtlydrate 0 4 12 60
plasma urie aeid, llIJ/dl3
Glucose 1.9±l.O (8) l.7±l.O (8) l.l±l.l (6) 1.6±O.9 (9) Fructose S.7±O.9 (10) 3.S±1.1 (6) l.S±0.9 (9)
Glu + Fnl5 1.9±1.0 (8)a 4.8±O.6 (18)b 3.3±0.7 (12)ab 1.S±0.6 (18)a
plasma urea nitrogen, ng,Idl4
Glucose 20.7±4.6 (5) Il.6±1.6 (9) 8.3±1.8 (7) 6.4±1.6 (9) FrUct:œe lO.8±2.0 (6) 8.5±2.0 (6) 6.7±1.6 (9)
Glu + Fnl5 20.7±4.6 (S)a 11.3±1.4 (lS)b 8.4±1.S (13)00 6.6±1.3 (18)e
IValues axe means ± SEM. Nl.DIber in parentheses equals rutiler of pœ;JnaI1t rat dams. 2Means within eadl parameter havirg <lil!~ letter superscripts fOllowiD) the nmi'lp..r differ significant1J! (p<O.OS). Significarx:a of main effects fraB analysis of variance (HN): HN: level of carbohydrate (p<O.Ol) i so.u:oe of cart:x.nydrate (NS); leve1 x sooroe of cart:x:nydrate (NS). 4N:N: level of cart.xilydrate (p<O.OOO2); scmœ of cazt:dlydrate (MS); leve1 x scm:œ of cartxnydrate (NS). ~ theœ was no significant effect of source of cartxnydrate, the statistical analysis t:zeated all gl\XXlSe am fructose at each level of carbohyàrate as a si.n:)le group. 'lbeœfoœ, the signifi.c:anoe is J:epOrted for these grouped meaJlS.
1'f'Ii't.\

...... 00
e _)
~e 3.13
Glu.oose Ecpivalent
4% glucose 4% fzuctose
j • \
~, '" qJnCDSe _,,01 .. -'- • Effect of l.a.I œrIJctIjdI: te pœgnancy CIl _temal. nib:uja~~ ~Yca.ua.," dJeta ci.Jr.iDJ
Plasma Urie Acid3 Plasma Urea Nitrogen4
(Dg/dl) (Dg/dl)
4% lipid-glyœrol
6.6±1.1 (6)a 3.1±1.O (7)b 1.9±l.O (8)b
17.6±3.9 (7) 15.4±3.7 (8) 20.7±4.6 (5)
IValues are means ± SEM. NuIIiJer in parentheses eqna1 s n1lllher of dams. 2Means within eaàl ool\D1ll havirq different letter superscripts followirq the nmiler differ significantly (p<O.05). 3-4Significaooe of main effects fraD analysis of variance (NJV): 3NN: glucose EqUivalent (p<O. 02). 4NN: glucose EqÙvalent (NS) •
~ !

,;s ca:z;::; -.t ....... :z:::a::;c::;w::_l~_-: ... .: 53 _ a C ... !i.@5 .. e DS4 z:;;; __ ta> ....... ":.~7'
'-A \0
~ ~
'.DIbl.e 3.14 Effect: of gl.ŒXJSe ard mrtose ct.JriJJJ gestatial al a.Jjotic fluid glucose ard J.actate1,2
Diet:aIy level O( cartrbvdrate ca.rtxnydrate 0 4 l2 60
amniotic fluid glucose, Dg/dl3
Gluoose 8±2 (9)a 13±3 (9)ab 18±2 (9)b 34±2 (8)c Fructose l2±2 (lO)ab 16±3 (7)b 33±3 (lO)e
Glu + Fru5 8±2 (9)a 12±2 (19)ab 17±2 (16)b 34±2 (18)e
amniotic fluid lactate, Dg/dl. 4
Glucose 46±4 (8)ab 38±) (8)a 42±2 (8)a 52±1 (9)b Fructose 43±3 (lO)a 45±2 (7)a 47±2 (lO)b
Glu + Fru5 46±4 (8)ab 41±2 (l8)a 44±2 (lS)a 49±2 (19)b
IValues are means ± sœ. Nul'IiJer in paœntheses eqJal.s nmber of animals. 2Means within each parameter havin;J di~~~ letter superscripts followi.n;J the npnher differ significantly (p<0.05). Significanoe of main effects fraD analysis of varian:2 CAeN): 3NN: level of cartxlhyàrate (p<O.OOOl); sooroe of cadxilydrate (NS); level X sau:œ of cartxilydrate (NS). 4NN: level of cadxilydrate {p<O.Ol); scm:ce of carlxilydrate (NS); level x sœroe of caxtxhydrate (NB). 5When there was no significant effect of source of cadxilydrate, the statistica1 analysis b:eated all glucose am fruct:œe at each leve1 of cartx:bydrate as a s~le group. '1berefoœ, the significaooe is report.ed for these grooped means.
r,

00 o
t -~
'nml.e 3.15
Gluoose Fq.t.ivalent
4% glucose 4% fructose
t $
Effect of law cadxDydrclte 4' glucose apivalent djpts œriDJ gestatim CIl aII'lÏDtiC fluid CJlmœe aIIIlai::tatel,2
Gluoose3 Iactate4
(Bq/dl) (Dg/dl)
4% lipid-çlyœrol
8±1 (8) 6±l (9) 8±2 (9)
40±4 (8) 43±2 (8) 46±4 (8)
lValues are lŒ!aJlS ± SEM. Nlmi:Jer in parentheses ecpùs nDDher of animals. 2Means within eaàl oolumn havin:] different letter superscripts followin;J the npnher differ significantly (p<O.05). 3-4Significance of main effects fran analysis of variaooe CArN): 3ArN: glucose EqUivalent (NS) 4N:N: glucose ecJlÏ.valent (NS).
( ~

~
'.lable 3.16
DietaJ:y cart:dlydrate
Glucose Fructose Glu + Fru6
Glucose F:ructose
(Xl Glu + Fru6 1-'
Glucose F:ructose Glu + Fn16
".,
Effect of gJ'JC'X'1BI! ard fnrb .. WriD.J (K8JrBIICY cm -natic fl.uid nib~,
Ievel of carlxilvdrate 0 4 12 60
uric acid, lII}/dl3
1.5±O.5 (5)a 1.0±O.4 (8)b O.3±O.1 (6)c O.4±O.1 (7)c O.5±O.1 (7)b O.4±O.1 (5)c O.3±O.1 (7)c
1.5±O.5 (5)a O.8±O.2 (15)b O.4±0.2 (1l)e O.l±O.2 (14)c
urea nitrogen, Dg/dl4
15.0±2.5 (6)a 9.2±O.9 (8)b 9.8±O.7 (8)b 8.4±O.8 (8)b lO.9±2.0 (9)b 9.l±O.9 (6)b 7.9±O.7 (lO)b
l5.0±2.5 (6)a lO.l±O.9 (l7)b 9.5±1.0 (14)b 8.l±O.9 (l8)b
. pg/Jnl.5 aDIIIOI'11.a 1
5.86±O.58 (6) 6.01±0.60 (8) 7.2o±O.89 (8) 5.48±0.73 (7) 6.58±0.94 (9) 7.47±1.26 (6) 5.40±0.45 (9)
5.86±O.58 (6) 6.31±O.49 (17) 7.32tO.54 (14) 5.44tO.50 (16)
lValues are means ± SEM. NlIlliler in paœntheses ecpùs n1lli'ler of anilM)s. 2Means within eadl parameter haviIg different letter superscripts followin) the n.œr <liffer significantly (p<O.05). 3-5significame of main effects traD analysis of variance (AOV): lN:N: level of ~te (p<O.01); srurce of cartx::b.ydrate (NS); level x source of cartxilydrate (NS). 4NN: level of cartxil~te (p<O.OO5); sooroe of carbcilydrate (NS); level x sooroe of cartx::b.ydrate (NS). 5101: level of cart:xnyç1rate (NS); sooroe of carl:xilydrate (NS); level x scmœ of cartx::b.ydrate (NS). 6when there was n;) significant effect of source of cartx::b.ydrate, the statistical analysis tJ:eated all glucose am fructOse at eaàl level of cartxilydrate as a si.n:Jle groop. 'lbe.refoœ, the significawe is t'epOrted for these graJPEd tœanS.
D' ms tt lt ..... ttébrTt!l:nt';;;.. ... *çr:lirH~~_ ............... -l .... ....a.-...-...... _~.",t...,..w\ .. _~-
1*..

00 N
;
'l'able 3.17
Glucose EqUivalent
4% ql1JCX)Se 4% fructose
~ ;
Effect of lCII cad:xiIjdmte, 4' g1.ooœe &JlÏ.valent diets clJriDJ pn!II)[1iUq al mmiotic fluid nit:mgai1
Urie Acid2 Urea Nitrogen3 ADIIDûa4
(ngJdl) (I.&g/~)
l2.4±1. 7 (7) 5.92±O.72 (8) 11. 7±2.2 (9) 4.98±O.59 (8)
4% lipid-glyoerol
(ngJdl)
O.8±O.2 (7) 1.4±O.2 (9) 1.5±O.5 (5) l5.0±2.5 (6) 5.86±O.58 (6)
lyeues are means ± 3EM. NurIiJer in pazent:hesis equa1s nmi)er of animals. 2 Significaooe of main effects fran analysis of var.iaooe (NJV): 2NN: glucose EqUivalent (NS). JNN: glucose ecJ.rlvalent (NS). 4NN: glucose ecJrlvalent (NS).
""--'-"""""'-I-':"""<i" '<~" ~ .... ~ _4_ -~ ..... .,.-.,.-"' ...... ~:; --.----... .... "iie- .... 'l'II!'3!f..
, ,

00 w
,~
Table 3.18
Oietazy
"*'
'lbe effect; of Cjluoose am fJ:ucta;e dIr:ÏJJj gestatial al tbe weiiIrt of the febJs, the placenta ard the fetal-pl.aœntal œù.t at clay 211 ,2
Level of cartxnvàrate cartxhydrate 0 4 12 60
fetal weight, gl
Gluoose 3.81±0.04 (104)a 4.65±0.03 (130)b 5.32±0.03 (116)c 5.24±0.03 (132)c Fructose 4.74±0.03 (113)b 5.33±0.04 (99)c 5.19±O.03 (124)c Glu+Fru6 3.81±O.04 (104)a 4.69±O.02 (243)b 5.32±0.03 (215)c 5.22±O.02 (256)c
placental weight, g4
Gluoase 0.39±0.01 (104) 0.4o±O.OO (130) 0.4o±O.01 (116) 0.40±O.OO (133) Fructose O.43±O.01 (113) O.4o±O.01 (99) O.40±0.01 (124) GlutFn16 0.39±0.01 (104) 0.41±0.00 (243) 0.40±0.00 (215) O.40±0.00 (257)
fetal-plaoental weight, g5
Glucose 4.2o±O.04 (109)a 4.99±O.04 (130)b 5.67±O.04 (114)c 5.65±0.04 (132)c Fructose 5.16±0.04 (113)b 5.73±0.04 (99)c 5.60±0.04 (127)c Glu+Fru6 4.2o±O.04 (109)a 5.08±0.03 (243)b 5.7o±O.03 (213)c 5.62±O.03 (259)c
1Values are means ± SEM. NlJnt)er in parentheses equals ramiler of animals. 2Means within eaàl parameter havi.nj different letter superscripts followi.nj the n1l'li1er differ significantly (p<0.05). 3-5S ignificance of Dain effects fran analysis of variance (ADV): 3ADV: leve! of cartJahydrate ~O.OOOl); sa.troe of œrt:x:ilydrate (NS); lev el x sooroe of cartxilydrate (NS). MN: leve! of caztxilydrate (NS); souroe of c:artx:tlydrate (NS); leve! x souroe of carlxilydrate (NS). 5MN: level. of cart:dl.ydrate (P<O.OOOl); SOOI.'Oe of cartxi1ydrate (lIS); leve! x swroe of cartdlydrate (NS). 6Mten there was no significant eftect of swroe of carbc.tlydrate, the statistical analysis treated all gluoase am fructose ~t eadl leve! of cat:bc:ilydrate as a sin}le gxnJp. '1herefore, the signific:arDe is œported for these grouped means.
~"

(Xl ~
.II 4 • •
iable 3.19
e ;.
Effect of lor.r cadx:iJjdrat:e, 4' CJlIKXlSe BlJÏ.valent diets mring gestatial al the ~ of the fetus, the placenta and the fetal-plaœntal. unit at day 211 ,2
WeiClht Glucose Equivalent FeblsJ ---- - Plaœnta4 Fetal-Plaoental Unit5
4% Glucose 4% Fructose 4% Lipid-glycerol
(g) (g) (g)
4.4o±O.04 (92)a 0.46±0.01 (92)a 4.86±0.04 (92)a 3.60±0.04 (llO)b 0.38±0.01 (llO)b 4.03±0.03 (126)b 3.Bl±O.04 (l04)ab 0.39±0.01 (104)b 4.20±0.04 (109)b
IValues are means ± SEH. Number in pa.rentheses equals ramiler of fetuses. 2Means within each oollnnn havirg different letter superscripts followl..rg the nJl'J'bar differ significantly (p<0.05). 3-5Significaooe of main effects fran analysis of variance ~ADV): 3ADV: gl~ EqUivalent (p<0. 05). 4NN: glucose elJlÎvalent (p<O.02). 'MN: glucose eqw.valent (p<O.05).
r \ . (
cr w- _

00 VI
~ ,
'DIble 3.20
Dietazy Cëntxilydrate
GIUCXJSe Fructose Glu + FIu6
o
58±14 (4)
58±14 (4)
~ ,
gestatia1 CD fetal
Isvel of cartx:ilvdrate 4 l2 60
blood qlUCXJSe, DIJIdl3
77±10 (9) l03±10 (9) 88±10 (9) 82±10 (9) 96±13 (5) 81±9 (10) 79±7 (18) lOl±8 (14) 84±7 (19)
liver qlyoogen, 1II3Ict' Glucose 9.9O±O.96 (26)a 38.5l±2.71 (2l)b 4l.23±2.09 (38)b 6l.56±2.21 (30)c Fructose 35.23±2.85 (22)b 35.58±1.99 (37)b 63.76±2.20 (29)c Glu + rru6 9.90±O.96 (26)a 36.87±2.54 (43)b 38.4l±1.45 (75)b 62.66±2.21 (59)c
plasma triCJlyoerides, DIJIdl5
GIUCXJSe 65±5 (6) 64±4 (10) 66±4 (9) 62±4 (10) Fruct:cse 62±4 (8) 6l±5 (6) 54±4 (9) Glu + FJ:u6 65±5 (6) 63±3 (18) 64±3 (15) 58±3 (19)
1Values are means ± sm. N\JIIi:)er in paœntl1esis nmœr of fetuses. 2Means within each parameter havÎD:) different letter superscripts follCJWÏn) the nmiler differ siqrrl.ficantly (p<O.05). 3-6giqrrl.ficaooe of main effects frcm analysis of variame (NN): 3101: level of ca.nxil~te (IfS); soucce of au:txnydrate (NS); level x swrœ of cadxbydrate (NS). 4NN: lavel of au:txnydrate (p<O.OOOl); sau:œ of carl:x:ilydrate (NS) : level x sooroe of carlxi1ydrate (NS) • 5AO\T: level of ~te (NS): sooroe of cazt:x:ilydrate (NB): level x sooroe of au:txnydrate (NB). ~ theze was no significant effect of sooroe of au:txnydrate, the statistica1 analysis tœated all qlUCXJSe and fructose at each level of au:txnydrate as a si.rgle gralp. 'lberefc,œ, the signifiœooe is reported for these grruped meaJ1S.
f ~

00 0\
~ ~ "
'nIbl.e 3.21 Effecl: of law au::IxDJIdmte 4' 1 gestat.:i.c:D cm f~-" ' 1 2 9 ''''CRe EQÙ.valent di ...... Ao~ __ -=-a. paL t:.ers, ---'"::1
Glucose Fqllvalent
Plasma Glucose3
(Bq/dl)
Liver Glyoogen4
(1IIJ/g)
4% glucose 57±10 (8) 20.70±O.85 (28) 4% fructose 52±10 (8) lO.30±O.95 (37) 4% lipid~lycerol 58±14 (4) 9.90±O.96 (26)
Plasma Triglycerides5
(Dg/dl)
61±5 (6) 57±4 (9) 65±5 (6)
lValues are means ± SEM. NI.miJer in paœnthesi.s equal.s nmtler of fetuses. 2Means within eadl oolUllll havirg different letter Slp!rSCI'ipts follawinj the nmber differ significantly (p<O.05). 3-6significaooe of main effects ftaD analysis of vari.aooe (AaJ): 3N»: glucose ecJ1lvalent (NS). 4N»: glucose BJÜvalent (NS). 5NN: glucose ecJlÏ.valent (NS).
tJI"iL,

00 .......
e )
Table 3.22
Dietazy camabydrate
Glucose Fructose
Glu + Fl:u6
ç ,
Effect of CJlWXBe ard fI:uch.. œriDJ f)EiitaUm CIl :fetal. ptAli'l1oGI3-. l.actate1,2 .
o
68±6 (6)
68±6 (6)
Isvel of Cénixilvdrate 4 12
fetal lactate, Dg/dl3
57±6 (10) 59±6 (9)
58±4 (19)
67±6 (9) 56±7 (6)
62±5 (15)
60
47±6 (9) 59±6 (10)
54±4 (19)
lValues aIe means ± Saf. NuniJer in parentheses ecpùs nmber of fetuses. 2Means within each parameter havirg diq:eœnt letter superscripts followirg the n1lllher differ significantly (p<0.05). Significance of main effects frai analysis of variance (ADV): 1evel of ~te (NB): source of caztx:ilydrate (NB): level x source of cad:xtlydrate (NS). 4tivm there was J'X) significant effect of sa.u:œ of cartxilydrate, the statistical analysis aeated all glucose am fn1ct:œe at each level of cartxilydrate as a si.rgle groop. 'lberefore, the significawe is ~orted for these grwped meaIlS.
f ~

--,
00 00
~
Table 3.23
Gluc::cse F4llvalent
4% glucose 4% fxuct:ose
-------.,.-... ". ~---.--- ~*r.:ehIIî?-; au:;:' >-, - i? waal
~
Effect. of low -~-~.-;-. -.-.-"..=---.ru-- '" g1Jxxse 8IJ.Û.valent diets --. .... '";:1 ~...-.......... al fetal. J..acta.té1,2
Plasma lactate3
(Dg/dl)
4% lipid-qlyc:erol
6l±6 (7) 58±S (9) 68±6 (6)
IValues aœ means ± SEM. Nlmi:Jer in pu:entheses Eqt;3)S l'a.IIIber of fetuses. 2Means within eac:b oolUll'll havin} different letter superscripts folloilliDJ the J'Ult)er differ significantly (p<O.OS). lSignificaJ'Dl of main effects f1:aa analysis of vari.ar'al (NJV): glucose E!CJlivalent (NS).
~

00 \0
: )
Table 3.24
DietéUy cartxilydrate
Glucose Fructose
Glu + Fnl6
~ t
Effect.,. of gllKXl68 ard fEnctDfle œriDJ 9*'tatim CD fetal urie ~,~
Level of Cartlà'lvdrate o 4 12 60
~~2
1.2±0.3 (4) 0.9±0.1 (9) 0.6±0.2 (8) 0.5±0.1 (10) 0.6±0.2 (7) 0.7±0.2 (6) 0.6±0.1 (10)
1.2±0.3 (4) 0.8±0.1 (16) 0.6±0.1 (14) 0.6±0.1 (20)
IValues are means ± SEX. Nuni:ler in parentheses equals IJ.JIItler of fetuses. 2Significan:::e of main effects fran analysis of variance (AOV) : level of cartx:b~te (NS); soorce of cartx:bydrate (NS); level x soorce of caJ:tx:bydrate (NS). ~ theœ was no significant effect of soorce of caJ:tx:bydrate, the statistical analysis treated all glucose an:i fruct:œe at eadl level of cartxJhydrate as a s.i.rçle groop. 'lberefore, the significance is replrted for these graJped means.
c

\D o
-~"~h 1 oS '., .P~........... -. --.... ~i!f .... _ =_c::c:u.::::..!. ..... ll J ... __ ..,~ ~;c:..-:; ~ ..... "'-.-..,.---- -
.-""",, ~
Table 3.25 Effect of la.r cadxiJ;ydrate 4' gl.1DB! a:pi.val.ent. diets cmrin) gest:ati.cm cm fetal urie ac:UP-,2
Glyoerol Equivalent
4% glucose 4\ fructose 4\ lipid-glycerol
Petal Urie Acid (Dg/dl)
1.0±O.2 (9) L1±O.2 (7) 1.2±O.3 (4)
IValues are means ± SEM. NuIIi:Ier in paœnthesis f"'JY'ls nJrnber of fetuses. 2Significance of main effects fran analysis of variance (AOV): 3AOV: glucose equivalent (NS).
,--

-
-
400
350
300
250
2CO
150
100
50
0
Figure 3.1 Food Intake Graded Levels of Dietary Glucose
GRAMS
--- 0 ...
-1- 4 ...
-;jE- 12 ...
-a- 60 ...
2 4 6 8 10 12 14 16
DAYS
Triglyceride baud dleta
91
18 19 20 21

1
(
(
(
Figure 3.2 Food Intake Graded Levels of Dietary Fructose
GRAMS
400 1 350 l 300 ~
~ 0'4
-+- "''4
-+- 12'4
-B- 60'4 1 250 ~ __ ...
200
150
100
50
2 4
Triglyceride ba .. d dleta
6 8 10 12 14 16 DAYS
92
18 19 20 21
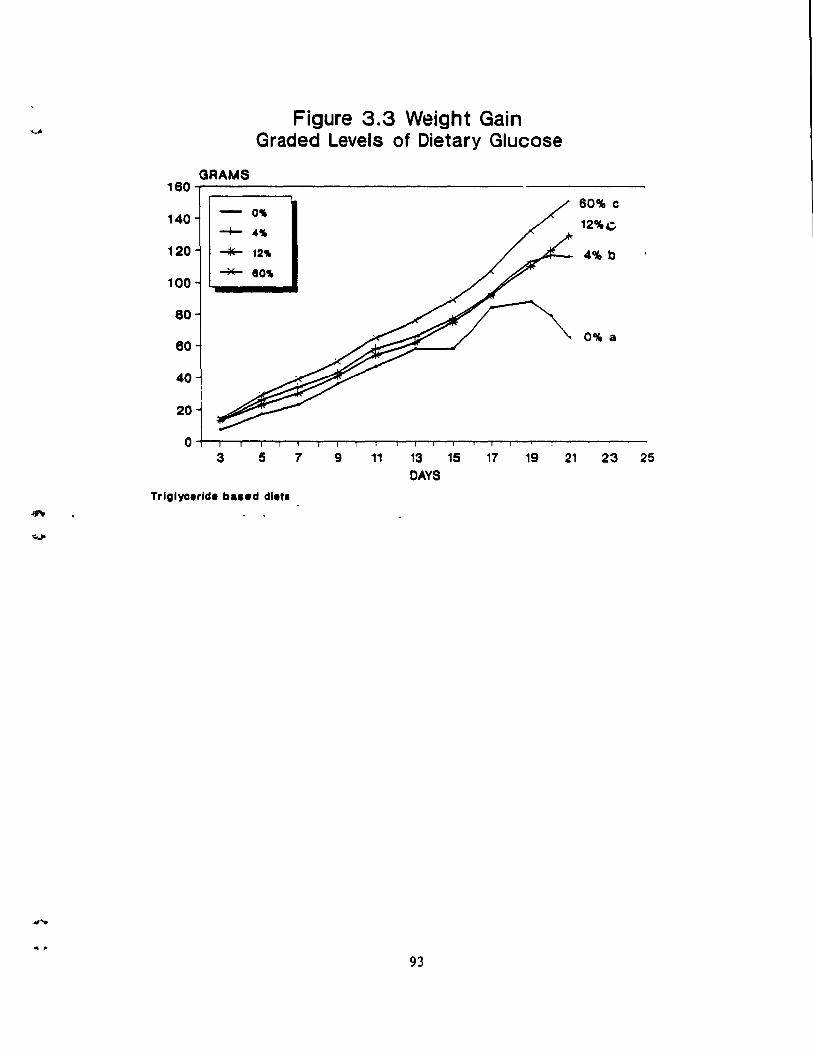
.... Figure 3.3 Weight Gain Graded Levels of Dietary Glucose
GRAMS 180
60GA. c 140 - 0'
~ .. , '2%~
120 -iIP- 12 .. 4GA. b ~
100 80 ..
80
80 0% a
40
20
0 3 5 7 9 11 13 15 17 19 21 23 25
OAYS
Triglyceride b ••• d dleta
4'\>-
~
93

•
(
GRAMS
Figure 3.4 Weight Gain Graded Levels of Dietary Fructose
160~----------------------------------______ ___
3 5 7 9
Triglyceride ba .. d dleta
60% c 12% c
4% b
0% a
11 13 15 17 19 21 23 25 DAYS
94
.

Gf,AMS
FigtJre 3.5 Food Intake 4% Glucose Equivalents
400~---------------------------------------------
350 - .... Lipid-Glyc.rol
-+- .... Glueo ••
300 '""*"' .... Fructo ..
250
200
150
100
50
2 4 6 8
Fr b
10 12 14 16 18 20 22 24
DAY
95

\ Figure 3.6 Weight Gain .. 4% Glucose Equivalents
GRAMS 100
" .. Llpld-Glyc.rol
00 -+- " .. Glueo ••
""'*'" " .. Fructose GI a
60 L-G ab
Fr b
40
i
20t ~
! ! ! a 3 5 7 9 11 13 15 17 19 21 23 25
DAY
.. 1 ,
( 96

.'
........
Figure 3.7 Dam liver weight Triglyceride-based diets
GRAMS 15~------------------------------------------~
- GLUCOSE
14 -+- FRUCTose
13
9 --------------~--------------~------------~ 0% 4% 12% 60%
LEVEL OF CARBOHYDRATE
97

(
(~
(
4.4
4.2
4
3.8
Figure 3.8 Dam liver wt as %body wt Triglyceride-baaed dleta
- GLUCOSE
-+- FRUCTOSE
3~------------~--------------~--------------0'4 4'4 12~ 60%
LEVEL OF CARBOHYDRATE
98
-
.......
CKAPTER 4: DISCUSSION
The ability of dietary fructose to fully replace dietary
glucose during pregnancy in the rat has been investigated by
comparing isocaloric sU'bstitution of fructose for glucose
using a wide range of concentrations of dietary carbohydrate.
This is the first comprehensive study of the effect of dietary
fructose during pregnancy in the rat. Bourne et al in 1975
authored the only other study to investigate the effect of
dietary fructose during p.regnancy; however, they fed only very
high carbohydrate diets (68%). Bourne et al (1975) concluded
that the source of dietary carbohydrate affected maternaI
lipid metabolism during late pregnancy by significantly
increasing maternaI hepatic lipogenesis and maternaI plasma
triglyceride concentration, but they did not observe an effect
of diet upon the fetus (fetal weight, plasma insulin, and
fetal lipogenic activity). In the present study an effect of
the source of carbohydrate upon maternaI plasma triglyceride
levels was not observed, although, like Bourne' s study, no
effect of carbohydrate source upon fetal parameters was noted
in the high carbohydrate diets. This study fed fructose at
five different levels, ranging from a 4% glucose equivalent
to a 60% carbohydrate diet, and measured a number of
parameters that Bourne et al (1975) did not investigate.
These parameters were measures of carbohydrate, nitrogen and
lipid status, as weIl as body and liver weights. It appears,
from these parameters, that only at high carbohydrate
99

(
(~
(
concentrations of 60% (using triglyceride based diets) or low
concentrations of 4% glucose equivalent (using fatty acid
based diets) do dietary differences between glucose and
fructose occur. No differences due to the source of
carbohydrate, be it glucose or fructose, occurred when dams
were fed intermediate amounts of glucose or fructose. The
results from the present study en.phasize the importance of
the level of dietary carbohydrate or i ts precursors on the
essentiality of a carbohydrate source for reproduction.
Fructose Toxicity
One important aspect of our investigation into the
substitution of glucose by fructose during pregnancy, was the
potential toxicity of dietary fructose when fed at high
concentrations. Two of the blood parameters used to measure
the potential toxici ty of fructose at high dietary
concentrations have been lactic acid (Reiser 1987) and uric
acid (Bode et al 1973; Israel et al 1983; Reiser 1987).
Chronic feeding studies, measuring lactic or uric acid
concentrations in the blood, have not previously been done on
the rat, nor have lactic acid measurements been made wi th
humans in feeding studies. However, studies in humans have
shown uricacidosis but these had confounding variables.
Israel et al (1983) used carbohydrate-sensitive individuals
and Emmerson (1974) used purine free diets. It appears that
normal feeding patterns do not result in toxic concentrations
of fructose in the maternaI and fetal systems of the rat as,
100
ft

"'-'"
....
in the present study, neither of these acids were higher in
fructose fed dams compared to glucose fed dams at any level
of dietary carbohydrate.
In non-pregnant rats, it is commonly known that diets
high in fructose raise the concentration of plasma
triqlycerides (Zakim et al 1967; Bruckdorfer et al 1972;
Chevalier et al 1972b; Maruhama and MacDonald 1972; Waddell
and Fallon 1973; Vrana et al 1974a,b,1976,1983,1988; Waterman
et al 1975; Heller et al 1977; Kanq et al 1979; Merkens et al
1980; Sleder et al 1980; Aoyama et al 1980,1981,1982,1987;
Kannan et al 1981; Bird and Williams 1982; Zavaroni et al
1982; Hostmark et al 1982,1984; Bird et al 1984; Verschoor et
al 1985; Herzberg and Rogerson 1986, 1988a,b), although a tew
studies have not reported these resul ts in aIl cases
(Chevalier et al 1972b; Naismith and Rana 1974; Kang et al
1979). Bourne et al (1975) had found a significantly higher
concentration of plasma triglycerides in pregnant dams fed
high fructose diets (271 mg/dl) than dams fed high glucose
diets (149 mg/dl). The present study did not find that the
presence of fructose in the diet increased the concentration
of plasma triglyceride in th€: maternaI system. The values for
plasma triglycerides in the present study were 235 and 269
mg/dl for dams fed 60% fructose and 60% glucose respectively.
These values are higher than other values for pregnant rats
reported by Champigny and Hitier in 1987 (88-176 mg/dl) and
101
(
{
(
within the range of wapnir and stiel's in 1985 (142-280 mg/dl)
and Bourne et al in 1975 (149-271 mg/dl).
Plasma triglycerides were significantly higher in dams
fed 4% carbohydrate triglyceride based diets than dams fed
aIl the other levels of carbohydrate. It appears that the
presence of 4% carbohydrate -in very high fat diets is requirt:..l
in order to raise the plasma triglyceride levels to very high
concentrations. Dams fed a very high fat diet lacking
carbohydrate had levels of triglycerides in the maternal
plasma significantly lower (484 mg/dl) than dams fed diets
containing 4% carbohydrate. Dams fed the two fatty acid based
diets containing 4% glucose or fructose had plasma
triglyceride concentrations (929-1268 mg/dl) similar to the
dams fed the 4% glucose and fructose triglyceride based diets
(889-985 mg/dl).
From these observations, it seems that the metabolism of
glycerol in the maternaI system is different from that of
fructose and glucose. The maternaI liver's capacity to take
up glycerol is extremely high (Casado et al 1987). However,
the glycerol is bound into a triglyceride molecule and
therefore the maternaI system must be breaking down
triglycerides in order to extract the lipid-glycerol, the only
source of glucose in the diet. There 1s no source of
carbohydrate to spare the use of glycerol by the maternaI
system. Perhaps, then, the maternaI system must be very
102

..........
strongly geared to metabolize the lipid-glycerol and less
lipid as triglyceride can then circulate in the plasma.
The weight of the maternaI liver, measured as an absolute
value or as a percent of body weight, was significantly higher
in dams fed 60% fructose than dams fed 60% glucose. Bourne
et al (1975) also measured the liver weight of pregnant rats
which were fed 68% fructose or glucose and found a non
significant trend for the increased liver weight in the
fructose fed dams. The increase in liver weight agrees with
many previous reports in the li terature where non-pregnant
rats fed high fructose diets (ranging from 66.1 to' 80.68%) had
liver weights significantly greater than rats fed a similar
concentration of dietary glucose (Allen and Leahy 1966;
Bruckdorfer et al 1972; Michaelis and Szepesi 1973; Naismith
and Rana 1974; Romsos and Leveille 1974; Waterman et al 1975;
Aoyama et al 1980,1982,1987; Bird and Williams 1982; Vrana et
al 1983; Fields et al 1985). In many studies this difference
has been accounted for by an increased liver lipid content
when rats are fed fructose (Allen and Leahy 1966; Bruckdorfer
et al 1972; Michaelis and Szepesi 1973; Naismith and Rana
1974; Romsos and Leveille 1974; Aoyama et al 1980; 1982; Bird
and Williams 1982). We could not measure any differences in
lipid content between the livers of dams fed either 60%
glucose or fructose. others have also failed to measure a
significant difference in liver lipid between rats fed high
fructose vs high glucose diets (Zakim et al 1967; Herzberg
103

(
(~
(
and Rogerson 1986,1938a,b; Aoyama et al 1987). The Roese
Gottlieb method used to measure the liver lipid concentration
ih this study extracted mainly triglycerides, not
phospholipids. However, it would be surprising if it were the
phospholipid fraction of the liver which caused the increase
in liver weight.
We did not measur~ any differences between liver water
content so this can not account for the difference in liver
weight in this study. others have also noted that the water
content of the liver is not affected by a high fructose diet
(Bruckdorfer et al 1972: Kang et al 1979). Hepatic glycogen
concentrations have been reported to be higher in fructose
fed rats than in those fed equivalent amounts of glucose when
rats were meal-fed (Kang et al 1979; Herzberg and Rogerson
1988b) but not in rats fed ad libitum (Vrana et al 1978; Rang
et al 1979) as our dams were. In the present study there were
no significant differences in liver glycogen levels between
glucose and fructose fed dams. However, there appeared to be
a trend towards a greater liver glycogen content in dams fed
60% fructose (48 mg/g) than in dams fed 60% glucose (40 mg/g) .
This difference could possibly account for some of the
difference in liver weight between the dams fed diets high in
fructose and glucose.
The reason for the enlargement of the liver is not clear;
nor, do we know whether it is a toxic symptom. This is the
104

only parameter which indicates that at high levels fructose
May be metabolized differently than glucose.
Fructose Replacement of Glucose
Another important aspect to this study was to question
the ability of fructose to fully replace glucose and maintain
the carbohydrate status of the mother and fetus. Earlier
studies had shown that dietary glucose could not be replaced
by dietary protein during pregnancy (Koski et al 1990)
indicating that the requirement was specifie to dietary
carbohydrate. The present study investigated whether the
essentiality of carbohydrate during pregnancy was specifie to
one carbohydrate, glucose, or whether another carbohydrate,
fructose, could fill the requirement. Both fructose and
protein must enter the gluconeogenic pathway in order to be
converted to glucose and glycogen, although amino acids enter
lower in the pathway (eg. alanine --> pyruvate) than fructose
(--> 3-carbon phosphates). It appears, in general, that
fructose can fill the carbohydrate requirement during
pregnancy and, like qlucose, the level, not the source, is the
most important indicator for determining optimal reproductive
outcome as measured by several parameters (maternaI and fetal
liver glycogen: maternaI, fetal and amniotic fluid glucose and
lactate) •
MaternaI and fetal liver glycogen concentration, though
not significantIy affected by the source of carbohydrate, were
profoundly affected by the levei of carbohydrate in the diet;
105

(
(
as the dietary carbohydrate level increased so did the content
of maternaI liver glycogen. These results support previous
observations (Koski et al 1986). The maternaI control values
given in the former study by Koski et al in 1986 (39.4 mgjg)
were similar to those of our study (40.17 mgjg) , as were the
values of dams fed 12% carbohydrate (22.4 vs 18.53 mg/g) and
0% carbohydrate (4.2 vs 4.94 mg/g). The fetal control values
given in the study by Koski et al in 1986 (127 mgjg) were
higher than those of our study (61.56 mgjg) , as were the
values of fetuses of dams fed 12% carbohydrate and 0%
carbohydrate. This is probably due to a combination of 1) the
different methods used in glycogen determination: the present
study used the Lo et al (1971) lnethod while Koski et al (1986)
used the Seifter et al (1950) method which is less specifie
and measures total redueing equivalents: and 2)the different
fetal bleeding methods: the present study bled from the
axillary vain while Koski et al (1986) eut open the thoracic
eavity and drained the fetus of bled. The second bleeding
method would lead to more blood glucose retained in the fetal
liver whieh would be counted as glycogen in the glycogen
determination used. other authors have reporteà fetal
glycogen eoncentr3.tions similar to those observed in this
study: Ogata et al (1986) with 52.8 mgjg; Freund et al (1980)
88 mgjg; Margolis (1983) 74.67 mg/g, using a similar
methodology te the present study.
106
.

-
.....
The increasing level of carbohydrate in the diet also
led to greater concentrations of glucose measured in the
amniotic fluide This pattern parallels that of the glycogen
content of both the maternaI and fetal livers. It appears
that maternaI and fetal liver glycogen and amniotic fluid
glucose are most influenced by changes of dietary carbohydrate
intake and can perhaps act as reservoirs for glucose \ihen it
is present in excess of the requi red amount needed by the
maternaI or fetal system. Amniotic fluid glucose is the Most
easily accessible parameter which could act as an nutritional
indicator of the carbohydrate status of the mother and fetus.
Another metabolite which roughly followed this pattern
was maternaI lactic acid concentrations, as dams fed 0 and 4%
carbohydrate had lactic acid levels significantly lower than
dams fed 12 and 60% carbohydrate diets (triglyceride based).
Romsos et al (1981) observed a 40% decrease in maternaI plasma
lactate levels in the pregnant dog fed a 0% carbohydrate diet
compared to bitches ingesting a 44% carbohydrate diet. This
decrease was not statistically significant. The present study
and that of Romsos et al (1981), which fed high and low
carbohydrate diets, have resul ts similar to those studies
which compare lactic acid levels in fed and fasted pregnant
rats (Freinkel et al 1972; Girard et al 1975) or guinea pigs
(Gilbert et al 1985) where fasted mothers have lower lactic
acid concentrations than the fed mothers. uteroplacental
production of lactate is dependent upon the delivery of
107

(
(
glucose from the maternaI system (Battaglia and Meschia 1988)
and this would be compromised in dams fed low carbohydrate
diets.
Amniotic fluid lactate concentrations followed an unusual
pattern: in the 4% to 60% carbohydrate diets, amniotic fluid
lactate significantly increased with increasing dietary
carbohydrate. However, the amniotic fluid lactate
concentration of dams fed 0% carbohydrate did not differ from
lactate values of any ether diet and the actual lactate value
(at 0%) lay between the values at 12 and 60% carbohydrate
diets. No information could be found on amniotic fluid
lactate concentrations in the rat.
In this study the nitrogen metabolism of the maternaI
system and the amniotic fluid was also investigated. When
the availability of glucose is limited in an animal,
gluconeegenesis from amino acids can occur. The oxidation of
amine acids produces ni trogen, as ure a and ammonia (Freinkel
et al 1972). In the present study, when the dietary
carbohydrate was low and carbohydrate status impaired,
amniotic fluid urea nitrogen and urie acid and maternaI urea
nitrogen were raised.
In the fedjfasted model, where "accelerated starvation"
is observed (Freinkel et al 1972), an increase in total
urinary nitrogen on the first day of fasting was due te the
presence of both urea and ammonia. However, on the second
day of fasting the increase in urinary nitrogen was almost
108
ft

..... entirely due to ammonia. Herrera et al (1969) also observed
that urinary ure a accounted for a greater portion of urinary
nitrogen than ammonia on the first day of fasting while
urinary ammonia increased by the second day of fasting.
However, in Herrera's study urea still accounted for half the
urinary ni trogen . The increase in ur inary ni trogen was
attributed to gluconeogenesis from amino acids in the liver
(urea) and the kidney (ammonia) (Freinkel et al 1972; Herrera
et al 1969). N'either study measured blood values for urea or
ammonia. In this study amniotic fluid ammonia was not
affected by diet. However, the measurements may not
accurately reflect the ammonia concentrations in vivo because
the amniotic fluid was frozen and thawed a number of times
before ammonia analysis and therefore, ammonia concentrations
could have been altered, particuiarly as arnrnonia
concentrations are not very stable (Mondzac et al 1965). The
ure a levels in both the maternaI plasma and amniotic fluid
decreased as the level of dietary carbohydrate increased which
correlated with decreased hepatic gluconeogenesis which would
be required in dams receiving increased dietary carbohydrate.
It is possible that urea was also produced from amino acids
entering the gluconeogenic pathway in the fetal liver as
Girard et al (1977) have demonstrated premature fetal glucose
synthesis in cul tured hepatic slices after four days of
maternaI fasting. However, fetal gluconeogenesis has not been
observed in vivo after 24 hours of maternaI fasting (palacin
109

~ ,\
1
(
et al (1987). Therefore, it is not clear based on distinctly
different methodological approaches whether or not fetal
gluconeogenesis could occur when the pregant dams are fed very
low carbohydrate diets. Unlike the results in this study,
Romsos et al (1981) did not observe a difference in maternaI
plasma ure a ~itrogen levels between pregnant dogs fed a 0%
carbohydrate diet and bitches fed a 44% carbohydrate diet.
The concentrations of both maternaI triglyceride and urie
acid followed the same pattern in that dams with high
triglyceride levels had high uric acid levels and those with
low triglyceride levels also had low uric acid levels. Dams
fed 4% dietary glucose or fructose, regardless of the lipid
source, had the highest concentrations. This relationship is
weIl documented in humans, particularly unhealthy individuals
with a disturbance in their earbohydrate metabolism (eg.
diabetic, glucose intolerant, obese, etc.), with urie acid
levels being high when triglyceride levels are high (Fox et
al 1985; Bastow et al 1988; Modan et al 1987; Halkin et al
1988). The reasons for this relationship are not clear and
a mechanism has not been proposed. However, both have been
associated with hyperinsulinemia (Modan et al 1987; Halkin et
al 1988) and cation imbalance (Halkin et al 1988) of which
insulin is a regulator.
Early reproductive parameters were aIse affected by the
level of dietary carbohydrate in the diet. The resorption
rate was significantly higher in dams fed 0% carbohydrate
110

r
, -'
compared ta dams fed 4, 12 or 60% carbohydrate. Therefore,
there is a requirement for dietary carbohydrate to ensure
fetal growth. Resorptions occur early in gestation, before
the pregnant animal is fully stressed by the lack of dietary
carbohydrate and the compromised carbohydrate status. The
mechanism behind the increase in resorptions is not known.
A lack of circulating glucose may be a possible signal as
glucose is considered the principle form of metabol izable
energy used by the embryo (Giroud 1970). Studies using embryo
culture have shown that exposure of the embryo to ketone
bodies can be toxic, producing abnormal morphogenesis (Horton
and Sadler 1983). Perhaps, the toxic effect of ketone bodies
could lead to increased resorptions of the embryo and early
fetus. However, it is known that in late fetal life that
ketone bodies can be an important source of energy for the
fetus when the glucose supply is compromised (Rudol f and
Sherwin 1983).
Cumulative food intake did not differ among the dams fed
the triglyceride based diets. Total weight gain jur ing
gestation increased wi th the level of carbohydrate in the
diet. Similar results were reported by Koski et al (1986)
al though the actual weight gained was less than hal f tile
values reported in this study. Weight gain was not different
between dams fed high fructose and high glucose diets in the
study of Bourne et al (1975) and no differences were found
between glucose and fructose fed dams in the present study.
111

'f
1) 1 1
:r
The weights of the fetus and the fetal-placental units,
like maternaI weight gain, increased as dietary carbohydrate
increased. Koski et al (1986) also reported an increasing
fetal weight with increasing concentrations of dietary
carbohydrate. As the concentration of carbohydrate in the
diet increased, the following parameters increased: maternaI
weight gain, fetal weight, fetal-placental unit weight,
resorption and in utero death rates, maternaI and fetal liver
glycogen, amniotic fluid glucose and maternaI plasma lactate;
and while others decreased: percent live pups, maternaI urea
nitrogen and amniotic fluid urea nitrogen and urie acid.
These results reinforce earlier studies (Koski et al 1986)
which demonstrated that carbohydrate is an essential component
of the diet during pregnancy in the rat.
Carbohydra~e source in very lov carbohydrate die~s
The effect of the source of carbohydrate was also
investigated when animaIs were fed low carbohydrate diets.
This experiment could then determine whether at low levels,
dietary fructose or lipid-qlycerol could fully replace dietary
glucose. Like the results from animaIs fed diets that were
triglyceride based, the source of glucose equivalent did not
affect the parameters that measured carbohydrate status.
However, there were important measurements that were impaired
by the substitution of glucose by fructose or lipid-glycerol,
Ieading to the conclusion that, though carbohydrate status per
se was not affected, the health of the dams and fetuses were
112

c::œpranised by the presence of only fructose or lipid~lycerol
in these low ca:rixlhyàrate cliets.
Fructose was a less successful carOOhydrate source than
glucose. Dams fed 4% fructose had lower focxi intake, maternaI
weight gain am fetal, placental am fetal-placental unit
weights than dams fed glucose or lipid-qlycerol. '!he low focxi
intake of dams fed fructose could have contributed ta the
lower weights of the ether parameters, aIl of which were
significantly lower than dams fed glucose. '!he diet was
of fatty acids, an unusual source of lipid, and
fnlctœe, a relatively unc::cmoon sugar, a canbination which may
have led ta the la.Ner food intake of these dams conpared ta
ethers.
Glucose fed dams also had a placental weight greater than
dams fed fl:uctose or lipid~lyc:erol. In fact, the placental
weight ~ higher than dams fed all the other diets,
incll.1Ciirç 60% carbahydrate, at 0.46 qrams conpared ta an
average of 0.40 grams, respectively. '!he reason behirrl this
enlazqed placenta is net clear. However, the enlarged
placenta! might have produc::ed a greater placental: fetal weight
ratio which pemaps was necessary for fetal sw:vi val. '!he
lower fetal weights of the fructose am lipid-glycerol fed
arûmals, pertlaps, did net imuce sudl an adaptive increase in
placental weight.
Regardi.n:;J the reproductive perfonnanca of the dams,
fructose fecl dams did net cliffer fran glucose fed dams, while
113

(
(
dams fed lipid-glycerol had a high rate of in utero deaths.
It appears that qlucose at this low dietary level can not be
fully replaced by lipid-glycerol. The result of this
substitution of glucose by lipid-glycerol was a large number
of in utero deaths (27%). clearly the absence of dietary
carbohydrate, either as glucose or fructose, has a very
negative impact on fetal mortality as aIl diets containing
even 4% carbohydrate had significantly lower in utero deaths.
Dams fed very low carbohydrate diet in previous studies have
delivered one day later than dams fed high carbohydrate diets
(Koski and Hill 1986: Koski et al 1989: Koski and Hill 1989).
The delay in development may result in fetuses which can not
cope with aC-section delivery at day 21 of gestation because
maturity of the fetus is reached at day 22. Curiously, in a
previous study by Koski and Hill (1989), dams fed a 4% glucose
fatty acid based diet had a greater stillbirth rate than dams
fed a 0% carbohydrate triglyceride based diet. However, these
dams were allowed to deliver naturally and a day later than
the dams in this study.
In surveying the results of the animaIs fed the
triglyceride based diets, one notes that in three parameters
measured, the 0% carbohydrate diet behaves unusually.
MaternaI plasma triglyerides and uric acid concentrations in
dams fed 0% carbohydrate are lower than dams fed 4%
carbohydrate while maternal triglycerides and uric acid levels
decrease from 4 to 60% carbohydrate. Amniotic fluid lactate
114

.......
--
concentrations in dams fed 0% carbohydrate do not differ
significantly from dams fed any other level of carbohydrate.
However, amniotic fluid lactate levels increase in dams from
4 to 60% carbohydrate. These results may be due to the slower
development of the fetuses of 0% carbohydrate fed dams (22 day
gestation) than fetuses of dams fed diets with carbohydrate
present (21 day gestation) •
The present study did not demonstrate, in general,
differenees between pregnant rats and their fetuses fed
glucose or fructose. It appears that the mother acts as a
buffer for the fetus, efficiently converting fructose to
glucose, a fuel the fetus can use. It is known in non
pregnant rats that there is an adaption to chronic feeding of
dietary fructose. Fructolytic enzymes, such. as fructokinase
(Chevalier et al 1972), fructose-1-phosphate aldolase (Heinz
1972) and triokinase (Heinz 1972), increase while glucose-6-
phosphata se (Freedland and Harper 1957) decreases in fructose
fed animals. These changes allow a rapid conversion of
fructose to glucose. If this also oceurs in the pregnant
animal then dietary fructose would be essentially equivalent
to dietary glucose in its ability to supply metabolizable
glucose to the mother and fetus.
Toxic effects of fructose were not evident in the
pregnant rats and fetuses. It appears that fructose feeding
does not overload the liver as acute loads do and that the
115

(
'1
{
dams under chronit:: feeding conditions can metabolize fructose
without producing high amounts of lactic acid and uric acid.
Romsos and Leveille (1974) have shown that fructose feeding
increases the ATP concentrations in the liver of non-pregnant
rats. This may be a.1 adaptation to dietary fructose which
prevents the depletion of ATP which occurs with acute loads
of fructose and which also leads to increased uric acid
production.
Although the present study does not produce any results
which strongly suggest dietary fructose during pregnancy is
toxic, this does not mean that fructose as the maj or dÎE!tary
carbohydrate component can be used wi th equanimi ty . Many
parameters (eg. plasma insulin and glucagon and tissue trace
metal levels) have still not been measuredi the negative
consequences, if any, of the enlarged liver in dams fed high
fructose diets in this study; the disturbances in maternaI
lipid metabolism shown by Bourne et al (1975) have not been
elucidated: finally, it is not known whether these results
would be the same as those using diabetic animaIs or whether
the combination of diabetes and fructose could produce
markedly different effects upon carbohydrate and Iipid
metabolism in the mother and fetus. The resul ts of the
present study do suggest that moderate levels of fructose are
not harmful to the pregnant rat. Finally, it should be noted
that this study was conducted on rats and extrapolation of
these results to the human must be do ne with extreme caution,
116
.

-
-
preferably with further evidence from human studies during
pregnancy.
117

(
( ....
APPENDIX 1: STATISTICAL METHODS
l)Triqlycerida basad diets:
a) maternaI, amniotic fluid and fetal data wi th one pooled value per dam:
PROC GLM; CLASS CHOL CHOS; MODEL GLUCOSE = CHOL CHOS CHOL*CHOS; CONTRAST '0 VS 4'CHOL -1 1 0 0; CONTRAST '0 VS 12'CHOL -1 0 1 0; CONTRAST '0 VS 60'CHOL -1 0 0 1; CONT~ST '4 VS 12'CHOL 0 -1 1 0; CONTRAST '4 VS 60'CHOL 0 -1 0 1; CONTRAST '12 VS 60'CHOL 0 0 -1 1;
b)interaction between level and source of carbohydrate:
PROC GLM; CLASS CHOL CHOS; MODEL MLIVWT = CHOL CHOS CHOL*CHOS; CONTRAST 'INTERAVE1'CHOL*CHOS 1 -1 1 -1 1 -1 -3 3; CONTRAST 'INTERAVE2'CHOL*CHOS 1 -1 1 -1 -2 2 0 0; CONTRAST 'INTERAVE3'CHOL*CHOS 0 0 0 0 1 -1 -1 1;
c)fetal data recorded by individual fetus:
PROC GLM; CLASS CHOL CHOS; MODEL FETALWEIGHT = CHOL CHOS CHOL*CHOS DAMNO(CHOL CHOS) ; TEST H = CHOL CHOS CHOL*CHOS E = DAMNO(CHOL CHOS) ;
d) calculation of contrasts for fetal data recorded by individual fetus:
PROC GLM: CLASS CHOL CHOS; MODEL GLUCOSE = C.HOL CHOS; CONTRAST '0 VS 4'CHOL -1 1 0 0; CONTRAST '0 VS 12'CHOL -1 0 1 0: CONTRAST '0 VS 60'CHOL -1 0 0 li CONTRAST '4 VS 12'CHOL 0 -1 1 0: CONTRAST '4 VS 60'CHOL 0 -1 0 li CONTRAST '12 VS 60'CHOL 0 0 -1 1;
This program was rune The SS (sums of squares) for each contrast was then divided by the mean square of the dam. The mean square of the dam was acquired from the program run in c (above) by dividing the TYPE III S8 of the OAMNO(CHOL*CHCS) by the OF (degrees of freedom) of the
118
ft

---------------------------~--
DAMNO(CHOL*CHOS). The probability was determined by looking up a table of F values with 1 and 65 degrees of freedom.
e)liver lipids and water content
PROC TTEST~ CLASS DIET~
2)4% Glucose equivalent diets:
a)maternal, amniotic fluid and fetal data with one pooled value per dam:
PROC GLM~ CLASS CHOS~
MODEL GLUCOSE = CHOS: CONTRAST 'GLYC VS FRU'CHOS -1 0 1~
CONThAST 'GLYC VS GLU'CHOS -1 1 O~ CONTRAST 'GLU VS FRU'CHOS 0 -1 1:
b)fetal data recorded by individual fetus:
PROC GLM; CLASS CHOS~ MODEL FETALWEIGHT = CHOS DAMNO(CHOS) ; TEST H = CHOS E = DAMNO(CHOS) ~ CONTPAST '0 VS GLU'CHOS -1 1 OIE = DAMNO(CHOS); CONTRAST '0 VS FRU'CHOS -1 0 liE = DAMNO(CHOS)~ CONTRAST 'GLU VS FRU'CHOS 0 -1 liE = DAMNO(CHOS);
c)comparison of control (60% glucose) values to the three 4% glucose equivalent diets for maternaI, amniotic fluid and fetal data with one pooled value per dam:
PROC GLM; CLASS CHOS~ MODEL GLUCOSE = CHOS: CONTRAST 'CONTROL VS 4%'CHOS 1 1 1 -3~
d)comparison of control (60% glucose) values to the three 4% glucose equivalent diets for fetal data recorded by individual fetus:
PROC GLM~ CLASS CHOS; MODEL FETALWEIGHT = CHOS DAMNO(CHOS) : TEST H = CHOS E = DAMNO(CHOS) ; CONTRAST 'CONTROL VS 4%'CHOS 1 1 1 -3/E = DAMNO(CHOS) ;
119

(
(
Biblioqraphy
Akrabawi, S. and F.W. Hill (1970) comparative glucogenicity of dietary protein and individual amino acids in the rat. Fed. Proc. 29:764 (abstract).
Allen, R.J .L. and J .S. Leahy (1966) Some effects of dietary dextrose, fructose, liquid glucose and sucrose in the adul t male rat. Br. J. Nutr. 20:339-347.
American Institute of Nutrition (1977) Report of the American Institute of Nutritional Ad Hoc Committee on Standards for Nutritional Studies. J. Nutr. 107:1340-1348.
Anderson, D.L., F.W. Hill and R. Renner (1958) Studies of the metabolizable energy of glucose for the growing chick. J. Nutr. 65:561-574.
AOAC Official Methods of Analysis (1984) 14th edition. Kj eldahl method. p16.
AOAC Official Methods of Analysis (1984) 14th edi tion. RoeseGottlieb Methode p284.
Aoyama, Y., Y. Hattori, A. Yoshida and K. Ashida (1980) Effect of glucose and fructose in a diet or a drinking water on body weight gain, liver lipid content and serum triglyceride level in four strains of rats. Nutr. Rep. Int. 22 (5) :801-810.
Aoyama, Y., Y. Hattori, A. Yoshida and K. Ashida (1981) Lipoprotein lipase activity of adipose tissue on rats fed ad libitum and refed a diet containing glucose or fructose. Nutr. Bep. Int. 24:839-846.
Aoyama, Y., R. otaki, K. Yoshino, A. Yoshida and K. Ashida (1987) Effects of dietary fructose, glucose, fibres and hypolipidemic drugs on serum and liver lipids in rats. Agric. Biol. Chem. 51(3) :671-681.
Aoyama, Y., K. Yoshino, A. Yoshida and K. Ashida (1982) Triglyceride and cholesterol in serum and lipids in liver of rats fed either glucose or fructose from a diet and a drinking fluide Nutr. Bep. Int. 26(6) :1061-1071.
Baird, J.O. (1986) Sorne aspects of the metabolic and hormonal adaptation to pregnancy. Acta. Endocrin. suppl. 277: 11-18.
Ballard, F.J. and I.T. Oliver (1964) Ketohexokinase, isoenzymes of glucokinase and glycogen synthesis from hexoses in neonatal rat liver. Biochem. 90:261-268.
120

- Baron, P., G. Griffaton and R. Lowy (1971) Metabolic inductions in the rat after an intraperitoneal injection of fructose and glucose, according to the nature of the dietary carbohydrate. Enzyme 12:481-498.
Bastow, M.D., P.N. Durrington and M. Ishola (1988) Hypertriglyceridemia and hyperuricemia:Effects of two fibric acid derivatives (bezafibrate and fenofibrate) in a doubleblind, placebo-controlled trial. Metabolism 37:217-220.
Battaglia, F.C. and G. Meschia (1988) Fetal nutrition. Ann. Rev. Nutr. 8:43-61.
Bernhart, F.W. and R.M. Tomarilli (1966) A salt mixture supplying the National Research Council estimates of the mineraI requirements of the rat. J. Nutr. 89:495-500.
Best, C.H., C.C. Lucas and J.H. Ridout (1954) The lipotropic factors. Ann. N.Y. Acad. Sci 57:646-653.
Bird, M.I. and M.A. Williams (1982) Triacylglycerol secretion in rats: Effects of essential fatty acids and influence of dietary sucrose, glucose or fructose. J. Nutr. 112: 2267-2278.
Bird, M., M.A. williams and N. Baker (1984) Triacylglycerol secretion in rats: Validation of a tracer method employing radioactive glycerol. J. Nutr. 114:1978-1985.
Bode, J.C., O. Zelder, H.J. Rumpelt and U. Wittkamp (1973) Depletion of liver adenosine phosphates and metabolic effects of intravenous infusion of fructose or sorbital in man and in the rat. Eur. J. Clin. Invest. 3:433-441.
Bondar, P.J.L. and D.C. Mead (1974) Evaluation of glucose-6-phosphate dehydrogenase from leuconostoc mesenteroides in the hexokinase method for deterrnining glucose in serum. Cl in. Chem. 20: 586 •
Boot-Handford, R.P. and H. Heath (1980) Identification of fructose as the retinopathic agent associated with the ingestion of sucrose-rich diets in the rat. Metabol ism 29(12):1247-1252.
Boot-Handford, R.P. and H. Heath (1981) The effect of dietary fructose and diabetes on the rat kidney. Br. J. Exp. Path. 62:398-406.
Bourne, A.R., D.P. RiChardson, K.R. Bruckdorfer and J. Yudkin (1975) Some effects of different dietary carbohydrates on pregnancy and lactation in rats. Nutr. Metabol. 19:73-90.
121
(
(
Brambila, S. and F.W. Hill (1966) Comparison of neutral fat and free fatty acids in high lipid-low carbohydrate diets for the growing chicken. J. Nutr. 88:84-92.
Bruckdorfer, K.R., I.H. Khan and J. YUdkin (1972) Fattyacid synthet.ase activity in the liver and adipose tissue of rats fed with various carbohydrates. Biochem. 129:439-446.
Bucolo, G. and H. David (1973) Quantitative determination of serum triglycerides by the use of enzymes. Cl in. Chem. 19:476.
Burch, H.B., O.H. Lowry, A.M. KUhlman, J. Skerjance, E.J. Diamant, S.R. Lowry and P. Van Dippe (1963) Changps in patterns of enzymes of carbohydrate metabolism in the developing rat liver. J. Biol. Chem. 238:2267-2273.
Casado, J., X. Remesar and M. Pastor-Anglada (1987) Hepatic uptake of gluconeogenic substrates in late-pregnant and midlactating rats. Bioscience Rep. 7:587-592.
Cerklewski, F. (1979) Determination of a copper requirement to support gestation and lactation for the female albino rat. J. Nutr. 109:1529-1533.
Champigny, o. and Y. Hitier (1987) Lipoprotein lipase activity in skeletal muscle and brown adipose tissue of pregnant and lactating rats. J. Nutr. 117:349-354.
Chevalier, M.M., J.H. Wiley and G.A. Leveille (1972a) The age-dependent response of serum triglycerides to dietary fructose. Proc. Soc. Exp. Biol. Med. 139:220-222.
Chevalier, M.M., J.H. Wiley and G.A. Leveille (1972b) Effect of dietary fructose on fatty acid synthesis in adipose tissue and liver of the rat. J. Nutr. 102:337-342.
Cox, W.M. Jr. and M. Imboden (1936) The mineraI composition of young rats. J. Nutr. 11:177.
Davies, J. (1955) Permeability of the rabbit placenta to glucose and fructose. Am. J. Physiol. 181:532-539.
Dewan, J.G. (1938) The L[+]-glutamic dehydrogenase of animal tissues. Blochem. J. 32:1378.
Douglas, J. C. and G.J. Beckett (1982) Plasma lactate and urate concentrations fOllowing oral fructose in patients with liver disease. Digestion 25:263-268.
122
ft

----------------------- -- ----- - - ---------
,JI •
'."
Emmerson, B.T. (1974) Effect of oral fructose on urate production. Ann. Rheum. Dis. 33:276-280.
Fields, M., R.J. Ferretti, J.M. Judge, J.C. smith and S. Reiser (1985) Effects of different dietary carbohydrates on hepatic enzymes of copper-deficient rats. Proc. Soc. Exp. Biol. Med. 178:362-366.
Fossati, P., L. Prencipe and G. Berti (1980) Use of 3,5-dichloro-2-hydroxybenzene sulfonic acid/4-aminophenazone chromogenic system in direct enzymic assay of urie acid in serum and urine. Clin. Chem. 26:227.
Fox, T.H., D. John, S. DeBruyne, I. Dwosh and E.B. Marliss (1985) Hyperuricemia and hypertriglyceridemia: Metabolic basis for the association. Metabolism 34:741-746.
Freedland, R.A. and A.E. Harper (1957) Met3bolic adaptations in higher animaIs. I.Dietary effect on liver glucose-6-phosphatase. J. Biol. Chem. 228:743.
Freinkel, N., B.E. Metzger, M. Nitzan, J.W. Hare, G.E. Shambaugh III, R.T. Marshall, B.Z. Surmaczynska and T.C. Nagel (1972) "Acce1erated starvation" and mecl1.anisms for the conservation of materna1 N during pregnancy. Israel J. Med. Sci 8(3} :426-439.-
Freund, N., A. Kervran, R. Assan, J.-P. Ge1oso and J. Girard (1980) Fetal metabo1ic response to phloridzin-induced hypoglycaemia in pregnant rats. Biol. Neonate 38:321-327.
Fukuda, H., N. Iritani and T. Tanaka (1983) Effects of high fructose diet on lipogenic enzymes and their substrate and effector levels in diabetic rats. J. Nutr. Sei. Vitaminol 29:691-699.
Gilbert, M. and J. Bourbon (1980) Effects of acute variation of fetal glycemia on glycogen st orage and on glycogen synthase and phosphorylase activities in the liver of the rat fetus. Diabetes 29:266-271.
Gilbert, M., J.W. Sparks, J. Girard, and F.C. Battaglia (1985) Effects of fasting on glucose turnover rate and metabolite levels in conscious pregnant guinea pigs. Biol. Neonate 48: 90-99.
Girard, J.R. (1975) Metabolic fuels of the fetus. Isr. J. Med. Sci. 11:591-600.
Girard, J.R., P. Ferre, M. Gilbert, A. Kervran, R. Assan and E.B. Marliss (1977) Feta1 Metabo1ic response to matern~l fasting in the rat. Am. J. Phys. 232:E456-E463.
123

( ..
Giroud, A. (1970) The Nutrition of the Embryo Charles C. Thomas, Springfield.
Goodner, C.J. and D.J. Thompson (1967) Glucose metabolism in the fetus in utero: The effect of maternaI fasting and glucose loading in the rat. Ped. Res. 1:443-451.
Grand, R.J., M.I. Schay and S. Jaksina (1974) Development and control of intestinal and hepatic fructokinase. Pediat. Res. 8:765-770.
Halkin, H., M. ~odan, M. Shefi and S. Almog (1988) Altered erythrocyte and plasma sodium and potassium in hypertension, a facet of hyperinsulinemia. Hypertension 11:71-77.
Hallfrisch, J. (1987) of Dietary Fructose, Florièa.
Metabolism. In: Metabolic Effects pp. 25-40, CRC Press, Boca Raton,
Heinz, F. (1972) Metabolisrn of fructose in liver. Acta med. Scand. 542:27-36.
HelIer, G., H. Forster and H.P. Fortmeyer (1977) Influence of the various dietary carbohydrates on the concentration of metabolites and the activity of enzymes in the liver of diabetic rats. Nutr. Metab. 21(Suppl. I):177-180.
Henry, R.J. (1968) In: Clinical Chemistry-Principles and Technics, pp. 664-666, Harper and Row, New York.
Herrera, E., R.H. Knopp and N. Freinkel (1969) Carbohydrate metabolism in pregnancy. VI. Plasma fuels, insulin, liver composition, gluconeogenesis and nitrogen metabolism during late gestation in the fed and fasted rat. J. Clin. Invest. 48:2260-2272.
Herzberg, G.R. and M. Rogerson (1988a) Interaction of dietary carbohydrate and fat in the regulation of hepatic and extrahepatic lipogenesis in the rat. Br. J. Nutr. 59:233-241.
Herzberg, G.R. and M. Rogerson (1988b) Hepdtic fatty acid synthesis and triglyceride secretion in rats fed fructose- or glucose-based diets containing corn oil, tallow or marine oil. J. Nutr. 118:1061-1067.
Horton, W.E. and T. W. Sadler diabetes on early embryogenesis. produced by the ketone body, 32:610-616.
124
(1983) Effects of maternaI Alterations in morphogenesis ~-hydroxybutyrate. Diabetes

Hq,stmark, A.T., O. Spydevold, E. Lystad and E. Eilertsen (1982) Plasma lipoproteins in rats fed starch, sucrose, glucose or fructose. Nutr. Rep. Int. 25:161-167.
Hq,stmark, A.T., O. Spydevold, E. Lystad and A. Haug (1984) Apoproteins in lipoproteins of d<1.063 g/ml from rats fed glucose and fructose diets. Nutr. Rep. Int. 29:1361-1368.
Ingermann, R.L. (1987) Control of placental glucose transfer. Placenta 8:557-571.
Israel, K.O., 0 . E. Michael is IV, S. Re iser and M. Keeney (1983) Serum uric acid, inorganic phosphorus and glutamicoxalacetic transaminase and blood pressure in carbohydratesensitive adults consuming three different levels of sucrose. Ann. Nutr. Metab. 27:425-435.
Kang, S.S., K.R. Bruckdorfer and J. Yudkin (19'9) Influence of different dietary carbohydrates on liver and plasma constituents in rats adapted to meal feeding. Nutr. Metab. 23:301-315.
Kannan, R., N. Baker and K.R. Bruckdorfer (1981) Secretion and turnover of very low density lipoprotein triacylglycerols in rats fed chronically diets rich in glucose and fructose. J. Nutr. 111:1216-1223.
Karimzadegan, E. (1978) Studies of the nutritional bioavailability of carbohydrates: Development of a rat bioassay. Ph.D. dissertation, University of California, Davis, California.
Karimzadegan, bioassay for carbohydrates carbohydrates
E., A.J. Clifford and F.W. Hill (1979) A rat measuring the comparative availability of and its application to legume foods, pure
and polyols. J. Nutr. 109:2247-2259.
Karvonen, M.J. and N. Raiha (1954) Permeability of placenta of the guinea pig to glucose and fructose. Acta. Physiol. Scandinav. 31:194-202.
Keen, C.L., P. Mark-Savage, (1983) Teratogenic effects Relation to copper deficiency.
B. Lonnerdal and L. S. Hurley of D-penicillamine in rats: Drug Nutr. Interact. 2:17-34.
Koski, K.G. and F.W. Hill (1986) Effect of low CHO diets during pregnancy on parturition and postnatal survival of the newborn rat pUpe J. Nutr. 116:1938-1948.
Koski, K.G., R. Baillie and F.W. Hill (1990) A comparison of protein verses carbohydrate supplementation during reproduction in rats. J. Nutr. (submitted).
125

(
(
Koski, K.G. and F.W. Hill (1989) Evidence for a critical period during late gestation when maternaI dietary carbohydra'te is essential for survival of the newborn rat. J. Nutr. (submitted).
Koski, K.G., F.W. Hill and L.S. Hurley (1986) Effect of low CHO diets during pregnancy on embryogenesis and fetal growth and development in rats. J. Nutr. 116:1922-1937.
Koski, K.G., F.W. Hill and B. Lonnerdal (1989) Altered lactation in rats fed low carbohydrate diets and its effect on growth of the suckling rat pUpe J. Nutr. (submitted).
Koski, K.G. and M. Mancini (1989) Influence of carbohydraterestricted versus calorie-restricted diets on rat placental glycogen. Nutr. Rev. (in press) •
Kriss, M. and R.C. Miller (1934) The derivation of factors for computing the gaseous exchange and the heat production in the metabolism of case in by albino rats. J. Nutr. 8:647-669.
Leturque, A., S. Hauguel, S. Ferré and J. Girard (1987) Glucose metabolism in pregnancy. Biol. Neonate 51:64-69.
Lo, Siu, J.C. Russell and A.W. Taylor of glycogen in small tissue samples. 28 (2) :234-236.
(1970) Determination J. Appl. Physiol.
Margolis, R.N. metabolism in 113 (3) :893-902.
(1983) pre- and
Regulation of hepatic glycogen postnatal rats. Endocrinology
Maruhama, Y. and I. MacDonald (1972) Some changes in the triglyceride metabolism of rats on high fructose or glucose diets. Metabolism 21(9) :835-842.
Merkens, L. S. , H • M. Tepperman and J. Tepperman ( 1980 ) Effects of short-term dietary glucose and fructose on rat serum triglyceride concentration. J. Nutr. 110:982-988.
Metzger, B.E., J.W. Hare and N. Freinkel (1971) Carbohydrate metabolism in pregnancy IX: Plasma levels of gluconeogenic fuels during fasting in the rat. J. Clin. Endocr. Metab. 33: 869-872.
Michaelis, O.E. and B. Szepesi (1973) Effect of various sugars on hepatic glucose-6-phosphate dehydrogenase, malic enzyme and total liver lipid of the rat. J. Nutr. 103:697-705.
126

r
-... l' -
Miettinen, E. -L. and R. M. Kliegman (1983) Fetal and neonatal responses to extended maternaI canine starvation II. Fetal and neonatal liver metabolism. Ped. Res. 17:639-644.
Modan, M., H. Halkin, A. Karasik and A. Lusky (1987) Elevated serum uric acid - a facet of hyperinsulinemia. Diabetologia 30:713-718.
Mondzac, A.,G.E. Ehrlich and J.E. 5eegmiller (1965) An enzymatic determination of ammonia in biological fluids. ~ Lab. Clin. Med. 66:526.
Naismith, D.J. and I.A. Rana (1974) Sucrose and hyperlipidaemia. Nutr. Metabol. 16:285-294.
National Research Council (1978) Nutrient requirements of the laboratory rat. In: Nutrient Requirements of Laboratory AnimaIs (National Research Council Subcommi ttee on Animal Nutrition) , pp. 7-37, National Academy of Sciences, Washington, D. C.
Ogata, E.5., M.E. Bussey and S. Finley (1986) Altered gasexchange, limited glucose and branched chain amine acids, and hypoinsulinemia retard fetal growth in the rat. Metabolism 35: 970-977.
Palacin, M., M.A. Lasuncion and E. Herrera (1987) Lactate production and absence of gluconeogenesis from placental transferred substrates in fetuses from fed and 48-H starved rats. ped. Res. 22:6-10.
Patek, A.J., R.F. Kendall, N.M. de Fritsch and R.L. Hirsch (1966) Cirrhosis-enhancing effect of corn oil. Arch. Pathol. 82: 596-601.
Philipps, A.F., B.5. Carson, G. Meschia and F.C. Battaglia (1978) Insulin secretion in fetal and newborn sheep. Am. J. Physiol. 235:E467-E474.
Poulsom, R. (1986) sucrose or fructose 21: 104-134.
Morphological changes of organs after feeding. Prog. Biochem. Pharmacol.
Reiser, S. (1987a) Lipogenesis and blood lipids. In: Metabolic Effects of Dietary Fructose, pp. 83-111, CRe Press, Boca Raton, Florida.
Reiser, s. (1987b) Uric acid and lactic acid. In: Metabolic Effects of Dietary Fructose, pp. 113-134, CRC Press, Boca Raton, Florida.
127

(
(
(
Renner, R.C. (1964) Studies on the effectiveness of different carbohydrates in promoting the utilization of carbohydrate and glycerol-free diets. Fed. Proc. 29: 764 ( abstract) .
Renner, R. and J.W. Hill (1958) Metabolizable energy values of fats and fatty acids for chickens. Proc. Cornell Nutr. Conference 95.
Renner, R. and J. W. Hill (1961) Factors affecting the absorbability of saturated fatty acids in the chick. J. Nutr. 74:254-258.
Romsos, D.R. and G.A. LeveiIIe (1974) Effect of dietary fructose on in vitro and in vivo fatty acid synthesis in the rat. Biochim. Biophys. Acta. 360:1-11.
Romsos, D.R., H.J. Palmer, K. L. Muiruri and M.R. Bennink (1981) Influence of a Iow carbohydrate diet on performance of pregnant and lactating dogs. J. Nutr. 111:678-689.
Rudolf, M.C.J. and R.S. Sherwin (1983) MaternaI ketosis and its effects on the fetus. Clin. Endocrin. Metab. 12:413-428.
Salmon, W.D. and D.M. Newberne (1962) Cardiovascular disease in choline deficient rats. Arch. Pathol. 73:190-209.
Schulz, A.R. (1975) Computer based method for estimation of the available energy of amino acids and proteins. In: protein Nutritiona1 Quality of Foods and Feeds (Freedman, M., ed.), Volume l, Part l, pp. 235-259, Marcel DeIcker, Inc., New York.
Seifter, S., S. Dayton, B. Novic and E. Muntwy1er (1950) The estimation of glycogen with anthrone reagent. Arch. Biochem. Biophys. 25:191-200.
shelley, H.J. (1960) Blood sugars and tissue carbohydrate in foetal and infant Iambs and rhesus monkeys. J. Physiol. 153:527-552.
Shelley, H.J. (1961) G1ycogen reserves and their changes at birth and in anoxia. Brit. Med. Bull. 17:137-143.
Shelley, H.J. and G.A. Ne1igan (1966) Neonatal hypog1ycemia. Br. Med. Bu~ 22(1):34-39.
Simmons, M.A., G. Meschia, E.L. Makowski and F.C. Battaglia (1974) Fetal metabo1ic response to maternaI starvation. Ped. Res. 8:830-836.
128
-, " \ ~.
Sleder, J., "l.I. Chen, M.D. Cully and G.M. Reaven (1980) Hyperinsulinemia in fructose-induced hypertriglyceridemia in the rat. Metabolism 29(4):303-305.
Sugawa-Katayama, Y. and N. Morita (1977) Effect of a high fructose diet on lipogenic enzyme activities of meal-fed rats. J. Nutr. 107:534-538.
Talke, H. and G.E. Schubert (1965) Enzymatische harnstoffbestimmunq im blut und serum im optischen test nach warburg. Klin. Wochschr. 43:174.
Taylor, S.A., R.E. Schrader, K.G. Koski and F.J. Zeman (1983) MaternaI and embryonic response to a "carbohydrate-free" diet fed to rats. J. Nutr. 113:253-267.
Van den Berghe, Georges (1986) Fructose: Metabol isrn and short-terrn effects on carbohydrate and purine metabolic pathways. prog. Biochem. Pharamcol. 21:1-32.
Verschoor, L., Y-D.L. Chen, E.P. Reaven and G.M. Reaven (1985) Glucose and fructose feeding lead to alterations in structure and function of very low density lipoproteins. Horm. Metabol. Res. 17:285-288.
Vrana, A., P. Fabry and L. Kazdova (197 4a) Lipoprotein lipase activity in heart, diaphragm and adipose tissue in rats fed various carbohydrates. Nutr. Metabol. 17:282-288. Vrana, A., P. Fabry and L. Kazdova (1976) Effects of dietary fructose on serum triglyceride concentrations in the rat. Nutr. ReD. Int. 14:593-596.
Vrana, A., P. Fabry and L. Kazdova (1978) Liver glycogen synthesis and glucose tolerance in rats adnpted to diets with a high proportion of fructose or glucose. Nutr. Metab. 22: 262-268.
Vrana, A., P. Fabry, Z. Slabochova and L. Kazdova (1974b) Effect of dietary fructose on free fatty acid release fram adipose tissue and serum free fatty acid concentration in the rat. Nutr. Metab. 17:74-83.
Vrana, A., R. Gonzalez and L. insulin response of adipose hypertriglyceridemia in the rat, Rep. Int. 37(4):767-772.
Kazdova (1988) Decreased tissue in fructose-induced a postreceptor defect? Nutr.
Vrana, A., J. Raulin, C. Loriette and L. Kazdova (1983) Basal pyruvate dehydrogenase activity in the liver, adipose tissue and brain of rats with fructose-induced hypertriglyceridemia. Nutr. ReD. Int. 28:1437-1444.
129

(
( "
Waddell, M. and H.J. Fallon (1973) The effect of high carbohydrate diets on liver triglyceride formation in the rat. J. Clin. Invest. 52:2725-2731.
Waibel, P.E., H.R. Bird and C.A. Baumann (1954) Effects of salts on the instability of thiamine in ~urified chick diets. J. Nutr. 52:273-283.
Walker, D. G. (1963) The postnatal development of hepatic fructokinase. Biochem. J. 87:576-581.
Wapnir, R.A. and L. Stiel (1985) Fetal glycerol metabolism in experimental maternaI lipemia. Proc Soc. Exp. Biol. Med. 178: 546-550.
Waterman, R.A., D.R. Romsos, A.C. Tsai, E.R. Miller ~nd G.A. Leveille (1975) Effects of dietary carbohydrate source on growth, plasma metabolites and lipogenesis in rats, pigs and chicks. Proc. Soc. Exp. Biol. Med. 150:220-225.
Watts, C. and K.R. Gain (1976) Glycogen metabolism in the liver of the developing rat. Biochem. J. 160:263-270.
Young, R.J. for chicks. 1233.
(1961) The energy value of fats and fatty acids I. Metabolizable energy. Poultry Sei. 40:1225-
Zaki, F.G., F.W. Hoffbauer and F. Grande (1965) Fatty cirrhosis in the rat. VIII. Effect of dietary fat. Arch. Pathol. 80:323-331.
Zakim, D., R.S. Pardini, R.H. Herman and H.E. Sauberlich (1967) Mechanism for the differential effects of high carbohydrate diets on lipogenesis in rat liver. Biochirn. Biophys. Acta. 144:242-251.
Zavaroni, 1., Y.I. Chen and G.M. Reaven (1982) Studies of the mechanism of fructose-induced hypertriglyceridemia in the rat. Metabolism 31(11) :1077-1083.
130
ft


