
Accepted Manuscript
Comparison of NO2 removal using date pits activated carbon and modifiedcommercialized activated carbon via different preparation methods: effect ofporosity and surface chemistry
Meriem Belhachemi, Mejdi Jeguirim, Lionel Limousy, Fatima Addoun
PII: S1385-8947(14)00568-3DOI: http://dx.doi.org/10.1016/j.cej.2014.05.004Reference: CEJ 12098
To appear in: Chemical Engineering Journal
Received Date: 24 January 2014Revised Date: 1 May 2014Accepted Date: 2 May 2014
Please cite this article as: M. Belhachemi, M. Jeguirim, L. Limousy, F. Addoun, Comparison of NO2 removal usingdate pits activated carbon and modified commercialized activated carbon via different preparation methods: effectof porosity and surface chemistry, Chemical Engineering Journal (2014), doi: http://dx.doi.org/10.1016/j.cej.2014.05.004
This is a PDF file of an unedited manuscript that has been accepted for publication. As a service to our customerswe are providing this early version of the manuscript. The manuscript will undergo copyediting, typesetting, andreview of the resulting proof before it is published in its final form. Please note that during the production processerrors may be discovered which could affect the content, and all legal disclaimers that apply to the journal pertain.
1
Comparison of NO2 removal using date pits activated carbon and
modified commercialized activated carbon via different preparation
methods: effect of porosity and surface chemistry
Meriem Belhachemia,c, Mejdi Jeguirimb*, Lionel Limousyb, Fatima Addounc
aLaboratoire de Fiabilité des matériaux et des structures en région sahariennes. Université de Béchar,
B.P 417, 08000 Béchar, Algeria
bInstitut de Science des Matériaux de Mulhouse, UMR 7361 CNRS, 15, rue Jean Starcky 68057
Mulhouse, France
cLaboratoire d’étude physico-chimique des matériaux et application à l’environnement, Faculté de
Chimie, USTHB, B.P.32, El Alia 16111 Bab Ezzouar Alger, Algeria
*Corresponding author : [email protected];
Tel: +33-3-89608661.
Abstract
This study aims to evaluate the NO2 adsorption capacities of activated carbons
prepared by physical and chemical activation of date pits and to compare them with
modified commercialized activated carbons. The texture, morphology and surface
chemistry of the different carbons were evaluated by N2 and CO2 adsorption, scanning
electron microscopy (SEM), energy dispersive X-ray spectrometry (EDX),
temperature programmed desorption coupled with mass spectroscopy (TPD-MS),
Fourier transform infrared spectroscopy (FTIR) and X-ray fluorescence (XRF)
techniques. The obtained results show that activated carbon prepared from date pits
are an efficient adsorbents for the removal of NO2 from the exhaust gases at ambient
temperature. The obtained adsorption capacities are close to the ones obtained for the
2
commercialized activated carbons. The analysis of the correlation between NO2
adsorption capacities and the textural and the surface chemistry properties shows that
a higher microporosity volume, an homegenous microporosity and the presence of
stable oxygen groups contribute strongly to the adsorption of NO2 on the activated
carbon surface. In contrast, the presence of strong acidic groups such as carboxylic,
anhydrides and lactones inhibits the reduction of NO2 into NO, which represents a
crucial step for the NO2 adsorption.
Keywords: activated carbon, date pits, microporosity, surface chemistry, NO2
adsorption
1. Introduction
The economic development of contemporary societies is followed by the consumption
of greater amounts of fossil fuels generating important air polluting chemical
compounds such as nitrogen oxides (NO, NO2), CO and sulfur oxides (SO2) which are
considered as greenhouse gases.
Several control techniques were proposed to prevent NOx emissions [1-6]. Among
these techniques combustion control and selective catalytic reduction (SCR) are
widely used. Combustion control of NOx is achieved by optimizing the combustion
process during NOx generation. The installation and operating costs of these
technologies are relatively low. However, the removal efficiency is too low (generally
30–40%) [7]. Combustion control technology could not achieve the NOx higher
removal required by the stricter environmental standards. Therefore, SCR method was
preferred by using ammonia and a catalyst to reduce NOx by producing nitrogen and
water vapor. This technology gives high NOx elimination that can reach up to a 94%.
3
However, it remains the most expensive technology. In addition, catalysts have a
finite life in flue gas and some ammonia slides without being reacted [8, 9]. Thus,
NOx control technologies aim to identify cheaper and efficient techniques.
Although various purification methods are offered, adsorption technology remains the
most common and efficient technique for removing organic and inorganic micro-
pollutants. Among various adsorbents, activated carbon is the main material used for
numerous applications. Several works are currently available for their applications in
water treatment; air pollution control; organic and inorganic pollutants elimination;
solvents and hydrocarbons recuperation; pharmaceutical compounds separation;
catalysis; hydrogen and natural gas storage [10, 11].
Activated carbon can be prepared by chemical or physical methods. The latter
technique is carried out by carbonization in an inert gas followed by activation in an
oxidant gas (CO2 or H2O). In contrast, chemical activation is carried out by heating
the precursor in the presence of an added chemical agent. Among the different
chemical reagents, ZnCl2 is one of the commonly used agent for the activation of
various precursors [12, 13]. Impregnation of lignocellulosic precursors with ZnCl2
causes degradation of the cellulosic material and, on carbonization, dehydration.
These processes result in charring and aromatization of the carbon skeleton and
creation of a porous structure. Generally, both thermal activation with CO2 and
chemical activation with ZnCl2 led to microporous activated carbons.
The removal of NO2 using activated carbons has been a potential technique [14, 15].
As a consequence, many research groups examined the factors favoring the adsorption
of NOx in order to develop specific activated carbons for this application. For
example, Bashkova and Bandoz have modified activated carbons by urea and
4
subsequent heat treatment at high temperature in order to introduce basic groups.
They have found that the modification of activated carbons has a positive effect on
adsorption properties, with NO2 uptake capacity increasing from 35 to 66 mg/g in dry
condition at ambient temperature [16]. Gao et al have used a commercial activated
carbon treated at 900°C under CO2 flow for different temperatures. They have shown
that the micropores in the carbon structure play a role of reactors for the creation of
–C(ONO2) species. These oxygen surface groups are formed by the interaction of
adsorbed NO2 on –C(O) surface complexes of activated carbon [1]. Nowicki et al.
have studied the adsorption capacity of NO2 on activated carbons issued from plum
stones. The samples were activated according to two steps: carbonization at different
temperatures (400, 500 and 600°C) and activation using KOH at constant and
increasing temperatures. The results show high surface area of 3228 m2/g and pore
volume of 1.61 cm3/g. However, the adsorption capacity of NO2 on activated carbons
does not exceed 67 mg/g. The authors have reported that the removal of NO2 depends
on the parameters and conditions of preparation [17]. Moreover, activated carbon
gives prominence results as a catalyst support for NO catalytic adsorption [2, 18, 19].
Previous studies have used activated carbon as a catalyst support of metals (Cu, Fe, )
[2,4]. Lopez et al. examined the removal activity of NO using activated carbon doped
with copper. The catalyst improves NO adsorption in the presence of oxygen, by
increasing the breakthrough time and the adsorption capacity [2]. Recently, Sousa et
al. have studied the NO oxidation using modified activated carbon as a catalyst. The
materials were impregnated with HNO3, O2, urea and melamine to obtain different
surface chemistries. Their results show high NO conversion (88%) in relation to the
NO concentration and the amount of catalyst. They have also proved that the

5
introduction of nitrogen species on activated carbons has a positive effect on the
catalytic activity [18].
The use of agriculture and agro-industrial residues as a precursor to produce activated
carbons was widely applied to convert them into value added products. Date stones
and palm tree wastes generated by the food industry are present in large amounts in
Algeria. Belhachemi et al. showed that date pits could be used as precursors to
produce activated carbons with a well-developed porosity and tailored oxygen surface
groups [20]. Hence, the purpose of this present investigation is to evaluate the
performance of these activated carbons for the removal of NO2 from air and to
compare them with modified commercialized activated carbons. The textural and
chemical surface properties of the different samples are determined and correlated to
the NO2 adsorption capacities. The main objective is to identify the activated carbon
characteristics that may improve the performance of activated carbons using date pits
as a precursor.
2. Experimental
2.1. Samples preparation
Two granular activated carbons were produced from Algerian date pits as a precursor
by physical and chemical activation using CO2 (CCO2) and ZnCl2 (CZn) agents
respectively. During CCO2 sample preparation, date stones were creased and separated
to obtain particle size between 0.5 and 1mm. After, carbonization and activation with
CO2 were performed. Raw date pits were carbonized at 825°C with a heating rate of
5°C/min under a constant flow rate of N2 (100mL/min). Then, the carbonized sample
was activated under a pure CO2 flow rate of 100mL/min at 825°C for 4 hours. Further
6
details on experimental conditions can be found in previous investigations [20]. The
second sample CZn was prepared by impregnation of 1g zinc per gram of precursor,
followed by a heat treatment at 550°C for 1.5 h (4°C/min) under nitrogen (flow rate of
100mL/min). After the sample was cooled down to room temperature, it was washed
firstly with a boiling dilute solution of HCl (to remove Zn) and finally with distilled
water until reaching a neutral pH.
In order to compare the performances of the prepared activated carbons from date
pits, a commercial activated carbon GAC (NORIT GAC 1240) was used in this study.
Moreover, in order to study the effect of surface chemistry properties, two modified
commercial activated carbons were elaborated from GAC. Hence, the commercial
activated carbon GAC was oxidized by a (NH4)2S2O8 liquid phase at 25°C for 24h to
obtain sample GAC-O. Then, the latter was washed and dried at 130°C and heated at
700°C under N2 (flow rate of 100mL/min) and kept for 1h in order to eliminate
selectively oxygen surface groups, which have a lower stability, to obtain sample
GAC-O-T. In fact, the main stable oxygen functions can be removed from carbon
surface in the range of temperature from 800 to 1000°C [21].
2.2. Characterization of activated carbons
2.2.1. Pore structure and morphology characterization
Technique of nitrogen and dioxide carbon adsorption at -196°C and 0°C respectively
was used to characterize the texture of activated carbons, using a static manometric
apparatus. The latter uses the BET method to determine the specific surface area. The
micropore volume (VN2), size less than 2 nm, was calculated from the N2 adsorption
data according to the Dubinin–Raduskevitch (DR) equation. The volume of narrow
micropore (VCO2), size less than 0.7 nm, was also determined by applying the DR
method to the CO2 adsorption isotherm. The mesoporous volume (Vmeso) was

7
obtained from N2 adsorption, by subtracting the microporous volume (VN2) from the
total porous volume (VT) adsorbed at p/po = 0.95, while the porous volume
corresponding to the wide microporosity (Vw) was obtained from the gap between the
volume of micropores (VN2) and the narrow microporous volume (VCO2) [22]. The
pore size distribution was obtained using BJH (Barrett–Joyner–Halenda) method.
Scanning electron microscopy (Philips model FEI model Quanta 400 SEM) and
energy dispersive X-ray spectrometry (EDX) were used to observe the morphology
and the surface elemental analysis of the activated carbons, which allows determining
the elemental mapping of the samples.
2.2.2. Characterization of carbon surface chemistry and composition
Qualitative and quantitative information concerning the carbon surface functionalities
were evaluated using a home-made temperature programmed desorption set-up
coupled with a mass spectrometer (TPD-MS). 10 mg of the sample was placed in a
quartz tube in a furnace and heat-treated with a linear heating rate of 5°C/min under
vacuum. The amount and nature of the oxygen functionalities present in each sample
was evaluated in the temperature range 25–900 °C.
FTIR spectra of carbon samples were measured by transmission using a Bruker
(IFS66/S) spectrometer equipped with an MCT detector cooled with liquid nitrogen.
Each sample was mixed with KBr to 0.5%wt concentration and a pellet of 1 mg was
made. All spectra were measured over the range of 4000 and 600 cm-1. A spectra
resolution of 8 cm-1 was considered and 100 scans per sample were taken.
While inorganic compounds present in the different activated carbon samples may be
at the origin of textural modification during the activation step, the main ones were

8
characterized by X-ray fluorescence (XRF) using a Magix from PHILIPS
spectrophotometer apparatus.
2.3. NO2 adsorption experiments
NO2 adsorption tests were performed in a fixed bed reactor presented in Figure 1.
These experiments were realized at room temperature (25°C) and dry conditions.
In each test 100 mg of activated carbon sample was put on a quartz frit (16 mm in
diameter) set in a vertical fused silica tube. In order to control the temperature of the
sample and the flow rate of the inlet gases, a thermocouple and mass flow meters
were used. The reactor total pressure was equal to 1 atm. Before adsorption tests,
activated carbons were outgassed at room temperature for 1h under a flow of N2.
Then, a gas stream mixture consisting of nitrogen and NO2 (500 ppmv in N2) was
admitted at a flow rate of 20 NL/h and injected through the reactor. Infrared analyser
(Rosemount NGA 2000) was used for the measurements of NO2, NO, CO2 and CO
quantities at the reactor outflow every 5 seconds.
The NO and NO2 concentrations, the flow rate, and the adsorbent mass were used to
calculate the NO2 uptake capacity in mg/g of adsorbent according to:
Where NO2ads is the adsorbed rate of NO2 in µmol/s. NO2inlet is the inlet NO2
concentration in ppmv. NO2outlet and NOoutel are, respectively, the outlet NO2 and NO
concentrations in ppmv. D is the flow rate in NL/s. VM is the molar volume at 0°C
9
(22.4 L/mol). MNO2 is the molar mass of NO2 (46000 mg/mol) and mAC is the mass of
activated carbon in g.
After adsorption experiment, temperature-programmed desorption were carried out to
evaluate adsorption capacity and to deduce the evolved gases present in each sample.
TPD results were achieved by heating the sample under nitrogen flow to 900°C at a
heating rate of 5°C/min.
3. Results and discussion
3.1 Activated carbon characterization
3.1.1. Morphology and pore structure characterizations
Scanning electron micrograph observations of the different activated carbon particles
are presented in figure 2 (a, b, c, d and e). The SEM pictures obtained with the CZn
and GAC samples present regular and smooth surfaces (Fig.2a and 2c), while the
other samples show an irregular cracked surface (Fig.2b, 2d and 2e). It means that,
according to the activation mode, the morphology of carbon particles differ. Other
SEM pictures with a lower enlargement (not show here) confirm that all the activated
carbon particles present a homogeneous diameter between 0.5 and 1 mm. In order to
go further, minerals contained in the different activated carbons were analyzed by X-
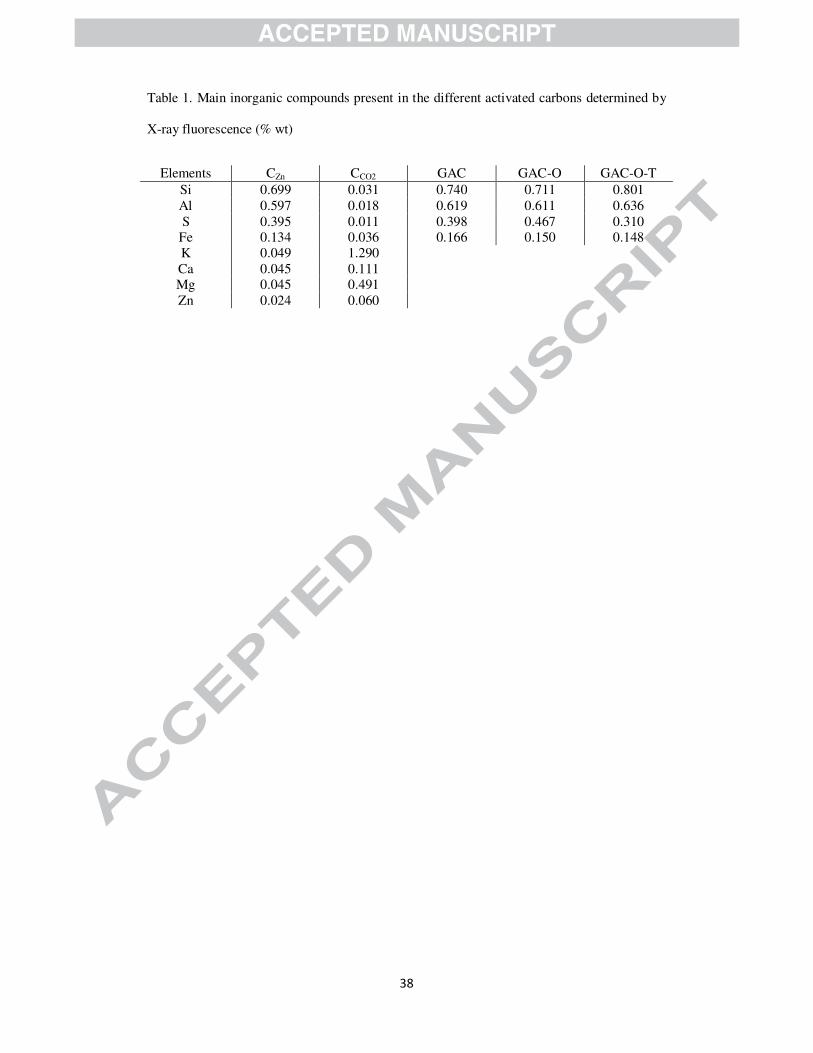
ray fluorescence. Results indicate that the main elements present in the commercial
activated carbon (GAC, GAC-O and GAC-O-T) correspond to Si, Al, S and Fe (see
Table 1). The different treatment performed on the GAC sample did not modify the
chemical composition of the activated carbons. At the opposite, an important
difference between the activated carbons obtained with the date pits after a chemical
or a physical activation is observed. The use of ZnCl2 leads to the specific extraction
of alkali and alkaline earth metals (see Table 1), while the activation with CO2
10
induces the elimination of Si, Al and Fe from the carbon matrix, and an important
decrease of the sulphur content. This result could be at the origin of the apparition of a
specific surface texture (corresponding to micropores or mesopores), while reactions
involved during the different activation mode seem to act on different sites of the
char.
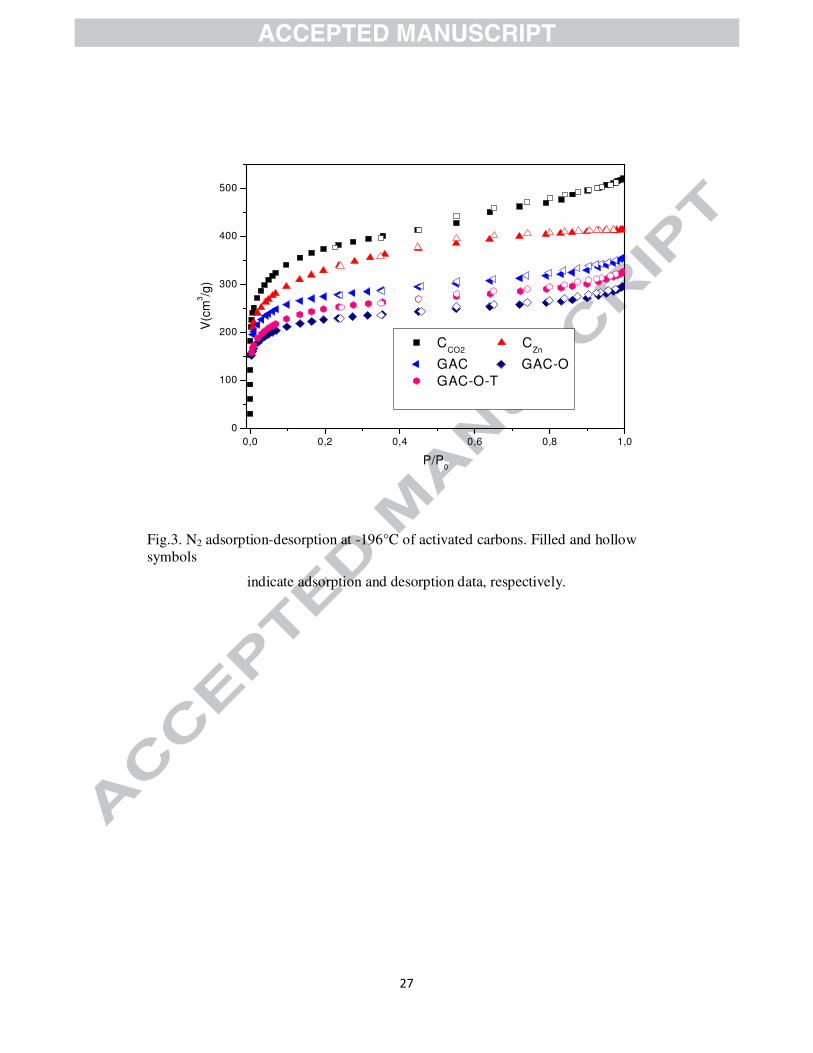
N2 adsorption-desorption isotherms obtained with the different activated carbons at -
196°C are presented in figure.3. Textural characteristics obtained from both N2 and
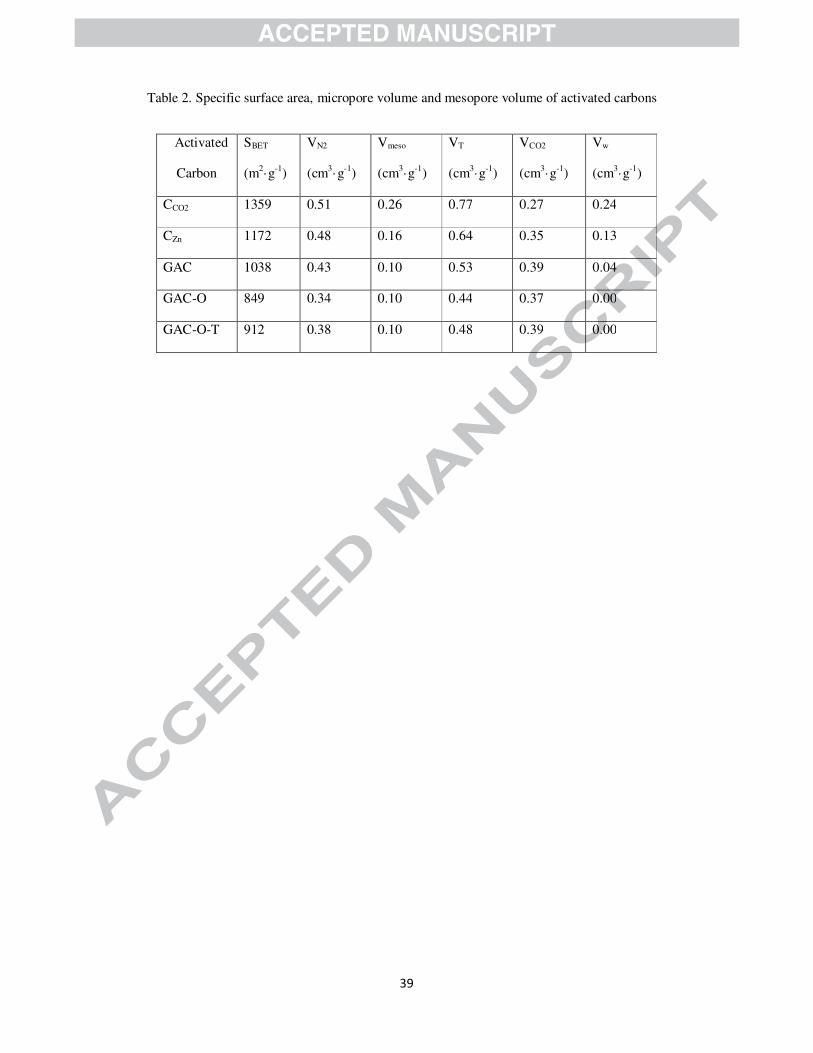
CO2 adsorption isotherms are shown in Table 2. It is seen that the shape of the
adsorption isotherm and the adsorbed volume depend on the activation conditions.
The large knee of the N2 isotherm at low pressures (below P/P0=0.2) shows the
presence of a large micropore size distribution. All these materials are essentially
microporous, with a structure of porosity relatively wider for the samples CCO2 and
CZn. These results are confirmed in Table 2 by analyzing the microporous volume
values found with N2 (size <2 nm) and CO2 (size <0.7 nm) adsorption isotherms
(VN2>VCO2). CCO2 sample corresponding to a burn-off of 49% shows a larger knee and
the linear branch of isotherm is not parallel to the relative pressure axis with the
presence of a hysteresis loop. Such results indicate the existence of wide micropores
and mesopores, which is confirmed by the Vmes and Vw (see Table 1). However, N2
and CO2 adsorption isotherms show that the sample GAC exhibits relatively similar
values of microporous volumes indicating the presence of narrow and homogenous
micropores. It is well known that the values of VN2 and VCO2 give important
information about the micropore size distribution in the absence of kinetic restrictions.
Consequently, for similar values of VN2 and VCO2 carbons reveal a narrow and
homogenous microporosity, while for VN2>VCO2 the micropores become larger [23].
11
The activated carbons after oxidation and heat treatments (GAC-O and GAC-O-T)
keep the same shape than the parent sample GAC. This behavior means that the
modification of the chemical structure of activated carbons with the conditions used in
this study, has no significant effect on the microporosity of the parent sample (GAC).
In fact, the values of Vmes and VCO2 do not change, while the surface area SBET and the
microporous volume VN2 decrease (Table 2).
The oxidation of sample GAC to obtain sample GAC-O causes a decrease in both the
SBET and VN2. This behavior is attributed to the effect of fixation of oxygen surface
groups which increase the constrictions of pores at the entrance, producing diffusional
restrictions for the N2 molecule at -196°C. On the other hand, the SBET and VN2 values
increase after heat treatment (sample GAC-O-T), due to the elimination of less stable
oxygen surface complexes, which produces the gap of pores.
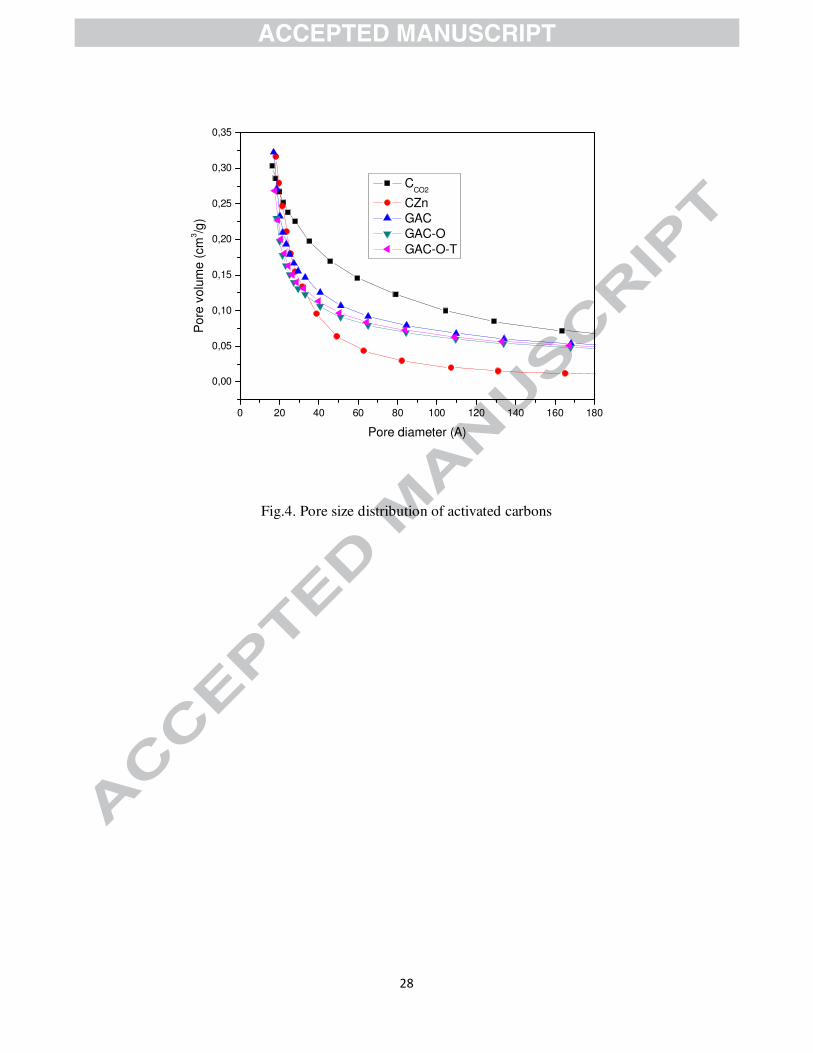
Pore size distribution curves (Fig.4) suggest that all activated carbons are microporous
materials due to the sharp increase of pore size distribution curves for pore diameters
less than 20 Å. According to the pore size distribution, sample CCO2 contains
important amount of narrow mesopores from 20 to 60Å than GAC and CZn. Whereas,
a minor change is noted in pore size distribution for the sample GAC after chemical
surface modifications. This result is confirmed in calculated microporous and
mesoporous volumes in Table 2.
3.1.2. Characterization of carbon surface chemistry
FTIR method is used to identify the functional groups on the activated carbon surface.
Fig.5 depicts FTIR spectrum of the different activated carbons. The FTIR assignments
of functional groups on carbon surface are listed on Table 3. All activated carbons

12
show a strong absorption peak at 1068 cm-1 attributed to C-OH (stretching) of
phenolic groups. They have also a medium absorption peak at 3230 cm-1 attributed to
the O-H (stretching) groups. According to available data in literature, this absorption
band is attributed to the presence of ether groups [24]. An absorption band at 1710
cm-1 attributed to C=O stretching is observed for all the samples present in lactone,
anhydride and carboxylic groups. However, this peak is stronger for GAC and GAC-
O samples and decreases for the other samples, which is due to the heat treatment.
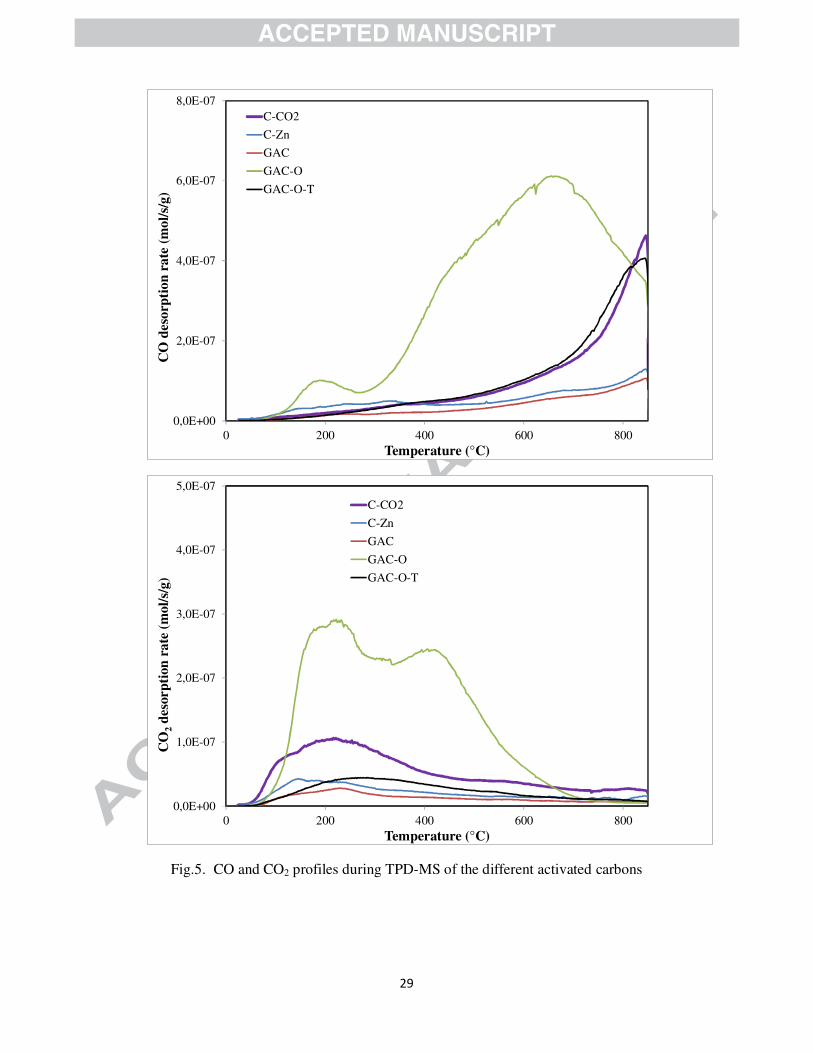
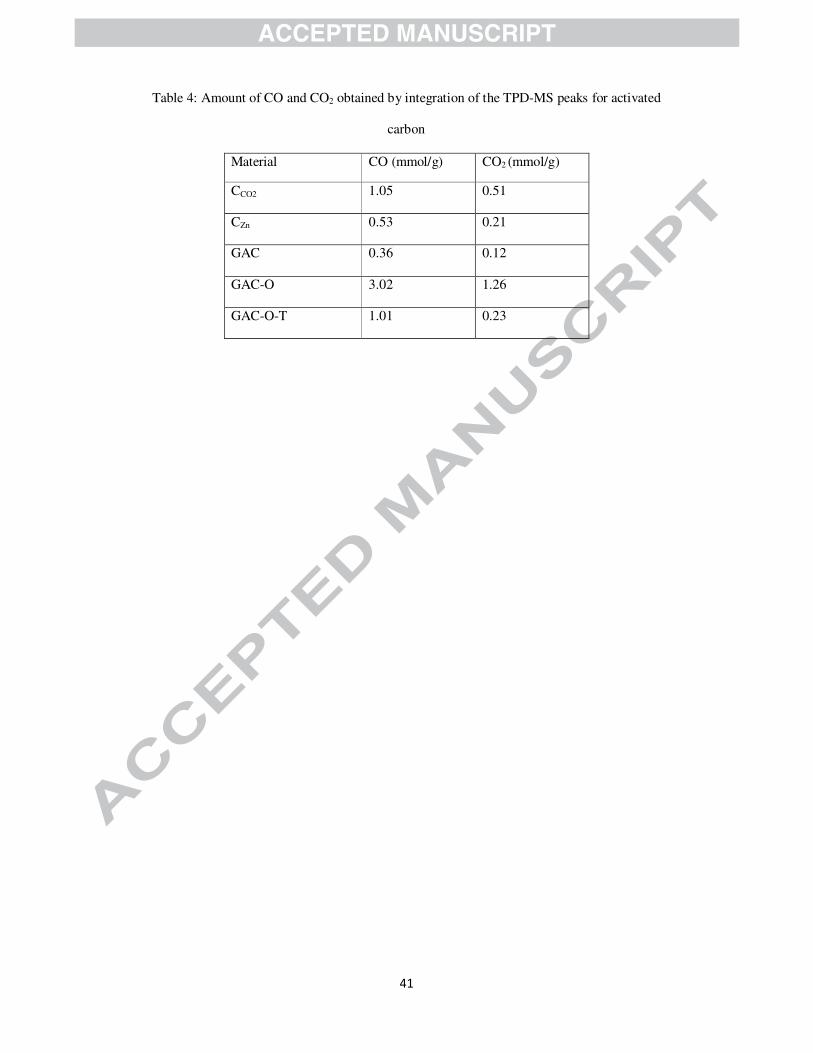
TPD-MS experiments give the evolution of CO2 and CO emissions, as a result of the
decomposition of the oxygen functionalities existing at the surface of the activated
carbons. The determination of the amount of CO and CO2 evolved gives an estimation
of the amount of surface oxygen groups on the activated carbons. Moreover, the
analysis of the evolution temperature indicates the presence of different oxygen
surface groups. Fig.6 shows CO and CO2 desorption profiles obtained during the
TPD-MS study. It is well known that the CO2 evolves from the decomposition of
carboxylic acids at low temperatures or lactones at high temperatures, anhydrides
decomposes to both CO and CO2, and carbonyl, phenols, ethers, quinones, pyrone and
chromene groups decompose to CO at temperatures up to 1000°C [21,25].
The comparison of the different samples show that the CO profile of GAC-O is
different from the others activated carbons. This oxidized sample (GAC-O) presents a
large peak at high temperature at about 600°C. The others samples show one peak at
high temperature (>800°C), suggesting the presence of very stable groups such as
ethers, carbonyls and quinones. The presence of ethers group was already observed
during FTIR analysis.
13
The CO2 desorption profiles of the activated carbons show a peak at low
temperatures. However, this peak is more intense for GAC-O and CCO2 comparing to
the other samples suggesting that they contain more lactones. A second peak is
detected for the oxidized sample (GAC-O) at higher temperature at about 400°C,
which is attributed to anhydrides.
Table 4 reports the amounts of CO and CO2 released, obtained by integration of the
areas under the TPD-MS peaks. The activated carbon obtained after (NH4)2S2O8
treatment reveals higher amounts of CO and CO2. However, activated carbons CCO2
and GAC-O-T contain high amount of very stable oxygen complexes evolved as CO,
which may result essentially from basic groups (pyrone and chromene).
3.2. NO2 adsorption on the different activated carbons
3.2.1 NO2 adsorption capacities
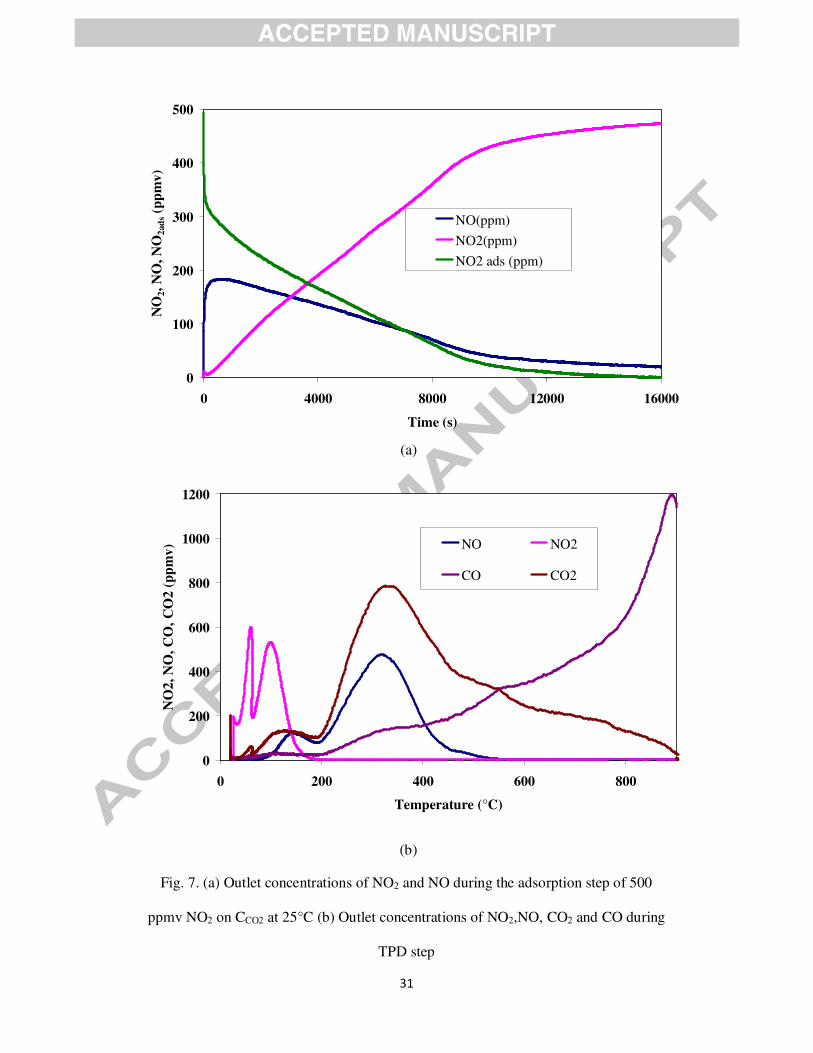
Fig.6 presents a typical result of the profiles NO2 and NO concentrations during the
adsorption step (Fig. 7(a)) and gas composition during the TPD step (Fig 7 (b)) for
test performed with activated carbon prepared from date pits by physical activation
(CCO2). A release of NO was observed in the first minutes of adsorption which shows
the reduction of NO2 to NO on the carbon surface. This behavior was also observed
for the different examined activated carbons. Therefore, NO increases in the first 10
min, reaches a maximum and after decreases. The release of NO suggests that the
NO2 reduction occurred on the activated carbon surface.
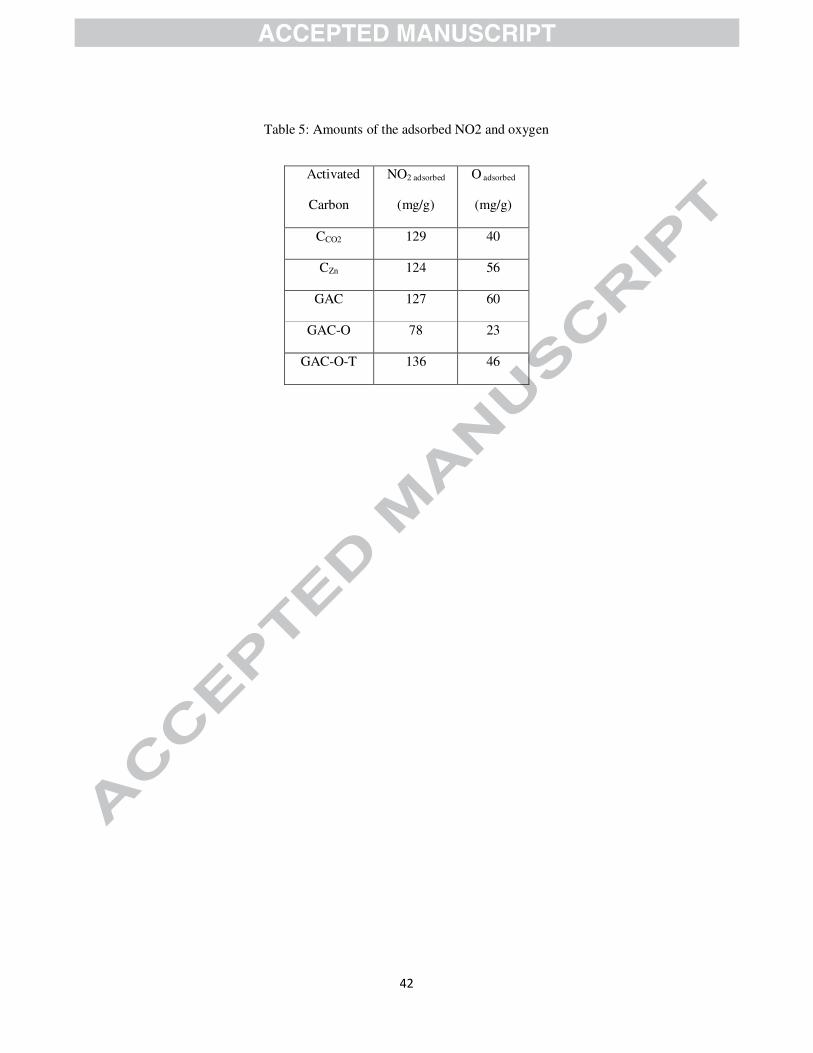
From the profiles of the emitted NO2 and NO, the amount of the adsorbed NO2 is
calculated as function of time. The obtained curve is shown in Fig 7 (b) and indicates

14
that the departed NO2 is not completely transformed into NO. Thus, a significant part
of NO2 is adsorbed on activated carbons and the total amount of adsorbed NO2,
calculated according to equations (1) and (2), is 129 mg/g.
During the TPD step (Fig. 7 (b)), two sharp desorption peaks of NO2 are noted at 63
and 103°C, respectively. Such behavior may indicate that NO2 adsorbs on two
different sites and its release occurred from two different reaction pathways.
Moreover, a slight peak of CO2 occurred simultaneously with the first peak of NO2
desorption. The NO2 emission disappears completely at 190°C. Above 70°C, the NO
and CO2 emission curves have a similar trend with two desorption peaks occurring
simultaneously at 140°C and 320°C. Such behavior may indicate that these gases are
emitted from the same surface groups. Above 350°C the emission of NO decreases
with similar tendency than CO2 until 460°C but vanishes at 530°C. Desorption of CO2
decreases slowly until the end of the experiment at 900°C. The desorption of CO
shows a continuous emission between 60 and 200°C followed by a steadily increasing
emission between 200 and 900°C.
Similar tendency of the emitted NO2 and NO curves was observed upon the exposure
of 500 ppmv NO2 on the different activated carbons. However, the adsorption
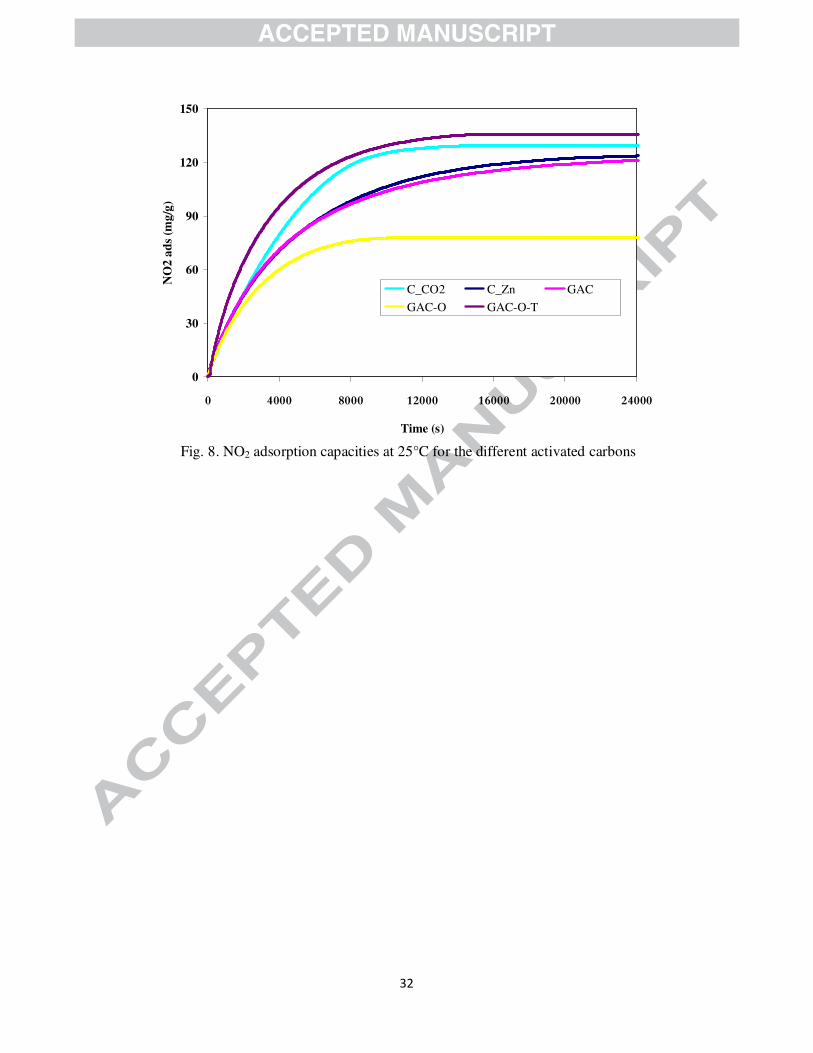
capacities vary strongly for the different prepared samples. The evolution of the
adsorption capacities versus time for the different activated carbons is shown on
figure 8. Moreover, due to the reduction of NO2 into NO, the amount of the adsorbed
oxygen was calculated for the different activated carbons. The evolution of the
adsorbed oxygen resulting from NO2 reduction is shown on figure 9. The adsorption
NO2 capacities of the different activated carbons as well as the amount of the
adsorbed oxygen are available in Table 5.

15
All adsorbent materials show important NO2 adsorption capacity. The best effective
samples are activated carbons CCO2 and GAC-O-T, prepared by thermal treatment.
However, the introduction of oxygen surface groups into GAC carbon by oxidation
with a (NH4)2S2O8 solution decreases the adsorption capacity of NO2 for this carbon.
The high adsorption capacities are reached by the samples CCO2 and GAC-O-T
correspond to 129 and 136 mg/g respectively. It is worth noting that the adsorption
capacities in this study are higher than activated carbons capacities found in the
literature. Thus, Kante et al. [26] studied adsorption of NO2 using wood based
activated carbon treated with chemicals such as sodium, cerium and lanthanum
chlorides. The adsorption capacity of the initial activated carbon was the highest with
39 mg/g. Deliyanni et al gave a breakthrough capacity of 49 mg/g after oxidation and
amination of wood based activated carbon [27]. In another study carried out by
Nowicki et al. [28], NO2 removal was examined using activated carbon prepared from
walnut shell. The produced activated carbon had a high surface area of 2305 m2/g and
pore volume of 1.15 cm3/g. Using walnut shell activated carbon in dry condition, a
NO2 adsorption capacity of 66 mgNO2/g was achieved. However, it is important to
note that these calculated capacities available in literature correspond only to the
breakthrough capacities and not to the total NO2 adsorption capacities as presented in
the present investigation.
The analysis of the adsorbed oxygen resultant from NO2 reduction (Fig. 9) shows
similar trend than the NO2 adsorption capacities. In fact, the GAC-O-T sample having
the highest NO2 adsorption capacity exhibits also the highest amount of the adsorbed
oxygen during the first 8000 seconds (where more than 80% of the total NO2 is
absorbed). In contrast, GAC-O sample having the lowest NO2 adsorption capacity
exhibits the lowest amount of the adsorbed oxygen. Such behavior confirms that the

16
amount of the adsorbed NO2 is correlated to the amount of adsorbed oxygen resulting
from the NO2 reduction on activated carbon surface.
3.2.2 Effect of porosity and chemical surface groups
In order to understand further the adsorption of NO2 and its reduction to NO on the
different activated carbons, their textural and chemical properties were analyzed as a
function of the adsorption and reduction capacities.
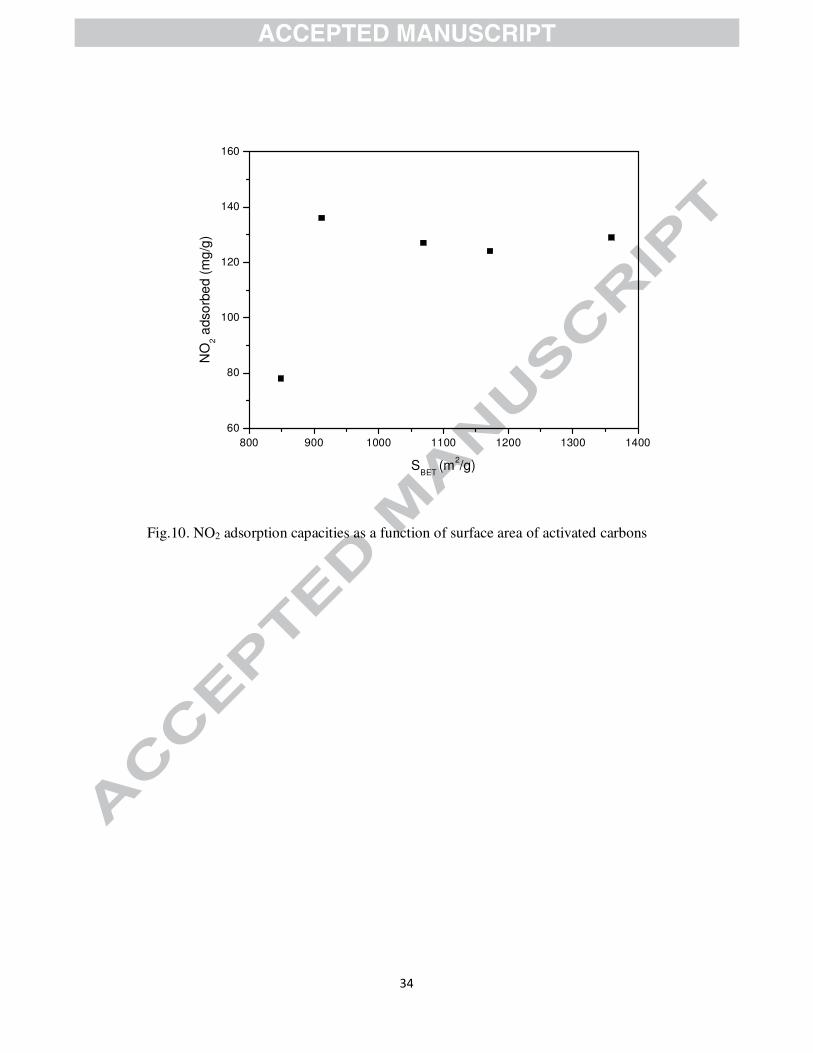
Figure 10 shows the adsorption capacities of the activated carbons as a function of
their specific surface area. It is noted that no significant relationship exists between
the NO2 adsorption and the specific surface area. In fact, the sample GAC-O-T (SBET
= 912 m2/g) has the highest NO2 adsorption capacities although its lower specific
surface area comparing to the other samples.
Furthermore, Figure 11 represents NO2 adsorption capacities (mg/g) as a function of
the microporous and the narrow microporous volumes obtained from nitrogen (-
196°C) and CO2 (0°C) adsorption isotherms, respectively. It is seen that no direct
correlation can be observed between the adsorption capacity of the samples and their
microporous volumes (VN2 and VCO2). However, the microporous volume VN2 (size
less than 2 nm) seems to affect the adsorption capacity rather than VCO2, volume of
narrow micropores (size less than 0.7 nm). Hence, the higher NO2 adsorption capacity
obtained for GAC-O-T may be attributed to the homogenous microporosity.
From this analysis, one may conclude that the microporosity and micropore size in
activated carbon play an important role in NO2 adsorption capacity. However, these
textural characteristics are not the only parameters affecting the interaction of NO2
with activated carbons. In fact, GAC sample has a lower adsorption capacity
comparing to GAC-O-T although its higher microporous volume. Therefore, chemical

17
surface groups may affect the NO2 adsorption capacity. The comparison of the
adsorption capacities with the chemical surface groups (Table 4) shows that the
highest adsorption capacities are obtained for the activated carbons emitting the
highest amount of CO during TPD-MS, namely, GAC-O-T and CCO2. Such behavior
may be attributed to the presence of stable groups such as ethers, carbonyls and
quinones as observed in TPD-MS study. It may be also attributed to the basic
character of GAC-O-T and CCO2 through the presence of pyrone and chromene
groups. In fact, extensive studies have confirmed that the heat treatment of activated
carbons at high temperatures rises the basicity of activated carbon [29, 30]. This
behavior is attributed to the elimination of the strong acidic complexes (carboxylic,
anhydrides and lactones) at lower temperatures and the others acidic functionalities
(carbonyl and phenol) at higher temperatures. The basic character is also due to
delocalized π electrons of graphene layers which proceed as Lewis bases [31].
The previous hypothesis is not available for GAC-O sample. In fact, although a higher
amount of stable groups (CO = 3.02 mmol/g) was observed during TPD-MS study,
this sample has the lowest NO2 adsorption capacity. Such behavior may be attributed
to the presence of higher amount of strong acidic complexes such as carboxylic,
anhydrides and lactones. In fact, the introduction of complexes on the surface of
carbon material by (NH4)2S2O8 oxidation increases the acidic groups. Therefore, these
acidic groups may inhibit the adsorption of NO2 on the activated carbon. Such
hypothesis is confirmed by the discrepancy between the NO2 adsorption capacity of
GAC-O-T and CCO2. In fact, these activated carbons have a similar amount of stable
groups (Table 4) but CCO2 has a higher amount of acidic groups. The latter may
explain the lower NO2 adsorption capacity of CCO2 comparing to GAC-O-T.

18
Moreover, the inhibitory effect of the acidic groups may be confirmed by the
comparison of the amount of CO2 emitted during TPD-MS analysis and the amount of
the adsorbed oxygen resulting from NO2 reduction. Figure 12 shows that the presence
of acidic groups leads to a decrease of the amount of adsorbed oxygen. Hence, these
acidic groups inhibit the reduction of NO2 to NO on the activated carbon surface. This
step is necessary for the adsorption of NO2 as shown previously. Therefore, the
presence of acidic groups does not restrain directly the NO2 adsorption but restrain
essentially the reduction of NO2 to NO and therefore the adsorption of oxygen. Such a
result was not evidenced previously in the literature.
Conclusions
Adsorption of NO2 at ambient temperature was studied using activated carbons
prepared by physical and chemical activation of date pits and modified commercial
activated carbons. The textural and chemical surface properties of the different
samples were analyzed and correlated to the NO2 interaction with the activated carbon
surface. The obtained results show that activated carbon prepared from date pits are
efficient adsorbents with adsorption capacities similar to the commercialized
adsorbents. Moreover, it is seen that the microporosity, the micropore size and the
presence of stable oxygen groups are the most important properties defining the
adsorption capacity of NO2. In contrast, the presence of strong acidic groups such as
carboxylic, anhydrides and lactones inhibits the reduction of NO2 into NO, which
represents a crucial step for the adsorption of NO2. In fact, it is observed that the
oxygen left on the carbon surface during NO2 decomposition plays an important role
on the NO2 adsorption.
19
Hence, the increase of basic group amounts and the elimination of strong acidic
groups may be a promising issue for improving further the performance of the
prepared activated carbons from date pits for NO2 removal.
Acknowledgments
The authors are grateful to Mrs Damaris Kehrli (Labroratoire Gestion des Risques et
Environnement), M. Joseph Dentzer and M. Yassine Elmay (Institut de Science des
Matériaux de Mulhouse) for carrying out some experiments.
References
[1] X. Gao, S. Liu, Y. Zhang, Z. Luo, M. Ni, K. Cen, Adsorption and reduction of
NO2 over activated carbon at low temperature, Fuel Processing Technology 92 (2011)
139–146.
[2] D. Lopez, R. Buitrago, A. Sepulveda-Escribano, F. Rodrıguez-Reinoso, F.
Mondragon, Low-Temperature Catalytic Adsorption of NO on Activated Carbon
Materials, Langmuir 23 ( 2007) 12131-12137.
[3] L. Young-Whan, P. Jee-Won, j. Se-Jin, C. Dae-Ki, Y. Jae-Eui, NOx adsorption–
temperature programmed desorption and surface molecular ions distribution by
activated carbon with chemical modification, Carbon 42 (2004) 59–69.
[4] K. Skalska, J.S. Miller, S. Ledakowicz, Trends in NOx abatement: a review,
Science of the Total Environment 408 (2010) 3976–3989.
[5] S.H. Manahan, Environmental Chemistry, 8th ed., CRC Press, Boca Raton, FL,
2005, p. 379.
[6] S. Barman, L. Philip, Integrated system for the treatment of oxides of nitrogen
from flue gases, Environmental Science & Technology 40 (2006) 1035–1041.
20
[7] R.K. Srivastava, R.E. Hall, S. Khan, K. Culligan, B.W. Lani, Nitrogen oxides
emission control options for coal fired electric utility boilers, J. Air Waste Manage.
Assoc. 55 (2005) 1367–1388.
[8] M. A Gomez-Garcia., V. Pitchon, A. Kiennemann, Pollution by nitrogen oxides :
an approach to NOx abatment by using sorbing catalytic materials, Environ. Int.
31(2005) 445-467.
[9] Y. W. Lee, H. J. Kim, J. W. Park, B. U. Choi, D. Choi, J. W. Park, Adsorption and
reaction behavior for the simultaneous adsorption of NO–NO2 and SO2 on activated
carbon impregnated with KOH, Carbon, 41 (2003) 1881-1888.
[10] H. March, F. Rodríguez-Reinoso, Activated Carbon, Elsevier, Amsterdam, 2006.
[11] R.C Bansal, M. Goyal, eds., Activated Carbon Adsorption, Taylor and Francis
Group, 2005.
[12] A. Silvestre-Albero, J. Silvestre-Albero, A. Sepulveda-Escribano, F. Rodriguez-
Reinoso, Ethanol removal using activated carbon: Effect of porous structure and
surface chemistry, Microporous and Mesoporous Materials, 120 (2009) 62–68
[13] X. He, P. Ling, M. Yu, X. Wang, X. Zhang, M. Zheng, Rice husk-derived porous
carbons with high capacitance by ZnCl2 activation for supercapacitors, Electrochimica
Acta 105 (2013) 635– 641
[14] Y. W. Lee, D. K. Choi, J.W. Park, Performance of fixed-bed KOH impregnated
activated carbon adsorber for NO and NO2 removal in the presence of oxygen.
Carbon, 40 (2002) 1409-1417.
[15] B Levasseur, E. Gonzalez-Lopez, J.A. Rossin, T.J. Bandosz. Effect of reduction
on copper modified activated carbons on NOx adsorption at room temperature.
Langmuir, 27(2011) 5354-5365.
21
[16] S. Bashkova, T. J. Bandosz. The effects of urea modification and heat treatment
on the process of NO2 removal by wood-based activated carbon. J Colloid Interface
Sci. 333 (2009) 97-103.
[17] P. Nowicki, H. Wachowska, P. Pietrzak, Active carbons prepared by chemical
activation of plum stones and their application in removal of NO2, J. Hazardous
Materials 181 (2010) 1088–1094.
[18] J.P.S. Sousa, M.F.R. Pereira, J.L. Figueiredo, Modified activated carbon as
catalyst for NO oxidation, Fuel Processing Technology 106 (2013) 727–733.
[19] J.D. Atkinson, Z. Zhang, Z. Yan, M.J. Rood, Evolution and impact of acidic
oxygen functional groups on activated carbon fiber cloth during NO oxidation,
Carbon 54 (2013 ) 444–453.
[20] M. Belhachemi, R.V.R.A. Rios, F. Addoun, J. Silvestre-Albero, A Sepulveda-
Escribano, F. Rodriguez- Reinoso. Preparation of activated carbon from date pits:
Effect of the activation agent and liquid phase oxidation. J. Anal. Appl. Pyrolysis,
86(2009)168-172.
[21] J.L Figueiredo, M.F.R Pereira, Freitas M.M.A., Orfao J.J.M., Carbon 37 (1999)
1379–1389.
[22] M. J. Prauchner, F. Rodríguez-Reinoso, Chemical versus physical activation of
coconut shell: A comparative study, Microporous and Mesoporous Materials, 152
(2012) 163–171.
[23] F. Rodriguez-Reinoso, J. Garrido, J.M. Martin-Martinez, M. Molina-Sabio, R.
Torregrosa, The combined use of different approaches in the characterization of
microporous carbons, Carbon 27 (1989) 23-32.

22
[24] M.S. Shafeeyan., W. M.A.W. Daud, A. Houshmand, A. Shamiri, A review on
surface modification of activated carbon for carbon dioxide adsorption, Journal of
Analytical and Applied Pyrolysis 89 (2010) 143–151.
[25] U. Zielke, K.J. Hüttinger, W.P. Hoffman, Surface-oxidized carbon fibers: I.
Surface structure and chemistry, Carbon 34 (1996) 983–998.
[26] K. Kante, E. Deliyanni, T.J. Bandosz, Interactions of NO2 with activated carbons
modified with cerium, lanthanum and sodium chlorides, Journal of Hazardous
Materials 165 (2009) 704-713.
[27] E. Deliyanni, T.J. Bandosz. Effect of carbon surface modification with
dimethylamineon reactive adsorption of NOx. Langmuir. 27(2011)1837-43.
[28] P. Nowicki, R. Pietrzak, H. Wachowska, Sorption properties of active carbons
obtained from walnut shells by chemical and physical activation, Catalysis Today 150
(2010) 107-114.
[29] M. Belhachemi M, F. Addoun, Adsorption of congo red onto activated carbons
having different surface properties: studies of kinetics and adsorption equilibrium,
Desalination and Water Treatment, 37(2012) 122-129.
[30] H. Darmstadt, C. Roy, Surface spectroscopic study of basic sites on carbon
blacks, Carbon 41 (2003) 2662–2665.
[31] A.F. Pérez-Cadenas, F.J. Maldonado-Hodar, C. Moreno-Castilla, On the nature
of surface acid sites of chlorinated activated carbons, Carbon 41 (2003) 473–478.
23
FIGURE CAPTIONS
Fig.1. Scheme of the set-up for the NO2 adsorption experiments
Fig.2. SEM photographs of the different activated carbons with the same enlargement:
a) CCO2 b) CZn c) GAC d) GAC-O e) GAC O-T
Fig.3. N2 adsorption-desorption at -196°C of activated carbons
Fig.4. Pore size distribution of activated carbons
Fig.5. CO and CO2 profiles during TPD-MS of the different activated carbons
Fig.6. FTIR spectra of the different activated carbons
Fig.7. (a) Outlet concentrations of NO2 and NO during the adsorption step of 500
ppmv NO2 on CCO2 at 25°C (b) Outlet concentrations of NO2, NO, CO2 and CO
during TPD step
Fig.8. NO2 adsorption capacities at 25°C for the different activated carbons
Fig.9. The amount of adsorbed oxygen resulting from NO2 reduction on the different
activated carbons
Fig.10. NO2 adsorption capacities as a function of surface area of activated carbons
Fig.11. Dependence of adsorbed amount of NO2 on micropore volume of activated
carbons
Fig.12. Dependence of the adsorbed amount of oxygen on the acidic surface groups
24
NO2
Thermocouple
Condenser
N2
BYPASS
Mass flow meters 1 2 3
4 5 6
7 8 9
ES
C
ENTE R
1000 ppm NO
1000 ppm NO2
NO/NO2 CO/CO2
analyser
furnace
Data acquisition system
Activated Carbon
Porous quartz layer
Fig.1. Scheme of the set-up for the NO2 adsorption experiments
25
a) b)
c) d)

26
e)
Fig.2. SEM photographs of the different activated carbons with the same enlargement: a) CZn b) CCO2 c) GAC d) GAC-O e) GAC O-T
27
0,0 0,2 0,4 0,6 0,8 1,0
0
100
200
300
400
500
CCO2
CZn
GAC GAC-O
GAC-O-T
V(c
m3/g
)
P/P0
Fig.3. N2 adsorption-desorption at -196°C of activated carbons. Filled and hollow symbols
indicate adsorption and desorption data, respectively.
28
0 20 40 60 80 100 120 140 160 180
0,00
0,05
0,10
0,15
0,20
0,25
0,30
0,35
CCO2
CZn
GAC
GAC-O
GAC-O-T
Po
re v
olu
me
(cm
3/g
)
Pore diameter (A)
Fig.4. Pore size distribution of activated carbons
29
0,0E+00
2,0E-07
4,0E-07
6,0E-07
8,0E-07
0 200 400 600 800
CO
deso
rpti
on
ra
te (
mo
l/s/
g)
Temperature (°C)
C-CO2
C-Zn
GAC
GAC-O
GAC-O-T
0,0E+00
1,0E-07
2,0E-07
3,0E-07
4,0E-07
5,0E-07
0 200 400 600 800
CO
2d
eso
rp
tion
ra
te (
mo
l/s/
g)
Temperature (°C)
C-CO2
C-Zn
GAC
GAC-O
GAC-O-T
Fig.5. CO and CO2 profiles during TPD-MS of the different activated carbons

30
100015002000250030003500
W avenumber cm-1
0.0
50
.10
0.1
50
.20
Ab
so
rba
nce
Un
its
Fig. 6. FTIR spectra of the different activated carbons.
GAC
GAC-O-T
GAC-O-T
CZn CCO2
31
(a)
0
200
400
600
800
1000
1200
0 200 400 600 800
Temperature (°C)
NO
2,
NO
, C
O,
CO
2 (
pp
mv
) NO NO2
CO CO2
(b)
Fig. 7. (a) Outlet concentrations of NO2 and NO during the adsorption step of 500
ppmv NO2 on CCO2 at 25°C (b) Outlet concentrations of NO2,NO, CO2 and CO during
TPD step
0
100
200
300
400
500
0 4000 8000 12000 16000
Time (s)
NO
2,
NO
, N
O2
ad
s (p
pm
v)
NO(ppm)
NO2(ppm)
NO2 ads (ppm)
32
0
30
60
90
120
150
0 4000 8000 12000 16000 20000 24000
Time (s)
NO
2 a
ds
(mg
/g)
C_CO2 C_Zn GAC
GAC-O GAC-O-T
Fig. 8. NO2 adsorption capacities at 25°C for the different activated carbons

33
0
10
20
30
40
50
60
0 4000 8000 12000 16000 20000 24000
Time (s)
Oa
ds
(mg
/g)
C_CO2 C_Zn GAC
GAC-O GAC-O-T
Fig. 9. The amount of adsorbed oxygen resulting from NO2 reduction on the different
activated carbons
34
800 900 1000 1100 1200 1300 1400
60
80
100
120
140
160
NO
2 a
dso
rbe
d (
mg
/g)
SBET
(m2/g)
Fig.10. NO2 adsorption capacities as a function of surface area of activated carbons
35
CCO2 CZnCl2 GAC GAC-O GAC-O-T
0
20
40
60
80
100
120
140
160
Mic
ropo
re v
olu
me
(cm
3/g
)
NO
2 a
dso
rbe
d (
mg/g
)
VN2
VCO2
1,0
0,5
0,75
0,25
0,0
Fig. 11. Dependence of the adsorbed amount of NO2 on micropore volume of activated carbons

36
0
0,4
0,8
1,2
0
20
40
60
GAC-O CCO2 GAC-O-T CZn GAC
CO
2(m
mol/
g)
Oa
ds
(mg
/g)
Fig. 12. Dependence of the adsorbed amount of oxygen on the acidic surface groups

37
TABLES CAPTIONS Table 1. Main inorganic compounds present in the different activated carbons determined by
X-ray fluorescence (% wt)
Table 2. Specific surface area, micropore volume and mesopore volume of the different
activated carbons.
Table 3. FTIR assignments of functional groups on activated carbon surface
Table 4. Amounts of CO and CO2 obtained by integration of the TPD-MS peaks for the
different activated carbons
Table 5. Amounts of the adsorbed NO2 and oxygen
38
Table 1. Main inorganic compounds present in the different activated carbons determined by
X-ray fluorescence (% wt)
Elements CZn CCO2 GAC GAC-O GAC-O-T Si 0.699 0.031 0.740 0.711 0.801 Al 0.597 0.018 0.619 0.611 0.636 S 0.395 0.011 0.398 0.467 0.310
Fe 0.134 0.036 0.166 0.150 0.148 K 0.049 1.290 Ca 0.045 0.111 Mg 0.045 0.491 Zn 0.024 0.060
39
Table 2. Specific surface area, micropore volume and mesopore volume of activated carbons
Activated
Carbon
SBET
(m2·g-1)
VN2
(cm3· g-1)
Vmeso
(cm3·g-1)
VT
(cm3·g-1)
VCO2
(cm3·g-1)
Vw
(cm3·g-1)
CCO2 1359 0.51 0.26 0.77 0.27 0.24
CZn 1172 0.48 0.16 0.64 0.35 0.13
GAC 1038 0.43 0.10 0.53 0.39 0.04
GAC-O 849 0.34 0.10 0.44 0.37 0.00
GAC-O-T 912 0.38 0.10 0.48 0.39 0.00

40
Table 3: FTIR assignments of functional groups on activated carbon surface
Wavenumber (cm-1)
Band intensities Assignement CCO2 GAC-O GAC-O-
T GAC Czn
3230 m m m m m O-H strech 2891 w w w w - C-H strech 1710 w s w s w C=O 1567 w s w m w C=C of benzene 1400 - m - m - C–C stretch 1068 s s s s s -C-OH 852 m f m f m C-H 779 m m - m m C=C-H
deformation 686 w w - f w C-H deformation W : weak, m: medium, s : Strong
41
Table 4: Amount of CO and CO2 obtained by integration of the TPD-MS peaks for activated
carbon
Material CO (mmol/g) CO2 (mmol/g)
CCO2 1.05 0.51
CZn 0.53 0.21
GAC 0.36 0.12
GAC-O 3.02 1.26
GAC-O-T 1.01 0.23
42
Table 5: Amounts of the adsorbed NO2 and oxygen
Activated
Carbon
NO2 adsorbed
(mg/g)
O adsorbed
(mg/g)
CCO2 129 40
CZn 124 56
GAC 127 60
GAC-O 78 23
GAC-O-T 136 46
43
Research Highlights
- Activated carbons (AC) were prepared from date pits and commercial
adsorbents
- Textural, morphological and surface chemistry properties were analysed
- NO2 adsorption capacities were evaluated and correlated to AC
characteristics.
- microporosity, micropore size and surface groups affect NO2 adsorption
capacity.
- Strong acidic groups inhibit the NO2 interaction with the AC surface


