
Condition-adapted stress and longevity generegulation by Caenorhabditis elegans SKN-1/Nrf
Riva P. Oliveira,1,*† Jess Porter Abate,1,† KieranDilks,2,† Jessica Landis,2 Jasmine Ashraf,2 Coleen T.Murphy2 and T. Keith Blackwell1
1Section on Developmental and Stem Cell Biology, Joslin Diabetes
Center, Department of Pathology, Harvard Medical School, Harvard
Stem Cell Institute, One Joslin Place, Boston, MA 02215, USA2Department of Molecular Biology, Lewis-Sigler Institute for
Integrative Genomics, Princeton University, 148 Carl Icahn
Laboratory, Washington Road, Princeton, NJ 08544, USA
Summary
Studies in model organisms have identified regulatory
processes that profoundly influence aging, many of
which modulate resistance against environmental or met-
abolic stresses. In Caenorhabditis elegans, the transcrip-
tion regulator SKN-1 is important for oxidative stress
resistance and acts in multiple longevity pathways. SKN-1
is the ortholog of mammalian Nrf proteins, which induce
Phase 2 detoxification genes in response to stress. Phase 2
enzymes defend against oxygen radicals and conjugate
electrophiles that are produced by Phase 1 detoxification
enzymes, which metabolize lipophilic compounds. Here,
we have used expression profiling to identify genes and
processes that are regulated by SKN-1 under normal and
stress–response conditions. Under nonstressed conditions
SKN-1 upregulates numerous genes involved in detoxifi-
cation, cellular repair, and other functions, and downre-
gulates a set of genes that reduce stress resistance and
lifespan. Many of these genes appear to be direct SKN-1
targets, based upon presence of predicted SKN-binding
sites in their promoters. The metalloid sodium arsenite
induces skn-1-dependent activation of certain detoxifica-
tion gene groups, including some that were not SKN-1-
upregulated under normal conditions. An organic
peroxide also triggers induction of a discrete Phase 2 gene
set, but additionally stimulates a broad SKN-1-indepen-
dent response. We conclude that under normal conditions
SKN-1 has a wide range of functions in detoxification and
other processes, including modulating mechanisms that
reduce lifespan. In response to stress, SKN-1 and other
regulators tailor transcription programs to meet the chal-
lenge at hand. Our findings reveal striking complexity in
SKN-1 functions and the regulation of systemic detoxifica-
tion defenses.
Key words: aging; Caenorhabditis elegans; detoxification;
insulin signaling; oxidative stress; SKN-1.
Introduction
Living organisms are subjected to stress caused by reactive oxy-
gen species (ROS) or electrophiles that are derived from metabo-
lism of various compounds. Cellular damage caused by oxidative
stress has been implicated in conditions that include diabetes,
atherosclerosis, many neurodegenerative syndromes, and aging
(Droge, 2002). It is important to understand how organisms
defend themselves against this damage at the systemic level. For
example, several transcription factors that promote resistance to
free radicals have been associated with extended longevity in
model organisms, including worms, flies, and mice (Lithgow &
Walker, 2002; Kenyon, 2005; Guarente, 2007; Tullet et al.,
2008).
Eukaryotes defend themselves from toxic or reactive com-
pounds through a three-phase detoxification system (Xu et al.,
2005; Sarkadi et al., 2006). During Phase 1, lipophilic endo-
biotics or xenobiotics are solubilized through modification by
enzymes, such as cytochrome P450s (CYPs) and short-chain de-
hydrogenases ⁄ reductases (SDRs). This process allows these com-
pounds to be excreted, but may also produce damaging reactive
compounds. The Phase 2 enzymes defend cells against such
compounds, as well as ROS. They encompass a diverse group of
enzymes that metabolize free radicals, repair cellular structures,
or directly conjugate xenobiotics and peroxidized lipids, includ-
ing glutathione-S-transferases (GSTs) and UDP-glucurono-
syl ⁄ glucosyl transferases (UGTs). In Phase 3, conjugated toxins
are pumped out of the cell by ATP-binding cassette (ABC) or
other transporters (Sarkadi et al., 2006). How these systems
contribute to the functions of different tissues, how they are
regulated in the context of an organism, and how this regulation
might be adapted to different stress scenarios are all important
questions.
Correspondence
T. Keith Blackwell, Section on Developmental and Stem Cell Biology,
Department of Pathology, Joslin Diabetes Center, Department of Pathology,
Harvard Medical School, Harvard Stem Cell Institute, One Joslin Place, Bos-
ton, MA 02215, USA. Tel.: (617) 264 2760; fax: (617) 713 3403; e-mail:
Coleen T. Murphy, Lewis-Sigler Institute for Integrative Genomics, Depart-
ment of Molecular Biology, Princeton University, 148 Carl Icahn Laboratory,
Washington Road, Princeton, NJ 08544, USA. Tel.: (609) 258-9396; fax:
(609) 258-7070; e-mail: [email protected]
*Present address: Departamento de Ciencias Biologicas and Nucleo de
Pesquisas em Ciencias Biologicas, Universidade Federal de Ouro Preto,
Campus Morro do Cruzeiro, Ouro Preto, MG 35400-000, Brazil.
†These authors contributed equally.
Accepted for publication 18 June 2009
524 ª 2009 The AuthorsJournal compilation ª Blackwell Publishing Ltd/Anatomical Society of Great Britain and Ireland 2009
Aging Cell (2009) 8, pp524–541 Doi: 10.1111/j.1474-9726.2009.00501.xAg
ing
Cell

Current data suggest that Phase 2 genes may be regulated as
a co-ordinated network. In mammals, many Phase 2 genes are
induced directly by the Nrf1 and Nrf2 (NF-E2-related factor) pro-
teins (Nguyen et al., 2003; Kobayashi & Yamamoto, 2006). In
the cell types examined thus far Nrf proteins are predominantly
cytoplasmic, but in response to stress they accumulate in nuclei
and upregulate Phase 2 gene expression. Mice that lack Nrf2 are
sensitive to ROS and other toxic insults, but it is problematic to
evaluate how a complete lack of Nrf proteins affects the intact
mouse because Nrf1) ⁄ ); Nrf2) ⁄ ) mice embryos die by day 10
(Leung et al., 2003).
As the Phase 2 network is broadly conserved (Jasper, 2008), it
is possible to employ simpler model organisms to study its regu-
lation and functions. In the nematode Caenorhabditis elegans,
the Nrf ortholog SKN-1 inducibly regulates expression of candi-
date Phase 2 genes in the intestine, the digestive system equiva-
lent, and skn-1 mutants are highly sensitive to oxidative stress
(An & Blackwell, 2003; An et al., 2005; Inoue et al., 2005). SKN-
1 accumulates in intestinal nuclei in response to stress and is
inhibited from doing so constitutively by mechanisms that
include phosphorylation by glycogen synthase kinase-3 and the
conserved insulin ⁄ IGF-1-like signaling (IIS) pathway (An et al.,
2005; Tullet et al., 2008). In C. elegans, IIS is initiated by binding
of insulin-like peptides to the receptor DAF-2, which leads even-
tually to activation of the downstream IIS kinases AKT-1 ⁄ 2 and
SGK-1. These kinases phosphorylate and inhibit SKN-1 in parallel
to the FOXO transcription factor DAF-16 (Tullet et al., 2008),
which regulates genes involved in numerous biological pro-
cesses, including stress resistance (Murphy et al., 2003; Kenyon
& Murphy, 2006; Oh et al., 2006; Dong et al., 2007; McElwee
et al., 2007; Samuelson et al., 2007). It is still unknown whether
SKN-1 might simply regulate a suite of Phase 2 genes, or is
involved more broadly in control of stress defense or other
genes.
Multiple lines of evidence implicate SKN-1 in C. elegans lon-
gevity. For example, reductions in IIS delay aging and increase
stress resistance in diverse organisms (Kenyon, 2005). While it is
well established that in C. elegans these benefits of reduced IIS
require DAF-16, it has been shown recently that SKN-1 also con-
tributes to these effects (Tullet et al., 2008). In addition, SKN-1
delays aging under normal conditions, at least in part through its
action in the intestine (An & Blackwell, 2003; Tullet et al., 2008).
Finally, skn-1 is required for lifespan extension by calorie restric-
tion (CR), a condition that promotes longevity in all eukaryotes
tested thus far (Bishop & Guarente, 2007b). This last SKN-1 func-
tion is mediated by its expression in the two ASI neurons (Bishop
& Guarente, 2007b), which sense or regulate food intake (You
et al., 2008). These observations indicate that SKN-1 has impor-
tant functions under nonstressed as well as stress conditions. It
remains to be determined whether SKN-1 regulates similar sets
of genes under normal and stress–response conditions, and how
these genes influence stress resistance and longevity.
Here, we have used expression profiling to investigate how
SKN-1 influences C. elegans gene expression under normal con-
ditions, and in response to two different sources of oxidative
stress, the metalloid sodium arsenite (As) and tert-butyl hydro-
gen peroxide (t-BOOH). Arsenite is a highly toxic trivalent form
of the environmentally pervasive metalloid arsenic. It attacks
thiol groups on glutathione and other polypeptides, and stimu-
lates ROS production (Hughes, 2002). The stable organoperox-
ide t-BOOH attacks cellular proteins and lipids, and is also
scavenged by glutathione (Mathews et al., 1994). skn-1 mutants
are sensitive to each of these stresses (An et al., 2005; Inoue
et al., 2005). We find that under normal conditions SKN-1 regu-
lates expression of numerous genes, many of which may be
direct targets. These genes are involved in processes that include
detoxification and stress resistance, lysosome and proteasome
function, metabolism, and cell-surface recognition. Interest-
ingly, SKN-1 also suppresses expression of many genes that
decrease stress resistance and lifespan, including the insulin-like
peptide ins-7 and the IIS pathway kinase pdk-1. Treatment with
As results in activation of a particular group of SKN-1 dependent
detoxification genes. By contrast, t-BOOH treatment also mobi-
lizes a broad SKN-1-independent stress response. Some func-
tional clusters of genes are regulated by SKN-1 specifically under
normal or particular stress conditions, indicating that unknown
signals interact with SKN-1 to restrict its activities. Our findings
identify a complex set of processes that are regulated by SKN-1
under normal conditions, and reveal that SKN-1 acts together
with other regulators in specialized responses to exogenous
stresses.
Results
We used oligonucleotide microarrays to compare expression
profiles of worms that had been treated with RNA interference
(RNAi) against skn-1 [skn-1())], or control (gfp) RNAi [skn-1(+)]
from hatching (Fig. 1). We examined synchronized L4 stage lar-
vae, in which stress robustly induces intestinal expression of the
SKN-1 target gene gcs-1 (An & Blackwell, 2003). To investigate
how SKN-1 responds to stress, worms were exposed to As or
t-BOOH or incubated under the corresponding control condi-
tions [Nematode Growth Medium (NGM) agar plates or M9
liquid media, respectively]. In applying stress-inducing agents,
we titrated the concentrations used and the time of exposure so
that gcs-1 was induced comparably (Supporting Fig. S1), and at
least 95% of the animals consistently survived the treatment
(not shown).
SKN-1 regulates stress-related and other genes under
normal conditions
We first searched for genes that are regulated by SKN-1 under
normal (nonstressed) conditions, by comparing the expression
profiles of skn-1(+) and skn-1()) wild-type (N2) animals that
served as controls for our stress-treatment experiments (Fig. 1,
red arrow). We compared these seven sets of skn-1(+) and skn-
1()) samples using hierarchical clustering (Eisen et al., 1998) and
statistical analysis of microarrays (SAM) (Tusher et al., 2001). In
performing SAM, we adjusted the delta value to 1.023, resulting
Gene regulation by SKN-1, R. P. Oliveira et al.
ª 2009 The AuthorsJournal compilation ª Blackwell Publishing Ltd/Anatomical Society of Great Britain and Ireland 2009
525

in an expected false positive rate of 1.7%. These analyses identi-
fied 233 genes for which expression was significantly reduced in
skn-1()) animals (SKN-1-upregulated genes; Fig. 2a; Table 1;
Supporting Table S1). The extent of this SKN-1-upregulated
profile was unexpected, because under nonstressed conditions
SKN-1 is seen at relatively low levels in intestinal nuclei (An &
Blackwell, 2003). We also identified 63 genes for which expres-
sion was increased in skn-1()) animals, indicating that they are
downregulated by SKN-1 (SKN-1-downregulated genes; Fig. 3a;
Table 2; Supporting Table S2). As an independent test of these
results, we assessed the relative levels of representative SKN-1-
regulated mRNAs in skn-1(+) and skn-1()) animals using quanti-
tative (q)RT-PCR. These results concurred with our microarray
experiments for both SKN-1-upregulated (13 of 13) and -down-
regulated (10 of 10) genes (Supporting Tables S3 and S4).
We investigated the functions of SKN-1-upregulated genes by
using the Database for Annotation, Visualization and Integrated
Discovery (DAVID) to analyze the statistical representation of
functional gene categories, as defined by gene ontology
(GO) terms or predicted protein domains. The GO categories for
glutathione transferase, xenobiotic metabolism, thioredoxin
fold, and UGT were highly over-represented among the SKN-1-
upregulated genes (Fig. 2d), 19% of which overall are involved
in detoxification or stress responses (Fig. 2b; Supporting
Table S1). In addition, numerous Phase 2 genes were among the
SKN-1-upregulated genes with the highest SAM scores, includ-
ing the known SKN-1 target gst-4 (Kahn et al., 2008; Tullet
et al., 2008), other GSTs (gst-10, -13, -38, F56A4.4, C02D5.3),
and UGTs (ugt-16, K04A8.10) (Table 1). The SKN-1-upregulated
genes also included some known or predicted Phase 1 detoxifi-
cation genes [aldo ⁄ keto reductase proteins (C07D8.6,
T08H10.1), a CYP (cyp-14A.1), and multiple SDRs (dhs-8,
C55A6.6, C55A6.7, F20G2.1, F20G2.2, R08H2.1, F25D1.5),
Supporting Table S1] (McElwee et al., 2007). In addition, short
chain dehydrogenase was one of the most highly enriched GO
terms in this gene set (Fig. 2d). We conclude that SKN-1 not only
controls expression of numerous Phase 2 detoxification genes,
but also upregulates some Phase 1 genes.
The SKN-1-upregulated genes also included gene groups that
represent other biological processes, some of which are stress
related. We identified numerous genes involved in protein fold-
ing or degradation, some of which have lysosomal functions
Fig. 1 Identification of SKN-1-regulated genes.
mRNA samples were generated under the
indicated conditions, with skn-1()) referring to
skn-1 RNAi and skn-1(+) to RNAi control. Pairs of
samples designated by arrows were compared on
Agilent 4 · 44 oligonucleotide microarrays to
identify genes that are regulated by SKN-1 under
normal conditions (red arrow), and in response to
treatment with Arsenite (As) (dark blue arrows), or
tert-butyl hydroperoxide (t-BOOH) (teal arrows).
Genes that are regulated by SKN-1 under normal
conditions were identified by both SAM and
hierarchical clustering (red arrow). skn-1-
dependent and -independent genes that respond
to As or t-BOOH stress were identified by
hierarchical clustering. While the As-induced
response seemed to be entirely dependent upon
skn-1, t-BOOH induced both skn-1-dependent and
independent gene sets (see text). Some gene
categories that we identified as being prominent in
stress- and SKN-1-upregulated gene sets are listed
in bold, with those that were over-represented in
only one or two sets indicated in italics.
Gene regulation by SKN-1, R. P. Oliveira et al.
ª 2009 The AuthorsJournal compilation ª Blackwell Publishing Ltd/Anatomical Society of Great Britain and Ireland 2009
526
(a) (b)
(c)
(d)
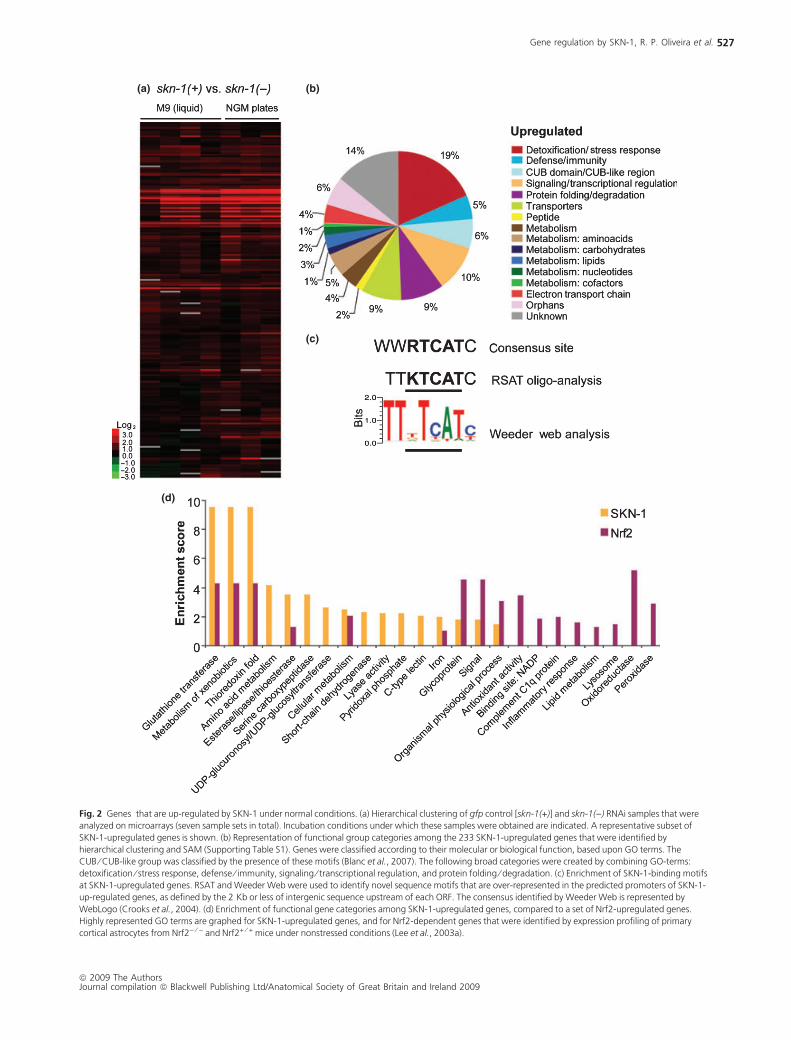
Fig. 2 Genes that are up-regulated by SKN-1 under normal conditions. (a) Hierarchical clustering of gfp control [skn-1(+)] and skn-1()) RNAi samples that were
analyzed on microarrays (seven sample sets in total). Incubation conditions under which these samples were obtained are indicated. A representative subset of
SKN-1-upregulated genes is shown. (b) Representation of functional group categories among the 233 SKN-1-upregulated genes that were identified by
hierarchical clustering and SAM (Supporting Table S1). Genes were classified according to their molecular or biological function, based upon GO terms. The
CUB ⁄ CUB-like group was classified by the presence of these motifs (Blanc et al., 2007). The following broad categories were created by combining GO-terms:
detoxification ⁄ stress response, defense ⁄ immunity, signaling ⁄ transcriptional regulation, and protein folding ⁄ degradation. (c) Enrichment of SKN-1-binding motifs
at SKN-1-upregulated genes. RSAT and Weeder Web were used to identify novel sequence motifs that are over-represented in the predicted promoters of SKN-1-
up-regulated genes, as defined by the 2 Kb or less of intergenic sequence upstream of each ORF. The consensus identified by Weeder Web is represented by
WebLogo (Crooks et al., 2004). (d) Enrichment of functional gene categories among SKN-1-upregulated genes, compared to a set of Nrf2-upregulated genes.
Highly represented GO terms are graphed for SKN-1-upregulated genes, and for Nrf2-dependent genes that were identified by expression profiling of primary
cortical astrocytes from Nrf2) ⁄ ) and Nrf2+ ⁄ + mice under nonstressed conditions (Lee et al., 2003a).
Gene regulation by SKN-1, R. P. Oliveira et al.
ª 2009 The AuthorsJournal compilation ª Blackwell Publishing Ltd/Anatomical Society of Great Britain and Ireland 2009
527
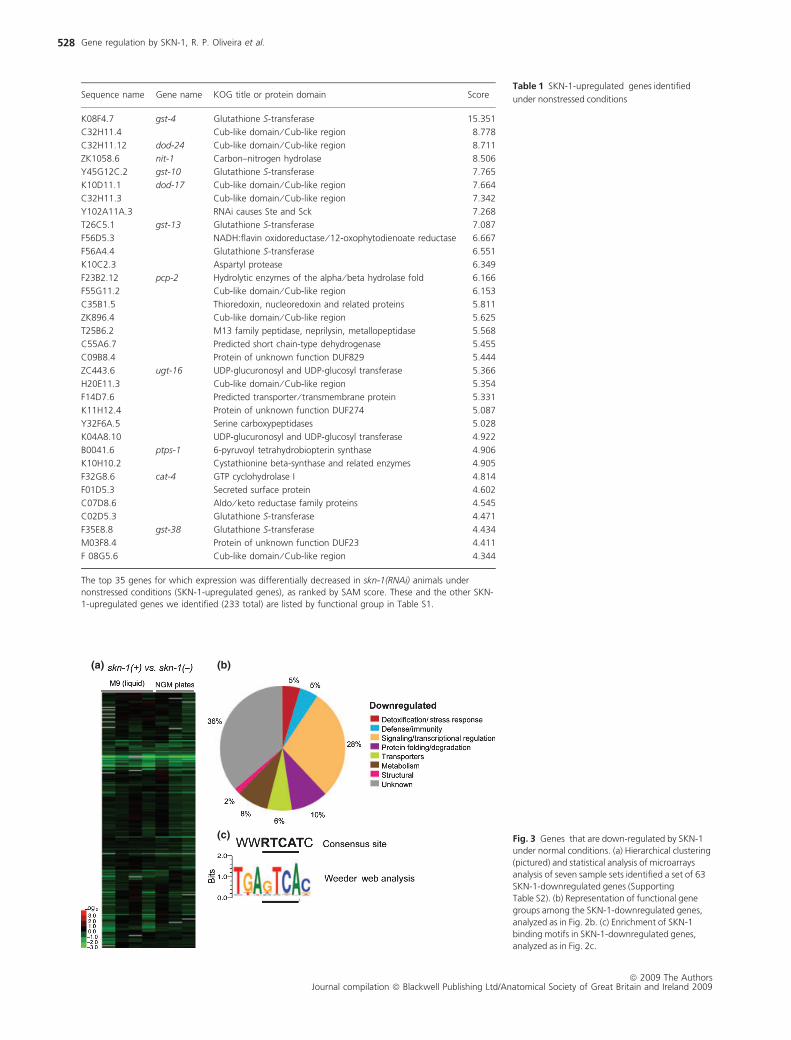
Table 1 SKN-1-upregulated genes identified
under nonstressed conditionsSequence name Gene name KOG title or protein domain Score
K08F4.7 gst-4 Glutathione S-transferase 15.351
C32H11.4 Cub-like domain ⁄ Cub-like region 8.778
C32H11.12 dod-24 Cub-like domain ⁄ Cub-like region 8.711
ZK1058.6 nit-1 Carbon–nitrogen hydrolase 8.506
Y45G12C.2 gst-10 Glutathione S-transferase 7.765
K10D11.1 dod-17 Cub-like domain ⁄ Cub-like region 7.664
C32H11.3 Cub-like domain ⁄ Cub-like region 7.342
Y102A11A.3 RNAi causes Ste and Sck 7.268
T26C5.1 gst-13 Glutathione S-transferase 7.087
F56D5.3 NADH:flavin oxidoreductase ⁄ 12-oxophytodienoate reductase 6.667
F56A4.4 Glutathione S-transferase 6.551
K10C2.3 Aspartyl protease 6.349
F23B2.12 pcp-2 Hydrolytic enzymes of the alpha ⁄ beta hydrolase fold 6.166
F55G11.2 Cub-like domain ⁄ Cub-like region 6.153
C35B1.5 Thioredoxin, nucleoredoxin and related proteins 5.811
ZK896.4 Cub-like domain ⁄ Cub-like region 5.625
T25B6.2 M13 family peptidase, neprilysin, metallopeptidase 5.568
C55A6.7 Predicted short chain-type dehydrogenase 5.455
C09B8.4 Protein of unknown function DUF829 5.444
ZC443.6 ugt-16 UDP-glucuronosyl and UDP-glucosyl transferase 5.366
H20E11.3 Cub-like domain ⁄ Cub-like region 5.354
F14D7.6 Predicted transporter ⁄ transmembrane protein 5.331
K11H12.4 Protein of unknown function DUF274 5.087
Y32F6A.5 Serine carboxypeptidases 5.028
K04A8.10 UDP-glucuronosyl and UDP-glucosyl transferase 4.922
B0041.6 ptps-1 6-pyruvoyl tetrahydrobiopterin synthase 4.906
K10H10.2 Cystathionine beta-synthase and related enzymes 4.905
F32G8.6 cat-4 GTP cyclohydrolase I 4.814
F01D5.3 Secreted surface protein 4.602
C07D8.6 Aldo ⁄ keto reductase family proteins 4.545
C02D5.3 Glutathione S-transferase 4.471
F35E8.8 gst-38 Glutathione S-transferase 4.434
M03F8.4 Protein of unknown function DUF23 4.411
F 08G5.6 Cub-like domain ⁄ Cub-like region 4.344
The top 35 genes for which expression was differentially decreased in skn-1(RNAi) animals under
nonstressed conditions (SKN-1-upregulated genes), as ranked by SAM score. These and the other SKN-
1-upregulated genes we identified (233 total) are listed by functional group in Table S1.
(a) (b)
(c) Fig. 3 Genes that are down-regulated by SKN-1
under normal conditions. (a) Hierarchical clustering
(pictured) and statistical analysis of microarrays
analysis of seven sample sets identified a set of 63
SKN-1-downregulated genes (Supporting
Table S2). (b) Representation of functional gene
groups among the SKN-1-downregulated genes,
analyzed as in Fig. 2b. (c) Enrichment of SKN-1
binding motifs in SKN-1-downregulated genes,
analyzed as in Fig. 2c.
Gene regulation by SKN-1, R. P. Oliveira et al.
ª 2009 The AuthorsJournal compilation ª Blackwell Publishing Ltd/Anatomical Society of Great Britain and Ireland 2009
528
(Fig. 2b; Supporting Table S1). Among the latter group were
vacuolar H+ATPases that translocate protons into lysosomes
and other organelles (vha-2, vha-6, vha-8, vha-16, and vha-17),
serine carboxypeptidases, and the ortholog of LYST (T01H10.8),
which has been implicated in the lysosomal storage disease
Chediak–Higashi syndrome (Kaplan et al., 2008). We also identi-
fied many genes that encode transporters for metals, small
molecules, ions, or water (Fig. 2b; Supporting Table S1). Many
SKN-1-upregulated genes are involved in metabolic processes
(Fig. 2b,d; Supporting Table S1). These include cystathionine
beta-synthase and cystathionine beta-lyases, which convert
homocysteine to cysteine, a precursor of glutathione (Banerjee
& Zou, 2005). Two prominent groups of SKN-1-upregulated
genes are involved in cell surface processes (C-type lectins and
CUB-like domain proteins) (Fig. 2b,d; Table 1; Supporting
Table S1). In other species, the CUB domain has been implicated
in cell-surface functions, such as complement activation, tissue
repair, axon guidance, inflammation, and receptor-mediated
endocytosis (Blanc et al., 2007).
SKN-1 binds preferentially in vitro to the consensus
WWTRTCAT (W = A ⁄ T, R = G ⁄ A), and upregulates gcs-1 by
interacting with this motif (Blackwell et al., 1994; An & Black-
well, 2003). The underlined RTCAT motif is most critical for
binding affinity and specificity, because SKN-1 directly contacts
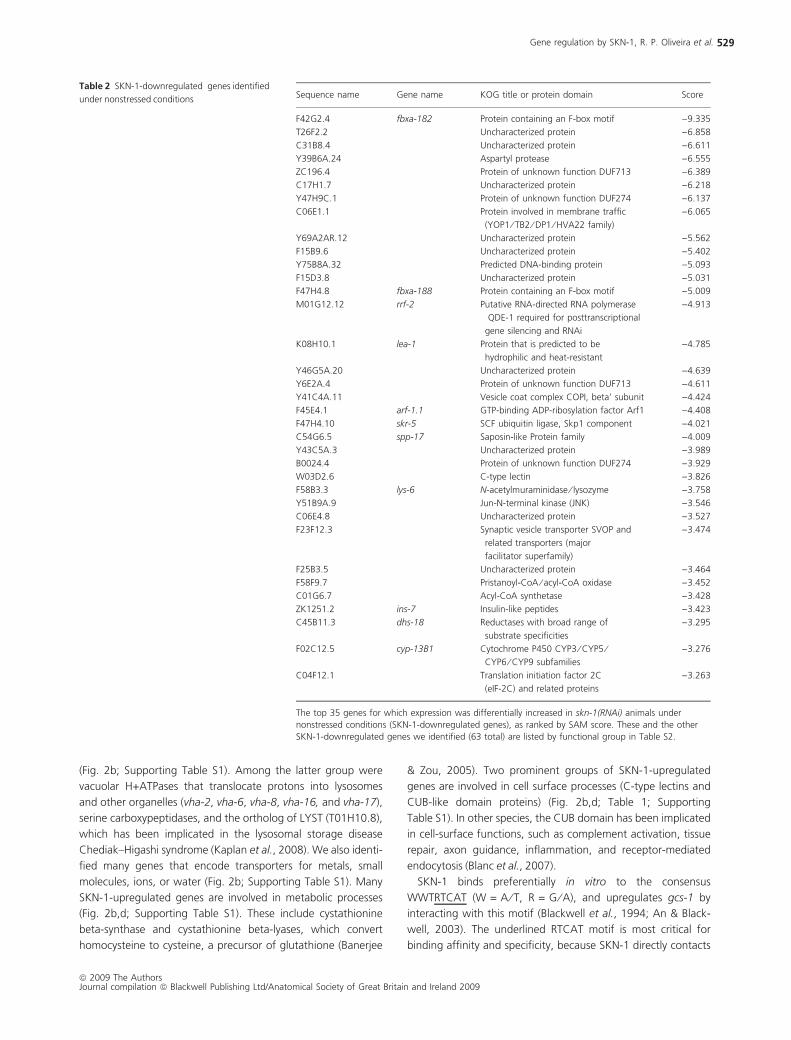
Table 2 SKN-1-downregulated genes identified
under nonstressed conditions Sequence name Gene name KOG title or protein domain Score
F42G2.4 fbxa-182 Protein containing an F-box motif )9.335
T26F2.2 Uncharacterized protein )6.858
C31B8.4 Uncharacterized protein )6.611
Y39B6A.24 Aspartyl protease )6.555
ZC196.4 Protein of unknown function DUF713 )6.389
C17H1.7 Uncharacterized protein )6.218
Y47H9C.1 Protein of unknown function DUF274 )6.137
C06E1.1 Protein involved in membrane traffic
(YOP1 ⁄ TB2 ⁄ DP1 ⁄ HVA22 family)
)6.065
Y69A2AR.12 Uncharacterized protein )5.562
F15B9.6 Uncharacterized protein )5.402
Y75B8A.32 Predicted DNA-binding protein )5.093
F15D3.8 Uncharacterized protein )5.031
F47H4.8 fbxa-188 Protein containing an F-box motif )5.009
M01G12.12 rrf-2 Putative RNA-directed RNA polymerase
QDE-1 required for posttranscriptional
gene silencing and RNAi
)4.913
K08H10.1 lea-1 Protein that is predicted to be
hydrophilic and heat-resistant
)4.785
Y46G5A.20 Uncharacterized protein )4.639
Y6E2A.4 Protein of unknown function DUF713 )4.611
Y41C4A.11 Vesicle coat complex COPI, beta’ subunit )4.424
F45E4.1 arf-1.1 GTP-binding ADP-ribosylation factor Arf1 )4.408
F47H4.10 skr-5 SCF ubiquitin ligase, Skp1 component )4.021
C54G6.5 spp-17 Saposin-like Protein family )4.009
Y43C5A.3 Uncharacterized protein )3.989
B0024.4 Protein of unknown function DUF274 )3.929
W03D2.6 C-type lectin )3.826
F58B3.3 lys-6 N-acetylmuraminidase ⁄ lysozyme )3.758
Y51B9A.9 Jun-N-terminal kinase (JNK) )3.546
C06E4.8 Uncharacterized protein )3.527
F23F12.3 Synaptic vesicle transporter SVOP and
related transporters (major
facilitator superfamily)
)3.474
F25B3.5 Uncharacterized protein )3.464
F58F9.7 Pristanoyl-CoA ⁄ acyl-CoA oxidase )3.452
C01G6.7 Acyl-CoA synthetase )3.428
ZK1251.2 ins-7 Insulin-like peptides )3.423
C45B11.3 dhs-18 Reductases with broad range of
substrate specificities
)3.295
F02C12.5 cyp-13B1 Cytochrome P450 CYP3 ⁄ CYP5 ⁄CYP6 ⁄ CYP9 subfamilies
)3.276
C04F12.1 Translation initiation factor 2C
(eIF-2C) and related proteins
)3.263
The top 35 genes for which expression was differentially increased in skn-1(RNAi) animals under
nonstressed conditions (SKN-1-downregulated genes), as ranked by SAM score. These and the other
SKN-1-downregulated genes we identified (63 total) are listed by functional group in Table S2.
Gene regulation by SKN-1, R. P. Oliveira et al.
ª 2009 The AuthorsJournal compilation ª Blackwell Publishing Ltd/Anatomical Society of Great Britain and Ireland 2009
529

the RTCA base pairs in the major groove (Rupert et al., 1998;
Kophengnavong et al., 1999). The WWTRTCAT motif should
occur randomly only once every 2048 bp in the genome, but
49% of the SKN-1-upregulated genes (115 ⁄ 233) contained two
to six copies of this element within their putative promoters, as
defined by 5¢ intergenic sequence up to 2 kb (Supporting
Table S1; Supporting Fig. S2). An analysis of SKN-1-upregulated
gene promoters for novel over-represented sequences identified
a motif that is similar to the canonical SKN-1 consensus
[TTDTCATC, (D = A ⁄ G ⁄ T); Fig. 2c; see Experimental Proce-
dures], and in many instances corresponds to the same element
within these putative promoters (data not shown). This novel
motif, which is more restrictive than the WWTRTCAT consensus
(1 ⁄ 10923 bp randomly), was present in 110 (47%) of the SKN-
1-upregulated gene promoters (£ 2 kb) (Supporting Table S1;
Supporting Fig. S2). Taken together, the data indicate that SKN-
1 may directly control the expression of many of the SKN-1-up-
regulated genes we identified.
The functional parallels between SKN-1 and mammalian Nrf
proteins (An & Blackwell, 2003) predicts that these proteins
should regulate similar categories of genes. Accordingly, many
of the GO terms that we identified in SKN-1-upregulated genes
were also enriched in a set of Nrf2-dependent genes that were
identified in murine primary cortical astrocytes (Lee et al.,
2003a), including glutathione transferase, xenobiotic metabo-
lism, and other stress response groups (Fig. 2d). In addition,
UGTs were identified in two sets of stress-induced Nrf2-depen-
dent genes (Kwak et al., 2003; Lee et al., 2003a). Interestingly,
the SKN-1- and Nrf2-upregulated genes also included some GO
term groups that did not overlap (Fig. 2d). Apparent C. elegans
homologs exist for more than half of the Nrf2-regulated genes
in the GO terms that were unique to Nrf2 (not shown), suggest-
ing that their lack of detectable regulation by SKN-1 might
derive from tissue- or organism-specific differences.
In contrast to the SKN-1-upregulated genes, no particular bio-
logical function predominated among the 63 genes that were
down-regulated by SKN-1 under normal conditions (Fig. 3b;
Supporting Table S2). Two of these genes function in the IIS
pathway. ins-7 encodes an insulin-like peptide and DAF-2 ago-
nist (Murphy et al., 2003), and pdk-1 encodes a kinase that
functions downstream of DAF-2 to activate the AKT-1 ⁄ 2 and
SGK-1 kinases, which inhibit DAF-16 and SKN-1 through phos-
phorylation (Paradis & Ruvkun, 1998; Hertweck et al., 2004; Tul-
let et al., 2008). Other SKN-1-downregulated genes encode
regulatory proteins that function in signaling, ubiquitin-medi-
ated proteolysis, or gene regulation, including four that may be
involved in RNAi [a putative RNA-directed RNA polymerase (RRF-2)
and the Argonaute-related proteins PPW-1, SAGO-2, and
C04F12.1 (Yigit et al., 2006)]. Of 14 genes that had been identi-
fied as downregulated by Nrf2 in cortical astrocytes under nor-
mal conditions (Lee et al., 2003a), only four have apparent
C. elegans homologs (not shown). The SKN-1-downregulated
genes did not include any of these four genes, a group that is
too small for a conclusive comparison.
Multiple copies of the canonical in vitro SKN-1 binding site
WWTRTCAT were present within predicted promoters at 17
SKN-1-downregulated genes (27%), including ins-7 (Supporting
Fig. S2; Supporting Table S2), suggesting that many of these
genes might be repressed directly by SKN-1. In addition, within
these 63 promoters we identified the novel motif TGAGTCAC
(Fig. 3c), which may be a variant of the canonical motif. Interest-
ingly, only 10 of 233 SKN-1-upregulated genes (4.3%) displayed
this new motif, compared to 31% of the SKN-1 downregulated
genes (Supporting Fig. S2, Table S2), suggesting that it might
mediate transcriptional inhibition by SKN-1.
SKN-1 mediates the transcriptional response to
Arsenite
We next examined how SKN-1 contributes to stress responses,
first by investigating its role in the As response (Fig. 1, dark blue
arrows). Hierarchical clustering identified 118 genes that are up-
regulated in a skn-1-dependent manner upon As exposure
(As ⁄ SKN-1-dependent genes), but did not detect any genes that
were down-regulated by SKN-1 in response to As, or induced by
As independently of SKN-1 (Fig. 4a; Supporting Table S5). A qRT-
PCR analysis confirmed the skn-1-dependence of a set of our
As ⁄ SKN-1-dependent genes, supporting the microarray data
(Supporting Table S6). An analysis of the predicted promoters of
these As ⁄ SKN-1-dependent genes for novel shared motifs identi-
fied essentially the same elements we had earlier detected in the
SKN-1-upregulated gene promoters (Figs 2c and 4b; Supporting
Table S5), suggesting that a high proportion of these genes are
likely to be direct SKN-1 targets. The bulk of the transcriptional
response to As therefore appears to be mobilized by SKN-1.
When we compared the As ⁄ SKN-1-dependent genes to the
SKN-1-upregulated genes we had identified under normal con-
ditions, we found that the majority of the As transcriptional
response (83 genes) was common to both sets (Fig. 4c). These
gene sets also shared many prominent GO terms, including glu-
tathione transferase, thioredoxin fold, lyase activity, and short-
chain dehydrogenase (Fig. 4d). The SKN-1-upregulated genes
that were identified under normal and As-induction conditions
also differed in important respects. Within the GO terms that
these gene sets had in common, the As ⁄ SKN-1-dependent set
included potentially important As-specific genes such as hmt-1,
an ABC-type transporter that is critical for C. elegans heavy
metal tolerance (Vatamaniuk et al., 2005). In addition, the
As ⁄ SKN-1-dependent genes included some new GO terms, such
as alcohol dehydrogenase, as well as a new set of genes involved
in glutathione synthesis (Supporting Table S5). Importantly,
these As-induced genes also lacked some GO terms that were
prominent among the SKN-1-upregulated genes we had identi-
fied under normal conditions (i.e. UGTs and C-type lectins)
(Fig. 4d). We conclude that the response to As does not consist
of simply a broad induction of the genes that are upregulated by
SKN-1 in the absence of stress, but instead involves induction of
particular sets of those genes, along with additional targets.
Gene regulation by SKN-1, R. P. Oliveira et al.
ª 2009 The AuthorsJournal compilation ª Blackwell Publishing Ltd/Anatomical Society of Great Britain and Ireland 2009
530

(a)
(d)
(b)
(c)
Fig. 4 SKN-1 regulation of overlapping gene groups under normal and Arsenite (As) stress conditions. (a) Hierarchical clustering of genes that are differentially
regulated in response to As treatment (four sample sets, see Experimental Procedures). Genes were identified that are As-upregulated and skn-1-dependent, but
none were identified that are As-upregulated and skn-1-independent. A subset of the genes identified by hierarchical clustering is shown. (b) Enrichment of SKN-
1-binding motifs in As and SKN-1-upregulated genes, analyzed as in Fig. 2c. (c) Venn diagram showing overlap among genes that were upregulated by SKN-1
under normal and As stress conditions. (d) Comparison of SKN-1-upregulated genes identified under normal, As-treatment, and t-BOOH-treatment conditions,
grouped by GO terms. Note that some GO terms are overrepresented among only one or two of these gene groups.
Gene regulation by SKN-1, R. P. Oliveira et al.
ª 2009 The AuthorsJournal compilation ª Blackwell Publishing Ltd/Anatomical Society of Great Britain and Ireland 2009
531
We also used hierarchical clustering across the As-treated
SKN-1 (+) and ()) samples and their controls (dark blue arrows,
Fig. 1) to identify genes that were upregulated by SKN-1 under
both normal and As-exposed conditions, but were not upregu-
lated by As treatment (As-independent; Supporting Table S7).
As would be predicted, these new genes did not include any of
our As- ⁄ SKN-1-dependent genes, and included few or no UGTs,
C-type lectins, or alcohol dehydrogenases, groups that were
prominent among SKN-1-upregulated genes under either nor-
mal or As-treated conditions, but not both (Fig. 4c; Supporting
Tables S1, S5 and S7). This further supports the idea that As
treatment activates distinct subsets of SKN-1 target genes. In
addition, by analyzing samples obtained under nonstressed and
As-treatment conditions simultaneously, this analysis detected
many SKN-1-regulated genes that we had not identified in our
study of skn-1(+) and skn-1()) control samples only, including
15 genes that encode proteasome subunits (Supporting
Table S7). Proteasome genes have been implicated as Nrf2 tar-
gets (Kwak et al., 2003), suggesting that the regulation of these
genes by SKN-1 ⁄ Nrf proteins is conserved.
SKN-1-dependent and -independent responses to
tert-butyl hydroperoxide
To test further the notion that SKN-1 upregulates particular sub-
sets of its target genes in response to stress, we investigated
how SKN-1 contributes to the transcriptional response to
t-BOOH treatment, again using hierarchical clustering (Fig. 1, teal
arrows; Fig. 5a). Here, in striking contrast to the effects of As
treatment, we observed that t-BOOH not only upregulates a set
of SKN-1-dependent genes, but also induces a broad SKN-inde-
pendent response (Fig. 5b; Supporting Tables S8, S9 and S10).
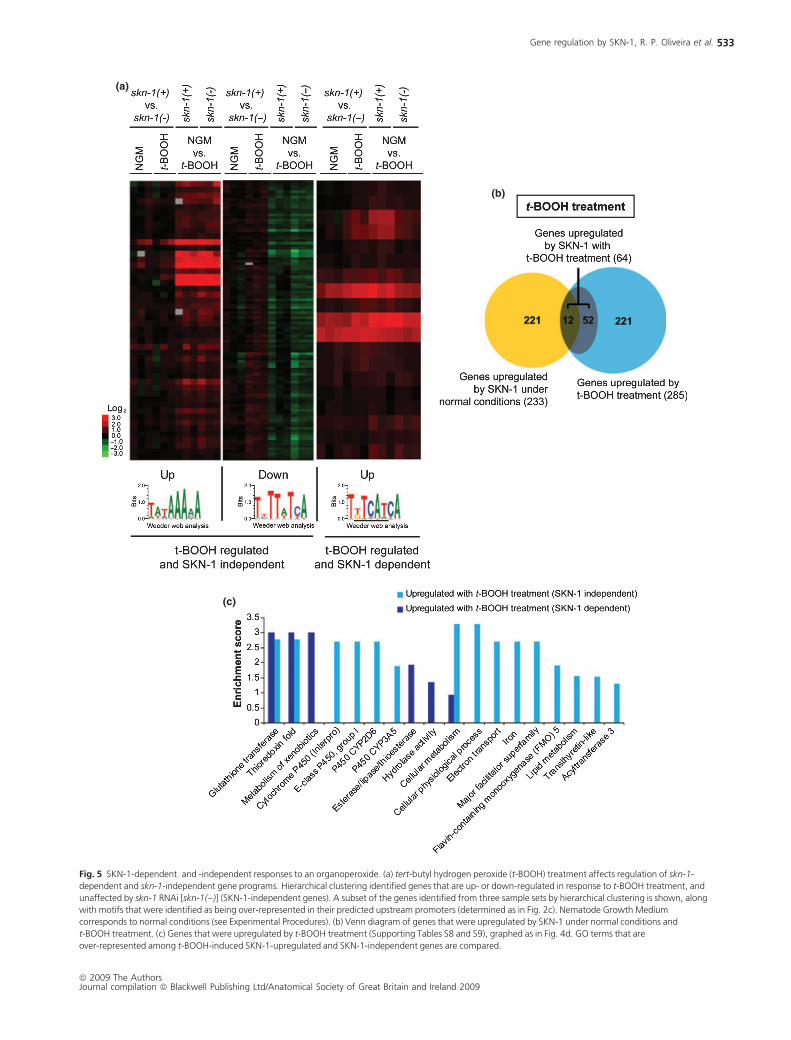
Only a minority of the t-BOOH response appeared to require
skn-1, as skn-1 RNAi impaired induction of only 64 (22%) of
the 285 t-BOOH-upregulated genes we detected. Interestingly,
we had previously identified only 12 (19%) of the SKN-1-
dependent t-BOOH-induced genes as being SKN-1-upregu-
lated under normal conditions (Fig. 5b). The other 52 SKN-1-
dependent t-BOOH-induced genes encompassed some gene
classes or GO terms that were not detected under either
normal or As-induced conditions (i.e. BTB ⁄ POZ-like, casein
kinase, hydrolase activity) (Supporting Tables S1, S5 and S8;
Fig. 5c). Analysis of the t-BOOH-induced SKN-1-dependent
gene promoters for novel motifs identified an element that is
consistent with the SKN-1 in vitro consensus and was not
over-represented at SKN-1-independent t-BOOH-induced
genes (TKTCATCA, Fig. 5a), suggesting that many of these
genes might be direct SKN-1 targets.
We identified a much larger number of genes that were up- or
down-regulated by t-BOOH under both control and skn-1 RNAi
conditions (referred to as SKN-1-independent). One hundred
nine genes were downregulated by t-BOOH, including many
metabolism genes (Supporting Table S10). Importantly, the 221
genes that were upregulated by t-BOOH independently of skn-1
encompassed many functional groups that were not prominent
in the As-induced set. They included a greater number of Phase
1 detoxification genes (CYP450 enzymes and other mono-
oxygenases), nuclear hormone receptors, additional signaling or
transcription regulators, and many lipid metabolism genes
(Fig. 5c; Supporting Table S9).
It is unlikely that the striking differences between the As and
t-BOOH responses simply reflect different stress ‘levels’, because
our stress conditions were adjusted to comparable gcs-1 induc-
tion and resulted in only a residual frequency of death (Support-
ing Fig. S1; see Experimental Procedures). Furthermore, under
conditions where As treatment resulted in substantially greater
toxicity than t-BOOH, a representative SKN-1-independent,
t-BOOH-upregulated gene (fmo-2) was induced by t-BOOH but
not As (Supporting Fig. S3). A qRT-PCR analysis showed that
many t-BOOH-upregulated genes were induced more robustly
in a predicted null skn-1 mutant than in N2, thereby confirming
their independence from skn-1 and suggesting that their induc-
tion is stronger when SKN-1-mediated stress defenses are
impaired (Supporting Fig. S4). Surprisingly, we had previously
identified some SKN-1-independent t-BOOH-upregulated genes
as being SKN-1-dependent under normal or As-induction condi-
tions (including gst-14 and gst-39; Supporting Tables S1, S5 and
S9). A qRT-PCR analysis confirmed that gst-14 and gst-39 were
induced by t-BOOH in the absence of SKN-1, although their
induction was more robust in N2 (Supporting Fig. S4).
Taken together, the data demonstrate that the organismal
transcriptional response to t-BOOH is more complex than the As
response. The t-BOOH response involves induction of particular
Phase 2 genes by SKN-1, along with a broad skn-1-independent
response that includes upregulation of some Phase 2 genes that
were skn-1-dependent under As-induction or normal conditions.
SKN-1 downregulates genes that decrease stress
resistance or lifespan
The SKN-1-regulated gene profiles that we identified under nor-
mal and stress conditions were surprisingly complex, suggesting
that SKN-1 not only responds acutely to stress, but also may reg-
ulate many genes under normal conditions that could be impor-
tant for stress resistance and longevity. To test this idea, we
investigated how genes that are regulated by SKN-1 under nor-
mal conditions influence the organism’s capacity for stress resis-
tance. We first examined how six SKN-1-upregulated genes
affect As resistance, by inhibiting their expression using RNAi
(Fig. 6a). These genes were selected from among those that
showed the most statistical significance by SAM (Table 1). They
each encoded known stress-defense enzymes, with the excep-
tion of the CUB-like genes C32H11.3 and C32H11.4. RNAi of
each gene that we tested decreased As resistance but did not
impair movement or fertility of control animals (Fig. 6a; not
shown), suggesting that many SKN-1-upregulated genes con-
tribute to stress resistance. In no case did knockdown of these
genes compromise As resistance comparably to skn-1 RNAi
(Fig. 6a), consistent with the idea that SKN-1 coordinates many
defense mechanisms.
Gene regulation by SKN-1, R. P. Oliveira et al.
ª 2009 The AuthorsJournal compilation ª Blackwell Publishing Ltd/Anatomical Society of Great Britain and Ireland 2009
532
(a)
(c)
(b)
Fig. 5 SKN-1-dependent and -independent responses to an organoperoxide. (a) tert-butyl hydrogen peroxide (t-BOOH) treatment affects regulation of skn-1-
dependent and skn-1-independent gene programs. Hierarchical clustering identified genes that are up- or down-regulated in response to t-BOOH treatment, and
unaffected by skn-1 RNAi [skn-1())] (SKN-1-independent genes). A subset of the genes identified from three sample sets by hierarchical clustering is shown, along
with motifs that were identified as being over-represented in their predicted upstream promoters (determined as in Fig. 2c). Nematode Growth Medium
corresponds to normal conditions (see Experimental Procedures). (b) Venn diagram of genes that were upregulated by SKN-1 under normal conditions and
t-BOOH treatment. (c) Genes that were upregulated by t-BOOH treatment (Supporting Tables S8 and S9), graphed as in Fig. 4d. GO terms that are
over-represented among t-BOOH-induced SKN-1-upregulated and SKN-1-independent genes are compared.
Gene regulation by SKN-1, R. P. Oliveira et al.
ª 2009 The AuthorsJournal compilation ª Blackwell Publishing Ltd/Anatomical Society of Great Britain and Ireland 2009
533

We also asked how 22 of the SKN-1-downregulated genes
affect stress resistance. One possible model is that these genes
might protect against stress under normal conditions, and
were upregulated after skn-1 RNAi as a secondary defensive
response to stress resulting from SKN-1 loss. Alternatively, if
these SKN-1-downregulated genes are actively repressed by
SKN-1, through SKN-1 either acting directly at their promoters
or triggering a repressive signal, they might be predicted to
decrease stress resistance. Consistent with the latter model, the
SKN-1-downregulated genes pdk-1 and ins-7 (Supporting
Table S2) each act in the IIS pathway to decrease lifespan (Para-
dis & Ruvkun, 1998; Murphy et al., 2003). These examples sug-
gested that other SKN-1-downregulated genes might also
decrease stress resistance or lifespan. Accordingly, As resistance
was increased consistently in young adult animals after RNAi
knockdown of 15 of 22 SKN-1-downregulated genes that we
tested, including ins-7 (Fig. 6b,c and Supporting Fig. S5). The
observation that these SKN-1 downregulated genes act to
decrease stress resistance suggests that they might be actively
repressed by SKN-1.
We next examined how 26 of the SKN-1-downregulated
genes affect lifespan under nonstressed conditions. These genes
were selected among those with the most significant SAM
scores (Supporting Table S2). RNAi knockdown of 11 of these
26 genes significantly extended lifespan in each of three inde-
pendent experiments, (P < 0.01; log-rank) (Fig. 6d; Supporting
Table S11a–c, Table S12). These 11 genes included ins-7, along
with ten other genes that are newly identified here as longevity-
affecting genes, as none had been shown previously to influ-
ence lifespan (WormBase). This number is probably an underes-
timate, as RNAi of several additional genes extended lifespan in
two of three trials (Table 3). Of the 15 genes for which RNAi
increased As stress resistance (Supporting Fig. S5), seven were
associated with increased lifespan in all three of our longevity tri-
als, and five in two of these trials (Supporting Table S2). We con-
clude that under normal conditions SKN-1 inhibits many genes
that reduce stress resistance and ⁄ or longevity (Fig. 7).
Discussion
SKN-1 is required for oxidative stress resistance and has impor-
tant functions in the absence of acute stress, as it promotes lon-
gevity under normal, reduced IIS, and CR conditions (An &
Blackwell, 2003; Bishop & Guarente, 2007a; Tullet et al., 2008).
Here we show that under nonstressed conditions SKN-1 upregu-
lates numerous detoxification genes, along with other genes
(a)
(b)
(c)
(d)
Fig. 6 SKN-1-regulated genes influence oxidative stress resistance and
lifespan. (a) Many SKN-1-upregulated genes promote oxidative stress
resistance. SKN-1-upregulated genes (Supporting Table S1) were knocked
down by RNAi, then survival of young adults (8–9 h) was assayed at the
indicated times after introduction into 4 mM As. A representative experiment
is shown in which five wells of ten worms each were examined. Error bars
indicate the SEM, and P-values (Student’s t-test) indicate comparison to
control RNAi. *P £ 0.0008; **P £ 0.008 (Student’s t-test). (b) Many SKN-1-
downregulated genes reduce oxidative stress resistance. Resistance to As was
analyzed after RNAi of the indicated genes (Supporting Table S2) as in (a).
Other experiments and analyses of additional genes are described in (c) and
Fig. S5 (Supporting information). *P £ 0.0008; **P £ 0.008 (Student’s t-test).
(c) Analysis of As resistance in young adults (2–6 h). Experimental and control
RNAi worms were placed in 5 mM As, then the fraction surviving was counted
16, 24, and 40 h later. Results are presented as a graph from which we
calculated the approximate fraction of animals in each set that were alive
when 20% of the control animals were still surviving (black vertical line).
A comparison of this fraction to control is plotted in Fig. S5 (Supporting
information). Six samples of ten worms each were examined for every
condition. P-value of fraction alive compared to control at 20% control
survival is < 0.05 for all genes shown (Student’s t-test performed across
samples). Error bars = SEM. (d) Many SKN-1-downregulated genes decrease
lifespan. A set of SKN-1-downregulated genes was analyzed for effects on
longevity using a feeding RNAi longevity assay in RNAi-sensitive rrf-3(pk1426)
worms at 20 �C. Genes for which RNAi extended lifespan significantly in 3 ⁄ 3trials (P < 0.01, log-rank) are diagrammed, with data from a single trial shown
(Supporting Table S11b, Experiment 2). Control is empty RNAi feeding vector
L4440. Data and statistical analyses for all experiments and genes tested are
provided in Table S11a–c and Table S12 (Supporting information).
Gene regulation by SKN-1, R. P. Oliveira et al.
ª 2009 The AuthorsJournal compilation ª Blackwell Publishing Ltd/Anatomical Society of Great Britain and Ireland 2009
534

with functions that may be related to stress defenses. We also
found that SKN-1 inhibits genes that reduce stress resistance
and longevity. Finally, we observed that SKN-1 induces discrete
target gene groups in response to stress, and that some stresses
activate SKN-1-independent stress defense mechanisms in par-
allel. Many of the genes we identified in each SKN-1-dependent
gene set are likely to be direct SKN-1 targets, as suggested by
the prevalence of SKN-1 binding sites in their promoters. Our
results reveal a notable degree of complexity in SKN-1 functions
and C. elegans stress responses.
Multiple SKN-1 functions under normal conditions
Many of the 233 genes that we identified as SKN-1-upregulated
under normal conditions are involved directly in stress-related
processes (Table 1; Supporting Table S1). These included GST,
UGT, and other Phase 2 genes that are involved in conjugation
of toxic compounds, ROS metabolism, or glutathione produc-
tion (Fig. 2b,d; Supporting Table S1). Interestingly, some of
these GSTs might be involved in functions besides detoxification.
For instance, the most highly upregulated SKN-1 target (gst-4,
Table 1) seems to function not only as a GST, but also as a gluta-
thione-dependent prostaglandin D synthase (Kubagawa et al.,
2006). Besides Phase 2 genes, we also detected significant rep-
resentation of Phase 1 (SDR, CYP) and Phase 3 (Transporter)
genes, indicating that SKN-1 plays a broad role in systemic
detoxification. Interestingly, our SKN-upregulated gene sets did
not include superoxide dismutase (SOD) or catalase genes, and
we found previously that sod-3 is upregulated independently of
skn-1 in the context of reduced IIS (Tullet et al., 2008). Taken
together, our data suggest that SKN-1 does not regulate a pri-
mary response to endogenously produced superoxide or hydro-
gen peroxide, and instead promotes detoxification, cellular
repair, and activity of the many antioxidant and stress-defense
systems that depend upon glutathione.
Numerous SKN-1-upregulated genes are involved in lysosomal
or proteasomal functions (Supporting Table S1, S5 and S8; see
Results), suggesting that SKN-1 may promote recycling of
damaged cellular components. RNAi knockdown of many
proteasome component genes has been shown to result in accu-
mulation of SKN-1 in nuclei, through an unknown mechanism
(Kahn et al., 2008). Together with this observation, our results
suggest the existence of a feedback mechanism whereby SKN-1
might limit its own activity by upregulating proteasome gene
expression.
Other genes we identified implicate SKN-1 in additional activi-
ties. Many SKN-1-upregulated genes encode cell-surface pro-
teins, including CUB-like proteins (Fig. 2b; Supporting Table S1).
Some CUB-like genes are also regulated by p38 MAPK signaling,
which is important for SKN-1 function in the intestine (Inoue
et al., 2005; Troemel et al., 2006). RNAi of the CUB-like genes
C32H11.3 and C32H11.4 modestly reduced As resistance
(Fig. 6a), indicating that some CUB-like proteins affect stress
resistance. SKN-1-upregulated genes are involved in additional
diverse molecular functions that include transcription, signaling,
ubiquitination, and metabolism (Fig. 2b,d; Supporting Table S1),
indicating that SKN-1 is involved in a complex group of pro-
cesses. It will be interesting to elucidate which of these pro-
cesses might indirectly affect detoxification or stress resistance.
It seems likely that the SKN-1-regulated genes we identified
under normal and other conditions primarily reflect SKN-1 func-
tioning in the intestine, as opposed to the ASI neurons, because
SKN-1 expression is more prominent in the intestine (An & Black-
well, 2003). In addition, we reduced SKN-1 expression by RNAi,
which works comparatively poorly in neurons (Timmons et al.,
2001). We were therefore very surprised to find that SKN-1 con-
trols so many genes under normal conditions, because SKN-1 is
present in intestinal nuclei at comparatively low levels in the
absence of stress (An & Blackwell, 2003). It is even possible that
we might have underestimated the breadth of SKN-1 activity,
because these analyses of whole worms could have missed some
genes that are regulated by SKN-1 in only subsets of tissues.
Importantly, most of the individual genes that were controlled
by SKN-1 under normal conditions were not upregulated in As
or t-BOOH stress responses (Figs 2, 4 and 5), arguing against the
idea that the SKN-1-dependent gene activity detected under
normal conditions derives simply from animals being mildly
‘stressed’. We conclude that under normal conditions SKN-1 is
important for fine-tuning of genes involved in many stress
related and other functions.
Many of the functional categories that are characteristic of
SKN-1-upregulated genes (GST, UGT, SDR, CYT, CUB domain,
drug transporters) are also prominent among C. elegans or yeast
genes that depend upon the general mRNA transcription factor
MDT-15 (MED-15) (Taubert et al., 2008; Thakur et al., 2008).
MDT-15 is a subunit of Mediator, a large multiprotein complex
that must be brought to promoters for transcription to initiate.
MDT-15 is required for function of the transcription regulators
SBP-1 (SREBP) and NHR-49 (PPARa), which are critical for lipid
homeostasis and metabolic regulation (Taubert et al., 2006;
Yang et al., 2006). Those two regulators seem to activate tran-
scription at least in part by binding to MDT-15, and thereby
recruiting Mediator to promoters. MDT-15 is also required for
xenobiotic defense and has been proposed to co-ordinate multi-
ple transcriptional responses to food, toxins, and other ingested
Fig. 7 A model for SKN-1 functions under normal conditions. A positive
feedback interaction with ins-7 and the DAF-2 pathway is featured. SKN-1
upregulates many genes that promote detoxification and stress resistance,
and also downregulates genes that decrease stress resistance, lifespan, or
both. Among the SKN-1-downregulated genes are both ins-7 and pdk-1 (not
shown), each of which promotes DAF-2 pathway signaling (see text). The
DAF-2 pathway in turn inhibits SKN-1 (Tullet et al., 2008).
Gene regulation by SKN-1, R. P. Oliveira et al.
ª 2009 The AuthorsJournal compilation ª Blackwell Publishing Ltd/Anatomical Society of Great Britain and Ireland 2009
535
materials (Taubert et al., 2008). Our results suggest the intrigu-
ing model that SKN-1 might interact functionally or physically
with MDT-15 to regulate some detoxification genes.
SKN-1-dependent suppression of stress-sensitization
and anti-longevity genes
It was striking that SKN-1 downregulates numerous genes under
nonstressed conditions, and that in many cases RNAi of these
genes increased stress resistance and ⁄ or lifespan (Fig. 6; Sup-
porting Table S2 and Table 3). Many of these SKN-1-downregu-
lated genes contain predicted SKN-1 binding sites in their
putative promoters, predicting that some might be repressed
directly by SKN-1 (Supporting Table S2). This seems surprising,
because SKN-1 is a powerful activator of transcription (Walker
et al., 2000). However, other examples have been identified of
transcription regulators that seem to function as both activators
and repressors, including DAF-16 (Murphy et al., 2003). An
important implication of our findings is that the previously
described functions of SKN-1 in promoting stress resistance and
longevity (An & Blackwell, 2003; Bishop & Guarente, 2007b;
Tullet et al., 2008) might be attributable not only to SKN-1 upre-
gulating stress defense and other genes, but also to its inhibiting
genes that have the opposite effect.
The stress-sensitization and anti-longevity genes we identified
among the SKN-1-downregulated genes are involved in diverse
functions (Supporting Table S2). For example, lea-1 decreases
As resistance (Fig. 6b) but is predicted to protect against dessica-
tion (Browne et al., 2002). Perhaps adaptations to some condi-
tions are not beneficial in the setting of stresses that would
activate a SKN-1 response. Other SKN-1-downregulated genes
that reduce stress resistance or lifespan encode regulatory pro-
teins, including an F-box protein (FBXA-188) and the predicted
SCF ubiquitin ligase component SKR-5 (Fig. 6b,c; Table 3). It is
particularly noteworthy that SKN-1 downregulates genes that
encode the IIS pathway kinase PDK-1 and the DAF-2 agonist
INS-7, each of which had previously been shown to reduce lon-
gevity (Paradis & Ruvkun, 1998). INS-7 coordinates IIS and DAF-
16 activity among tissues (Murphy et al., 2003, 2007). DAF-16
inhibits ins-7 expression in a positive feedback loop, thereby
relieving negative regulation of itself by IIS. Our results indicate
that SKN-1 and INS-7 are involved in a similar feedback loop that
could magnify the effects of upregulating IIS on the one hand,
or either DAF-16 or SKN-1 on the other (See model in Fig. 7).
SKN-1 functions analogously to DAF-16 in three intriguing
ways. First, both proteins are inhibited directly by IIS (Tullet
et al., 2008). Second, our new results reveal that SKN-1, like
DAF-16, down-regulates multiple mechanisms that reduce
stress resistance or longevity (Murphy et al., 2003) (Fig. 7). Why
would such mechanisms exist, and why would they respond to
SKN-1? Perhaps it is advantageous to hold some stress defense
mechanisms in check under normal conditions; for example,
enzymes that metabolize endobiotics or free radicals could have
profound effects on hormonal and cell signaling pathways.
Third, like SKN-1, DAF-16 also upregulates many stress
resistance genes, as indicated by transcription profiling and pro-
teomics performed under conditions of reduced IIS (Murphy
et al., 2003; Dong et al., 2007; McElwee et al., 2007), compara-
tive genomics and bioinformatics (Lee et al., 2003b), and chro-
matin immunoprecipitation studies (Oh et al., 2006). DAF-16
upregulates many CYP and other Phase 1 genes (Murphy et al.,
2003; McElwee et al., 2007), and one analysis suggests that
some GSTs are upregulated by DAF-16 and are associated with
IIS regulation in other species (McElwee et al., 2007). In addition,
we observed earlier that SKN-1 and DAF-16 together increase
activity of particular GST genes in the context of a daf-2 mutant
(Tullet et al., 2008). In the future, it will be interesting to
elucidate the extent to which SKN-1 and DAF-16 might function
cooperatively under particular conditions.
Customized skn-1-dependent and -independent
responses to stress
How animals respond to metabolic or environmental stresses
and how these responses are regulated are fundamentally
important questions. By analyzing the transcriptional responses
of C. elegans to As and t-BOOH we have obtained new insights
into SKN-1 functions, its role in these stress responses, and how
C. elegans adapts to stresses. For example, it was striking that
only a subset of SKN-1-responsive genes were upregulated by
each of these stresses. Multiple GO terms that were prominent
among SKN-1-upregulated genes under normal conditions were
not represented among the As or t-BOOH induced genes (i.e.
UGT, C-type lectin), and new GO terms appeared among the
SKN-1-dependent genes that were upregulated by As (i.e. alco-
hol dehydrogenase) and t-BOOH (hydrolase) (Fig. 4d). The
apparent specificity of these responses indicates that SKN-1
does not simply regulate its target genes in tandem in response
to stress levels. Instead, SKN-1 must integrate multiple signals,
so that in response to a given stimulus some genes are induced
and others are left unaffected. Our results suggest that mamma-
lian Nrf proteins may have a similarly complex set of functions
that might not be apparent from analyses of single cell types or
tissues.
Another interesting observation was that while the entire
As response we detected required skn-1, t-BOOH stimulated a
skn-1-independent response that included induction of large
numbers of Phase 1 detoxification, nuclear receptor, and lipid
metabolism genes, along with upregulation of some genes that
were skn-1-dependent under other conditions (Fig. 5b,c;
Supporting Table S9). As these findings were obtained with
skn-1 RNAi (Fig. 1), it is impossible to establish that all of these
genes were induced by t-BOOH independently of skn-1. How-
ever, this was true for each of the seven genes that we analyzed
in a predicted null skn-1 mutant (Supporting Fig. S4), indicating
that t-BOOH induces a broad skn-1 independent response. Inter-
estingly, RNAi knockdown of the 2-Cys peroxiredoxin prdx-2
results in skn-1-independent activation of the SKN-1 target gene
gcs-1 (Olahova et al., 2008), further supporting the idea that
some signals induce Phase 2 genes independently of skn-1.
Gene regulation by SKN-1, R. P. Oliveira et al.
ª 2009 The AuthorsJournal compilation ª Blackwell Publishing Ltd/Anatomical Society of Great Britain and Ireland 2009
536
Together, our findings suggest that the transcriptional responses
to oxidative stresses may be highly specific, and adapted to the
challenge faced by the organism.
Why would the responses to As and t-BOOH be so different?
Arsenite is a metalloid that attacks thiols, depletes glutathione,
and induces ROS formation, whereas t-BOOH is a stable lipid sol-
uble peroxide that attacks lipids and proteins. Perhaps the As-
induced genes represent a ‘simpler’ response to stress arising
from excess ROS or a need for glutathione-related defenses. We
speculate that the more complex t-BOOH response could addi-
tionally involve stress from phospholipid damage, or a global
response to lipophilic toxins. Further supporting the notion that
C. elegans stress responses are ‘tailored’, the list of gene groups
induced by acrylamide is very similar to our As list (GSTs, UGTs,
SDRs, glutathione metabolism), but also includes some distinct
categories (collagens, major sperm proteins) (Hasegawa et al.,
2008). Caenorhabditis elegans could prove to be valuable for
elucidating signals that lie upstream of different stress
responses, and the role of individual tissues in mobilizing these
signals and defending the organism against stress.
Our results demonstrate that SKN-1 plays a number of roles
besides inducing Phase 2 detoxification genes, and that multiple
factors influence its transcriptional output under normal and
stress conditions. It will now be important to delineate how its
regulation of detoxification and regulatory genes contributes to
the effects of SKN-1 on longevity under normal and reduced IIS
conditions, and to identify how SKN-1 acts in different tissues to
influence regulation of these genes at the organismal level.
Experimental procedures
Caenorhabditis elegans growth and RNAi for
microarray experiments
Caenorhabditis elegans were maintained on NGM and
Escherichia coli OP50 as described (Brenner, 1974). For
microarray experiments, a synchronous population of wild-
type (N2) animals was obtained by hypochlorite treatment of
embryos. Synchronized L1 larvae were placed at 20 �C on
E. coli HT115 that expressed either skn-1 or control dsRNA
for 46 h, until they reached the L4 stage. For As exposure,
worms were incubated for 30 min in 5 mM Sodium Arsenite
(Sigma-Aldrich, St. Louis, MO, USA) in M9 medium, or in
M9 alone. Worms were exposed to t-BOOH (12 mM; Sigma-
Aldrich) for 1 h on NGM plates, or incubated on NGM con-
trol plates. In each case, worms were then allowed to
recover for 1 h on OP50-seeded NGM plates. These stress
treatment conditions were established by titrating As or
t-BOOH concentrations and incubation times, and scoring for
induction of the SKN-1 target gene reporter gcs-1::GFP
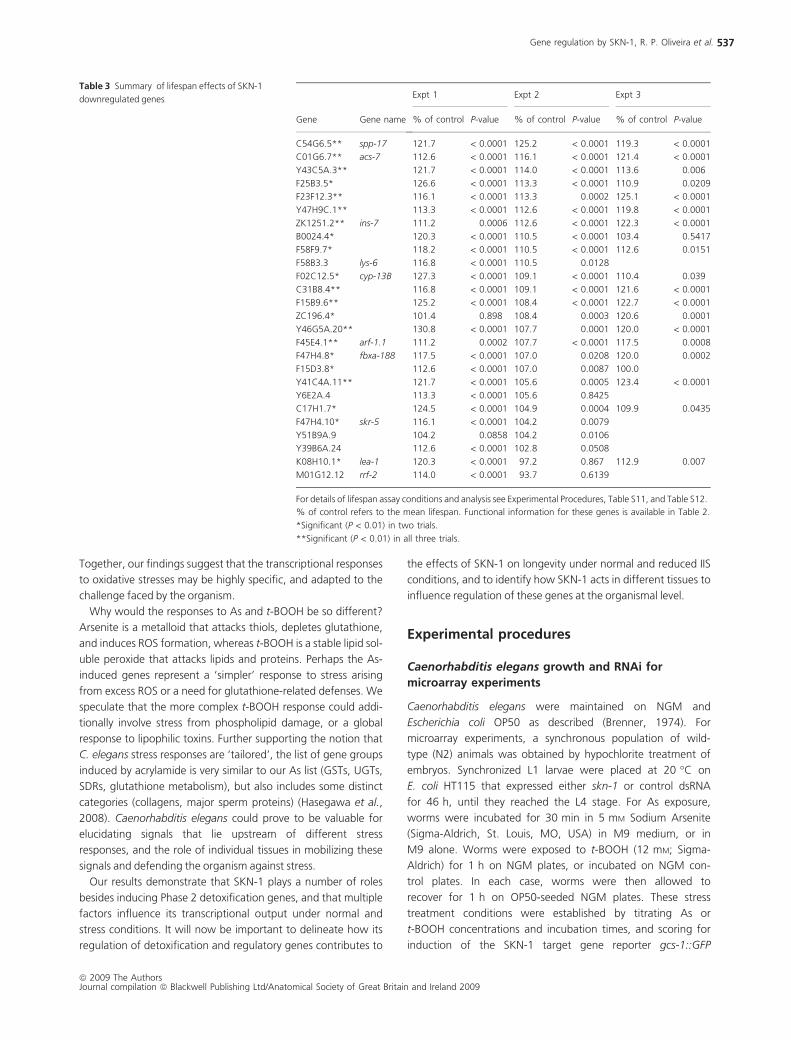
Table 3 Summary of lifespan effects of SKN-1
downregulated genes
Gene Gene name
Expt 1 Expt 2 Expt 3
% of control P-value % of control P-value % of control P-value
C54G6.5** spp-17 121.7 < 0.0001 125.2 < 0.0001 119.3 < 0.0001
C01G6.7** acs-7 112.6 < 0.0001 116.1 < 0.0001 121.4 < 0.0001
Y43C5A.3** 121.7 < 0.0001 114.0 < 0.0001 113.6 0.006
F25B3.5* 126.6 < 0.0001 113.3 < 0.0001 110.9 0.0209
F23F12.3** 116.1 < 0.0001 113.3 0.0002 125.1 < 0.0001
Y47H9C.1** 113.3 < 0.0001 112.6 < 0.0001 119.8 < 0.0001
ZK1251.2** ins-7 111.2 0.0006 112.6 < 0.0001 122.3 < 0.0001
B0024.4* 120.3 < 0.0001 110.5 < 0.0001 103.4 0.5417
F58F9.7* 118.2 < 0.0001 110.5 < 0.0001 112.6 0.0151
F58B3.3 lys-6 116.8 < 0.0001 110.5 0.0128
F02C12.5* cyp-13B 127.3 < 0.0001 109.1 < 0.0001 110.4 0.039
C31B8.4** 116.8 < 0.0001 109.1 < 0.0001 121.6 < 0.0001
F15B9.6** 125.2 < 0.0001 108.4 < 0.0001 122.7 < 0.0001
ZC196.4* 101.4 0.898 108.4 0.0003 120.6 0.0001
Y46G5A.20** 130.8 < 0.0001 107.7 0.0001 120.0 < 0.0001
F45E4.1** arf-1.1 111.2 0.0002 107.7 < 0.0001 117.5 0.0008
F47H4.8* fbxa-188 117.5 < 0.0001 107.0 0.0208 120.0 0.0002
F15D3.8* 112.6 < 0.0001 107.0 0.0087 100.0
Y41C4A.11** 121.7 < 0.0001 105.6 0.0005 123.4 < 0.0001
Y6E2A.4 113.3 < 0.0001 105.6 0.8425
C17H1.7* 124.5 < 0.0001 104.9 0.0004 109.9 0.0435
F47H4.10* skr-5 116.1 < 0.0001 104.2 0.0079
Y51B9A.9 104.2 0.0858 104.2 0.0106
Y39B6A.24 112.6 < 0.0001 102.8 0.0508
K08H10.1* lea-1 120.3 < 0.0001 97.2 0.867 112.9 0.007
M01G12.12 rrf-2 114.0 < 0.0001 93.7 0.6139
For details of lifespan assay conditions and analysis see Experimental Procedures, Table S11, and Table S12.
% of control refers to the mean lifespan. Functional information for these genes is available in Table 2.
*Significant (P < 0.01) in two trials.
**Significant (P < 0.01) in all three trials.
Gene regulation by SKN-1, R. P. Oliveira et al.
ª 2009 The AuthorsJournal compilation ª Blackwell Publishing Ltd/Anatomical Society of Great Britain and Ireland 2009
537
(Supporting Fig. S1) (An & Blackwell, 2003). Under the con-
ditions used for microarray analysis, this reporter was
induced robustly in the intestine, but for each stress tested
worms that appeared sick or dead were observed at only a
low frequency (0–5% across samples).
The skn-1 RNAi plasmid consisted of a full length SKN-1c iso-
form cDNA subcloned into pPD129.36 (gift of A. Fire). The con-
trol plasmid was pPD128.110 (gift of A. Fire) which contains the
GFP gene flanked by T7 promoters (Timmons et al., 2001). RNAi
was performed by feeding as described (Kamath & Ahringer,
2003).
RNA preparation and microarray data collection
For each microarray experiment, total RNA was isolated from
50 000 animals using Trizol (Invitrogen, Carlsbard, CA, USA).
cDNA was synthesized and linearly amplified from 325 ng RNA
using the Low RNA Input Linear Amplification Kit (Agilent, Santa
Clara, CA, USA), and labeled with Cy3- or Cy5-CTP (Perkin
Elmer, Waltham, MA, USA). A dye swap analysis was performed
for each set of biological replicate samples. Samples were frag-
mented according to Agilent protocols and hybridized overnight
at 60 �C to Agilent-015061: C. elegans oligonucleotide Micro-
array 4 · 44 arrays (covering 21 481 genes). Array scanning
was performed using a DNA Microarray Scanner (Agilent) at
5 lm resolution. The output image was processed by Feature
Extractor (Agilent) and normalized for dye bias by linear correc-
tion using rank consistent probes. Prior to hierarchical clustering,
values from spots on the microarray that represented the same
gene were averaged to a single value. Spots flagged by the Fea-
ture Extractor software as having red and green intensities well
above background were omitted. Finally, genes that did not
have an observed absolute value of 0.4 for the log(base2) ratio
of red ⁄ green intensities for at least one array were omitted, as
were any genes that lacked information for > 20% of the arrays.
After filtering, the remaining genes were submitted for down-
stream analysis. Raw microarray data will be available via
the Princeton University MicroaAray database: http://puma.
princeton.edu/.
Hierarchical clustering and SAM analysis
Average linkage gene clustering was performed with an uncen-
tered correlation similarity metric using Cluster (Eisen et al.,
1998; de Hoon et al., 2004). One-class analysis in SAM (Tusher
et al., 2001) was performed to identify genes that had statisti-
cally significant changes in expression regardless of the magni-
tude of change.
Promoter analysis
We analyzed up to 1.5 kb of intergenic sequence upstream of
SKN-1-regulated genes for the presence of novel regulatory ele-
ments. Sequence elements that were statistically over-repre-
sented in these regions were identified using Regulatory
Sequence Analysis Tools oligo-analysis (Thomas-Chollier et al.,
2008) and Weeder (Pavesi et al., 2004), in each case specifying
an oligonucleotide length of eight bases. We later searched
directly for these novel consensus elements and the consensus
in vitro SKN-1 binding site (Blackwell et al., 1994) within up to
2 kb of upstream intergenic sequences. WebLogo (Crooks et al.,
2004) was used to display consensus motifs.
Gene ontology analysis
WormBase gene names were converted to NCBI Protein Gene
Info (GI) numbers using WormMart (Schwarz et al., 2006),
then analyzed using DAVID (Dennis et al., 2003). Functional
clusters of SKN-1-regulated genes were identified using
DAVID’s Functional Annotational Clustering tool, with the
exception of the CUB-like domain genes and other annotated
open reading frames that lacked a GI entry. The Enrichment
Score was used to predict whether representation of a gene
group among SKN-1-regulated genes was biologically signifi-
cant. The Enrichment Score of a cluster of genes or GO terms
derives from the geometric mean (in negative log scale) of
the P-values for members of that cluster. If the geometric
mean of the P-values = 1e)10, then the Enrichment Score is
10. These P-values correspond to the probability that the
members of the cluster are present together randomly in the
gene list.
Lifespan analysis
In analyses of lifespan under normal conditions the first day of
adulthood was defined as t = 0, standard Kaplan–Meier survival
curves were generated from the data, and the log-rank (Mantel-
Cox) method was used to test the null hypothesis (StatView).
These analyses were performed using the RNAi-sensitive strain
rrf-3(pk1426) (Sijen et al., 2001). In two assays (Experiments 1
and 2), n > 100 worms (see Supporting Table S11 for n) were
transferred at L4 to 100 mm HGM plates (1 mM IPTG,
100 lg mL)1 carbenicillin, and 50 lM FUdR, 20 �C) that had
been inoculated with the indicated RNAi bacteria. Live ⁄ dead
counts were made approximately every other day. The experi-
ments were terminated upon contamination after approxi-
mately 3 weeks, and the surviving animals were censored from
the assay on that day. A third assay (Experiment 3) was also per-
formed using rrf-3(pk1426) worms at 20 �C, but in this case,
�75 eggs (see Supporting Table S11c for n) were transferred
onto 6 · 60 mm NG plates (1 mM IPTG, 100 lg mL)1 carbeni-
cillin) that had been inoculated with the indicated RNAi bacteria.
Worms were transferred to fresh RNAi plates every 4 days, and
animals that were missing, exploded, or bagged were censored
from the data on the day of the event.
Stress resistance assays
For stress assays, N2 or rrf-3(pk1426) worms that had been
arrested at L1 were grown for 48–55 h at 20 �C on either
Gene regulation by SKN-1, R. P. Oliveira et al.
ª 2009 The AuthorsJournal compilation ª Blackwell Publishing Ltd/Anatomical Society of Great Britain and Ireland 2009
538

RNAi or control bacteria. RNAi clones were obtained from
published libraries (Kamath & Ahringer, 2003; Rual et al.,
2004). RNAi was performed essentially according to Protocol
2 in (Kamath et al., 2000). Worms were then placed in 4 or
5 mM Sodium Arsenite (in M9) and periodically tested for
survival, with three to six wells of ‡ 10 worms each examined
in each experimental measurement. Worms were prodded
with a platinum wire and scored as dead if they displayed no
pharyngeal pumping or movement. Control wells of M9
always displayed 100% survival for all time points examined.
The assays represented in Fig. S3 (Supporting information)
were carried out on NGM agar plates containing either As or
t-BOOH.
qRT-PCR
Stress- and control-treated worms were collected as for the
microarray analysis samples. RNA was isolated and purified
using Tri Reagent (Sigma). cDNA was synthesized using
Superscript III Reverse Transcriptase (Invitrogen). SYBR
GreenR (Invitrogen) real time PCR was performed in an ABI
7700 machine in duplicate and the data was analyzed using
the comparative Ct method with the exception of data in
Fig. S3b (Supporting information), which were analyzed by
normalization to a standard curve. Relative mRNA levels
were normalized to act-1 mRNA levels, and calculated
from at least three biological replicates. Primers were
designed to be intron-spanning, with sequences available
upon request.
Acknowledgments
We thank Elizabeth Veal and Blackwell lab members for critically
reading this manuscript, and Joe Baker and Aileen Zhen for early
contributions to the study. Supported by a Kirchstein fellowship
to RO (GM70088), training grant funding to RO and JPA
(DK07260), NIH grant GM62891 to TKB, Pew Biomedical Scho-
lar and Sloan Fellow funding to CTM, and an NSF Predoctoral
fellowship to JL. Some nematode strains used in this work were
provided by the Caenorhabditis Genetics Center, which is
funded by the NIH National Center for Research Resources
(NCRR).
Note added in proof
While this manuscript was under review, it was reported
online that skn-1 is required for a substantial proportion of
the transcriptional response to hyperbaric oxygen (Park SK,
Tedesco PM, and Johnson TE, Aging Cell, Accepted Article).
Several of these potential SKN-1 target genes overlapped with
those identified here. A contemporaneous study identified
many of our SKN-1-dependent genes as being induced in an
age-dependent manner by the oxygen-generating stressor
juglone (Pryzbysz, et al., Mech. Aging Dev. (2009) 130, 357–
369).
Author contributions
Conceived and designed the experiments: RPO, JPA, KD, CTM,
TKB. Performed the experiments: RPO, JPA, KD, JL, JA. Analyzed
the data: RPO, JPA, KD, JL, CTM, TKB. Wrote the paper: RPO,
JPA, CTM, TKB.
References
An JH, Blackwell TK (2003) SKN-1 links C. elegans mesendodermal
specification to a conserved oxidative stress response. Genes Dev.
17, 1882–1893.
An JH, Vranas K, Lucke M, Inoue H, Hisamoto N, Matsumoto K, Black-
well TK (2005) Regulation of the Caenorhabditis elegans oxidative
stress defense protein SKN-1 by glycogen synthase kinase-3. Proc.
Natl. Acad. Sci. USA 102, 16275–16280.
Banerjee R, Zou CG (2005) Redox regulation and reaction mechanism
of human cystathionine-beta-synthase: a PLP-dependent hemesensor
protein. Arch. Biochem. Biophys. 433, 144–156.
Bishop NA, Guarente L (2007a) Genetic links between diet and life-
span: shared mechanisms from yeast to humans. Nat. Rev. Genet.
8, 835–844.
Bishop NA, Guarente L (2007b) Two neurons mediate diet-restriction-
induced longevity in C. elegans. Nature 447, 545–549.
Blackwell TK, Bowerman B, Priess JR, Weintraub H (1994) Formation
of a monomeric DNA binding domain by Skn-1 bZIP and homeodo-
main elements. Science 266, 621–628.
Blanc G, Font B, Eichenberger D, Moreau C, Ricard-Blum S, Hulmes DJ,
Moali C (2007) Insights into how CUB domains can exert specific
functions while sharing a common fold: conserved and specific
features of the CUB1 domain contribute to the molecular basis of pro-
collagen C-proteinase enhancer-1 activity. J. Biol. Chem. 282, 16924–
16933.
Brenner S (1974) The genetics of Caenorhabditis elegans. Genetics 77,
71–94.
Browne J, Tunnacliffe A, Burnell A (2002) Anhydrobiosis: plant desic-
cation gene found in a nematode. Nature 416, 38.
Crooks GE, Hon G, Chandonia JM, Brenner SE (2004) WebLogo: a
sequence logo generator. Genome Res. 14, 1188–1190.
Dennis G Jr, Sherman BT, Hosack DA, Yang J, Gao W, Lane HC, Lem-
picki RA (2003) DAVID: database for annotation, visualization, and
integrated discovery. Genome Biol. 4, P3.
Dong MQ, Venable JD, Au N, Xu T, Park SK, Cociorva D, Johnson JR,
Dillin A, Yates JR III (2007) Quantitative mass spectrometry identifies
insulin signaling targets in C. elegans. Science 317, 660–663.
Droge W (2002) Free radicals in the physiological control of cell func-
tion. Physiol. Rev. 82, 47–95.
Eisen MB, Spellman PT, Brown PO, Botstein D (1998) Cluster analysis
and display of genome-wide expression patterns. Proc. Natl. Acad.
Sci. USA 95, 14863–14868.
Guarente L (2007) Sirtuins in aging and disease. Cold Spring Harb.
Symp. Quant. Biol. 72, 483–488.
Hasegawa K, Miwa S, Isomura K, Tsutsumiuchi K, Taniguchi H, Miwa
J (2008) Acrylamide-responsive genes in the nematode Caenorhabd-
itis elegans. Toxicol Sci. 101, 215–225.
Hertweck M, Gobel C, Baumeister R (2004) C. elegans SGK-1 is the
critical component in the Akt ⁄ PKB kinase complex to control stress
response and life span. Dev Cell. 6, 577–588.
de Hoon MJ, Imoto S, Nolan J, Miyano S (2004) Open source cluster-
ing software. Bioinformatics 20, 1453–1454.
Gene regulation by SKN-1, R. P. Oliveira et al.
ª 2009 The AuthorsJournal compilation ª Blackwell Publishing Ltd/Anatomical Society of Great Britain and Ireland 2009
539
Hughes MF (2002) Arsenic toxicity and potential mechanisms of
action. Toxicol. Lett. 133, 1–16.
Inoue H, Hisamoto N, An JH, Oliveira RP, Nishida E, Blackwell TK, Mat-
sumoto K (2005) The C. elegans p38 MAPK pathway regulates
nuclear localization of the transcription factor SKN-1 in oxidative
stress response. Genes Dev. 19, 2278–2283.
Jasper H (2008) SKNy worms and long life. Cell 132, 915–916.
Kahn NW, Rea SL, Moyle S, Kell A, Johnson TE (2008) Proteasomal
dysfunction activates the transcription factor SKN-1 and produces a
selective oxidative-stress response in Caenorhabditis elegans. Bio-
chem. J. 409, 205–213.
Kamath RS, Ahringer J (2003) Genome-wide RNAi screening in Ca-
enorhabditis elegans. Methods 30, 313–321.
Kamath RS, Martinez-Campos M, Zipperlen P, Fraser AG, Ahringer J
(2000) Effectiveness of specific RNA-mediated interference through
ingested double-stranded RNA in Caenorhabditis elegans. Genome
Biol. 2, research0002.1–0002.10.
Kaplan J, De Domenico I, Ward DM (2008) Chediak-Higashi syndrome.
Curr. Opin. Hematol. 15, 22–29.
Kenyon C (2005) The plasticity of aging: insights from long-lived
mutants. Cell 120, 449–460.
Kenyon C, Murphy CT (2006) Enrichment of regulatory motifs
upstream of predicted DAF-16 targets. Nat. Genet. 38, 397–398;
author reply 398.
Kobayashi M, Yamamoto M (2006) Nrf2-Keap1 regulation of cellular
defense mechanisms against electrophiles and reactive oxygen spe-
cies. Adv. Enzyme Regul. 46, 113–140.
Kophengnavong T, Carroll AS, Blackwell TK (1999) The SKN-1 amino
terminal arm is a DNA specificity segment. Mol. Cell. Biol. 19,
3039–3050.
Kubagawa HM, Watts JL, Corrigan C, Edmonds JW, Sztul E, Browse J,
Miller MA (2006) Oocyte signals derived from polyunsaturated fatty
acids control sperm recruitment in vivo. Nat. Cell Biol. 8, 1143–
1148.
Kwak MK, Wakabayashi N, Itoh K, Motohashi H, Yamamoto M, Kens-
ler TW (2003) Modulation of gene expression by cancer chemopre-
ventive dithiolethiones through the Keap1-Nrf2 pathway.
Identification of novel gene clusters for cell survival. J. Biol. Chem.
278, 8135–8145.
Lee JM, Calkins MJ, Chan K, Kan YW, Johnson JA (2003a) Identification
of the NF-E2-related factor-2-dependent genes conferring protection
against oxidative stress in primary cortical astrocytes using oligonu-
cleotide microarray analysis. J. Biol. Chem. 278, 12029–12038.
Lee SS, Kennedy S, Tolonen AC, Ruvkun G (2003b) DAF-16 target
genes that control C. elegans life-span and metabolism. Science
300, 644–647.
Leung L, Kwong M, Hou S, Lee C, Chan JY (2003) Deficiency of the
Nrf1 and Nrf2 transcription factors results in early embryonic lethal-
ity and severe oxidative stress. J. Biol. Chem. 278, 48021–48029.
Lithgow GJ, Walker GA (2002) Stress resistance as a determinate of
C. elegans lifespan. Mech. Ageing Dev. 123, 765–771.
Mathews WR, Guido DM, Fisher MA, Jaeschke H (1994) Lipid peroxi-
dation as molecular mechanism of liver cell injury during reperfusion
after ischemia. Free Radic. Biol. Med. 16, 763–770.
McElwee JJ, Schuster E, Blanc E, Piper MD, Thomas JH, Patel DS,
Selman C, Withers DJ, Thornton JM, Partridge L, Gems D (2007)
Evolutionary conservation of regulated longevity assurance mecha-
nisms. Genome Biol. 8, R132.
Murphy CT, McCarroll SA, Bargmann CI, Fraser A, Kamath RS,
Ahringer J, Li H, Kenyon C (2003) Genes that act downstream of
DAF-16 to influence the lifespan of Caenorhabditis elegans. Nature
424, 277–283.
Murphy CT, Lee SJ, Kenyon C (2007) Tissue entrainment by feedback
regulation of insulin gene expression in the endoderm of Caenor-
habditis elegans. Proc. Natl. Acad. Sci. USA 104, 19046–19050.
Nguyen T, Sherratt PJ, Pickett CB (2003) Regulatory mechanisms
controlling gene expression mediated by the antioxidant response
element. Annu. Rev. Pharmacol. Toxicol. 43, 233–260.
Oh SW, Mukhopadhyay A, Dixit BL, Raha T, Green MR, Tissenbaum
HA (2006) Identification of direct DAF-16 targets controlling longev-
ity, metabolism and diapause by chromatin immunoprecipitation.
Nat. Genet. 38, 251–257.
Olahova M, Taylor SR, Khazaipoul S, Wang J, Morgan BA, Matsumoto
K, Blackwell TK, Veal EA (2008) A redox-sensitive peroxiredoxin that
is important for longevity has tissue- and stress-specific roles in
stress resistance. Proc. Natl. Acad. Sci. USA 105, 19839–19844.
Paradis S, Ruvkun G (1998) Caenorhabditis elegans Akt ⁄ PKB transdu-
ces insulin receptor-like signals from AGE-1 PI3 kinase to the DAF-
16 transcription factor. Genes Dev. 12, 2488–2498.
Pavesi G, Mereghetti P, Mauri G, Pesole G (2004) Weeder Web: dis-
covery of transcription factor binding sites in a set of sequences
from co-regulated genes. Nucleic Acids Res. 32, W199–W203.
Rual JF, Ceron J, Koreth J, Hao T, Nicot AS, Hirozane-Kishikawa T,
Vandenhaute J, Orkin SH, Hill DE, van den Heuvel S, Vidal M (2004)
Toward improving Caenorhabditis elegans phenome mapping with
an ORFeome-based RNAi library. Genome Res. 14, 2162–2168.
Rupert PB, Daughdrill GW, Bowerman B, Matthews BW (1998) The
binding domain of Skn-1 in complex with DNA: a new DNA-binding
motif. Nat. Struct. Biol. 5, 484–491.
Samuelson AV, Carr CE, Ruvkun G (2007) Gene activities that mediate
increased life span of C. elegans insulin-like signaling mutants.
Genes Dev. 21, 2976–2994.
Sarkadi B, Homolya L, Szakacs G, Varadi A (2006) Human multidrug
resistance ABCB and ABCG transporters: participation in a che-
moimmunity defense system. Physiol. Rev. 86, 1179–1236.
Schwarz EM, Antoshechkin I, Bastiani C, Bieri T, Blasiar D, Canaran P,
Chan J, Chen N, Chen WJ, Davis P, Fiedler TJ, Girard L, Harris TW,
Kenny EE, Kishore R, Lawson D, Lee R, Muller HM, Nakamura C, Ozer-
sky P, Petcherski A, Rogers A, Spooner W, Tuli MA, Van Auken K,
Wang D, Durbin R, Spieth J, Stein LD, Sternberg PW (2006) WormBase:
better software, richer content. Nucleic Acids Res. 34, D475–D478.
Sijen T, Fleenor J, Simmer F, Thijssen KL, Parrish S, Timmons L, Plasterk
RH, Fire A (2001) On the role of RNA amplification in dsRNA-trig-
gered gene silencing. Cell 107, 465–476.
Taubert S, Van Gilst MR, Hansen M, Yamamoto KR (2006) A Mediator
subunit, MDT-15, integrates regulation of fatty acid metabolism by
NHR-49-dependent and -independent pathways in C. elegans.
Genes Dev. 20, 1137–1149.
Taubert S, Hansen M, Van Gilst MR, Cooper SB, Yamamoto KR (2008)
The Mediator subunit MDT-15 confers metabolic adaptation to
ingested material. PLoS Genet. 4, e1000021.
Thakur JK, Arthanari H, Yang F, Pan SJ, Fan X, Breger J, Frueh DP,
Gulshan K, Li DK, Mylonakis E, Struhl K, Moye-Rowley WS, Cor-
mack BP, Wagner G, Naar AM (2008) A nuclear receptor-like path-
way regulating multidrug resistance in fungi. Nature 452, 604–609.
Thomas-Chollier M, Sand O, Turatsinze JV, Janky R, Defrance M, Ver-
visch E, Brohee S, van Helden J (2008) RSAT: regulatory sequence
analysis tools. Nucleic Acids Res. 36, W119–W127.
Timmons L, Court DL, Fire A (2001) Ingestion of bacterially expressed
dsRNAs can produce specific and potent genetic interference in Ca-
enorhabditis elegans. Gene 263, 103–112.
Troemel ER, Chu SW, Reinke V, Lee SS, Ausubel FM, Kim DH (2006)
p38 MAPK regulates expression of immune response genes and
contributes to longevity in C. elegans. PLoS Genet. 2, e183.
Gene regulation by SKN-1, R. P. Oliveira et al.
ª 2009 The AuthorsJournal compilation ª Blackwell Publishing Ltd/Anatomical Society of Great Britain and Ireland 2009
540
Tullet JM, Hertweck M, An JH, Baker J, Hwang JY, Liu S, Oliveira RP,
Baumeister R, Blackwell TK (2008) Direct inhibition of the longevity-
promoting factor SKN-1 by insulin-like signaling in C. elegans. Cell
132, 1025–1038.
Tusher VG, Tibshirani R, Chu G (2001) Significance analysis of micro-
arrays applied to the ionizing radiation response. Proc. Natl. Acad.
Sci. USA 98, 5116–5121.
Vatamaniuk OK, Bucher EA, Sundaram MV, Rea PA (2005) CeHMT-1,
a putative phytochelatin transporter, is required for cadmium toler-
ance in Caenorhabditis elegans. J. Biol. Chem. 280, 23684–23690.
Walker AK, See R, Batchelder C, Kophengnavong T, Gronniger JT, Shi
Y, Blackwell TK (2000) A conserved transcription motif suggesting
functional parallels between C. elegans SKN-1 and Cap ‘n’ Collar-
related bZIP proteins. J. Biol. Chem. 275, 22166–22171.
Xu C, Li CY, Kong AN (2005) Induction of phase I, II and III drug
metabolism ⁄ transport by xenobiotics. Arch. Pharm. Res. 28, 249–
268.
Yang F, Vought BW, Satterlee JS, Walker AK, Jim Sun ZY, Watts JL,
Debeaumont R, Mako Saito R, Hyberts SG, Yang S, Macol C, Iyer L,
Tjian R, van den Heuvel S, Hart AC, Wagner G, Naar AM (2006) An
ARC ⁄ Mediator subunit required for SREBP control of cholesterol and
lipid homeostasis. Nature 442, 700–704.
Yigit E, Batista PJ, Bei Y, Pang KM, Chen CC, Tolia NH, Joshua-Tor L,
Mitani S, Simard MJ, Mello CC (2006) Analysis of the C. elegans
Argonaute family reveals that distinct Argonautes act sequentially
during RNAi. Cell 127, 747–757.
You YJ, Kim J, Raizen DM, Avery L (2008) Insulin, cGMP, and TGF-
beta signals regulate food intake and quiescence in C. elegans: a
model for satiety. Cell Metab. 7, 249–257.
Supporting Information
Additional Supporting Information may be found in the online
version of this article:
Fig. S1 Induction of the SKN-1 target gcs-1 promoter by As and
t-BOOH.
Fig. S2 Motif occurrence in SKN-1-regulated gene promoters.
Fig. S3 Stress responses are specific to stress type.
Fig. S4 qRT-PCR analysis of t-BOOH-induced genes.
Fig. S5 Increased oxidative stress resistance after inhibition of
SKN-1-downregulated genes.
Table S1 Genes upregulated by SKN-1 under normal condi-
tions.
Table S2 Genes downregulated by SKN-1 under normal conditions.
Table S3 qRT-PCR analysis of genes upregulated by SKN-1
under normal conditions.
Table S4 qRT-PCR analysis of genes downregulated by SKN-1
under normal conditions.
Table S5 Genes upregulated by SKN-1 and As stress.
Table S6 qRT-PCR results for SKN-1-dependent and-indepen-
dent stress responsive genes.
Table S7 Genes upregulated by SKN-1 independently of As
treatment.
Table S8 Genes upregulated by SKN-1 under t-BOOH stress.
Table S9 Genes upregulated by t-BOOH (SKN-1-independent).
Table S10 Genes downregulated by t-BOOH (SKN-1-indepen-
dent).
Table S11 (a) Lifespan effects of SKN-1-downregulated genes
(Experiment 1); (b) lifespan effects of SKN-1-downregulated
genes (Experiment 2); (c) Lifespan effects of SKN-1-downregu-
lated genes (Experiment 3).
Table S12 Counting and censoring data for lifespan experi-
ments 1 and 2.
As a service to our authors and readers, this journal provides
supporting information supplied by the authors. Such materials
are peer-reviewed and may be re-organized for online delivery,
but are not copy-edited or typeset. Technical support issues aris-
ing from supporting information (other than missing files)
should be addressed to the authors.
Gene regulation by SKN-1, R. P. Oliveira et al.
ª 2009 The AuthorsJournal compilation ª Blackwell Publishing Ltd/Anatomical Society of Great Britain and Ireland 2009
541


