
1
14/6-2005
Conditional aid effectiveness A meta study
Hristos Doucouliagos Department of Accounting,
Economics and Finance
Deakin University
Melbourne
Australia
and Martin Paldam Department of Economics
University of Aarhus
Aarhus
Denmark
Abstract:
The AEL (aid effectiveness literature) studies the effect of development aid using econome-
trics on macro data. It contains about 100 papers of which a third analyzes conditional
models where aid effectiveness depends upon z, so that aid only works for a certain range of
the variable. The key term in this family of AEL models is thus an interaction term of z times
aid. The leading candidates for z are a good policy index and aid itself. In this paper, meta-
analysis techniques are used (i) to determine whether the AEL has established the said
interaction terms, and (ii) to identify some of the determinants of the differences in results
between studies. Taking all available studies in consideration, we find no support for
conditionality with respect to policy, while conditionality regarding aid itself is dubious.
However, the results differ depending on the authors’ institutional affiliation.
JEL.: B2, F35, O35
Keywords: Aid effectiveness, meta study, economic growth, policy conditionality
Acknowledgements: Our cooperation was supported by the Aarhus University Research Foundation. Pia Wich-
mann Christensen has been a very competent research assistant. This paper benefited from ideas and comments
from Peter Sandholt Jensen and Mehmet Ulubasoglu.
2
1. Introduction: An important puzzle
Development aid is meant to contribute to the economic development of the recipient country.
However, raw macro data show no relation between the share of development aid and econo-
mic growth in the recipient country.1 This is even more puzzling as the amount, magnitudes
and variability of the data should make them ideal for this kind of research. Research is often
driven by puzzles, and it has certainly generated a large AEL, Aid Effectiveness Literature.
Figure 1 overleaf divides the AEL into three families of studies. We analyze each family in a
seperate paper, of which this is one.
Many researchers claim that the impact of aid is unconditionally good for growth, bad
for growth, or has no clear effect. The research considered here argues that the effect of aid is
conditional. One group argues that aid is effective conditional on good policy; another that aid
is effective conditional on the level of aid. Still others argue that institutional conditions
determine aid effectiveness. All these conflicting positions have empirical support, so it is
difficult to identify the true aid-growth association. In addition to the puzzle, the AEL is also
driven by the great importance of the underlying policy issue. Mass poverty in the LDC world
is surely a huge problem. Many in the West are concerned about effective development
strategies, and in particular about what they can do to assist development.
Existing reviews of the AEL are all partial. They are not quantitative, but largely sub-
jective qualitative reviews, and as such are vulnerable to “causal methodological speculation”
(Stanley 2001). Accordingly, the aim of this paper is to review all available evidence drawn
from the published and unpublished conditionality studies. We use meta-analysis on these
studies to conduct a quantitative review. Specifically, we ask whether the available evidence
supports the notion of conditionality with respect to policy. We also ask whether the conflict-
ing results are due to the way studies are conducted, and whether the results are dependent on
the interests of those who conduct them.
Section 2 classifies the AEL and discusses the theory of the conditionality family of
models. Meta-analysis is used in section 3 to determine if the key effects of the two main
conditionality models have been established, and in section 4 to explain the differences in
reported results. Section 5 summarizes the sad findings of the paper. Appendix 1 is an intro-
duction to meta techniques, especially to the tests used. Appendix 2 lists the AEL.
1. See estimates in Herbertsson and Paldam (2005) and Doucouliagos and Paldam (2005c).

3
2. From aid effectiveness to conditional aid effectiveness
A thorough search produced the 97 AEL papers listed in Appendix 2.2 We have divided the
models of the papers into 3 families, depending on the causal structure analyzed, as given in
figure 1. Half the papers bring models from more than one family.
Figure 1. The causal structure in the three families of AEL models
A: 43 papers contain accumulation estimates of the impact of aid on either savings or
investment. They are marked as type (s) and (i) in Appendix 2. These models are
covered in Doucouliagos and Paldam (2005a) that shows that aid has an unclear effect
on accumulation.
B: 68 papers contain a total of 543 direct estimates, using reduced form models of the
effect of aid on growth. They are marked as type (g) in Appendix 2. They are covered in
Doucouliagos and Paldam (2005b), which shows that the 543 estimates of the direct
effect of aid on growth reported scatter considerably, and add up to a small positive, but
not statistically significant effect on growth.
C: 31 papers contain conditional estimates, where the effect of aid on growth depends
upon a third factor z, so that if z is favorable, the result is growth, and vice versa if z is
2. Extensive searches of Econlit, Proquest, Web of Science and Google were undertaken, from which we could track citations backward. Papers available only after 1st of January 2005 are not included.

4
unfavorable. These studies are marked as type (c) in Appendix 2. This is the family
analyzed in this paper.
Historically, the AEL was started in the early 1970s by papers in the A-group. The early
studies found no effect of aid on accumulation, and the AEL then moved on to the B-group
papers, where most of the research in the 1980s and 1990s was done.
The AEL has published 1025 regressions. To reach these regressions many more have
been made. The number of regressions on which the AEL is based is surely much larger than
the amount of data for aid and growth available. We have concentrated the discussion of the
resulting data mining in Doucouliagos and Paldam (2005c), see however Appendix 1 on the
statistics used.
2.1 Conditional aid effectiveness
In the late 1990s two new developments came about. One was the appearance of a new EDA
data set for aid (Chang, Fernandez-Arias and Serven 1998), which reduced the standard ODA
data to the gift equivalent.3 This was a promising new development, but we find that it does
not affect the results of the studies as the two data sets are highly correlated.
The other development was that the C-family of models appeared, using the new data.
The C-group of studies is the newest family, as nearly all 31 papers were written within the
last 10 years. The list is still growing, and there are more publications in the field in 2004 than
any other year.4 Thus, our study is a snapshot of a wave that is still rolling.
The C-family of studies is based on the idea that aid ineffectiveness may be due to aid
having a positive effect on growth in some countries and a negative effect in others, so that
aid is conditionally effective. Till now, three conditions have been proposed, leading to three
models, of which two have an institutional home.5
(x1) Good Policy Model: Aid works if the recipient country pursues good polices, and is
harmful in countries pursuing bad policies. The Good Policy Model was proposed
initially by Burnside and Dollar (2000) from the World Bank. The working paper
3. The EDA data cover fewer years and countries than the ODA set, and therefore the competition between the new models came to take place on about 1/3 of the available data. However, very little changes if the ODA data for the same years and countries are used. 4. The first paper in the AEL is from 1968, and since then there has been a significant upward trend. The conditional family started in 1995, and has dominated the AEL since 1999. 5. The term institutional home is used in the sense that the models are proposed by research financed by a specific institution, which contributes to making the model known. Also, in both cases the model is broadly consistent with the thinking and policies of the institution.

5
version appeared in 1995, and it was popularized in World Bank (1998). The
institutional home of the model is thus the World Bank.
The model has been analyzed in 22 more papers: Svensson (1999); Hansen and Tarp (2000;
2001); Collier and Dehn (2001); Dalgaard and Hansen (2001); Guillaumont and Chauvet
(2001); Hudson and Mosley (2001); Lensink and White (2001); Lu and Ram (2001); Collier
and Dollar (2002); Brumm (2003); Dayton-Johnson and Hoddinott (2003); Burnside and
Dollar (2004); Chauvet and Guillaumont (2004); Collier and Hoeffler (2004); Dalgaard,
Hansen and Tarp (2004); Denkabe (2004); Easterly, Levine and Roodman (2004); Jensen and
Paldam (2004); Ram (2004); Roodman (2004); and Shukralla (2004).
(x2) Medicine model: Aid works if given in moderation, and harms if taken in excess, just
like most medicine. This model was first proposed by Hadjimichael, Ghura, Mühl-
eisen, Nord and Ucer (1995), but it has mainly been developed and publicized by the
DERG (Development Economics Research Group) at Copenhagen University. The
group, which includes Tarp, Dalgaard and Hansen (see below), is financed by Danida
(Danish Development Aid Agency). The model was popularized by a special grant to
Tarp and Hjertholm (2000), and its institutional home is thus Danida.
This model has been further analyzed in 14 papers: Durbarry, Gemmell and Greenaway
(1998); Hansen and Tarp (2000; 2001); Dalgaard and Hansen (2001); Hudson and Mosley
(2001); Lensink and White (2001); Collier and Dollar (2002); Gomanee, Girma and Morrisey
(2002); Denkabe (2003); Moreira (2003); Ovaska (2003); Collier and Hoeffler (2004);
Dalgaard, Hansen and Tarp (2004); Jensen and Paldam (2004).
(x3) Institutions models: A residual of 10 papers contains models that condition for various
institutions: Two studies link aid with GDP (Bowen 1995; Svensson 1999); two
papers condition for democracy (Svensson 1999; Kosack 2002); one for external
vulnerability (Guillaumont and Chauvet 2001); two for quality of institutions (Collier
and Dehn 2001; Collier and Dollar 2002); one for trade openness (Teboul and
Moustier 2001); and one for economic freedom (Brumm 2003). Finally one condition
for political instability (Chauvet and Guillaumont 2004).
Note that several of the papers listed appear in two groups. While future development may be
within the institutional models, it is certainly the two first models that have led to a stream of

6
papers, in particular the Good Policy Model, which has dominated the macroeconomic aid
discussion since 1995.
2.2 The two main models
Figure 2 shows the funnel-like distribution of the raw aid growth data for 156 LDCs (based on
Paldam 2004). The two gray curves give the outer bounds for 95% of the observations. There
are some wild outliers, such as the “stars” far outside the bounds.
Figure 2. Interpreting the data to get positive aid effectiveness
To find positive aid effectiveness, the conditional studies thus have to give the A1 and A3
areas a separate explanation, and disregard some of the outliers (the black stars).
Both the Good Policy Model and the Medicine Model may be seen as attempts to
single out parts of the two areas A1 and A3. Good Policy generates growth, so the Good
Policy Model explains A1 by a separate term, while aid squared explains A3 by a separate
term. Thus in both cases one may get a nice coefficient to aid.
In both models itg is the real growth rate, and ith is the aid share. The j controls, ,jitx are
the “nuisance” part of the model, and itu are the residuals. Greek letters are the coefficients
estimated. The two indices are i for countries and t for time.

7
The Good Policy Model (from Burnside and Dollar 2000) has 2 equations. The Good
Policy Index, zit is a weighted sum of, e.g., the budget balance, ,itB the inflation rate, ,itp and
trade openness, ,itT while (2) is the aid effectiveness relation.
(1) 0 1 2 3it it it itz B p Tλ λ λ λ= + + + Good Policy Index6
(2) it it it it it jit jit itg h z z h uα µ δ ω= + + + + +γ x Aid Effectiveness Relation
In the original findings µ is insignificant, while both and δ ω are positive and significant.7
The coefficients for the Good Policy Index, z, is scaled (estimated), so it is fairly sym-
metrical around zero for the countries considered, and z is outcome oriented, so it is not sur-
prising thatδ becomes significant and positive. What is non-trivial is that the interacted vari-
able it itz h produces a significantly positive coefficient, ω. It means that aid to a country that
pursues good policies increases growth, which is already high due to the good policies. Aid to
a country with bad policies decreases growth, which is already low due to the bad policies.
Obviously, the policy implications are that aid should be given to countries pursuing good
policies only. It is cruel to give aid to countries pursuing bad policies.
Thus, in the Good Policy Model, the crucial coefficient is ω to the interactive term.
However, also the coefficient to aid, µ, matters, as it shifts the relation up or down: If µ is
large and positive, aid may be preferable to no aid, even in countries with bad policies, and
reversely, if µ is negative, no aid may be preferable even in countries with good policies. Aid
effectiveness thus depends upon both coefficients µ and ω.
The Medicine Model (3) uses aid itself as the condition:
(3) 2 ( )it it it jit jit it it jit jit itg h h u h uα µ ω α φ= + + + + = + + +γ γx x
The proponents of the model find that µ > 0 and ω < 0. The size and robustness of both µ and
ω, are important for this model. The function, ( ),ithφ shows the excess growth due to aid. It
looks like drawn on figure 3, with a symmetrical positive section between zero and 2Ω.
Two policy conclusions from the model are that aid is optimal at h = Ω, where excess
growth is gΩ. (1) Aid should not exceed Ω. In fact, aid should not exceed Ωε, where ε is a
measure of marginal costs to the donor. The model also says that marginal aid effectiveness, 6. In Burnside and Dollar (2000): 0 1 2 31.28, 6.85, 1.20 and 2.16.λ λ λ λ= = = − = 7. Some studies estimate more general specifications that include squared aid, and aid policy and squared aid policy interactions, but the essence of the model is captured in equation 2.

8
/ 2 ,g h hµ ω∂ ∂ = + is highest at zero and falls to zero in Ω. (2) Consequently aid shares should
be as equal as possible for all recipients. This is against the policy of poverty orientation of
many donors, which demands that aid should be disproportionaly given to the poor.
Figure 3. The form of the quadratic aid effectiveness function
Both models thus have two substantial coefficients: µ to aid and ω to the interacted term.
Proponents of the Good Policy Model claim that µ ≈ 0 and ω > 0. Proponents of the Medicine
Model claim the µ > 0 and ω < 0.
3. Are the substantial terms of the models established?
In order to make sense of the many conflicting results of the AEL, we use the tools of the
rapidly emerging field of meta-analysis, see Appendix 1. The method is developed for two
purposes: (P1) To determine if an empirical literature has established certain facts. In the case
of the present study we want to know what the AEL says about the size of the two key
coefficients, µ and ω, of the two main models. (P2) To study if the variation in the estimates
can be explained by methodological differences of the studies, or – at a different level – by
priors of the authors, that is prior expectations about the underlying population parameters.
The present section considers (P1), while section 4 turns to (P2).
By methodological differences we mean: (a) differences in models, notably in control
variables included; (b) differences in the data samples on which models are estimated;8 and
(c) differences in regression techniques used for the estimation.
8. Aid started in the early 1960s. It has accumulated with 100-150 observations since the mid 1970.
9
The many methodological possibilities offer the researcher a large number of choices.
It is possible that all these choices are made only to seek the truth, but few researchers are
likely to be so pure. Researchers are commonly guided by prior beliefs,9 expectations or inter-
ests. Some researchers may even systematically seek a confirmation of a prior. In addition to
interests, priors may be due to history or institutional nearness – once an author or his group
has presented a certain result, a prior has been generated. Studies may thus have biases due to
priors (see Doucouliagos and Laroche 2003). Meta-analysis allows us to explore whether
differences between studies are biases.10
3.1 Data and methods of analysis
The 31 studies listed above are the raw data of the meta-analysis. From these data we derive
two data sets: The best-set of the 31 regressions presented by the author(s) of the 31 papers as
its best regression. It is not always clear what is the authors’ preferred estimate, so we have
sometimes had to assess. The second set is the all-set of all 162 regressions reported for the
Good Policy Model and 85 for the Medicine Model. This increases the data available for tests,
but it gives some interdependence between data points.
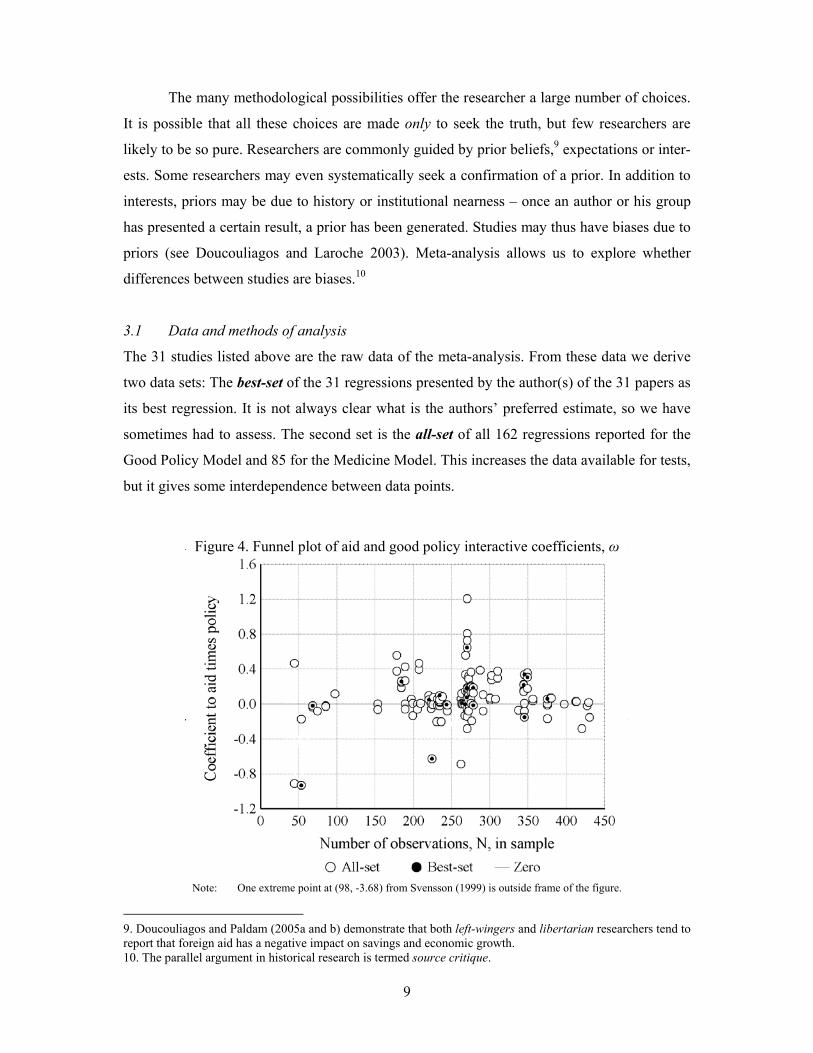
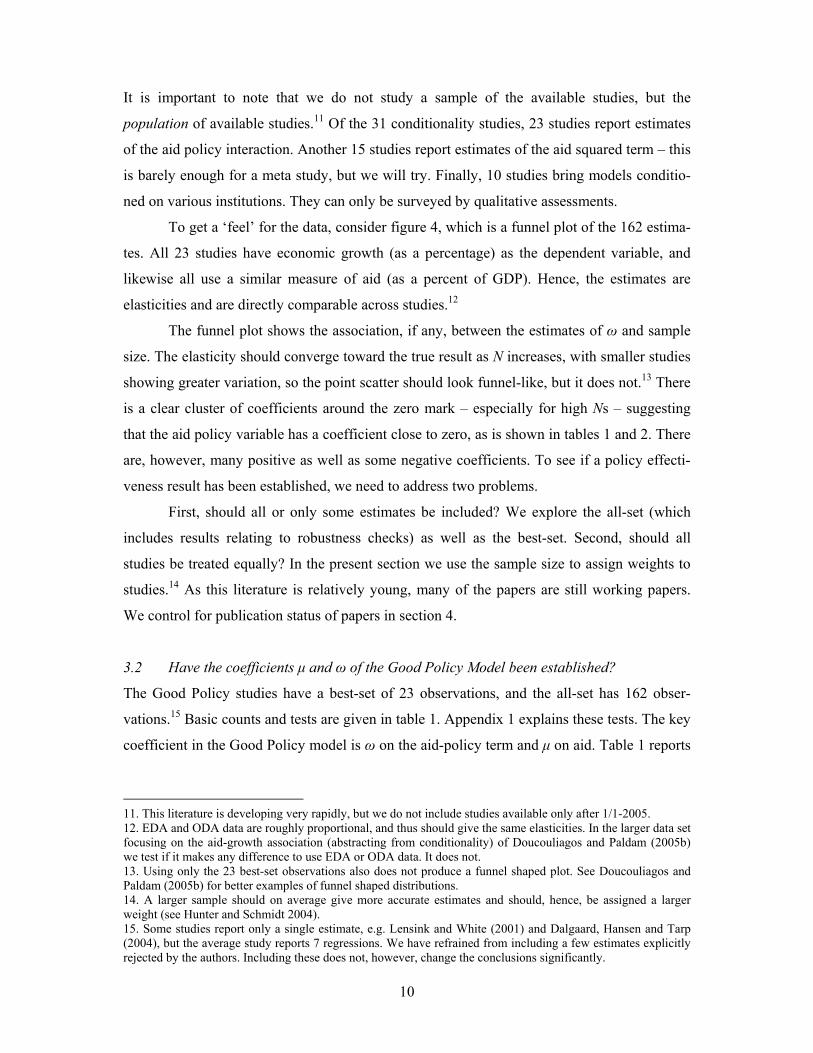
Figure 4. Funnel plot of aid and good policy interactive coefficients, ω
Note: One extreme point at (98, -3.68) from Svensson (1999) is outside frame of the figure.
9. Doucouliagos and Paldam (2005a and b) demonstrate that both left-wingers and libertarian researchers tend to report that foreign aid has a negative impact on savings and economic growth. 10. The parallel argument in historical research is termed source critique.
10
It is important to note that we do not study a sample of the available studies, but the
population of available studies.11 Of the 31 conditionality studies, 23 studies report estimates
of the aid policy interaction. Another 15 studies report estimates of the aid squared term – this
is barely enough for a meta study, but we will try. Finally, 10 studies bring models conditio-
ned on various institutions. They can only be surveyed by qualitative assessments.
To get a ‘feel’ for the data, consider figure 4, which is a funnel plot of the 162 estima-
tes. All 23 studies have economic growth (as a percentage) as the dependent variable, and
likewise all use a similar measure of aid (as a percent of GDP). Hence, the estimates are
elasticities and are directly comparable across studies.12
The funnel plot shows the association, if any, between the estimates of ω and sample
size. The elasticity should converge toward the true result as N increases, with smaller studies
showing greater variation, so the point scatter should look funnel-like, but it does not.13 There
is a clear cluster of coefficients around the zero mark – especially for high Ns – suggesting
that the aid policy variable has a coefficient close to zero, as is shown in tables 1 and 2. There
are, however, many positive as well as some negative coefficients. To see if a policy effecti-
veness result has been established, we need to address two problems.
First, should all or only some estimates be included? We explore the all-set (which
includes results relating to robustness checks) as well as the best-set. Second, should all
studies be treated equally? In the present section we use the sample size to assign weights to
studies.14 As this literature is relatively young, many of the papers are still working papers.
We control for publication status of papers in section 4.
3.2 Have the coefficients µ and ω of the Good Policy Model been established?
The Good Policy studies have a best-set of 23 observations, and the all-set has 162 obser-
vations.15 Basic counts and tests are given in table 1. Appendix 1 explains these tests. The key
coefficient in the Good Policy model is ω on the aid-policy term and µ on aid. Table 1 reports
11. This literature is developing very rapidly, but we do not include studies available only after 1/1-2005. 12. EDA and ODA data are roughly proportional, and thus should give the same elasticities. In the larger data set focusing on the aid-growth association (abstracting from conditionality) of Doucouliagos and Paldam (2005b) we test if it makes any difference to use EDA or ODA data. It does not. 13. Using only the 23 best-set observations also does not produce a funnel shaped plot. See Doucouliagos and Paldam (2005b) for better examples of funnel shaped distributions. 14. A larger sample should on average give more accurate estimates and should, hence, be assigned a larger weight (see Hunter and Schmidt 2004). 15. Some studies report only a single estimate, e.g. Lensink and White (2001) and Dalgaard, Hansen and Tarp (2004), but the average study reports 7 regressions. We have refrained from including a few estimates explicitly rejected by the authors. Including these does not, however, change the conclusions significantly.
11
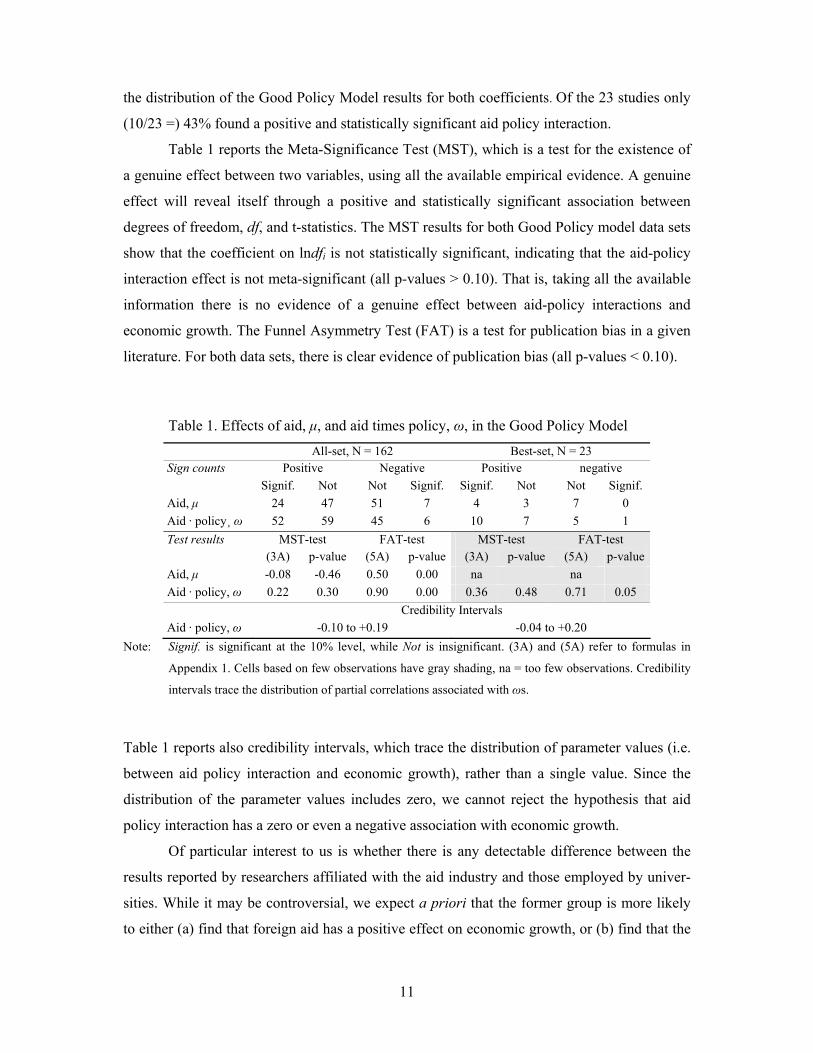
the distribution of the Good Policy Model results for both coefficients. Of the 23 studies only
(10/23 =) 43% found a positive and statistically significant aid policy interaction.
Table 1 reports the Meta-Significance Test (MST), which is a test for the existence of
a genuine effect between two variables, using all the available empirical evidence. A genuine
effect will reveal itself through a positive and statistically significant association between
degrees of freedom, df, and t-statistics. The MST results for both Good Policy model data sets
show that the coefficient on lndfi is not statistically significant, indicating that the aid-policy
interaction effect is not meta-significant (all p-values > 0.10). That is, taking all the available
information there is no evidence of a genuine effect between aid-policy interactions and
economic growth. The Funnel Asymmetry Test (FAT) is a test for publication bias in a given
literature. For both data sets, there is clear evidence of publication bias (all p-values < 0.10).
Table 1. Effects of aid, µ, and aid times policy, ω, in the Good Policy Model
All-set, N = 162 Best-set, N = 23 Sign counts Positive Negative Positive negative Signif. Not Not Signif. Signif. Not Not Signif. Aid, µ 24 47 51 7 4 3 7 0 Aid · policy¸ ω 52 59 45 6 10 7 5 1 Test results MST-test FAT-test MST-test FAT-test (3A) p-value (5A) p-value (3A) p-value (5A) p-value Aid, µ -0.08 -0.46 0.50 0.00 na na Aid · policy, ω 0.22 0.30 0.90 0.00 0.36 0.48 0.71 0.05 Credibility Intervals Aid · policy, ω -0.10 to +0.19 -0.04 to +0.20
Note: Signif. is significant at the 10% level, while Not is insignificant. (3A) and (5A) refer to formulas in
Appendix 1. Cells based on few observations have gray shading, na = too few observations. Credibility
intervals trace the distribution of partial correlations associated with ωs.
Table 1 reports also credibility intervals, which trace the distribution of parameter values (i.e.
between aid policy interaction and economic growth), rather than a single value. Since the
distribution of the parameter values includes zero, we cannot reject the hypothesis that aid
policy interaction has a zero or even a negative association with economic growth.
Of particular interest to us is whether there is any detectable difference between the
results reported by researchers affiliated with the aid industry and those employed by univer-
sities. While it may be controversial, we expect a priori that the former group is more likely
to either (a) find that foreign aid has a positive effect on economic growth, or (b) find that the

12
impact of foreign aid on economic growth is dependent on policy. We have no prior
expectations with respect to the direction of findings by researchers from universities.
Table 2. Meta-analysis of the estimates of the Good Policy Model
(1) (2) (3) (4) (5) (6) (7) Group No.a) Coeff. Simple Median Weighted 95% interval c)
average aver.b) Lower Upper All-set of 162 regressions
All µ -0.01 +0.01 -0.01 -0.19 +0.16 Studies
162 ω +0.05 +0.05 +0.04 -0.16 +0.09
Non-Aid µ -0.06 +0.01 -0.06 -0.18 +0.13 Business
81 ω +0.03 +0.01 +0.04 -0.04 +0.09
Aid µ +0.04 +0.01 +0.03 -0.04 +0.16 Business
81 ω +0.13 +0.08 +0.08 +0.07 +0.17
Danida µ +0.28 +0.14 +0.28 +0.10 +0.52 Group
19 ω +0.04 +0.01 +0.04 0.00 +0.08
World Bank µ -0.11 -0.10 -0.12 -0.18 +0.03 Group
27 ω +0.17 +0.18 +0.17 +0.09 +0.21
Best-set of one regression per paper All µ -0.02 -0.02 -0.04 -0.33 +0.35
Studies 23
ω +0.04 +0.06 +0.08 -0.39 +0.13 Non-Aid µ -0.11 +0.17 -0.03 -0.97 +0.30 Business
11 ω -0.11 0.00 -0.04 -0.62 +0.05
Aid µ +0.06 -0.11 -0.04 -0.24 +0.65 Business
12 ω +0.19 +0.19 +0.21 +0.08 +0.29
Danida µ +0.59 +0.26 +0.53 +0.17 +1.32 Group
4 ω +0.03 +0.03 +0.03 +0.00 +0.05
World Bank µ -0.25 -0.25 -0.27 -0.40 -0.10 Group
6 ω +0.23 +0.22 +0.23 +0.15 +0.30
Notes: µ is the coefficient on aid, and ω is the coefficient on aid times policy. The bolded estimates are signifi-
cant. a) Number of estimates. b) Weighted with number of observations for each estimate. c) Confiden-
ce intervals are bootstrapped, see Appendix 1.
Above we mentioned that the World Bank is the institutional home of the Good Policy
Model,16 while Danida is the institutional home of the Medicine Model. Accordingly, we
consider two groups of aid business studies. The World Bank group papers are: Burnside and
Dollar (2000; 2004); Collier and Dehn (2001); Collier and Dollar (2002); Collier and Hoeffler
(2004); and Svensson (1999). The Danida group papers are: Dalgaard and Hansen (2001);
Dalgaard, Hansen and Tarp (2004); and Hansen and Tarp (2000; 2001). We expect that the
16. The World Bank is a large organization, but the group was concentrated in the same department, with P. Collier (director) and D. Dollar (division head). They are also the two most prolific authors in the AEL.
13
World Bank group has a prior for a positive aid policy term, while the Danida group has a
prior against the aid policy term, but for the aid squared term.17
Table 2 gives a basic meta-analysis of the two data sets for the two coefficients. The
estimates have been grouped and a set of averages calculated, and the obvious differences
tested for significance. Table 2 combines the results from different studies into an overall
result, showing what the literature has established for the all-set and for the best-set. Results
are given for the coefficient ω on the aid policy interaction term and µ on aid alone. Column 2
lists the number of estimates for each group. Column 4 reports the simple unweighted average
of the estimates, and column 5 reports the median values. The sample size weighted averages
are reported in column 6. Column 7 reports the 95% confidence intervals constructed around
the weighted average partial correlations (see Appendix 1 for construction details).
The results for all studies reported in table 2 are that the elasticity of economic growth
with respect to aid-policy conditionality, i.e. the weighted average value of the interaction
effect, ω is +0.04 or less. This shows that the interactive term is of little economic significan-
ce; also, it is not statistically significant. Hence, we conclude that when all available studies
are considered, there is no evidence of a positive aid policy interaction. The table also shows
that the average coefficient µ on the aid variable in this family of the AEL is even closer to
zero. Thus, this family of studies has found that aid has no impact on economic growth, much
like in our studies of the other families of the AEL (see Doucouliagos and Paldam 2005b and
2005c).
Table 2 compares the results of the aid business studies to the non-aid business
studies. They deviate systematically in the direction predicted, and the deviation is often
significant – especially as regards ω. A comparison of the findings of the Danida and World
Bank groups also confirms our expectations. The World Bank group reports a relatively large
positive and statistically significant value for ω and a negative value for µ. In contrast, the
Danida group studies find a near zero value for ω and a positive value for µ. Interestingly, the
95% confidence intervals do not overlap, indicating that the two groups of researchers
produce quantitatively different results, with a more pronounced difference when the best-set
data are used: Affiliation matters. This difference in results can be seen in Figure 5, which is a
funnel plot comparing the Danida and World Bank group of studies.
17. Note that Svensson (1999), though he (at that time) belonged to the World Bank group, rejected the aid policy term, but we do code this as part of the World Bank group of studies.
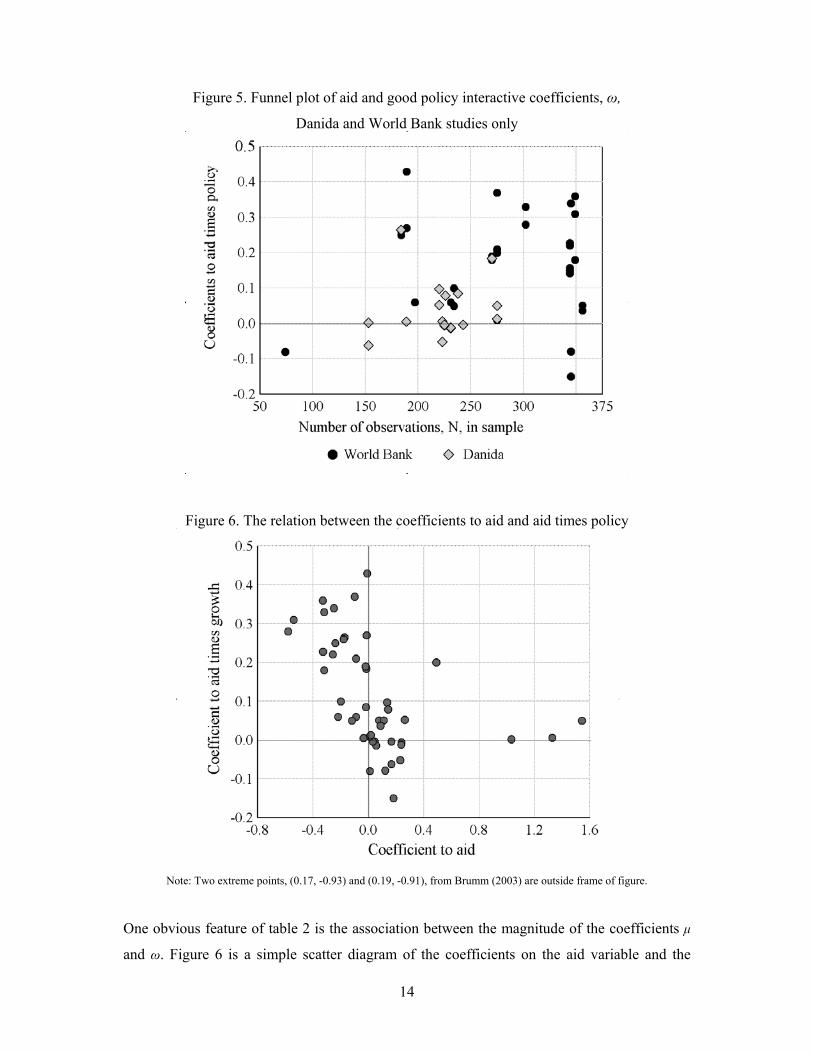
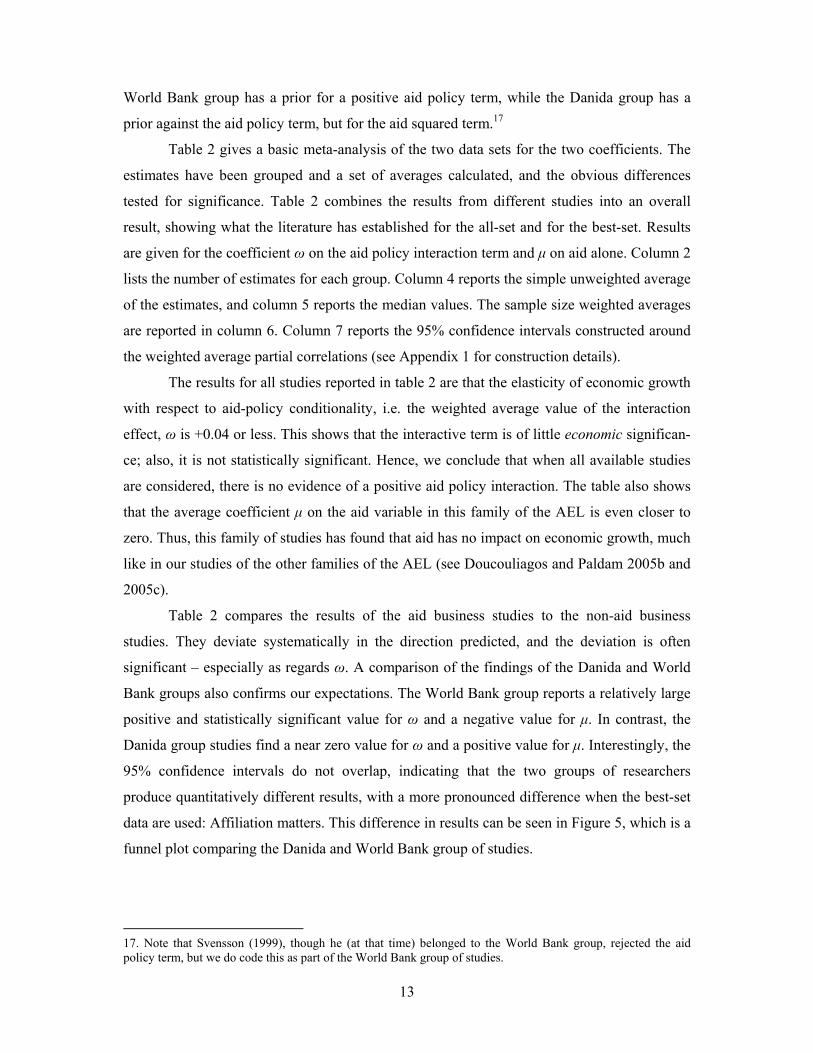
14
Figure 5. Funnel plot of aid and good policy interactive coefficients, ω,
Danida and World Bank studies only
Figure 6. The relation between the coefficients to aid and aid times policy
Note: Two extreme points, (0.17, -0.93) and (0.19, -0.91), from Brumm (2003) are outside frame of figure.
One obvious feature of table 2 is the association between the magnitude of the coefficients µ
and ω. Figure 6 is a simple scatter diagram of the coefficients on the aid variable and the

15
coefficients on the aid policy interactive terms, for the Danida and World Bank group of
studies. It shows a clear negative association. Studies that report higher coefficients on the aid
policy interactive term tend to report lower coefficients on the aid term. As noted earlier, even
if the aid policy interactive term is positive and statistically significant, it is still possible for
aid to have a positive impact regardless of policy if the coefficient on aid is large enough.
3.3 Is there an aid squared effect?
The Medicine Model has been analyzed in 15 papers, and a total of 85 regressions have been
presented with an aid squared term. A main problem for the analysis of this data is that a large
fraction of the regressions are in papers proposing the model, Hadjimichael et al. (1995),
Hansen and Tarp (2000; 2001), and Lensink and White (2001). There is thus little indepen-
dent verification of the model.
Taking the best-set of results from all 15 studies, the weighted average aid squared
coefficient, ω, is -0.08, and the associated partial correlation is -0.12.18 Taking all 85
estimates from the 15 studies, the weighted average aid squared coefficient is -0.18, and the
associated partial correlation is -0.13. Both credibility intervals include zero, so it is dubious
if the term is significant (see Table 3). Hence, a firm conclusion on this aspect of conditio-
nality cannot be made. Also, here we do get a significantly positive coefficient, µ, to aid.
Further research is clearly needed.
Table 3. Effects of aid, µ, and aid squared, ω, in the Medicine Model
All-set, N = 85 Best-set, N = 15 Sign counts Positive Negative Positive Negative Signif. Not Not Signif. Signif. Not Not Signif. Aid, µ 50 19 8 2 12 1 2 0 Aid squared, ω 0 4 18 63 0 0 3 12 Test results MST-test FAT-test MST-test FAT-test (3A) p-value (5A) p-value (3A) p-value (5A) p-value Aid, µ -0.03 0.87 1.53 0.00 na na Aid squared, ω 0.11 0.68 -0.06 -0.20 -0.26 0.25 -0.06 0.95 Credibility Intervals Aid squared, ω -0.30 to +0.04 -0.33 to +0.08
Note: See note to table 1. The 15 observations of the best-set are very few for the test, see also figure 6. Credi-
bility intervals trace the distribution of partial correlations between aid and aid squared and economic
growth.
18. There is a high degree of skewness in the reported coefficients from this part of the literature. For example, while the unweighted average aid squared coefficient is -0.10, the median is -0.01.
16
The MST results for the aid squared estimates had a coefficient on the natural logarithm of
degrees of freedom of +0.11, and for the best-set it is -0.26, and neither is statistically signifi-
cantly different from zero. Hence, there is no evidence of a genuine association between aid
squared and economic growth.
Tables 1 and 3 also report the distribution of results and MST and FAT tests for the µ
coefficients. None of the cases show evidence of a genuine effect between aid and economic
growth. Note, however, that tables 1 and 3 relate to only a sub-sample of the available eviden-
ce on aid and economic growth, i.e. only to the conditionality literature. Doucouliagos and
Paldam (2005b) have explored the entire body of evidence and come to the same conclusion.
3.4 Institutional conditions: The future?
The 10 papers in the residual group are all relatively new proposals. They have not been
independently replicated, so they are promising, and because they are a small group they
cannot be submitted to a formal meta-analysis.
Two papers condition for democracy (Svensson 1999 and Kosack 2002). Both suggest
that aid works better in democracies, but are otherwise different, and the main thrust of
Kosack’s paper is to replace economic growth with growth of the human development index
as the dependent variable, but he also reports results using growth, confirming that the two
welfare measures are highly correlated.
Two studies by Chauvet and Guillaumont (2001; 2003) condition for various measures
for political instability and external vulnerability, which attempt to catch institutional
stability. This appears logical, as successful projects do need time for implementation, and
hence some kind of institutional stability. Two related studies condition for quality of institu-
tions, Collier and Dehn (2001) and Collier and Dollar (2002), but in different ways. Perhaps
one may say that the quality and stability of institutions is the same factor for aid
effectiveness. It is a main problem that we need simple and clear measures for this factor, but
the proxies tried suggest that it is important for aid effectiveness.
One study conditions for trade openness (Teboul and Moustier 2001). The logic is
here more indirect, and one gets the impression that trade openness is a proxy for a broader
concept. The broadest such concept is perhaps economic freedom as is tried in Brumm (2003).
Although it may not matter, it appears that the statistical methods used by Brumm are too far
from the state of the art in the field.

17
Finally, two studies link aid with GDP (Bowen 1995 and Svensson 1999). They
suggest that aid works better in more developed countries. The many studies that concentrate
on a region or have regional dummies give evidence pointing in the same direction.
4. Accounting for differences in results for the two models
The previous analysis shows that priors influence results, but we also want to study the
methodological differences producing the results. MRA (meta-regression analysis) can be
used for that purpose (Stanley 2001). The dependent variable is a binary variable taking the
value of 1 if the study reports a statistically significant positive coefficient and otherwise 0.
When probit meta-regressions are used to explain this variable, it reveals if a certain other
variable affects conditional aid effectiveness. The number of observations is limited, so we
only use the most important explanatory variables,19 which are defined in Table 4.
The aim of our MRA is to identify the characteristics of studies that influence the
reported results. We are still interested in exploring whether an author’s association with the
aid business results in qualitatively different results on the aid policy variable. We include the
Danida and WorldBk dummies in order to test the findings of table 2 within a multivariate
context. We add a control variable for working papers since working papers have not yet
passed the referee process and, hence, may have a lower quality (i.e. WorPap is our binary
measure of research quality). We expect an association between the number of countries
included in a study and the study results.20 Similarly, we include the number of years of data
from each study. We include the DevJour variable to see if there are differences in results
across the types of journals.
4.1 Results for the Good Policy Model
The results reported in table 5, columns 1 and 2, use the all-set of 162 estimates. The DevJour
and AidBus variables were not statistically significant. Consequently, they were eliminated
and the model reestimated (column 2), so that the remaining variables have a t-statistic greater
than 1. NrCountries is statistically significant: the more countries included in a study, the less
19. We considered other aspects of studies, e.g. a dummy variable for the two papers published in the Cato journal, a dummy variable for estimation using OLS, as well as a dummy variable for the use of EDA versus ODA data. These variables were not statistically significant and can be ignored. 20. Several studies show that the choice of countries can influence study results. Burnside and Dollar (2000) shows that the exclusion of a handful of outliers changes the statistical significance of the results. Jensen and Paldam (2004) shows that the results are highly sensitive to the sample.
18
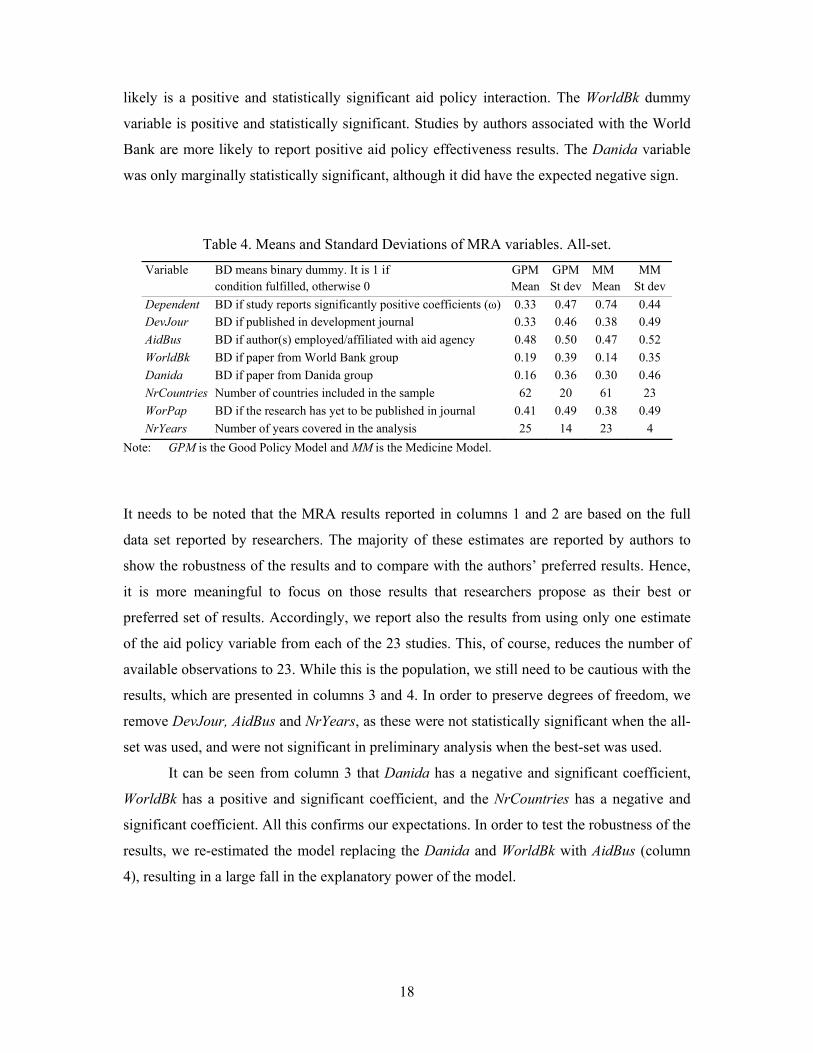
likely is a positive and statistically significant aid policy interaction. The WorldBk dummy
variable is positive and statistically significant. Studies by authors associated with the World
Bank are more likely to report positive aid policy effectiveness results. The Danida variable
was only marginally statistically significant, although it did have the expected negative sign.
Table 4. Means and Standard Deviations of MRA variables. All-set.
Variable BD means binary dummy. It is 1 if GPM GPM MM MM condition fulfilled, otherwise 0 Mean St dev Mean St dev Dependent BD if study reports significantly positive coefficients (ω) 0.33 0.47 0.74 0.44 DevJour BD if published in development journal 0.33 0.46 0.38 0.49 AidBus BD if author(s) employed/affiliated with aid agency 0.48 0.50 0.47 0.52 WorldBk BD if paper from World Bank group 0.19 0.39 0.14 0.35 Danida BD if paper from Danida group 0.16 0.36 0.30 0.46 NrCountries Number of countries included in the sample 62 20 61 23 WorPap BD if the research has yet to be published in journal 0.41 0.49 0.38 0.49 NrYears Number of years covered in the analysis 25 14 23 4
Note: GPM is the Good Policy Model and MM is the Medicine Model.
It needs to be noted that the MRA results reported in columns 1 and 2 are based on the full
data set reported by researchers. The majority of these estimates are reported by authors to
show the robustness of the results and to compare with the authors’ preferred results. Hence,
it is more meaningful to focus on those results that researchers propose as their best or
preferred set of results. Accordingly, we report also the results from using only one estimate
of the aid policy variable from each of the 23 studies. This, of course, reduces the number of
available observations to 23. While this is the population, we still need to be cautious with the
results, which are presented in columns 3 and 4. In order to preserve degrees of freedom, we
remove DevJour, AidBus and NrYears, as these were not statistically significant when the all-
set was used, and were not significant in preliminary analysis when the best-set was used.
It can be seen from column 3 that Danida has a negative and significant coefficient,
WorldBk has a positive and significant coefficient, and the NrCountries has a negative and
significant coefficient. All this confirms our expectations. In order to test the robustness of the
results, we re-estimated the model replacing the Danida and WorldBk with AidBus (column
4), resulting in a large fall in the explanatory power of the model.

19
Table 5. Meta-regression analysis and meta-significance testing, Good Policy Model (1) (2) (3) (4) (5)
Variable MRA: All-set MRA: Best-set MSTMRA Constant 1.77 (1.27) 1.91 (1.55) 7.58 (2.38) 1.83 (1.18) -0.53 (-0.51) AidBus 0.15 (0.36) - - 1.04 (1.57) - NrCountries -0.02 (-2.05) -0.03 (-2.18) -0.15 (-2.92) -0.05 (-2.57) -0.02 (-2.77) WorPap -0.54 (-1.72) -0.49 (-2.03) 1.59 (1.71) 1.57 (2.13) -0.04 (-0.21) Danida -0.82 (-1.52) -0.74 (-1.79) -7.46 (-10.97) - -0.74 (-2.03) WorldBk 0.46 (1.10) 0.57 (2.11) 4.12 (4.26) - 0.50 (2.48) DevJour -0.06 (-0.20) - - - - NrYears -0.03 (-0.78) -0.03 (-1.01) - - - lndf - - - - 0.25 (1.17) N 162 162 23 23 162 McFadden R2 0.12 0.12 0.69 0.34 - Adjusted R2 - - - - 0.09 Aid business ME 0.05 - - 0.37 - World Bank ME 0.17 0.21 0.94 - - Danida ME -0.23 -0.21 -0.31 - -
Notes: The dependent variable in columns 1 to 4 is a binary variable reflecting whether the aid policy interac-
tion term of the study has a positive and statistically significant impact on economic growth. The depen-
dent variable in column 5 is a natural logarithm of the absolute value of the t-statistic. Figures in
brackets are z-statistics for columns 1 to 4 and t-statistics for column 5. ME is marginal effect. Bolded
estimates are significant.
Table 6. Meta-regression analysis and meta-significance testing, Medicine Model (1) (2) (3) (4)
Variable MRA: All-set MSTMRA Constant 3.55 (2.34) 2.03 (3.58) -0.84 (-0.98) -0.24 (-0.28) Proponent -0.15 (-0.13) - 0.65 (1.09) - NrCountries -0.02 (-2.34) -0.01 (-2.12) 0.00 (0.23) - WorPap -1.63 (-2.53) -0.97 (-2.62) 0.32 (0.98) 0.43 (2.14) Danida -1.15 (-1.03) - -0.48 (-1.12) - WorldBk -1.38 (-2.01) -0.77 (-1.66) -0.22 (-0.59) - DevJour 0.35 (0.64) - 0.46 (1.04) 0.57 (3.32) NrYears -0.02 (-0.33) - 0.04 (1.67) - lndf - - -0.02 (-0.13) 0.06 (0.41) N 85 85 85 85 McFadden R2 0.13 0.10 - Adjusted R2 - - 0.02 0.05
Notes: The dependent variable in columns 1 and 4 is a binary variable reflecting whether a study’s aid square
term has a positive and statistically significant impact on economic growth. The dependent variable in
columns 3 and 4 is a natural logarithm of the absolute value of the t-statistic. Figures in brackets are z-
statistics for columns 1 and 2 and t-statistics for columns 3 and 4. Bolded estimates are significant.
The meta-regression model (column 3) on the best-set explains approximately 70% of the
variation in aid policy results. In other words, most of the variation in reported aid policy
coefficients can be explained by sample size and author affiliation. The marginal effects,
reported in the last three rows, show the effect on the probability that a study reports a
positive and statistically significant aid policy interaction. The probability that a positive and

20
statistically significant effect is reported is close to 0.94 when the researcher is associated
with the World Bank.
Doucouliagos (2005) and Stanley (2005) advocate combining MST and MRA to con-
trol for study characteristics. These MSTMRA results are presented in the last column of table
5. Once again, the coefficient on the lndfi variable is not statistically significant, confirming
the non-existence of aid and policy conditionality.21
4.3 Results for the Medicine Model
The meta-regression analysis was repeated for the data associated with the Medicine Model
(see table 6). The one new explanatory variable is Proponent, which is a dummy variable with
a value of 1 if the author is one of the proponents of the Medicine Model. Once again, the
number of countries included in a growth regression is inversely related to the probability of
finding a statistically significant conditionality result. While the Proponent variable is not a
significant factor, the World Bank variable is: Studies conducted by authors affiliated with the
World Bank are less likely to find support for the Medicine Model. Interestingly, working
papers are less likely to support the Medicine Model. Working papers are mainly newer
studies and hence independent verifications; however, since they are not yet published they
maybe of lower quality. This result suggests that much more research into the Medicine
Model is needed. Finally, the MSTMRA results presented in columns 3 and 4, confirm the
results from table 3 that there is no evidence of a genuine aid square effect on economic
growth (the lndf coefficients are not statistically significant).
5. Summary and conclusions
The aim of this paper was to explore one family of the AEL, aid effectiveness literature, by
the tools of meta-analysis. We analyzed the conditional models, where aid is effective if one
condition is right, and may be harmful if the condition is bad.
The most researched condition is “Good Policy” (defined above). The number of
studies is already large enough to permit clear conclusions on the two questions asked:
(a) Is the impact of aid on growth moderated by policy? The aggregate coefficient to
the interaction between foreign aid and policy proves to be very close to zero. Good policies
help increase growth, but they do not influence the marginal effectiveness of aid. (b) Are the 21. Using the bootstrap to derive standard errors for the MST and MSTMRA models produces the same conclusion. The estimates for column 5, table 5, become: Coefficient on lndf = 0.24 and the t-statistic = 1.26.

21
reported estimates systematically influenced by study characteristics? We established that the
author’s institutional affiliation does influence reported results as does sample size.
The success of the Burnside and Dollar and World Bank reports was based on the
evidence available at that time, but subsequent analysis has shown that their conclusions were
premature. This proves Hunter and Schmidt’s (2004, xxvii) statement that: “Scientists have
known for centuries that a single study will not resolve a major issue. … Thus, the foundation
of science is the cummulation of knowledge from the results of many studies”.
The second most researched condition is aid itself, where aid works as medicine,
which has an optimal dose. Here we asked the same questions. The number of independent
studies is not large enough to reach a sharp conclusion, either way. It is a more robust connec-
tion, but till now it has proved too unstable for independent replication, so more research is
needed.
Finally, the literature contains a whole set of new conditional variables that have been
proposed and tested once or twice. These variables are potentially quite promising, and
suggest that the field is open to future research.

22
References (note also Appendix 2 covering the AEL) Adams, D.C., Gurevitch J., Rosenberg, M.S., 1997. Resampling Tests for Meta-analysis of Ecological Data,
Ecology 78, 1277-1283
Card, D., Krueger A.B., 1995. Time-Series Minimum-Wage Studies: a meta-analysis. American Economic
Review 85, 238-43
Chang, C. C., Fernandez-Arias, E., Serven, L., 1998. Measuring aid flows: A new approach. World Bank. URL:
<http://www.worldbank.org/research/growth/ddaid.htm>
Collier, P., Dollar, D., 2004. Development effectiveness: What have we learnt? Economic Journal 114, 244
Doucouliagos, C., 2005. Publication Bias In The Economic Freedom And Economic Growth Literature. Journal
of Economic Surveys, forthcoming
Doucouliagos, C., Laroche, P. 2003. What do Unions do to Productivity: A Meta-Analysis. Industrial Relations
42, 650-691
Doucouliagos, H., Paldam, M., 2005a. Aid effectiveness on accumulation. A meta study. Department of Econo-
mics, Aarhus University.
Doucouliagos, H., Paldam, M., 2005b. Aid effectiveness on growth. A meta study. Department of Economics,
Aarhus University.
Doucouliagos, H., Paldam, M., 2005c. Aid effectiveness: The lessons from 35 years of research. Department of
Economics, Aarhus University.
Efron B, Tibshirani R., 1993. An Introduction to the Bootstrap. Chapman & Hall, New York
Egger, M., Smith, G.D., Scheider, M., Minder, C., 1997. Bias in Meta-Analysis Detected by a Simple,
Graphical Test. British Medical Journal 316, 629-34
Greene, W.D., 2002. Econometric Analysis (4th, edn.). Prentice Hall, London
Hedges, L. V., and Olkin, I, 1985, Statistical Methods for Meta-Analysis. Academic Press, Orlando, FL
Herbertsson, T.T., Paldam, M., 2005. Does development aid help poor countries catch up? An analysis using
the basic relations. Department of Economics, University of Aarhus
Hunter, John and Schmidt, Frank, 2004. Methods of Meta-Analysis: correcting error and bias in research
findings. Sage, London
Levine, R., Renelt, D., 1992. A Sensitivity Analysis of Cross-Country Growth Regressions. American
Economic Review 82, 942-63
Paldam, M., 2004. A look at the raw data for aid and growth. Posted at <http://www.martin.paldam.dk>
Stanley, T.D., 2001. Wheat From Chaff: meta-analysis as quantitative literature review. The Journal of
Economic Perspectives 15, 131-150
Stanley, T.D., 2005. Beyond Publication Bias. Journal of Economic Surveys, forthcoming
Stanley, T.D., Jarell, S.B., 1998. Gender Wage Discrimination Bias? a meta-regression analysis. The Journal of
Human Resources 33, 947-973
Tarp, F., Hjertholm, P., eds., 2000. Foreign aid and development. Lessons learnt and directions for the future.
Routledge Studies in Development Economics, London
World Bank, 1998. Assessing aid: What works, what doesn’t, and why. A Policy Research Report. Oxford UP,
New York
23
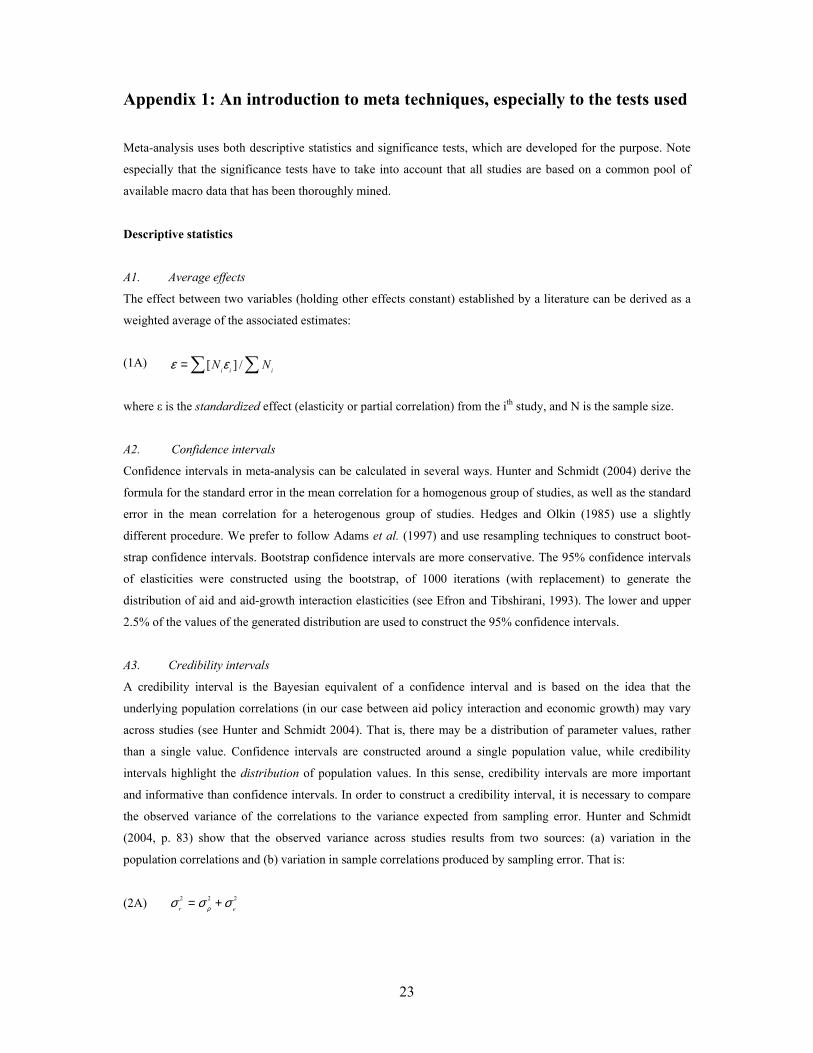
Appendix 1: An introduction to meta techniques, especially to the tests used
Meta-analysis uses both descriptive statistics and significance tests, which are developed for the purpose. Note
especially that the significance tests have to take into account that all studies are based on a common pool of
available macro data that has been thoroughly mined.
Descriptive statistics
A1. Average effects
The effect between two variables (holding other effects constant) established by a literature can be derived as a
weighted average of the associated estimates:
(1A) [ ] /i i iN Nε ε=∑ ∑
where ε is the standardized effect (elasticity or partial correlation) from the ith study, and N is the sample size.
A2. Confidence intervals
Confidence intervals in meta-analysis can be calculated in several ways. Hunter and Schmidt (2004) derive the
formula for the standard error in the mean correlation for a homogenous group of studies, as well as the standard
error in the mean correlation for a heterogenous group of studies. Hedges and Olkin (1985) use a slightly
different procedure. We prefer to follow Adams et al. (1997) and use resampling techniques to construct boot-
strap confidence intervals. Bootstrap confidence intervals are more conservative. The 95% confidence intervals
of elasticities were constructed using the bootstrap, of 1000 iterations (with replacement) to generate the
distribution of aid and aid-growth interaction elasticities (see Efron and Tibshirani, 1993). The lower and upper
2.5% of the values of the generated distribution are used to construct the 95% confidence intervals.
A3. Credibility intervals
A credibility interval is the Bayesian equivalent of a confidence interval and is based on the idea that the
underlying population correlations (in our case between aid policy interaction and economic growth) may vary
across studies (see Hunter and Schmidt 2004). That is, there may be a distribution of parameter values, rather
than a single value. Confidence intervals are constructed around a single population value, while credibility
intervals highlight the distribution of population values. In this sense, credibility intervals are more important
and informative than confidence intervals. In order to construct a credibility interval, it is necessary to compare
the observed variance of the correlations to the variance expected from sampling error. Hunter and Schmidt
(2004, p. 83) show that the observed variance across studies results from two sources: (a) variation in the
population correlations and (b) variation in sample correlations produced by sampling error. That is:
(2A) 2 2 2
r eρσ σ σ= +

24
where σ denotes variance, and the subscripts r, ρ and e denote observed, population and sampling error, respect-
tively. Thus the observed variance in correlations should be corrected for the impact of sampling error.
Following the logic, we calculated partial correlations for each study (see Greene 2002 for formula). We then
calculated the observed variance of partial correlations drawn from each study, with each partial correlation
weighted by the associated sample size. See Hunter and Schmidt (2004) for the formula for the observed
variance and the variance expected from sampling error.
Regression based tests
The data for the two following tests are a set of n estimates of the same effect, ε, with the associated tests
statistics (ti, si, di), where ti is the t-statistics; si, is the standard error; di is the degrees of freedom of the estimate.
All n estimates use variants of the same estimation equation and sub-samples of the same data. Both tests use the
population of observations and are robust to data mining.
A4. Meta-Significance Testing: The MST test (Stanley 2001 and 2005)
The idea is that a connection between two variables, such as foreign aid and economic growth, should exhibit a
positive relationship between the natural logarithm of the absolute value of the t-statistic and the natural
logarithm (ln) of the degrees of freedom in the regression:
(3A) lnti= α0 + α1 lndfi + ui
As the sample size for the ith study rises, the precision of the coefficient estimate for the ith study rises also, i.e.,
standard errors fall and t-statistics rise. Stanley (2005) shows that the slope coefficient in equation (3A) offers
information on the existence of genuine empirical effects, publication bias, or both. If α1 < 0, the estimates are
contaminated by selection effects, because t-statistics fall as sample size rises. That is, studies with smaller
samples report larger t-statistics, indicating that it is easier to mine smaller samples in order to increase the
prospects of publication. If α1 > 0, there is a genuine association between aid policy interaction and economic
growth, since t-statistics rise as sample size increases. If 0 < α1 < 0.5, then there is a genuine association between
aid policy interaction and economic growth, as well as publication bias in the literature.
A5. Funnel Asymmetry Testing: FAT-tests (Egger et al 1997; Stanley 2005)
Smaller samples have larger standard errors. If publication bias is absent from a literature, no association
between a study’s reported effect and its standard error should appear. However, if there is publication bias,
smaller studies will search for larger effects in order to compensate for their larger standard errors, which can be
done by modifying specifications, functional form, samples and even estimation technique.
(4A) ei = β0 + β1si + ui
where ei is the regression coefficient, and si is its standard error. Since the explanatory variable in equation (4A)
is the standard error, heteroscedasticity is likely to be a problem. Equation (4A) (from Stanley 2005) is corrected
for heteroscedasticity by dividing it by the associated standard error. This produces equation (5A):
25
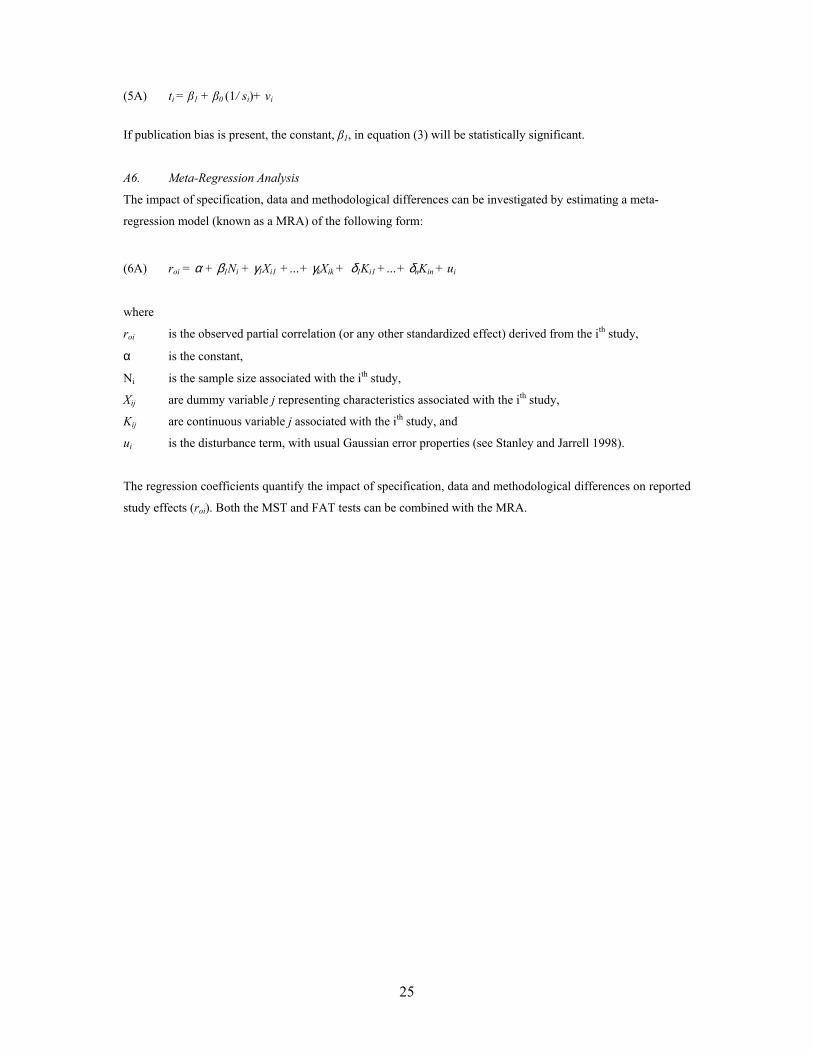
(5A) ti = β1 + β0 (1/ si)+ vi
If publication bias is present, the constant, β1, in equation (3) will be statistically significant.
A6. Meta-Regression Analysis
The impact of specification, data and methodological differences can be investigated by estimating a meta-
regression model (known as a MRA) of the following form:
(6A) roi = α + β1Ni + γ1Xi1 +…+ γkXik + δ1Ki1 +…+ δnKin + ui
where
roi is the observed partial correlation (or any other standardized effect) derived from the ith study,
α is the constant,
Ni is the sample size associated with the ith study,
Xij are dummy variable j representing characteristics associated with the ith study,
Kij are continuous variable j associated with the ith study, and
ui is the disturbance term, with usual Gaussian error properties (see Stanley and Jarrell 1998).
The regression coefficients quantify the impact of specification, data and methodological differences on reported
study effects (roi). Both the MST and FAT tests can be combined with the MRA.
26
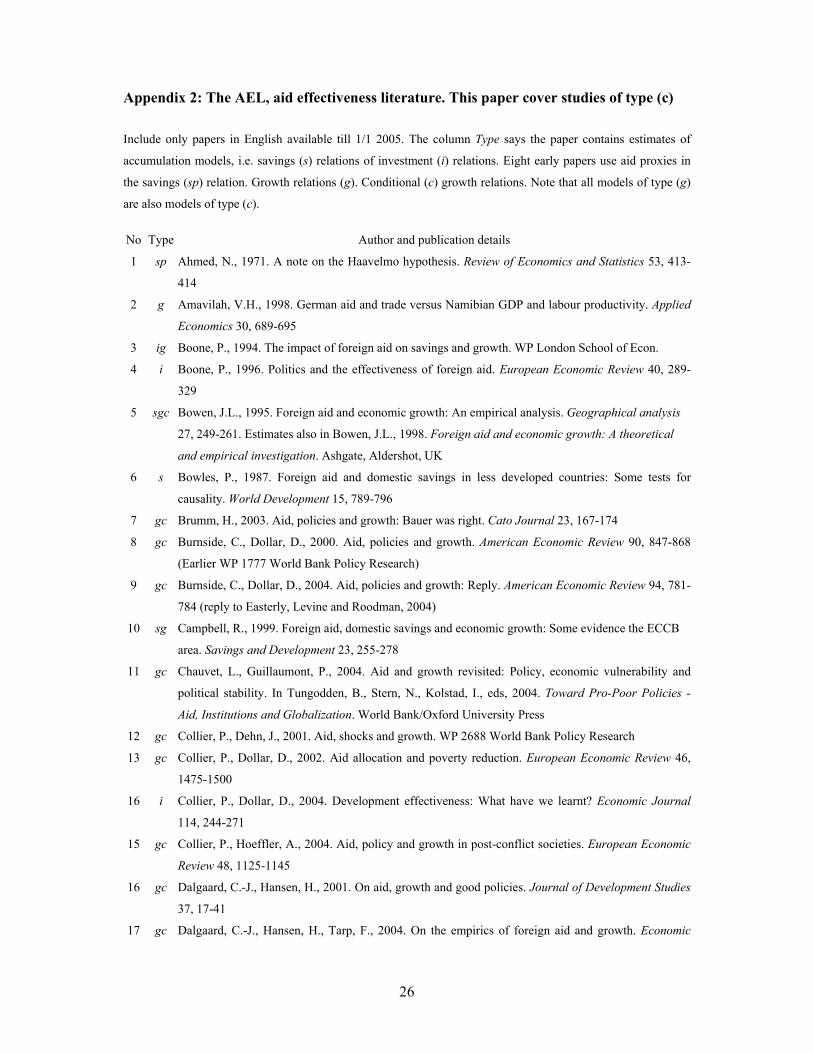
Appendix 2: The AEL, aid effectiveness literature. This paper cover studies of type (c)
Include only papers in English available till 1/1 2005. The column Type says the paper contains estimates of
accumulation models, i.e. savings (s) relations of investment (i) relations. Eight early papers use aid proxies in
the savings (sp) relation. Growth relations (g). Conditional (c) growth relations. Note that all models of type (g)
are also models of type (c).
No Type Author and publication details
1 sp Ahmed, N., 1971. A note on the Haavelmo hypothesis. Review of Economics and Statistics 53, 413-
414
2 g Amavilah, V.H., 1998. German aid and trade versus Namibian GDP and labour productivity. Applied
Economics 30, 689-695
3 ig Boone, P., 1994. The impact of foreign aid on savings and growth. WP London School of Econ.
4 i Boone, P., 1996. Politics and the effectiveness of foreign aid. European Economic Review 40, 289-
329
5 sgc Bowen, J.L., 1995. Foreign aid and economic growth: An empirical analysis. Geographical analysis
27, 249-261. Estimates also in Bowen, J.L., 1998. Foreign aid and economic growth: A theoretical
and empirical investigation. Ashgate, Aldershot, UK
6 s Bowles, P., 1987. Foreign aid and domestic savings in less developed countries: Some tests for
causality. World Development 15, 789-796
7 gc Brumm, H., 2003. Aid, policies and growth: Bauer was right. Cato Journal 23, 167-174
8 gc Burnside, C., Dollar, D., 2000. Aid, policies and growth. American Economic Review 90, 847-868
(Earlier WP 1777 World Bank Policy Research)
9 gc Burnside, C., Dollar, D., 2004. Aid, policies and growth: Reply. American Economic Review 94, 781-
784 (reply to Easterly, Levine and Roodman, 2004)
10 sg Campbell, R., 1999. Foreign aid, domestic savings and economic growth: Some evidence the ECCB
area. Savings and Development 23, 255-278
11 gc Chauvet, L., Guillaumont, P., 2004. Aid and growth revisited: Policy, economic vulnerability and
political stability. In Tungodden, B., Stern, N., Kolstad, I., eds, 2004. Toward Pro-Poor Policies -
Aid, Institutions and Globalization. World Bank/Oxford University Press
12 gc Collier, P., Dehn, J., 2001. Aid, shocks and growth. WP 2688 World Bank Policy Research
13 gc Collier, P., Dollar, D., 2002. Aid allocation and poverty reduction. European Economic Review 46,
1475-1500
16 i Collier, P., Dollar, D., 2004. Development effectiveness: What have we learnt? Economic Journal
114, 244-271
15 gc Collier, P., Hoeffler, A., 2004. Aid, policy and growth in post-conflict societies. European Economic
Review 48, 1125-1145
16 gc Dalgaard, C.-J., Hansen, H., 2001. On aid, growth and good policies. Journal of Development Studies
37, 17-41
17 gc Dalgaard, C.-J., Hansen, H., Tarp, F., 2004. On the empirics of foreign aid and growth. Economic

27
Journal 114, 191-216
18 gc Dayton-Johnson, J., Hoddinott, J., 2003. Aid, policies and growth, redux. WP Dalhousie Univ.
19 gc Denkabe, P., 2004. Policy, aid and growth: A threshold hypothesis. Journal of African Finance and
Economic Development 6, 1-21 (WP version used)
20 i Dollar, D., Easterly, W., 1999. The search for the key: Aid, investment and policies in Africa. Journal
of African Economies 8, 546-577
21 g Dowling, J.M., Hiemenz, U., 1983. Aid, savings and growth in the Asian region. The Developing
Economies 21, 3-13
22 gc Durbarry, R., Gemmell, N., Greenaway, D., 1998. New evidence on the impact of foreign aid on
economic growth. Credit WP Univ. of Nottingham
23 g Easterly, W., 2003. Can foreign aid buy growth? Journal of Economic Perspectives 17, 23-48
24 gc Easterly, W., Levine, R., Roodman, D., 2004. Aid, policies, and growth: Comment. American
Economic Review 94, 774-780 (Comment to Burnside and Dollar, 2001)
25 g Economides, G., Kalyvitis, S., Philippopoulos, A., 2004. Does foreign aid distort incentives and hurt
growth? Theory and evidence from 75 aid-recipient countries. WP Athens Univ. of Econ. and
Business
26 g Fayissa, B., El-Kaissy, M., 1999. Foreign aid and the economic growth of developing countries
(LDCs): Further evidence. Studies in Comparative International Development Fall, 37-50
27 i Feyzioglu, T., Swaroop, V., Zhu, M., 1998. A panel data analysis of the fungibility of foreign aid,
World Bank Economic Review 12, 29-58
28 i Franco-Rodriguez, S., 2000. Recent developments in fiscal response with an application to Costa
Rica. Journal of International Development 12, 429-441
29 i Franco-Rodriguez, S., Morrissey, O., McGillivray, M., 1998. Aid and the public sector in Pakistan:
Evidence with endogenous aid. World Development 26, 1241-1250
30 sp Fry, M.J., 1978. Money and capital or financial deepening in economic development? Journal of
Money, Credit, and Banking 10, 454-475
31 i Gang, I.N., Khan, H.A., 1991. Foreign aid, taxes and public investment. Journal of Development
Economics 24, 355-369
32 g Giles, J.A., 1994. Another look at the evidence on foreign aid led economic growth. Applied
Economics Letters 1, 194-199
33 sp Giovannini, A., 1983. The interest elasticity of savings in developing countries: The existing
evidence. World Development 7, 601-607
34 igc Gomanee, K., Girma, S., Morrissey, O., 2002. Aid and growth: Accounting for the transmission
mechanisms in Sub-Sahara Africa. Credit WP Univ. of Nottingham
35 g Gounder, R., 2001. Aid-growth nexus: Empirical evidence from Fiji. Applied Economics 33, 1009-
1019
36 sp Griffin, K., 1970. Foreign capital, domestic savings and economic development. Bulletin of the
Oxford University Institute of Economics and Statistics 32, 99-112
37 spg Griffin, K., Enos, J., 1970. Foreign assistance: Objectives and consequences. Economic Development
and Cultural Change 18, 313-327

28
38 gc Guillaumont, P., Chauvet, L., 2001. Aid and performance: A reassessment. Journal of Development
Studies 37, 66-92
39 g Gulati U.C., 1976. Foreign aid, savings and growth: Some further evidence. Indian Economic Journal
24, 152-60
40 g Gulati U.C., 1978. Effects of capital imports on savings and growth in less developed countries.
Economic Inquiry 16, 563-569
41 sp Gupta, K.L., 1970. Foreign capital and domestic savings: A test of Haavelmo’s hypothesis with cross-
country data: A comment. Review of Economics and Statistics 52, 214-216
42 sg Gupta, K.L., 1975. Foreign capital inflows, dependency burden, and saving rates in developing
countries: A simultaneous equation model. Kyklos 28, 358-374
43 sg Gupta, K.L., Islam, M.A., 1983. Foreign Capital, Savings and Growth – an International Cross-
Section Study. Dordrecht, Reidel Publishing Company
44 sig Gyimah-Brempong, K., 1992. Aid and economic growth in LDCs: Evidence from Sub-Saharan
Africa. The Review of Black Political Economy 20, 31-52
45 sigc Hadjimichael, M.T., Ghura, D., Mühleisen, M., Nord, R., Ucer, E.M., 1995. Sub-Saharan Africa:
Growth, savings, and investment, 1986-93. IMF Occasional Paper, No. 118
46 i Halevi, N., 1976. The effects on investment and consumption of import surpluses of developing
countries. Economic Journal 86, 853-858
47 gc Hansen, H., Tarp, F., 2000. Aid effectiveness disputed. Journal of International Development 12,
375-398. Also pp 103-128 in Tarp, F., Hjertholm, P., eds. 2000. Foreign aid and development.
Lessons learnt and directions for the future. Routledge Studies in Development Economics: London
48 igc Hansen, H., Tarp, F., 2001. Aid and growth regressions. Journal of Development Economics 64, 547-
570
49 i Heller, P.S., 1975. A model of public fiscal behavior in developing countries: Aid, investment, and
taxation. American Economic Review 65, 429-45
50 sgc Hudson, J., Mosley, P., 2001. Aid policies and growth: In search of the Holy Grail. Journal of
International Development 13, 1023-1038
51 g Islam, A., 1992. Foreign aid and economic growth: An econometric study of Bangladesh. Applied
Economics 24, 541-44
52 gc Jensen, P.S., Paldam, M., 2004. Can the two new aid-growth models be replicated? Public Choice
forthcoming
53 g Kellman, M., 1971. Foreign assistance: Objectives and consequences: Comments (to Griffin and
Enos, 1970). Economic Development and Cultural Change 20, 142-154
54 i Khan, H.A., Hoshino, E., 1992. Impact of foreign aid on the fiscal behaviour of LDC governments.
World Development 20, 1481-1488
55 i Khilji, N.M., Zampelli, E.M., 1994. The fungibility of U.S. military and non-military assistance and
the impacts on expenditures of major aid recipients. Journal of Development Economics 43, 345-362
56 gc Kosack, S., 2003. Efective aid: How democracy allows development aid to improve the quality of life.
World development 31, 1-22
57 g Landau, D., 1986. Government and Economic Growth in the less Developed Countries: An empirical

29
study for 1960-1980. Economic Development and Cultural Change 35, 35-75
58 g Landau, D., 1990. Public choice and economic aid. Economic Development and Cultural Change 38,
559-575
59 sig Larson, J.-D., 2001. An updated analysis of Weisskopf’s savings-dependency theory. Review of
Development Economics 5, 157-167
60 sg Lensink, R., 1993. Recipient Government Behavior and the Effectiveness of Development Aid. De
Economist 141, 543-62.
61 ig Lensink, R., Morrissey, O., 2000. Aid instability as a measure of uncertainty and the positive impact
of aid on growth. Journal of Development Studies 36, 30-48
62 gc Lensink, R., White, H., 2001. Are there negative returns to aid? Journal of Development Studies 37,
42-65
63 i Levy, V., 1987. Does concessionary aid lead to higher investment rates in low-income countries?
Review of Economics and Statistics 69, 152-156
64 ig Levy, V., 1988. Aid and growth in Sub-Saharan Africa: The recent experience. European Economic
Review 32, 1777-1795
65 gc Lu, S., Ram, R., 2001. Foreign Aid, government policies, and economic growth: Further evidence
from cross-country panel data for 1979-1993. Economia Internazionale/International Economics 54,
15-29
66 ig Mahdavi, S., 1990. The effects of foreign resource inflows on composition of aggregate expenditures
in developing countries: A seemingly unrelated model. Kyklos 43, 111-137
67 i Mavrotas, G., 2002. Foreign aid and fiscal response: Does aid disaggregation matter?
Weltwirtschaftliches Archiv 138, 534-559
68 g Mbaku, J.M., 1993. Foreign aid and economic growth in Cameroon. Applied Economics 25, 1309-
1314
69 i McGillivray, M., 2000. Aid and public sector behavior in developing countries. Review of
Development Economics 4, 156-163
70 i McGowan, P.J., Smith, D.L., 1978. Economic dependency in black Africa: An analysis of competing
theories. International Organization 32, 179-235
71 i McGuire, M.C., 1987. Foreign assistance, investments, and defense: A methodological study with an
application to Israel, 1960-1979. Economic Development and Cultural Change 35, 847-873
72 gc Moreira, S.B., 2003. Evaluating the impact of foreign aid on economic growth: A cross-country study
(1970-1998). WP for 15th Annual Meeting on Socio-Economics, Aix-en-Provence, France
73 g Mosley, P., 1980. Aid, savings and growth revisited. Bulletin of the Oxford University Institute of
Economics and Statistics 42, 79-95
74 ig Mosley, P., Hudson, J., Horrell, S., 1987. Aid, the public sector and the market in less developed
countries. Economic Journal 97, 616-641
75 g Mosley, P., Hudson, J., Horrell, S., 1992. Aid, the public sector and the market in less developed
countries: A return to the scene of the crime. Journal of International Development 4, 139-50
76 g Most, S., Berg, H.v.d., 1996. Growth in Africa: Does the source of investment financing matter?
Applied Economics 28, 1427-1433
30
77 g Murthy, V.N.R., Ukpolo, V., Mbaku, J.M., 1994. Foreign aid and economic growth in Cameroon:
Evidence from cointegration tests. Applied Economic Letters 1, 161-163
78 i Otim, S., 1996. Foreign aid and government fiscal behaviour in low-income South Asian countries.
Applied Economics 28, 927-933
79 s Ouattara, B., 2004. The Impact of project aid and programme aid inflows on domestic savings: A case
study of Ĉote d’Ivoire. WP Univ. of Manchester
80 gc Ovaska, T., 2003. The failure of development aid. Cato Journal 23, 175-188
81 sp Over, A.M., 1975. An example of the simultaneous-equation problem: A note on foreign assistance:
Objectives and consequences. Economic Development and Cultural Change 23, 751-756
82 sg Papanek, G.F., 1973. Aid, foreign private investment, savings, and growth in less developed
countries. Journal of Political Economy 81, 120-130
83 i Quazi, R.M., 2004. Foreign aid and capital flight. A case study of Bangladesh. Journal of the Asia
Pacific Economy 9, 370-393
84 sp Rahman, A., 1968. Foreign capital and domestic savings: A test of Haavelmo’s hypothesis with cross-
country data. Review of Economics and Statistics 50, 137-138
85 g Ram, R., 2003. Roles of bilateral and multilateral aid in economic growth of developing countries.
Kyklos 56, 95-110
86 gc Ram, R., 2004. Recipient country’s “policies” and the effect of foreign aid on economic growth in
developing countries: Additional evidence. Journal of International Development 16, 201-211
87 sg Rana, P.B., Dowling, J.M., 1988. The impact of foreign capital on growth: Evidences from Asian
developing countries. The Developing Economics 26, 3-11
88 sg Reichel, R., 1995. Development aid, savings and growth in the 1980s: A cross-section analysis.
Savings and Development 19, 279-296.
89 gc Roodman, D., 2004. The anarchy of numbers: Aid, development and cross-country empirics. WP 32
Center for Global Development
90 gc Shukralla, E.K., 2004. Aid, incentives, polices, and growth: Theory and a new look at the empirics.
WP Western Michigan Univ.
91 sg Singh, R.D., 1985. State intervention, foreign economic aid, savings and growth in LDCs: Some
recent evidence. Kyklos 38, 216-232
92 s Snyder, D.W., 1990. Foreign aid and domestic savings: A spurious correlation? Economic
Development and Cultural Change 39, 175-181
93 g Snyder, D.W., 1993. Donor bias towards small countries: An overlooked factor in the analysis of
foreign aid and economic growth. Applied Economics 25, 481-488
94 i Snyder, D.W., 1996. Foreign aid and private investment in developing economies. Journal of
Economic Development 8, 735-745
95 g Stoneman, C., 1975. Foreign capital and economic growth. World Development 3, 11-26
96 gc Svensson, J., 1999. Aid, growth and democracy. Economics and Politics 11, 275-297
97 gc Tebouel, R., Moustier, E., 2001. Foreign aid and economic growth: The case of the countries south of
the Mediterranean. Applied Economic Letters 8, 187-190


