
Conflicts of Interest and Mutual Fund Portfolio Choice:
Attracting Flows by Attracting 401(k) Plans1
Lauren Cohen
Yale School of Management
Breno Schmidt
Marshall School of Business
University of Southern California
July 22, 2006
1We would like to thank Andrew Ang, Nick Barberis, Joe Chen, Judy Chevalier, James Choi, MartyGruber, Chris Jones, Owen Lamont, Pedro Matos, John Matsusaka, Toby Moskowitz, Lubos Pastor, Nag-purnanand Prabhala, Josh Rauh, and Jeff Wurgler for their helpful discussions and suggestions. We arealso grateful to seminar participants at Yale University and the University of Southern California for use-ful comments. Correspondence to: Lauren Cohen, Yale School of Management, 135 Prospect Street, NewHaven, CT 06520. E-mail: [email protected].

Abstract
We explore a new channel through which mutual fund families can attract substantial inflows: se-
curing trusteeships of 401(k) plans. Using a unique dataset of hand matched 401(k) plans and their
trustees, we find that mutual fund families significantly overweight the 401(k) sponsor firms stock in
order to secure and retain a trusteeship. Mutual fund trustees increase their sponsor stock holdings
when becoming a trustee and decrease sponsor ownership when terminating the trustee relationship.
This overweighting is not explained by superior information. Trustee overweighting is significantly
more pronounced when the conflict of interest of the trustees is more severe and when other mu-
tual funds are selling the sponsor firms stock. We quantify a potentially large benefit to the 401(k)
sponsor firm of having its price propped up by its trustee fund’s increased overweighting precisely
when other firms sell its stock. We also estimate the resulting loss to mutual fund investors, which
for some fund family-sponsor firm pairs can be large.
JEL classification: G11, G23, J26
Keywords: Conflicts of Interest, Portfolio Choice, Retirement Savings, Mutual Funds

Introduction
Nearly 40 percent of all mutual fund assets are held between Defined Contribution Plans and In-
dividual Retirement Accounts. This percentage has been steadily increasing, largely because these
retirement accounts represent the majority of new flows into non-money market mutual funds (60%
in 2004)1. With such a large and growing percentage of their assets coming from retirement ac-
counts, mutual funds are likely to be interested in securing these assets. Previous literature on the
agency problems associated with increasing funds under management has concentrated on the flow-
performance relationship2. In this paper we suggest and find evidence for a new channel through
which mutual fund families can attract assets: their ability to become a 401(k) plan’s trustee. We
provide evidence that fund families make specific portfolio choice decisions to secure this trustee re-
lationship, thereby attracting and retaining a large portion of these retirement assets. These actions,
however, are likely to be in conflict with the fiduciary responsibility mutual funds have with their
investors, and can impose potentially large costs.
The trustee position in 401(k) plans plays a fundamental role in our analysis. Under the United
States Code, 401(k) plans must appoint a trustee, who holds fiduciary responsibility over the plan
assets3. Included in the duties of fiduciary responsibility are the obligation to act in a “prudent”
manner regarding employee contributions, and to make sure that the plan offers a diversified and
suitable set of investment options to plan participants4. Thus, it is the trustee along with the other
fiduciaries (usually company affiliates) that decide which investment options will be available to the
company employees.
Many plans employ large mutual fund families (often with pension management divisions) as
their trustee. Perhaps not surprisingly, in most plans the majority, and in some cases all, of the fund
1These numbers reflect 2004 and are taken from the Investment Company Institute (2005), Federal Reserve Flowof Funds, and Department of Labor. These non-money market funds are termed “long term” mutual funds by theInvestment Company Institute. Individual Retirement Accounts (IRA) and Defined Contribution Plans (DC) togetherheld 3.1 trillion dollars in mutual funds (DC held 1.6, IRA held 1.5) out of a total 8.1 trillion dollars in the entireuniverse.
2Chevalier and Ellison (1997), Sirri and Tufano (1998), Goetzmann and Peles (1997), and Brown et al. (1996) are afew of the papers that document a convexity in the flow-performance relationship, and how it can affect mutual fundincentives and portfolio decisions.
3This requirement is outlined in the Employee Retirement Income Security Act of 1974 (ERISA) and Title 29Ch.18 of the United States Code.
4Title 29, Ch. 18, SUBCHAPTER I, Subtitle B, part 4, Section 1104.
1

options are those of the trustee (Huberman and Jiang (2005), Elton et al. (2005)). For example, in
2000, Putnam was the trustee of Wm. Wrigley Jr. Co.’s 401(k) plan. This plan offered 9 investment
options. One was Wrigley Co. stock. The other 8, including the money market fund, were Putnam
mutual funds5.
From the family’s perspective, 401(k) plans are attractive clients for several reasons. First, by
becoming the trustee of a large 401(k) plan, the family guarantees a large inflow of money in the form
of plan assets invested in family funds. In our sample, the average 401(k) plan has over $ 640,000,000
in assets, which corresponds to about 5.2% of the total assets held by the average family. Second,
the employees become captive investors in the plan options. A typical 401(k) plan in our sample
will have approximately 13 options, one of which is company stock and one a money market funds.
The majority, if not all, of the remaining options are mutual funds to be chosen (at least in part)
by the trustee. Employees are only able to invest, and move their 401(k) retirement assets, between
these plan options. Thus in addition to the initial large inflow, the trustee fund family will receive
additional flows in retirement contributions as the employees save each year. Third, 401(k) plans do
not change trustees often. In our sample, the unconditional probability that a company will change
trustees in a given year is around 3.4%. This could be because of search costs, administrative costs,
the cost to employees of rebalancing, etc. Thus, the expected future benefits of the relationship are
relatively long lived. Fourth, we empirically observe employees tilting their portfolios in 401(k) plans
to higher fee funds. Of the nearly 1.1 trillion dollars invested by defined contribution plans in mutual
funds, only about 250 billion is invested in money market and index funds (Investment Company
Institute (2005a))6. The remaining 76% of these assets are in higher fee alternatives, which generate
a higher relative fee revenue for families.
For these reasons, mutual fund families may find it valuable to secure trusteeships of 401(k) plans,
even if at expense of other investors. As there are gains to be made by a mutual fund increasing
assets under management (Brown et al. (1996), Chevalier and Ellison (1997, 1999)), families may
engage in actions to attract the large, stagnant, and captive assets of 401(k) plans. In this paper,
5From telephone conversations with a number of our largest trustee fund families, the accounting for the 401(k)plan assets is essentially as follows: the company stock account in the plan is held by the firm itself, while the assetsin the mutual funds are held by the respective mutual funds.
6401(k) plan assets make up the vast majority of all defined contribution assets in mutual funds, 73%.
2

we focus specifically on the observable distortions in the families’ equity holdings7. This presents a
conflict of interest within the fund families: by distorting its portfolio, the family violates its fiduciary
duty to provide the best investment opportunities to its entire set of investors.
Our main hypothesis of fund families distorting their portfolio allocations to secure a trustee
relationship leads to several testable implications: First, trustee families will hold disproportionately
more of the 401(k) sponsor firm’s stock, which we will term “overweighting”8. This allows the family
to better influence the price of the sponsor stock. Second, securing the trustee relationship will be
more valuable for (i) relatively smaller fund families and (ii) relatively larger 401(k) plans. Larger
401(k) plans imply larger benefits for the family (in the form of inflow and fees) and these benefits
are relatively more important to smaller families. Third, families should increase their position in
the stock once they become trustee and decrease it when this relationship ends. Fourth, families will
try to mitigate price variations in the company’s stock, for instance by buying or holding the sponsor
stock when all other families are selling large quantities. In this paper, we find supporting evidence
for these predictions.
We find that families acting as trustees do systematically overweight the sponsor firms. One
measure we use is the proportion of the firm held by the family. Controlling for other firm, family,
and plan characteristics, trustee families hold significantly more in sponsor firms (over 53% more on
average). This translates into holding on average about $ 64,000,000 more in each one of the sponsor
firms, which implies a total distortion over the entire industry of more than 25 billion dollars9. It
could be that upon becoming trustee, the mutual fund family is privileged to superior information
about the firm. We find, though, that trustees are no better at predicting the future return of the
7There are a number of potential ways a family could be “purchasing” a trusteeship. If the fund family paysthrough trips to Europe or expensive automobiles, we will not observe this. However, one disadvantage of thesepayment methods is they are more easily identifiable as illegal, which may discourage their use. Davis and Kim (2005)find some evidence of ties with pension funds affecting voting, which we discuss further in Section II.
8“Sponsor” firm refers to the firm that sponsors the 401(k) plan to which the trustee has been hired. We will beusing this terminology throughout the paper.
9These numbers were calculated using the estimated increases in holdings attributed to the trustee relationship(using the estimates in Column2 of Table IV). For each observation, we first compute the fitted value implied byour regression, log(PctSharesOut). From these estimates, we calculate the fitted dollar value of each holding asHolding = exp( log(PctSharesOut)) ×ME, where ME stands for the market value of the given company. We thenaverage the estimated holdings for trustees and non-trustees separately to get 83.47 billion and 19.46 billion dollarsrespectively. The estimated increase due to trustee relation (i.e. implied by the Trustee coefficient) is the differenceof these averages. The total distortion is then found by multiplying this difference by the average number of sponsorfirms per year in our sample (392 from Table I).
3

sponsor firm than other mutual fund families.
Our hypothesis predicts that overweighting will be more severe for larger 401(k) plans and smaller
families, ceteris paribus. Consistent with this we find that trustees of larger 401(k) plans overweight
significantly more. Controlling for firm and family characteristics, a one standard deviation increase
in plan assets results in the average trustee overweighting by over $ 86,000,000 more in the sponsor
firm. In addition, smaller mutual fund families overweight significantly more than larger families,
all else equal. A trustee family that is one standard deviation smaller than average overweights by
about $ 32,000,000 more in the sponsor’s stock10.
As a more precise test of this conflict of interest effect on overweighting, we then look at distortions
in allocations when the trustee of a given firm’s 401(k) plan changes. We find that the fund families
significantly increase the amount invested in the stock during its first two years as a trustee (6.5%
increase in the purchases), and then decrease the amount invested in trustee stock in the year after
it stops being trustee (6.0% decrease in the purchases on average).
We then look at a specific benefit that the trustee can give to the sponsor firm: holding or even
buying shares of the sponsor firm when other funds are selling large amounts. These are the times
when the company is most concerned about downward price pressures, and when the trustee can be
most useful by buying or holding the sponsor’s stock. To test this hypothesis, we identify these times
in a number of ways. The first is by looking at the aggregate amount of selling by other families.
We find that when other fund families are (on aggregate) selling more than 1% of the total shares
outstanding of the sponsor firm, the trustee takes the opposite position by significantly increasing
its holdings. While non-trustees significantly decrease their holdings by 2.6% on average, the trustee
significantly increases its position on the stock by 11.67%. Similar conclusions follow from defining
bad times using negative Cumulative Abnormal Returns (CAR) around earnings news.
We quantify the benefit of trustee increased overweighting around bad times, by looking at the
price impact that the significant share purchasing of the trustee can have on the sponsor firm’s stock
price. Using estimates of demand elasticities from previous literature, we find the trustee props up
the 401(k) sponsor firm’s price by 154 basis points by buying large amounts of shares when other
10These numbers were computed in a way similar to that described in footnote 9. We repeated those calculationsafter increasing the size of the plan by one standard deviation and then again after decreasing the size of the plan byone-standard deviation.
4

funds are selling. This implies over an 11% propping up of price, a real and potentially large benefit
to the 401(k) sponsor firm.
Lastly we examine and quantify the welfare effects of this conflict of interest on investors in the
mutual fund families. We use loss in risk adjusted returns, and find that although the average losses
tend to be small over the length of the trustee-sponsor firm relationship (ranging from 1-8%); the
losses for investors in smaller fund families with larger 401(k) plans can be substantial (ranging from
3-37%).
The paper is organized as follows. Section I provides a description of the data. Section II presents
our initial empirical design and results on trustee allocation. Section III provides additional evidence
and specific benefits to the firm of the trustee relationship. Section IV provides estimates of the
costs to fund family investors and also price impact of their purchasing when other funds are selling
large amounts. Section V concludes.
I Data
The main dataset we use in the paper is a hand-matched dataset of (i) retirement plans sponsored by
publicly traded firms and (ii) the stock holdings of mutual fund families. In this section we describe
how we collected information on 401(k) plans, the mutual fund family holdings data we use, and how
we matched these two datasets.
I.A 401(k) data
We gather information on 401(k) plans from Form 11-K documents filed by firms to the SEC and
Form 5500 Filings filed to the Department of Labor (DOL)11. The 11-K data (SEC) is available from
1994-2004 (which corresponds to fiscal years 1993-2003). Over this sample period, we hand collect
all documents. Thus, our initial sample represents the entire universe of firms filing 11-K’s with the
SEC. In the 11-K document, both total plan assets invested in the 401(k) plan and trustee of the
401(k) plan are generally available. Our Form 5500 sample is from 1995-2004. The Form 5500 also
11The specific plans that need to file 11-K documents are those 401(k) plans that have company stock as an option,and issue new shares for the plan. This encompasses almost all of the largest 401(k) plans, and makes up 60% of theuniverse of total 401(k) assets. Regarding Form 5500, any firm that sponsors an employee benefit plan that qualifiesunder the Employee Retirement Income Security Act of 1974 must file a Form 5500 with the Department of Labor.
5
has information on plan assets and trustees, although it is not nearly as complete as 11-K data for
our sample of firms. One data item we do collect from the Form 5500 are the fees paid to the trustee
for trustee services.
The initial dataset contains over 2500 companies. To be included in our sample, however, the
company has to meet the following requirements. First, we need to be able to identify the company
in the CRSP database. Companies in our 401(k) dataset are identified by their IRS Employer
Identification Number (EIN). We use the CRSP/Compustat Merged Database to map the EIN’s
into PERMNO’s, CRSP’s primary stock identifier. We then checked each match by looking at the
company’s name. The CRSP/Compustat database doesn’t have historical EIN’s and so we couldn’t
always find a PERMNO match for each company in our initial dataset. Once the company is
identified, we exclude financial companies (SIC codes between 6000-6999). We do this as they are
usually the trustee of their own plan, and there are likely other incentives and restrictions for holding
their own stock. This gives us 1537 companies. The final requirement is that we can identify the
trustee of the company as a mutual fund family. Not all companies report their trustee and not all
trustees are mutual fund families. Keeping only those plans that reported one of the mutual fund
families in our sample as their trustee leaves us with a total of 899 companies.
Companies often have more than one 401(k) plan. In the vast majority of cases, all plans from a
given company belong to the same trustee. Whenever this happens, we sum the plan assets of the
plans. In the few cases where the company had two different trustees, we kept only the largest plan.
This ensures that, at a given point in time, there is only one trustee for each one of the companies in
our sample. Finally, we start our sample in 1993 (reported in 1994), as this is the first date available
on SEC’s EDGAR electronic filing system.
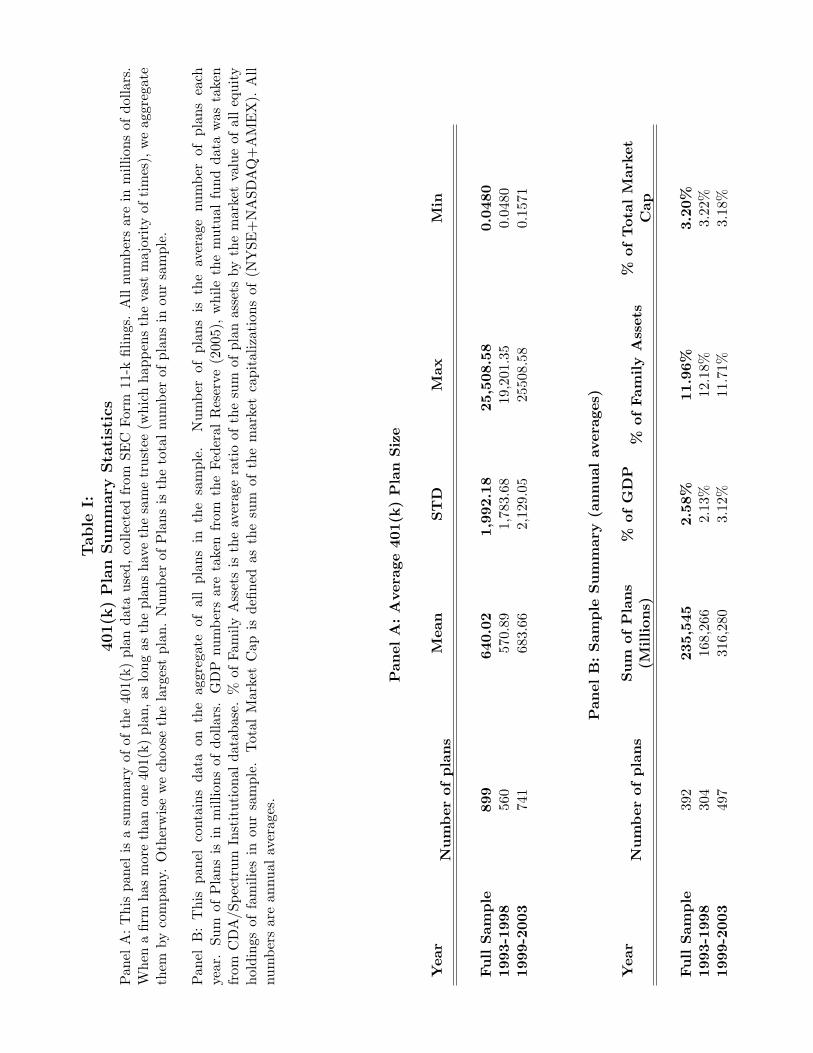
Table I lists summary statistics for the 401(k) plans. The average size of a retirement plan in our
1993-2003 sample is roughly 640 million dollars. Plan sizes are in general increasing over the sample,
and the aggregate size of our sample peaked in 2003 at 421 billion dollars. In 2003, the largest plan
in our sample had plan assets of nearly 22.6 billion dollars. The second and third largest plans that
same year had plan assets of roughly 21.5 billion and 20.8 billion dollars, respectively. Our sample
size averages 414 firms per year, and the total sum of all plans’ assets averages about 235 billion
dollars per year. To put this into perspective, this represents on average over 2.58% of annual GDP,
6

and about 3.2% of the entire market capitalization (NYSE+NASDAQ+AMEX).
I.B Mutual fund holdings
Our data on mutual fund holdings comes from the CDA/Spectrum Institutional database. This
database contains the quarterly holdings of virtually all US investment companies12.
We focus on large mutual fund families since they better represent potential trustees for 401(k)
plans. Specifically, in each quarter, families are sorted by the market value of their holdings of CRSP
stocks and the largest 100 families identified. Our sample includes all families that, at some point in
time, are among those top 100 (i.e. if a family happens to be among the largest 100 families in the
second quarter of 1999, it will be included in our sample in every quarter from 1993 to 2003). Our
final sample consists of 219 mutual fund families. Over 95% of the trustees identified as a mutual
fund family are among the families in our final sample. In addition, these families represent over
80% of the total mutual fund industry, as measured by the market value of equity holdings.
We are mainly interested in comparing the holdings of the trustee family in the sponsor firm
with those of a similar family. Our identifying variation is thus across-family holdings and so we
consider only families’ holdings of companies in our 401(k) dataset. However, as explained below,
all equity holdings are included in the computation of aggregate measures, such as the total assets
under management13. We present summary statistics of the mutual fund families in our sample in
Table II. In Panel A, the average fund family in our sample has approximately 12.2 billion dollars
in Total Net Assets (TNA)14. Comparing the TNA of trustee and non-trustee fund families, we see
that 401(k) plan trustees are on average the larger families.
12The primary source of holdings data is the 13f forms that investment companies with more than 100 milliondollars under management are required to file with the SEC on a quarterly basis (Securities Exchange Act Section3(a)(9) and Section 13(f)(5)(A)). Smaller companies are permitted to file as well, and many actually do. Thus, dataon smaller families may be inconsistent and have a selection bias. However, as explained below, we will only focus onlarge mutual fund families.
13Another reason why only holdings of companies in our 401(k) dataset are included is for homogeneity of sampleacross tests. Some of our tests (e.g. changes in trustees) necessarily include only such companies.
14Throughout the paper, we refer to TNA as being the sum of the market value of the equity holdings of a family.The averages in Table II are taken over all families and all quarters
7

I.C Matching Retirement Data To Other Sources
The final step is to identify the trustees in the mutual fund dataset. We used the family name to
match each company’s trustee to its corresponding family in the CDA database. In sum, our final
sample spans from 1993 to 2003 and contains the number of shares each one of the 251 families in our
sample owns of each of the 899 publicly traded companies whose 401(k) plan’s trustee we matched
as a mutual fund family.
I.D Variable Construction
We will focus on two measures of holdings as dependent variables, (i) how much of the family’s
assets are invested in a given stock (PctTNA), and (ii) what fraction of the total company the
family’s holdings represent (PctSharesOut). Our first measure, PctTNA, for a given firm-family
pair is measured as the market value of shares of the firm held by the specific family, divided by
the family’s total TNA. So if family f owns 10 billion dollars worth of firm s, and has TNA of 100
billion dollars, PctTNA for this observation will be 0.10. As such, it is a holdings measure from the
point of view of the family. The company, however, is interested in the proportion of its shares the
family currently holds. From the company’s point of view, the more relevant variable is our second
measure, PctSharesOut, which measures the percent of shares outstanding of the company held by
a given family. For the same family f -firm s pair as above, if the total market value firm s were 40
billion dollars, then PctSharesOut for the same observation will be 0.25. For some tests we will also
use a measure of time series changes in holdings, Change. Change is measured as the number of
shares held this period divided by the number of shares held last period, adjusted for splits15.
Throughout the paper, we will use a number of variables as controls for company and family
characteristics. Size (ME), is the company’s market value at the last day of the most recent quarter.
Book-to-market (BM) is the ratio of the book-value at the end of the firm’s fiscal year during the
calendar year preceding the formation date to the market value at the end of the preceding December.
Past Returns are computed as the cumulative past returns of the firm over the previous 11 months
15There are several reasons why we didn’t use the market value of stocks held by the family as a measure of holdings.First, larger families hold disproportionably more of all companies than smaller families. Second, price movementsgenerate changes in the market value of holdings even when the number of shares held by the company doesn’t change.
8
(not including the last month of the quarter). Future Returns are computed as the cumulative future
returns of the firm over the next 11 months. Market Weight is measured as the weight of the stock
in CRSP’s value weighted market index. Finally, the total net assets (TNA) of a family is measured
as the sum of the value of all equity holdings of that family in a given quarter.
We then compute two variables to measure the investment focus of the family, percentage invested
in style (PctInvStyle) and percentage invested in industry (PctInvInd). To construct PctInvStyle,
following Daniel et al. (1997), we create 27 style portfolios based on a triple sort on size, book-to-
market and momentum16. On each July, stocks are first sorted into 3 groups based on each firm’s
market equity on the last day of June. Then, the firms within each size group are further sorted into
3 groups based on their book-to-market ratio. Finally, the firms in each of the 9 size-BM portfolios
are then sorted into 3 groups based on their preceding twelve-month return. Once these portfolios are
constructed and each stock is assigned a particular style, PctInvStyle is compute as the proportion
of the family’s TNA in a given style. We construct PctInvInd in a similar manner, but across
industries. So, for each industry, defined by 2-digit SIC code, we calculate the proportion of the
family invested in this industry. To give an example, if at a given point in time firms s and h are in
the same style category and industry, and are both held by the same family f , then they will have
identical values of PctInvStyle and PctInvInd.
In our time series tests, we will make use of changes over time in these explanatory variables.
In addition, we will be using the following two independent variables: cumulative abnormal return
(CAR) and percentage of company sold (PctCompSold). CAR is measured as the cumulative return
from 2 days prior to 2 days after the earnings announcement date from CRSP, minus the CRSP
value weighted index return. PctCompSold is measured as minus the change in total number of
shares held by all families in the CDA database from time t − 1 to time t. So if fund families held
an aggregate of 10% of the shares of firm s last quarter, and hold 11% this quarter, PctCompSold
for firm s would be -1.
16The construction of these portfolios and the criteria used for the inclusion of the stocks is very similar to thosein Daniel et al. (1997). The main difference is that Daniel et al. (1997) constructed 125 style portfolios, as opposedto our 27. We only give a brief description of the construction of these portfolios and the reader is referred to theirpaper for further details.
9

II Conflicts of Interest
In this section we document the initial empirical evidence regarding the conflict of interest in the
market for 401(k) plans. Specifically, we show that controlling for other firm, fund, and plan char-
acteristics, the trustee of a 401(k) plan significantly overweights that 401(k)’s sponsor stock in its
portfolio. Davis and Kim (2005) also examine how pension fund ties affect mutual fund companies,
focusing mainly on effects on the funds’ proxy voting. They also look at overweighting for their six
largest pension tie firms and find no significant effect. The differences between our results and those
of Davis and Kim (2005) are driven by (i) our focus solely on the trustee relationship while they
examine all ties to 401(k) plans, whereas the ties they examine are any relationship of the pension
fund to the mutual fund, including administrative services and custodial services (which are the day
to day services of the plan), and (ii) our use of an eleven year panel while Davis and Kim (2005)
examine a one year cross section.
We focus on the trustee relationship as the trustee is involved with the choosing of investment
options. We expect this to be the strongest tie, as the potential gains from syphoning funds far
outweighs that of the direct trustee fees. In fact, a study done by the Department of Labor in
1998 (DOL (1998)), found that 90% of total fees paid by a 401(k) plan are investment management
fees. In our sample, we estimate this using trustee fees and an estimate of investment management
expenses paid by 401(k) plan investors. We calculate trustee fees from the Form 5500 filings, and use
the average mutual fund management expenses (loads, expense ratios, and 12b-1 fees) from CRSP
as an estimate for investment management expenses17. Both are in Panel B of Table II. We estimate
the average annual expense revenue from attracting a 401(k) plan to be close to 10 million dollars
(average size of the plan, 640 million, times 1.56%). This is almost 67 times the trustee average fee
revenue of 150 thousand dollars, indicating that investment management expenses far outweigh the
relatively small trustee fees received by the families18. Given this we expect fund families to be more
17We were concerned that perhaps 401(k) participants get some kind of discount on fees through their plans.However, in telephoning representatives from three of our largest trustee families, they indicated that none of themgave discounted fees on funds in the 401(k) plans. Thus, we believe the expenses in CRSP should be a reasonableestimate for the investment management expenses paid in the plans.
18As explained above, not all investment options necessarily belong to the trustee. However, even if only a fractionof the plan assets is invested in the trustee family, the benefits from management fees far exceed those from the trusteefees
10
interested in becoming (and remaining) trustees in order to benefit from the investment management
revenues it brings.
On the issue of the difference in samples between Davis and Kim (2005) and our paper, we restrict
our sample to the six families they consider. Focusing only on the trustee relationship and using our
11 year panel, we find, consistent with our results on other trustees, a significant overweighting of
these trustees in their sponsor firm’s stocks19.
II.A Conflicts of Interest: Univariate Results
The specific action we test for in this section is the overweighting of the 401(k) sponsor firm’s stock
in the trustees’ fund portfolios. According to our hypothesis, a firm may value overweighting of its
shares by a fund because (i) it pushes up the price of the firm’s shares while the fund purchases and
(ii) it decreases the response to negative shocks, as the firm has a block of shares which are not sold
by the trustee. We show in this section and Section III that firms both overweight the sponsor firm
stock and increase this overweighting around times of negative shocks.
We will first show the fund overweighting in a univariate setting, and then use a regression
framework to separate out other factors driving mutual fund portfolio choices. As overweighting
can be measured using different metrics (each with shortcomings), we test for a variety of holdings
measures of the trustee firm in Table III. The first is the market value of the sponsor firm in the
fund family’s portfolio. In Table III, for each sponsor firm, we compare the average holdings of its
trustee family relative to all other mutual fund families. The trustee holds on average 188 million
dollars worth of the sponsor firm’s stock in his portfolio, while all other fund families hold only an
average of 24 million dollars of the same firm (t = 11.25 for the difference). As a percentage of
shares outstanding of the trustee firm (PctSharesOut), the trustee holds on average 2.19% while
all other fund families hold on average only 0.78% (t = 20.72 for the difference)20. This is about 3
times larger of a holding by trustees in the sponsor firm than other fund families, and is a roughly
$ 87,000,000 difference. The difference, though, may be driven by the fact that trustees are larger
fund families on average (from Table II), so hold more in absolute terms of every stock than non-
19These results are available upon request.20The t-statistics in this section are calculated using a Newey-West adjusted standard error with four lags.
11

trustee fund families. To control for this difference in family size, we look at the average holding
of the trustee stock as a percentage of the total net assets of the fund family. Again, we see the
trustee significantly overweighting the trustee relative to all other fund families in terms of PctTNA.
Although the difference between the two 0.168% and 0.092% looks small in magnitude, it implies a
much larger dollar difference. The trustees are much larger funds, and so the dollar difference implied
by this is still $ 42,000,000.
II.B Conflict of Interest: Regression Results
In the regressions of Table IV, we separate out the effect of other characteristics determining mutual
fund portfolio choice. Each dependent variable observation can be thought of as a triple (f, s, t),
where f is the family, s represents the stock and t is the quarter. So, for example, the holdings of
family f in firm s in the first quarter of 1995 would be one observation. Our main variable of interest
is Trustee, which is a categorical variable that identifies the times when a trustee mutual fund family
is holding stocks of it’s sponsor 401(k) plan firm. Thus, Trustee(f, s, t) is 1 if, at time t, family f is
the trustee of company s, and it is 0 otherwise. The control variables, and their construction, were
described in Section I. We include firm characteristics of log(ME), log(BM), and past year returns
(Past Returns), to control for firm specific reasons a fund may be weighting in a security. For fund
family controls, we include log(TNA) to control for the size of the family, and the two variables
to proxy for the investment focus of the family discussed above, PctInvStyle and PctInvInd. We
include these as it might be that a fund family overweights in the trustee, but decreases the weight
in a similar stock (same style or industry) to keep total style or industry exposure the same. Market
Weight is also included, and is the weight the stock would receive if the fund simply invested in line
with the (CRSP) value weighted market portfolio, which helps control for index fund weightings’ in
the various stocks. We also include family and quarter fixed effects as they control for family and
time specific variability.
We use two dependent variables in Table IV. The first is log(PctSharesOut), and measures
the percentage of firm’s shares outstanding the family holds (Columns 1 to 4). The second is
log(PctTNA), which measures the percentage of TNA that the firm makes up for the given family
(Column 5). We focus mainly on log(PctSharesOut) throughout the paper, as from the sponsor
12

firm’s perspective of the benefits of trustee overweighting, this is the more relevant measure. All our
conclusions hold irrespective of the measure used.
Column 1 of Table IV shows the regression run with all of the above controls, excluding the fixed
effects, and with unadjusted standard errors. We do this to show that the magnitudes we’ll see in
future regressions are not dependent on the inclusion of the fixed effects. Column 2 has the same
specification but with family and quarter fixed effects, and clustering the standard errors at the firm
level. We will use these fixed effects and the clustering of the standard errors by firm in all future
OLS regressions21. From Column 2, the coefficient on the variable of interest, Trustee, indicates
that, controlling for other firm and family characteristics, a trustee invests e0.4267 − 1 = 53.2%
(t = 7.41) more in the sponsor firm than other families. This translates into an overweighting of
about $ 64,010,720 more in each one of the sponsor firms22 Other coefficients affecting the holdings
decision are size, (the larger the firm, the smaller percentage of entire shares outstanding the average
family holds) and TNA (larger fund families hold larger amounts of stock as a percentage of shares
outstanding). Both coefficients are highly significant. In addition, families seem to prefer stocks with
higher past returns (as in Carhart (1997)).
Column 3 adds the log of the size of the 401(k) plan to the regression. The number of observations
decrease here because we only look at those firm years where we have a reported level of 401(k)
plan assets. From Column 3, conditioning on size of the firm, the size of the 401(k) plan is not
significant (the correlation between the two is 0.56). However, the effect of Trustee remains the
same. Controlling now for firm, family and plan characteristics, the trustee overweights their holding
of the sponsor stock by 53.4% (t = 7.27). The last column of Table IV uses the dependent variable
log(PctTNA). The magnitudes and signs of some explanatory variables change, however the effect of
Trustee is nearly the same, implying an overweighting in terms of percentage of TNA in the sponsor
stock of 57.4% (t = 24.01).
21We have used a number of alternative specifications including firm fixed effects, and clustering the standard errorsat the fund family and the quarter level. All our conclusions remain the same.
22These numbers were computed as explained in footnote 9.
13
II.C Additional Evidence: Small Funds and Large 401(k) Plans
In this section we test another implication of this conflict of interest driven overweighting. Specifically,
we look at the effect of the size of the mutual fund and size of the 401(k) plan on the tendency of
trustees to overweight the sponsor firm’s stock. According to our hypothesis, the overweighting
documented in the previous section should be more severe for those cases when the bargaining power
of the company is higher. That is, in those cases when the company’s 401(k) plan is relatively
larger and the family is relatively smaller. We create two interaction terms to measure these two
implications. The first is Trustee ∗ log(TNA). Our hypothesis predicts that this interaction term
should be significantly negative. As the mutual fund trustee gets smaller, it should find a given
401(k) plan more attractive, as it will represent a larger percentage increase in TNA for the smaller
fund. The second interaction term is Trustee ∗ log(401(k)Size). We expect this interaction term
to have a significantly positive coefficient. The larger the plan, the larger of a benefit that a given
mutual fund will receive for attracting it, so the higher the bargaining power of the company.
The tests for both of these interaction terms are in the first column of Table V. Consistent with
the fund family conflict of interest driving the overweighting in sponsor firm stock, we find evidence
for a more severe conflict of interest (significantly more overweighting) in both mechanisms mentioned
above. First, controlling for other firm, fund, and plan characteristics (including size of 401(k) plan),
smaller fund families overweight significantly more to retain trusteeships than larger fund families.
A one standard deviation decrease in fund size implies an increased overweighting of $ 32,179,140. In
addition, controlling for other characteristics (including fund size), a given fund family will overweight
significantly more to retain larger 401(k) plans. A one standard deviation increase in the size of the
401(k) plan increases overweighting by the family by $ 86,338,000. We have also used size of 401(k)
plan as a percentage of TNA, and find similar magnitudes and significance. Both of these results are
consistent with the overweighting being driven by the family’s desire to secure the trusteeship.
II.D Alternative Explanation: Superior Information
It could be that the investment patterns we see are driven by superior information. Upon securing a
trusteeship, the mutual fund family may have access to information about the company that other
14
funds do not have. This may then cause the trustee to invest differently in the sponsor firm than
other funds 23. If the trustee were getting superior information, we would expect it to get both
positive and negative signals, and thus it is not clear that this would induce a positive overweighting
in holdings24. To test for this explanation, we simply check whether or not the trustee is better
at predicting the future returns of the sponsor firm than other stocks, and than other mutual fund
families holding the sponsor stock.
Column 2 of Table V tests the ability of fund families in general to predict future returns. The
mutual fund families in our sample don’t seem to be able to consistently predict which firms will
have higher future returns25. In Column 3, we include the interaction term Trustee*Future Returns.
This should measure the extent to which the trustee has superior ability to predict future returns of
the sponsor firm, relative to other firms and other fund families. If the trustee does trade on superior
information upon securing the trusteeship, this coefficient should be positive and significant. From
Column 3, it is not significant, and the point estimate is even slightly negative, suggesting that
superior information cannot explain the overweighting of sponsor firm’s stock that we observe.
III Changes In Trustee
The changing of trustee gives a more precise experiment to test the effect of being trustee on portfolio
choice. It also provides a more direct test of the result in Section II that families tend to overweight
the sponsor company’s stock. The idea is to test whether upon becoming (end being) the trustee
the family increases (decreases) its position in the sponsor stock.
Figure I plots the change in the family holdings of the sponsor firm before and after the trustee
change. For each company that changed trustee in our sample, we followed the change in holdings
of both the old and the new trustee from one year before the change to two years after the change26.
23Massa and Rehman (2005) show how mutual funds benefit from information spillovers within financial conglom-erates. The idea is that once a bank starts a lending relationship with a firm, it acquires superior information aboutthis borrowing firm; information which is passed over to affiliated mutual funds. In our paper, sponsor firms have allthe bargaining power and heavily influence the holdings of their trustees. Thus, even if trustee families were endowedwith superior information, our hypothesis predicts that they would not be free to use it.
24Even if the company only reveals good information to the trustee, it is not clear why the trustee wouldn’t anticipatethis behavior.
25This is consistent with the view that managers don’t have stock picking ability. See Carhart (1997), Pastor andStambaugh (2002), Jones and Shanken (2005), and references therein for a discussion.
26Our measure of holdings here is the percentage of the family’s TNA the stock accounts for. The same pattern
15

If we set the date of change to be 0, this corresponds to looking at the interval [−4, 7]. Because
we don’t know in which quarter the change took place (we only know the year of the change), we
computed a moving average of 4 quarters. The pattern that emerges is that families strongly decrease
their position on the stock after they end being the trustee, while they progressively increase their
position on the stock when they become the trustee. We are not controlling for stock and family
characteristics in the figure, and so we move to a regression framework where we can do so.
Only 3.4% of firms switch trustees each year. Thus, the total number of trustee changes we can
match with CDA holdings the year before and after the change are only 58. The rarity of the event
thus reduces the power of the test to identification from these 58 cases.
In Table VI, we break up the overweighting effect to separately estimate responses to beginning
and ending trusteeship. The dependent variable here is log(shares(f, s, t)/shares(f, s, t − 1)) and
measures the percentage change in family f ’s holdings of stock s from quarter t−1 to t. In addition to
the usual controls for firm and family characteristics, we present two additional explanatory variables:
Beginning1Y ear(f, s, t) is a categorical variable that is 1 if family f began being the trustee of com-
pany s in the year to which quarter t belongs, and is 0 otherwise. Similarly, Ending1Y ear(f, s, t) is 1
for the quarters in the year when the trustee relationship between f and s ended, and is 0 otherwise.
The variables Beginning2Y ears and Ending2Y ears are constructed in a similar manner except that
they are 1 for the year the trustee changed and the year after. Thus, Ending2Y ears(f, s, t) = 1 if
family f ended being the trustee of company s in t is a quarter belonging to the year of the change
or the year after.
From Columns 1 and 2, the effects go in the directions predicted by our hypothesis. In Column
1, where the dummies represent the year of the change, the signs go in the right direction but
the estimates are not significant. In Column 2, we allow the period dummy to be the year of
trustee change and the following year. Beginning implies that the new trustee significantly increases
percentage of shares held in the sponsor firm by roughly 6.5% (t = 2.52), and Ending suggests that
the opposite occurs, firms ending trustee decrease the amount invested in the sponsor firm by 3.4%
in the two years around the trustee change. This last coefficient is not, however, significant. These
emerges if we use changes in the percentage of the company instead. The reason we chose the percentage of the TNAis that we abstract from size of fund family issues when sponsors change trustees.
16
results combined suggest that families steadily increase their position on the sponsor stock in the
year and year after they become the trustee but revert this position more rapidly (within the year)
when they end being the trustee.
III.A Trustee Behavior Around Negative Shocks
The sponsor firm may find its relationship with the trustee more valuable at certain times; specifically,
times when there is widespread selling of the sponsor firm, causing downward price pressure. This
is when there may be more pressure on the trustee to overweight in the sponsor, and thus when the
consequences of the conflict of interest are more apparent. Our hypothesis predicts that we should
observe the biggest deviations from all other fund families at precisely these times. We test this
response of the trustee using two measures. The first, and most direct measure, is when there is
widespread selling of the sponsor stock by other fund families. Instead, these times of likely negative
price pressure and attenuated liquidity are identified through fund families selling a large percentage
of the company. We define periods of large selling as those when more than 1 percent of the shares
outstanding of a firm are being sold in aggregate by all funds in a quarter27 This allows us to examine
the trustee’s behavior (i) relative to when all other funds are on average selling and (ii) when the
sponsor firm is likely in need of the most propping up. The second measure we use is the cumulative
abnormal return (CAR) around earnings announcements as a measure of the response of the market
to earnings news. The construction of this measure follows Baker et al. (2004), however we use the
[-2,2] day abnormal return (as opposed to [-1,1]) around an earnings announcement, controlling for
the return on the CRSP value weighted market index. A negative shock will be an event where the
CAR < 0 at the closest earnings announcement of the firm before quarterly holdings are reported.
The benefit of using CAR is that it measures the market reaction to an earnings announcement,
which is free of a structural model of earnings (e.g. seasonal random walk), and from any systematic
bias in analyst forecasts. In a sense, however, this is not an ideal measure for severe liquidity shocks,
as it fails to separate “small” negative abnormal returns from “big” abnormal negative returns. It is
in the latter case that the family can be most useful to the sponsor firm28.
27In our sample, this event happens about 10% of the time.28We have also define a bad event as a time when the CAR measure is below a certain percentile. The problem
with this approach is that the results are sensitive to the choice of the breakpoint used.
17
Table VI contains the regressions. The dependent variable in the regressions is log(Change),
defined in Section I as log(shares(t)/(shares(t− 1)). Column 1 to Column 3 contain the regressions
for periods of large selling by fund families. PctCompSold measures the percentage of the company
sold in aggregate by all fund families, while PctCompSold > 1 is a categorical variables equal to
1 when PctCompSold is greater than one, and zero otherwise. We then interact this categorical
variable with the Trustee categorical variable. (Trustee ∗PctCompSold > 1) measures how trustees
behave relative to other fund families in situations where there is selling off of the sponsor firm by
the average family. If the trustee is propping up the firm especially in times all other funds are
selling, we expect this interaction term to be positive and significant. From Column 1, the coefficient
on the categorical variable PctCompSold > 1 is negative and significant, indicating that when a
large percentage of a given firm is sold in aggregate by fund families, the average family that is not
the trustee is selling that firm’s shares. From the interaction term (Trustee ∗ PctCompSold > 1),
though, consistent with the sponsor firm having some ability to exert pressure on the trustee, the
trustee does the exact opposite of the other firms. When other firms are selling on average a large
amount of the sponsor, the trustee is significantly buying the sponsor firm’s shares. The positive
and significant coefficient on (Trustee ∗PctCompSold > 1) of 0.1425 (t = 3.98) implies that trustee
increases it’s already overweighted stake in the sponsor firm by 11.67% (0.1425-0.0258) at exactly
those times when the sponsor firm may find it most valuable. Column 2 and Column 3 run the
same regression as Column 1, but separately for trustees and non-trustees. As in Column 1, while
fund families as an aggregate are selling over 1 percent of the sponsor firm, trustees are significantly
increasing their holdings of the sponsor firm (Column 2).
Column 4 - Column 6 of Table VII contain the regressions for the negative CAR measure of a
negative shock to the firm. The categorical variable CAR < 0 is equal to 1 when CAR is negative and
0 otherwise. The interaction term (Trustee ∗ CAR < 0) then tests how trustees behave differently
toward sponsor firms following a sponsor firm’s negative CAR. From Column 4, the coefficient on
CAR is positive, indicating that fund families do increase (decrease) their holdings in firms following
positive (negative) abnormal returns around earnings announcements29. The coefficient on CAR < 0
is negative but also not significant. Funds do slightly decrease their holdings following negative
29As in other regressions, this is controlling for past year returns of the firm.
18
earning’s surprises as measured by CAR, but not significantly. The positive and significant coefficient
on the interaction term (Trustee ∗ CAR < 0) also suggests, consistent with the trustee’s conflict of
interest being more severe when the sponsor firm has had a negative shock, that the trustee invests
more in the sponsor firm following negative earnings surprises. Column 5 and Column 6 reproduce
the regression of Column 4 separately for trustees and non-trustees. The coefficients on the CAR
variables are not significant in either case, but the signs go in the direction our hypothesis predicts.
Another way to examine the effect of the conflict of interest on portfolio choice at times of negative
shocks is to look at the probability of selling a firm’s stock. In Column 7 and Column 8 of Table VII
we compare the probability of other fund families selling, and the trustee selling, the sponsor firm.
We do this using probit regressions where the dependent variable Sell is equal to 1 if the mutual
fund sold the firm’s stock, and 0 otherwise. We run these probit regressions using an approach
similar to the one used by Fama and MacBeth (1973): after running probit regressions for each
quarter in our sample, we use the time series of estimates to calculate the coefficients in Table VII30.
The t-statistics in Column 7 and Column 8 are estimated using a Newey-West correction with 4
lags. Again the main variables of interest are the interaction terms (Trustee ∗ PctCompSold > 1)
and (Trustee ∗ CAR < 0). The negative and significant coefficient of -0.1941 (t = −3.33) on
(Trustee ∗ PctCompSold > 1) implies the trustee actually has a 19.41% smaller probability of
selling the sponsor’s firm stock when all other fund families are on average doing so. As before, we
were unable to find a significant effect using the interaction Trustee ∗ CAR < 0).
The evidence in Table VII further supports the idea that the conflict of interest is affecting
trustee portfolio choice. During times of aggregate selling of the sponsor firm, causing negative price
pressure, the trustee is acting in an opposite manner to other fund families, and helping to prop up
the fund’s price. Thus, at times when other funds are heavily selling sponsor firm shares, the trustee
actually significantly increases it’s already overweighted position in the sponsor.
III.B Returns to Liquidity
Coval and Stafford (2005) examines the price implications of mutual fund fire sales of securities.
30We use Fama-Macbeth to avoid some statistical problems associated with the use of fixed effects in probit regres-sions in our framework. See Greene (2002) for a discussion.
19

The paper finds that when constrained funds are forced to liquidate shares, this depresses the prices
of the firms that they sell. On the opposite side, those that provide liquidity to constrained funds
during these times earn significantly positive returns31. We want to rule out the possibility that the
results in Table VII are driven by this effect, namely that trustees provide liquidity to the sponsor
firms’ stocks in order to capture future positive returns.
Specifically, we test whether the trustee is able to obtain positive future returns by buying even
more in the sponsor firm at times when fund families on average are selling a large amount of the
sponsor. In Table VIII, we replicate their experiment using our measure of liquidity instead. We
use the quarter in which PctCompSold > 1 as our event quarter and set the last month of this
quarter as our event date, t = 0. We then look at returns in the 12 months preceding and 12 months
subsequent to the event (from t = −12 to t = 12). We use their two measures of returns, average
abnormal return (AAR) and cumulative average abnormal returns (CAAR). Abnormal returns in
both measures are defined as the firm’s return minus the return on CRSP value weighted market
index. From Table VIII, the trustee earns significantly negative returns on its overweighted position
leading up to and including the event date. For example, the CAAR for the quarter in which
the mutual fund industry is selling the sponsor firm (months -2, -1, and 0), is -5.14% (t = −5.95).
Further, although the estimated abnormal returns are positive following the mass selling, they are not
statistically different form zero, and the magnitudes are smaller than the negative returns surrounding
the event. It therefore does not appear that the trustee is compensated for the liquidity it provides by
buying significant amounts of shares in the sponsor firm, increasing its already overweighted position
at times when the mutual fund industry on aggregate is selling large amounts of the firm. We see
this as evidence that the liquidity provision in order to capture positive returns explanation may not
be able to account for the contrarian buying behavior of the trustee in Table VII.
31See Panel A of Table 4 in Coval and Stafford (2005). Note, however, that mutual funds are only able to earn highabnormal returns from providing liquidity in the case of fire sales by constrained funds. As these sells are not drivenby new information, liquidity providers earn positive returns once prices revert to their “fundamental” values. Whenmass sales include those driven by information updates, future returns from providing liquidity are smaller (Panel Bof Table 4 in their paper).
20
IV Costs To Investors and Price Impact
IV.A Costs to Investors
In Sections II and III, we present evidence of overweighting by fund families of their 401(k) client
firms, consistent with the desire of fund families to attract 401(k) clients. We now turn to a cost of
this overweighting for the current fund’s investors. Investors within a mutual fund family want the
mutual fund to maximize a risk adjusted expected return32. The fund family, on the other hand, has
the incentive to maximize assets under management, maximizing fee revenues (Brown et al. (1996),
Chevalier and Ellison (1997, 1999)). As one way to do this is to attract the large inflows from 401(k)
plans, this creates a conflict of interest if the method used to attract funds is not maximizing risk
adjusted returns.
We have shown evidence that fund families do overweight 401(k) client firms, and buy their
shares when other funds are selling, consistent with this conflict of interest affecting the fund’s
portfolio decisions. There are a number of possible ways to quantify the effects to fund investors
of this overweighting. The methodology we use is that of the loss in risk adjusted returns33. From
the regressions in Table IV, we find that controlling for other determinants of holdings, trustees
overweight the sponsor firm stock by around 64 million dollars. To determine the effect this has
on an individual, we need a measure of the average effect this has on an individual’s portfolio.
This is difficult, as we don’t know in which funds the family is putting the overweighting. It is
reasonable to think that for many families, certain of their funds (e.g. index funds) will not contain
the overweighting. In addition a family may not want to invest in a large 401(k) plan sponsor firm’s
stock (large cap) within its small cap fund. Therefore, the overweighting may be concentrated into
a subset of the family’s fund offerings. We thus present a range of results allowing the overweighting
to be spread over different numbers of the family’s funds.
The results are in Table IX. We first estimate the Sharpe ratio of the trustee fund had it not
overweighted the plan sponsor’s stock. We call this the untilted Sharpe ratio, free from the trustee-
32There are certainly other goals, such as tax considerations and current income, that some investors have. Theconflict of interest would still develop in that overweighting in the 401(k) client is likely in conflict with these goals,as well.
33This ignores their loss in returns because of the increased overweighting around negative shocks. We thereforeexpect losses to be greater when taking this behavior into account.
21

tilted overweighting. We then calculate the Sharpe ratio, and corresponding loss in Sharpe ratio, for
the overweighting varying by number of funds. In our sample, the average number of equity funds
per family increases from 6 in 1993 to 13 in 2003 (from CRSP). We use the time series average of the
medians, 10 funds per firm in our calculations. We then calculate the risk adjusted loss per year, and
over the average estimated life of a trustee relationship in our sample (29 years). Table IX Panel A
shows how these losses vary by the number of funds to which the family applies the overweighting.
As expected, the investor loses more the more concentrated is the overweighting by the fund family.
From Panel A, the effect of the average trustee overweighting on investors is small. Even if the fund
concentrates all of the overweighting into one fund the annualized loss in returns is 23 basis points,
while the total return loss over the entire estimated trustee firm-sponsor firm relationship is 7.73%.
Panel B then addresses the question of which fund families impose the largest cost on investors.
From Table V, the trustee overweighting is significantly more severe in small fund families and for
large 401(k) plans, consistent with a more severe conflict of interest. So, in Panel B, we calculate the
loss to an investor in a fund who is a trustee of a 401(k) plan one standard deviation larger than the
average plan, and who itself is one standard deviation smaller than the average fund family. As can
be seen, the cost to investors increases substantially, now being 96 basis points in lost returns per
year if the family concentrates the overweighting in one fund. This then translates to over a 37% loss
in return over the entire life of the relationship. In net, although the average effect may be small, for
investors in smaller fund families who are trustees of larger plans, the cost can be a sizeable return
loss over the average trustee-401(k) sponsor relationship.
IV.B Quantifying a Benefit: Price Impact
From Section III, trustee firms buy sponsor firm shares precisely when all other fund families are
selling a significant amount. From the sponsor firm’s perspective, this may help to dampen adverse
price movements of its stock. In this section, we quantify this benefit by estimating to what extent
the trustees’ increased overweighting specifically in these bad times can have a tangible price impact
on the sponsor firm. To do this, we first need an estimate of the demand elasticity of the sponsor
firms. We rely on the previous literature, which has estimated demand elasticities of firm stock in
the range of roughly 1 to 11 (Shleifer (1986), Loderer et al. (1991), Petajisto (2005)). We will use
22

the average of this range, 6, for our tests. From Column 1 of Table VII, trustees actually increase
their purchases in the sponsor firm by roughly 11 percent (0.1425-0.0258), when all other firms are
selling a significant portion of the firm. This translates into the trustees buying roughly .26% more
of the shares outstanding of the sponsor firm34. To give a further idea of what this means to the
sponsor firm, the median amount of its shares sold by all other firms when PctCompSold > 1, is
2.28%. Thus, using the elasticity estimate of 6, the estimated price response of the firm is a -13.70
percent return. However, because the trustee buys shares at exactly these times, the returns are 154
basis points higher. Therefore, the trustee provides an 11.22% (1.54/13.70) propping up of sponsor
firm’s stock price. This suggests a tangible benefit to the 401(k) sponsor firm of having the trustee
conflict of interest.
V Conclusion
There are several ways mutual fund families attract assets under management. We document a new
economically large and growing channel, through the 401(k) market, and find evidence that mutual
fund families systematically distort their portfolios to attract these 401(k) clients. This presents a
cost from the conflict of interest, as their fiduciary responsibility to outside investors is to maximize
return subject to a given risk or benchmark. Specifically, we find that mutual fund families who
become trustees significantly overweight 401(k) sponsor firm’s stock in their fund families. This
overweighting is significantly more pronounced for smaller fund families and for larger 401(k) plans.
As well, we find that the trustee family performs a valuable service to the trusted company by buying
or holding its stocks around times of substantial selling of the sponsor firm by all other funds. We
quantify this sponsor firm benefit of increased buying of sponsor firm shares by its trustee around
bad times, and find that it can have substantial price impact by propping up the sponsor firm’s price.
Further, this overweighting cannot be explained by information, as trustees do not do any better,
actually a bit worse, on their sponsor firm holdings than other fund families. We find that although
the average cost to fund investors of this overweighting is small, for those investors in smaller fund
families who are trustees of larger 401(k) plans (those we expect to have the most severe conflict of
34This figure comes from multiplying the 9 percent increase by the average holdings of the trustee in the sponsorfirm of 2.11% of shares outstanding.
23

interest), the cost can be large.
With the percentage of mutual fund assets being held by defined contribution retirement plans
steadily increasing, we expect fund families to expend more effort in attracting these 401(k) plans in
the future. We therefore predict the magnitude of the distortion in portfolio allocations we find in the
paper may even increase, rather than decrease, in the future. In addition, more evidence is arising
of potential problems in the defined benefit plan structure. Cocco and Volpin (2005) find that when
defined benefit plans assign members of the board of directors to have fiduciary responsibility over the
plan, the plan tilts more toward equities and have a higher dividend payout ratio. Bergstresser et al.
(2005) find additional evidence that defined benefit plans make investment decisions in response to
suspect incentives, while Goyal and Wahal (2005) find that defined benefit plans choose investments
in a sub-optimal way over time.
We thus believe the need to address this trustee portfolio distortion is increasing. Future research
should address policy implications that could lessen the conflict of interest. One possible remedy
is to require the trustee to be independent of the mutual fund providers in the plan. This could
greatly reduce the overweighting behavior currently seen by ostensibly ridding this growing industry’s
structure of its embedded, and unneeded, conflict of interest.
24
References
Baker, M., L. Litov, J. Wachter, and J. Wurgler (2004). Can mutual fund managers pick stocks?
evidence from the trades prior to earnings announcements. NBER Working paper No. 10685.
Bergstresser, D., M. Desai, and J. Rauh (2005). Earnings manipulation and managerial investment
decisions: Evidence from sponsored pension plans. Quarterly Journal of Economics Forthcoming.
Brown, K. C., W. V. Harlow, and L. T. Starks (1996). Of tournaments and temptations: An analysis
of managerial incentives in the mutual fund industry. Journal of Finance 51 (1), 85–110.
Carhart, M. M. (1997). On persistence in mutual fund performance. Journal of Finance 52 (1),
57–82.
Chevalier, J. and G. Ellison (1997). Risk taking by mutual funds as a response to incentives. Journal
of Political Economy 105 (6), 1167–1200.
Chevalier, J. and G. Ellison (1999). Career concerns of mutual fund managers. Quarterly Journal of
Economics 114 (2), 389–432.
Cocco, J. and P. Volpin (2005). The selection and termination of investment managers by plan
sponsors. London Business School working paper.
Coval, J. and E. Stafford (2005). Asset fire sales (and purchases) in equity markets. Harvard Business
School Working Paper, No. 05-077.
Daniel, K., M. Grinblatt, S. Titman, and R. Wermers (1997). Measuring mutual fund performance
with characteristic-based benchmarks. Journal of Finance 52 (3), 1035–58.
Davis, G. and H. Kim (2005). How do business ties influence proxy voting by mutual funds? Journal
of Financial Economics Forthcoming.
Department of Labor (2000). Private Pension Plan Bulletins Abstract of Form 5500 Annual Reports.
Department of Labor.
Elton, E. J., M. J. Gruber, and C. R. Blake (2005). The adequacy of investment choices offered by
401(k) plans. Journal of Public Economics Forthcoming.
25

Fama, E. F. and J. D. MacBeth (1973). Risk, return, and equilibrium: Empirical tests. Journal of
Political Economy 81 (3), 607–36.
Federal Reserve (2005). Flow of Funds Accounts of the United States. Federal Reserve. September,
2005.
Goetzmann, W. N. and N. Peles (1997). Cognitive dissonance and mutual fund investors. Journal
of Financial Research 20 (2), 145–58.
Goyal, A. and S. Wahal (2005). The selection and termination of investment managers by plan
sponsors. Emory University working paper.
Greene, W. (2002). The bias of the fixed effects estimator in nonlinear models. New York University
working paper.
Huberman, G. and W. Jiang (2005). Offering vs. chice by 401(k) plan participants: Equity exposure
and number of funds. Journal of Finance Forthcoming.
Investment Company Institute (2005a). Appendix: Additional Data on Mutual Funds and the U.S.
Retirement Market in 2004. Investment Company Institute. August, 2005.
Investment Company Institute (2005b). Mutual Funds and the U.S. Retirement Market in 2004.
Investment Company Institute. August, 2005.
Jones, C. and J. Shanken (2005). Mutual fund performance with learning across funds. Journal of
Financial Economics 78, 507–552.
Loderer, C., J. W. Cooney, and L. D. van Drunen (1991). The price elasticity of demand for common
stock. Journal of Finance 46 (2), 621–51.
Massa, M. and Z. Rehman (2005). Information flows within financial conglomerates: Ev-
idence from the banks-mutual funds relationship. Working paper. Available at SSRN:
http://ssrn.com/abstract=775804.
Pastor, L. and R. F. Stambaugh (2002). Investing in equity mutual funds. Journal of Financial
Economics 63 (3), 351–80.
26

Petajisto, A. (2005). Why do demand curves for stocks slope down? Yale University Working Paper.
Shleifer, A. (1986). Do demand curves for stocks slope down? Journal of Finance 41 (3), 579–90.
Sirri, E. R. and P. Tufano (1998). Costly search and mutual fund flows. Journal of Finance 53 (5),
1589–1622.
Table
I:401(k
)P
lan
Sum
mary
Sta
tist
ics
Pan
elA
:T
his
pane
lis
asu
mm
ary
ofof
the
401(
k)pl
anda
taus
ed,co
llect
edfr
omSE
CFo
rm11
-kfil
ings
.A
llnu
mbe
rsar
ein
mill
ions
ofdo
llars
.W
hen
afir
mha
sm
ore
than
one
401(
k)pl
an,a
slo
ngas
the
plan
sha
veth
esa
me
trus
tee
(whi
chha
ppen
sth
eva
stm
ajor
ity
ofti
mes
),w
eag
greg
ate
them
byco
mpa
ny.
Oth
erw
ise
we
choo
seth
ela
rges
tpl
an.
Num
ber
ofP
lans
isth
eto
talnu
mbe
rof
plan
sin
our
sam
ple.
Pan
elB
:T
his
pane
lco
ntai
nsda
taon
the
aggr
egat
eof
all
plan
sin
the
sam
ple.
Num
ber
ofpl
ans
isth
eav
erag
enu
mbe
rof
plan
sea
chye
ar.
Sum
ofP
lans
isin
mill
ions
ofdo
llars
.G
DP
num
bers
are
take
nfr
omth
eFe
dera
lR
eser
ve(2
005)
,w
hile
the
mut
ual
fund
data
was
take
nfr
omC
DA
/Spe
ctru
mIn
stit
utio
nalda
taba
se.
%of
Fam
ilyA
sset
sis
the
aver
age
rati
oof
the
sum
ofpl
anas
sets
byth
em
arke
tva
lue
ofal
leq
uity
hold
ings
offa
mili
esin
our
sam
ple.
Tot
alM
arke
tC
apis
defin
edas
the
sum
ofth
em
arke
tca
pita
lizat
ions
of(N
YSE
+N
ASD
AQ
+A
ME
X).
All
num
bers
are
annu
alav
erag
es.
Pan
elA
:A
vera
ge40
1(k)
Pla
nSiz
e
Yea
rN
um
ber
ofpla
ns
Mea
nST
DM
axM
in
Full
Sam
ple
899
640.
021,
992.
1825
,508
.58
0.04
8019
93-1
998
560
570.
891,
783.
6819
,201
.35
0.04
8019
99-2
003
741
683.
662,
129.
0525
508.
580.
1571
Pan
elB
:Sam
ple
Sum
mar
y(a
nnual
aver
ages
)
Yea
rN
um
ber
ofpla
ns
Sum
ofP
lans
(Million
s)%
ofG
DP
%of
Fam
ily
Ass
ets
%of
Tot
alM
arke
tC
ap
Full
Sam
ple
392
235,
545
2.58
%11
.96%
3.20
%19
93-1
998
304
168,
266
2.13
%12
.18%
3.22
%19
99-2
003
497
316,
280
3.12
%11
.71%
3.18
%

Table
II:
Mutu
alFund
Fam
ily
Sum
mary
Sta
tist
ics
Pan
elA
:T
his
pane
lis
asu
mm
ary
ofof
the
mut
ual
fund
fam
ilyda
taw
eus
ein
the
pape
r(t
op10
0fa
mili
es),
and
ista
ken
from
take
nfr
omC
DA
/Spe
ctru
mIn
stit
utio
nalda
taba
se.
All
num
bers
are
inm
illio
nsof
dolla
rs.
We
then
sepa
rate
bytr
uste
efa
mili
esan
dno
n-tr
uste
efa
mili
es.
Pan
elB
:T
his
pane
lco
ntai
nsda
taon
mut
ual
fund
fees
and
fees
paid
toco
mpa
nies
byde
fined
cont
ribu
tion
plan
s.T
hem
utua
lfu
ndex
-pe
nse
data
ista
ken
from
the
CR
SPM
utua
lFu
ndda
taba
se.
The
trus
tee
fees
and
tota
lsa
lari
esda
taco
me
from
ada
taba
seon
Form
5500
filin
gsto
the
Dep
artm
ent
ofLab
or.
The
sefe
esar
ein
mill
ions
ofdo
llars
.
Pan
elA
:M
utu
alFund
Sum
mar
ySta
tist
ics
Num
ber
ofFam
ilie
sM
ean
ST
D
Yea
rFull
Sam
ple
Non
-Tru
stee
Tru
stee
Full
Sam
ple
Non
-Tru
stee
Tru
stee
Full
Sam
ple
Non
-Tru
stee
Tru
stee
Full
Sam
ple
251
197
5412
,199
.47
8,85
6.51
29,9
40.1
822
,820
.55
15,5
85.6
040
,280
.47
1993
-199
822
818
444
8,18
4.97
6,02
5.40
20,7
37.8
814
,638
.97
8,33
8.10
29,5
35.9
219
99-2
003
208
165
4317
,375
.13
12,6
25.5
439
,963
.82
29,4
70.5
621
,188
.89
47,4
30.2
9
Pan
elB
:M
utu
alFund
Expen
ses
and
Tru
stee
Fee
s
Yea
rTot
alLoa
dExpen
ses
(%T
NA
)12
b-1
Fee
Tru
stee
Fee
sM
ean
ST
DM
ean
ST
DM
ean
ST
DM
ean
ST
D
Full
Sam
ple
2.35
%2.
37%
1.56
%0.
78%
0.37
%0.
40%
0.15
0.41
1993
-199
82.
36%
2.36
%1.
54%
0.73
%0.
35%
0.40
%0.
140.
3919
99-2
003
2.33
%2.
37%
1.58
%0.
82%
0.40
%0.
41%
0.16
0.42

Table III - Univariate Measures
This table presents the univariate statistics for some measures of holdings. “MV Hold” is the market valueof the family’s holdings of the stock at each quarter. “% TNA” is the market value of the holdings dividedby the Total Net Assets of the family (equity positions only). “% Company” is the number of shares held asa percentage of the number of shares outstanding. In each case, for each quarter and each stock we averagethe measure across families separately for trustees and non-trustees. Then, on each quarter, we average themeasure across stocks. The table presents the statistics of this time series of averages. The T-stat is thet-statistic for the difference between trustees and non-trustees. Newey-West T-stat is the t-statistic for thedifference adjusted using the Newey-West procedure with a 4-period lag.
Variable TrusteesNon-
Trustees Difference T-StatNewey-WestT-stat
MV Hold (millions) 188 24 164 22.05 11.25% TNA 0.168 0.092 0.076 7.01 3.57% Company 2.19 0.78 1.41 37.40 20.72

Table IV: Trustee Effect on Portfolio Choice
The dependent variables in the regressions are log(PctSharesOut) (Column 1 - Column 3), the natural logarithm of the percentage of sharesoutstanding of a firm owned by a given mutual fund family and log(PctTNA) (Column 4), the natural logarithm of the percentage ofTNA of the mutual fund family invested in the given firm. The independent variable of interest in the regressions is Trustee, a categoricalvariable equal to 1 if the given mutual fund is the trustee for the given firm, and 0 otherwise. Also included in the regressions are the firmcharacteristics of natural logarithm of market equity and book-to-market equity, log(ME) and log(BM), and the firm’s weight in the CRSPvalue-weighted market portfolio, Market Weight. Past Returns are also included, which are the previous 11 months of returns for the firm(excluding last month). The mutual fund family characteristic of the logarithm of total net assets, log(TNA), is included. Additionalfund family characteristics of percentage invested in the industry of the stock being considered, PctInvInd, and percentage invested in thestyle of the stock being considered (computed following Daniel et al. (1997)), PctInvStyle, are included. log(401(k) Size) is the naturallogarithm of the size of the 401(k) plan of the firm being considered. The sample period is 1994-2003, and quarter and mutual fund familyfixed effects are included where indicated. All regressions include an intercept (not reported). Standard errors (in parentheses) are robustand clustered at the firm level (Column 2 - Column 4).
log(PctSharesOut) log(PctTNA)
Column 1 Column 2 Column 3 Column 4
Trustee 0.4632*** 0.4267*** 0.4284*** 0.4538***(0.0188) (0.0576) (0.0589) (0.0189)
log(ME) -0.2623*** -0.1915*** -0.1742*** 0.7288***(0.0012) (0.0109) (0.0142) (0.0012)
log(BM) 0.0511*** 0.0253 0.0593*** 0.1181***(0.0020) (0.0258) (0.0175) (0.0020)
log(TNA) 0.7086*** 0.8088*** 0.8174*** -0.2954***(0.0011) (0.0072) (0.0093) (0.0011)
Past Returns 0.0005*** 0.0006*** 0.0006*** 0.0017***(0.0000) (0.0001) (0.0002) (0.0000)
PctInvStyle 0.0271*** 0.0230*** 0.0223*** 0.0288***(0.0002) (0.0013) (0.0013) (0.0002)
PctInvInd 0.0282*** 0.0243*** 0.0272*** 0.0308***(0.0003) (0.0028) (0.0030) (0.0003)
Market Weight 0.5369*** 0.1428** 0.1392*** 0.6495***(0.0083) (0.0607) (0.0531) (0.0084)
log(401(k) Size) 0.0155(0.0095)
Family Fixed Effects No Yes Yes YesQuarter Fixed Effects No Yes Yes YesCluster By Firm No Yes Yes Yes
Observations 1707880 1707880 1010718 1710036R-Squared 0.23 0.34 0.35 0.41
*,**,*** denote significance at the 90%, 95% and 99% level, respectively.

Table V: Severity of Conflict of Interest and Superior Information
The dependent variable in the regressions is log(PctSharesOut), the natural logarithm of the percentage of shares outstanding of a firmowned by a given mutual fund family. The independent variable of interest in the regressions is Trustee, a categorical variable equal to 1if the given mutual fund is the trustee for the given firm, and 0 otherwise. Also included in the regressions are the firm characteristics ofnatural logarithm of market equity and book-to-market equity, log(ME) and log(BM), and the firm’s weight in the CRSP value-weightedmarket portfolio, Market Weight. Past Returns are also included, which are the previous 11 months of returns for the firm (excludinglast month). The mutual fund family characteristic of the logarithm of total net assets, log(TNA), is included. Additional fund familycharacteristics of percentage invested in the industry of the stock being considered, PctInvInd, and percentage invested in the style of thestock being considered (computed following Daniel et al. (1997)), PctInvStyle, are included. log(401(k) Size) is the natural logarithm ofthe size of the 401(k) plan of the firm being considered. Trustee*log(401(k) Size) is the interaction of the Trustee categorical variable andlog(401(k) Size). Trustee*log(TNA) is the interaction of the Trustee categorical variable and log(TNA). Future Returns are measured asthe next 11 months of returns for the firm being considered, with Trustee*Future Returns being the interaction of the Trustee categoricalvariable and Future Returns. The sample period is 1994-2003, and quarter and mutual fund family fixed effects are included whereindicated. All regressions include an intercept (not reported). Standard errors (in parentheses) are robust and clustered at the firm level.
log(PctSharesOut)
Column 1 Column 2 Column 3
Trustee 2.1711*** 0.4285*** 0.4281***(0.5277) (0.0580) (0.0598)
log(ME) -0.1743*** -0.1943*** -0.1943***(0.0142) (0.0110) (0.0110)
log(BM) 0.0592*** 0.0256 0.0256(0.0175) (0.0264) (0.0264)
log(TNA) 0.8177*** 0.8091*** 0.8091***(0.0093) (0.0072) (0.0072)
Past Returns 0.0006*** 0.0005*** 0.0005***(0.0002) (0.0001) (0.0001)
PctInvStyle 0.0223*** 0.0230*** 0.0230***(0.0013) (0.0013) (0.0013)
PctInvInd 0.0272*** 0.0246*** 0.0246***(0.0030) (0.0028) (0.0028)
Market Weight 0.1394*** 0.1524** 0.1524**(0.0530) (0.0612) (0.0612)
log(401(k) Size) 0.0149(0.0095)
Trustee*log(TNA) -0.1995***(0.0453)
Trustee*log(401(k) Size) 0.1036***(0.0304)
Future Returns -0.0004*** -0.0004***(0.0001) (0.0001)
Trustee*Future Returns 0.0000(0.0006)
Family Fixed Effects Yes Yes YesQuarter Fixed Effects Yes Yes YesCluster By Firm Yes Yes Yes
Observations 1010718 1687750 1687750R-Squared 0.35 0.34 0.34
*,**,*** denote significance at the 90%, 95% and 99% level, respectively.
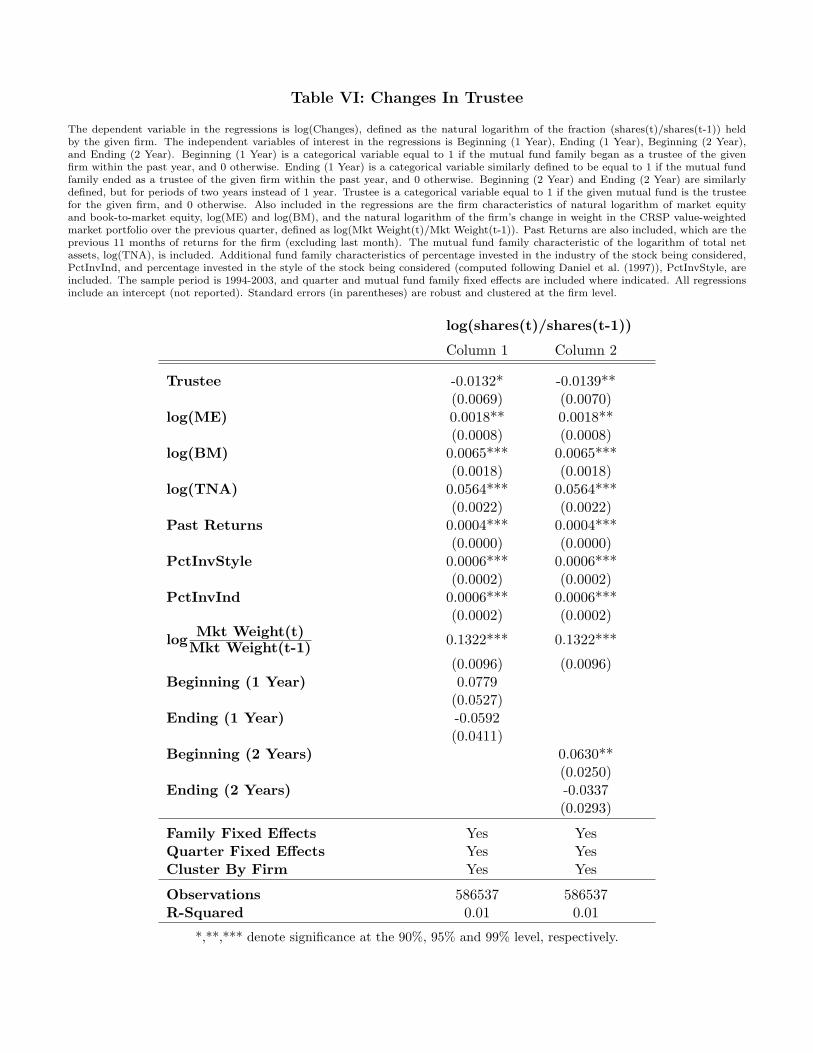
Table VI: Changes In Trustee
The dependent variable in the regressions is log(Changes), defined as the natural logarithm of the fraction (shares(t)/shares(t-1)) heldby the given firm. The independent variables of interest in the regressions is Beginning (1 Year), Ending (1 Year), Beginning (2 Year),and Ending (2 Year). Beginning (1 Year) is a categorical variable equal to 1 if the mutual fund family began as a trustee of the givenfirm within the past year, and 0 otherwise. Ending (1 Year) is a categorical variable similarly defined to be equal to 1 if the mutual fundfamily ended as a trustee of the given firm within the past year, and 0 otherwise. Beginning (2 Year) and Ending (2 Year) are similarlydefined, but for periods of two years instead of 1 year. Trustee is a categorical variable equal to 1 if the given mutual fund is the trusteefor the given firm, and 0 otherwise. Also included in the regressions are the firm characteristics of natural logarithm of market equityand book-to-market equity, log(ME) and log(BM), and the natural logarithm of the firm’s change in weight in the CRSP value-weightedmarket portfolio over the previous quarter, defined as log(Mkt Weight(t)/Mkt Weight(t-1)). Past Returns are also included, which are theprevious 11 months of returns for the firm (excluding last month). The mutual fund family characteristic of the logarithm of total netassets, log(TNA), is included. Additional fund family characteristics of percentage invested in the industry of the stock being considered,PctInvInd, and percentage invested in the style of the stock being considered (computed following Daniel et al. (1997)), PctInvStyle, areincluded. The sample period is 1994-2003, and quarter and mutual fund family fixed effects are included where indicated. All regressionsinclude an intercept (not reported). Standard errors (in parentheses) are robust and clustered at the firm level.
log(shares(t)/shares(t-1))
Column 1 Column 2
Trustee -0.0132* -0.0139**(0.0069) (0.0070)
log(ME) 0.0018** 0.0018**(0.0008) (0.0008)
log(BM) 0.0065*** 0.0065***(0.0018) (0.0018)
log(TNA) 0.0564*** 0.0564***(0.0022) (0.0022)
Past Returns 0.0004*** 0.0004***(0.0000) (0.0000)
PctInvStyle 0.0006*** 0.0006***(0.0002) (0.0002)
PctInvInd 0.0006*** 0.0006***(0.0002) (0.0002)
log Mkt Weight(t)Mkt Weight(t-1) 0.1322*** 0.1322***
(0.0096) (0.0096)Beginning (1 Year) 0.0779
(0.0527)Ending (1 Year) -0.0592
(0.0411)Beginning (2 Years) 0.0630**
(0.0250)Ending (2 Years) -0.0337
(0.0293)
Family Fixed Effects Yes YesQuarter Fixed Effects Yes YesCluster By Firm Yes Yes
Observations 586537 586537R-Squared 0.01 0.01
*,**,*** denote significance at the 90%, 95% and 99% level, respectively.
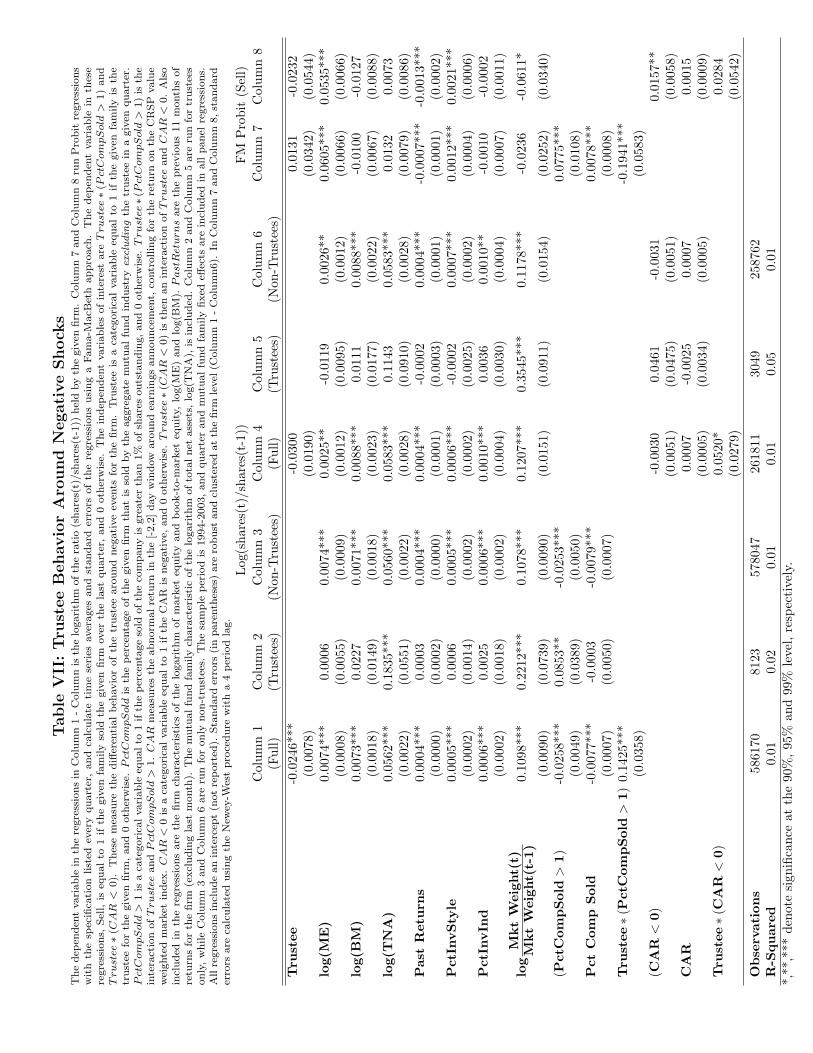
Table
VII
:Tru
stee
Behavio
rA
round
Negati
ve
Shock
sT
he
dep
enden
tvari
able
inth
ere
gre
ssio
ns
inC
olu
mn
1-C
olu
mn
isth
elo
gari
thm
ofth
era
tio
(share
s(t)
/sh
are
s(t-
1))
hel
dby
the
giv
enfirm
.C
olu
mn
7and
Colu
mn
8ru
nP
robit
regre
ssio
ns
wit
hth
esp
ecifi
cation
list
edev
ery
quart
er,
and
calc
ula
tetim
ese
ries
aver
ages
and
standard
erro
rsof
the
regre
ssio
ns
usi
ng
aFam
a-M
acB
eth
appro
ach
.T
he
dep
enden
tvari
able
inth
ese
regre
ssio
ns,
Sel
l,is
equalto
1if
the
giv
enfa
mily
sold
the
giv
enfirm
over
the
last
quart
er,and
0oth
erw
ise.
The
indep
enden
tvari
able
sofin
tere
stare
Trust
ee∗
(Pct
Com
pS
old
>1)
and
Trust
ee∗
(CA
R<
0).
Thes
em
easu
reth
ediff
eren
tialbeh
avio
rof
the
trust
eearo
und
neg
ative
even
tsfo
rth
efirm
.Tru
stee
isa
cate
gori
calvari
able
equalto
1if
the
giv
enfa
mily
isth
etr
ust
eefo
rth
egiv
enfirm
,and
0oth
erw
ise.
Pct
Com
pS
old
isth
eper
centa
ge
ofth
egiv
enfirm
that
isso
ldby
the
aggre
gate
mutu
alfu
nd
indust
ryex
cludin
gth
etr
ust
eein
agiv
enquart
er.
Pct
Com
pS
old
>1
isa
cate
gori
calvari
able
equalto
1if
the
per
centa
ge
sold
ofth
eco
mpany
isgre
ate
rth
an
1%
ofsh
are
souts
tandin
g,and
0oth
erw
ise.
Trust
ee∗(P
ctC
om
pS
old
>1)
isth
ein
tera
ctio
nof
Trust
eeand
Pct
Com
pS
old
>1.
CA
Rm
easu
res
the
abnorm
alre
turn
inth
e[-2,2
]day
win
dow
aro
und
earn
ings
announce
men
t,co
ntr
ollin
gfo
rth
ere
turn
on
the
CR
SP
valu
ew
eighte
dm
ark
etin
dex
.C
AR
<0
isa
cate
gori
calvari
able
equalto
1if
the
CA
Ris
neg
ati
ve,
and
0oth
erw
ise.
Trust
ee∗
(CA
R<
0)
isth
enan
inte
ract
ion
of
Trust
eeand
CA
R<
0.
Als
oin
cluded
inth
ere
gre
ssio
ns
are
the
firm
chara
cter
istics
of
the
logari
thm
of
mark
eteq
uity
and
book-t
o-m
ark
eteq
uity,
log(M
E)
and
log(B
M).
Past
Ret
urns
are
the
pre
vio
us
11
month
sof
retu
rns
for
the
firm
(excl
udin
gla
stm
onth
).T
he
mutu
alfu
nd
fam
ily
chara
cter
isti
cofth
elo
gari
thm
ofto
talnet
ass
ets,
log(T
NA
),is
incl
uded
.C
olu
mn
2and
Colu
mn
5are
run
for
trust
ees
only
,w
hile
Colu
mn
3and
Colu
mn
6are
run
for
only
non-t
rust
ees.
The
sam
ple
per
iod
is1994-2
003,and
quart
erand
mutu
alfu
nd
fam
ily
fixed
effec
tsare
incl
uded
inall
panel
regre
ssio
ns.
All
regre
ssio
ns
incl
ude
an
inte
rcep
t(n
ot
report
ed).
Sta
ndard
erro
rs(in
pare
nth
eses
)are
robust
and
clust
ered
at
the
firm
level
(Colu
mn
1-C
olu
mn6).
InC
olu
mn
7and
Colu
mn
8,st
andard
erro
rsare
calc
ula
ted
usi
ng
the
New
ey-W
est
pro
cedure
with
a4
per
iod
lag.
Log
(sha
res(
t)/s
hare
s(t-
1))
FM
Pro
bit
(Sel
l)C
olum
n1
Col
umn
2C
olum
n3
Col
umn
4C
olum
n5
Col
umn
6C
olum
n7
Col
umn
8(F
ull)
(Tru
stee
s)(N
on-T
rust
ees)
(Ful
l)(T
rust
ees)
(Non
-Tru
stee
s)Tru
stee
-0.0
246*
**-0
.030
00.
0131
-0.0
232
(0.0
078)
(0.0
190)
(0.0
342)
(0.0
544)
log(
ME)
0.00
74**
*0.
0006
0.00
74**
*0.
0025
**-0
.011
90.
0026
**0.
0605
***
0.05
35**
*(0
.000
8)(0
.005
5)(0
.000
9)(0
.001
2)(0
.009
5)(0
.001
2)(0
.006
6)(0
.006
6)lo
g(B
M)
0.00
73**
*0.
0227
0.00
71**
*0.
0088
***
0.01
110.
0088
***
-0.0
100
-0.0
127
(0.0
018)
(0.0
149)
(0.0
018)
(0.0
023)
(0.0
177)
(0.0
022)
(0.0
067)
(0.0
088)
log(
TN
A)
0.05
62**
*0.
1835
***
0.05
60**
*0.
0583
***
0.11
430.
0583
***
0.01
320.
0073
(0.0
022)
(0.0
551)
(0.0
022)
(0.0
028)
(0.0
910)
(0.0
028)
(0.0
079)
(0.0
086)
Pas
tR
eturn
s0.
0004
***
0.00
030.
0004
***
0.00
04**
*-0
.000
20.
0004
***
-0.0
007*
**-0
.001
3***
(0.0
000)
(0.0
002)
(0.0
000)
(0.0
001)
(0.0
003)
(0.0
001)
(0.0
001)
(0.0
002)
Pct
InvSty
le0.
0005
***
0.00
060.
0005
***
0.00
06**
*-0
.000
20.
0007
***
0.00
12**
*0.
0021
***
(0.0
002)
(0.0
014)
(0.0
002)
(0.0
002)
(0.0
025)
(0.0
002)
(0.0
004)
(0.0
006)
Pct
InvIn
d0.
0006
***
0.00
250.
0006
***
0.00
10**
*0.
0036
0.00
10**
-0.0
010
-0.0
002
(0.0
002)
(0.0
018)
(0.0
002)
(0.0
004)
(0.0
030)
(0.0
004)
(0.0
007)
(0.0
011)
log
Mkt
Wei
ght(
t)M
kt
Wei
ght(
t-1)
0.10
98**
*0.
2212
***
0.10
78**
*0.
1207
***
0.35
45**
*0.
1178
***
-0.0
236
-0.0
611*
(0.0
090)
(0.0
739)
(0.0
090)
(0.0
151)
(0.0
911)
(0.0
154)
(0.0
252)
(0.0
340)
(Pct
Com
pSol
d>
1)-0
.025
8***
0.08
53**
-0.0
253*
**0.
0775
***
(0.0
049)
(0.0
389)
(0.0
050)
(0.0
108)
Pct
Com
pSol
d-0
.007
7***
-0.0
003
-0.0
079*
**0.
0078
***
(0.0
007)
(0.0
050)
(0.0
007)
(0.0
008)
Tru
stee∗
(Pct
Com
pSol
d>
1)0.
1425
***
-0.1
941*
**(0
.035
8)(0
.058
3)(C
AR
<0)
-0.0
030
0.04
61-0
.003
10.
0157
**(0
.005
1)(0
.047
5)(0
.005
1)(0
.005
8)C
AR
0.00
07-0
.002
50.
0007
0.00
15(0
.000
5)(0
.003
4)(0
.000
5)(0
.000
9)Tru
stee∗
(CA
R<
0)0.
0520
*0.
0284
(0.0
279)
(0.0
542)
Obse
rvat
ions
5861
7081
2357
8047
2618
1130
4925
8762
R-S
quar
ed0.
010.
020.
010.
010.
050.
01*,
**,*
**de
note
sign
ifica
nce
atth
e90
%,95
%an
d99
%le
vel,
resp
ecti
vely
.

Table VIII: Returns for Providing Liquidity
For each stock, we first define the event date as the quarter in which families sold more than 1% of the shares outstanding of this stock.This corresponds to months t = −2,−1, 0. We then compute, for each event month from t = −12 to t = 12, the abnormal return on thisstock. This abnormal return is defined as the difference between the stock’s return and the return on the value-weighted CRSP index. Foreach stock, the cumulative abnormal return is also calculated. We then compute the average abnormal return (AAR) and the cumulativeaverage abnormal return (CAAR) for each event month. The t-statistics are computes across stocks. The CAAR for different event periodsis the average of the cumulative return (across stocks) over the period defined. The number of observations each month is denoted by N
t AAR (%) t-stat CAAR (%) t-stat N
-12 0.50 0.95 0.50 0.95 515-11 0.20 0.38 0.67 0.95 540-10 1.91 3.89 2.57 2.88 541-9 0.50 0.97 3.07 2.85 543-8 -0.57 -1.01 2.35 2.01 570-7 0.83 1.66 3.18 2.47 570-6 0.04 0.08 3.21 2.27 572-5 -0.53 -0.97 2.47 1.71 610-4 -0.09 -0.21 2.38 1.52 611-3 0.01 0.02 2.38 1.42 612-2 -1.57 -3.02 0.78 0.44 620-1 -0.43 -0.83 0.36 0.18 6210 -3.06 -6.15 -2.71 -1.36 6231 0.75 1.28 -2.36 -1.15 6052 0.85 1.80 -1.51 -0.72 6053 0.42 0.78 -1.09 -0.49 6054 0.38 0.71 -1.46 -0.63 5825 0.59 1.17 -1.00 -0.41 5806 0.28 0.51 -0.72 -0.29 5807 -0.07 -0.11 -1.67 -0.67 5618 1.10 2.15 -0.76 -0.30 5609 -0.22 -0.36 -0.94 -0.35 55910 1.11 1.62 -0.74 -0.27 54111 0.53 0.88 -0.21 -0.07 54112 -0.55 -1.09 0.24 0.09 537
Event Period [−2, 0] -5.14 -5.95Event Period [−2, +3] -3.17 -2.37Event Period [+4, +12] 2.88 1.60Event Period [+7, +12] 1.90 1.27

Table IX:Trustee-Overweighting Cost to Fund Investors
We present estimates of the cost to fund investors of the trustee overweighting. We use loss in risk adjusted returns using Sharpe ratios.The first panel presents summary statistics for the firm and sample. Mean Ret and Std Ret measure the quarterly mean and standarddeviation respectively. Rf is the quarterly risk free rate measured as the average 90-day T-bill rate over the sample. W(sponsor) andW(family) are the weight of the mutual fund family has invested in the sponsor firm’s stock and in the remainder of its assets, respectively.Panel A presents the calculation for loss to fund investors, assuming the mutual fund spreads the sponsor firm overweighting over differentnumbers of its funds. Risk adjusted return loss over the life of the life of the relationship is calculated using the average estimated length oftrustee fund-sponsor firm relationship of roughly 29 years. Panel B measures the cost of the trustee overweighting, but now for the subsetof trustees who are 1 standard deviation smaller than the average fund family, and have attracted a 401(k) plan 1 standard deviation largerthan the average plan.
Firm and Family Statistics
Mean Ret Std RetSponsor Family 0.038 0.216Fund Family 0.035 0.089
Cov(Sponsor, Family) 0.011
Rf 0.010
Optimal WeightingW(sponsor) 0.016W(family) 0.984
Optimal Sharpe ratio 0.281
Panel A: Cost of Average Trustee Overweighting
# Funds Spread Overweighting 1 2 3 4 All
W(sponsor) 0.085 0.051 0.039 0.033 0.028W(family) 0.915 0.949 0.961 0.967 0.972
Overweighted Sharpe ratio 0.273 0.278 0.279 0.280 0.280SR Deviation 0.008 0.003 0.002 0.002 0.001Std of Portfolio 0.093 0.091 0.091 0.091 0.090Loss In Annual Returns 0.29% 0.12% 0.08% 0.06% 0.04%Loss Over Life of Relationship 8.85% 3.64% 2.26% 1.63% 1.08%
Panel B: Cost of Overweighting of Small Family with Large Plan
# Funds Spread Overweighting 1 2 3 4 All
W(sponsor) 0.158 0.087 0.063 0.051 0.040W(family) 0.842 0.913 0.937 0.949 0.960
Overweighted Sharpe ratio 0.261 0.273 0.276 0.278 0.279SR Deviation 0.020 0.008 0.005 0.003 0.002Std of Portfolio 0.098 0.093 0.092 0.091 0.091Loss In Annual Returns 0.78% 0.30% 0.18% 0.13% 0.08%Loss Over Life of Relationship 25.36% 9.10% 5.34% 3.73% 2.40%

Fig
ure
I:C
hanges
inTru
stee
Thi
sfig
ure
plot
sth
eho
ldin
gsof
mut
ual
fund
fam
ilytr
uste
esar
ound
the
even
tof
ach
ange
intr
uste
e.It
com
pare
sth
eho
ldin
gsof
firm
sth
atbe
gin
bein
gtr
uste
e(s
olid
line)
wit
hth
ose
that
end
bein
gtr
uste
e(d
otte
dlin
e).
The
hold
ings
inth
esp
onso
rfir
mar
eca
lcul
ated
asth
epe
rcen
tage
ofth
etr
uste
efa
mily
’sT
NA
(Pct
TN
A).
The
y-ax
isin
the
figur
eis
inpe
rcen
tage
s(f
rom
0.09
perc
ent
to0.
16pe
rcen
t).
The
x-ax
ism
easu
res
tim
e,w
ith
Tim
e0
bein
gth
eti
me
ofth
etr
uste
ech
ange
.H
oldi
ngs
are
mea
sure
das
the
aver
age
past
4qu
arte
rsof
hold
ings
.So
,[-4,
-1]
refe
rsto
the
aver
age
hold
ings
inth
esp
onso
rfir
min
the
1ye
arpe
riod
from
the
quar
ter
dire
ctly
prio
rto
the
trus
tee
chan
geto
four
quar
ters
befo
reth
etr
uste
ech
ange
.T
hefig
ure
repr
esen
tsth
eav
erag
eov
erth
e58
case
sof
trus
tee
chan
ges
we
obse
rve
and
can
mat
chto
CD
Aho
ldin
gsda
ta.


![E. Bryan Digital curation of digital cultural assets- Mutual interest of ALaRMMs [CARIFESTAXXXIII]](https://static.documents.pub/doc/80x56/5a65cce47f8b9aaf638b4837/e-bryan-digital-curation-of-digital-cultural-assets-mutual-interest-of-alarmms.jpg)

