

Consolidated Financial Results for the Fiscal Year Ended March 31, 2012 (Japan GAAP)
May 14, 2012
Company name: SQUARE ENIX HOLDINGS CO., LTD. Shares traded: Tokyo Stock Exchange, First Section Company code: 9684 Company URL: http://www.square-enix.com/eng Representative: Yoichi Wada, President and Representative Director Contact: Yosuke Matsuda, Director and Chief Financial Officer, tel (03) 5333-1144 Annual general meeting of shareholders: June 26, 2012 (planned) Financial report submission: June 27, 2012 (planned) Cash dividend payment commencement: June 5, 2012 (planned) Supplementary annual materials prepared: Yes Annual results presentation held: Yes (for institutional investors and analysts)
(Amounts under one million yen are rounded down)
1. Consolidated Financial Results (April 1, 2011 to March 31, 2012)
(1) Consolidated Financial Results (Millions of yen and year-on-year changes in percents) Net sales Operating income Recurring income Net income (loss)
Fiscal year ended % % % %
March 31, 2012 127,896 2.1 10,713 46.2 10,297 91.0 6,060 -
March 31, 2011 125,271 (34.8) 7,325 (74.1) 5,390 (80.6) (12,043) - Note: FY ended March 31, 2012 Comprehensive income: 5,451 million yen ( - %) FY ended March 31, 2011 Comprehensive loss: 15,094 million yen ( - %)
Earnings (loss)
per share, basic
Earnings (loss) per share,
diluted
Return on equity
Recurring income to total
assets
Operating margin
Fiscal year ended yen yen % % %
March 31, 2012 52.66 52.55 4.5 4.9 8.4
March 31, 2011 (104.66) - (8.4) 2.6 5.8Note: FY ended March 31, 2012 Equity in gain (loss) of affiliated companies: - million yen FY ended March 31, 2011 Equity in gain (loss) of affiliated companies: - million yen
(2) Consolidated Financial Position (Millions of yen, ratios in percents and per share data)
Total assets Net assets Equity ratio Net assets per share
As of % yen
March 31, 2012 213,981 137,297 63.3 1,177.87
March 31, 2011 206,336 135,143 64.7 1,160.66 Note: Total equity As of March 31, 2012: 135,536 million yen As of March 31, 2011: 133,558 million yen
(3) Consolidated Statements of Cash Flows (Millions of yen)
From operating activities
From investing activities
From financing activities
Closing cash and cash equivalents
Fiscal year ended
March 31, 2012 6,786 (5,778) 299 110,116
March 31, 2011 14,827 30,407 (42,354) 109,751

2. Dividends Dividends per share Total annual
dividend payments
Dividend payout ratio
(consolidated)
Dividend on equity
(consolidated)1Q 2Q 3Q 4Q Total
yen yen yen yen yen million yen % %Fiscal year ended
March 31, 2011 - 10.00 - 20.00 30.00 3,452 - 2.4
Fiscal year ended March 31, 2012 - 10.00 - 20.00 30.00 3,452 57.0 2.6
Fiscal year ending March 31, 2012 (projection)
- 10.00 - 20.00 30.00 38.4
3. Consolidated Forecasts (April 1, 2012 to March 31, 2013)
(Millions of yen, year-on-year changes in percents and per share data) Net sales Operating income Recurring income Net income Earnings
per shareSix months ending September 30, 2012
% % % % yen
76,000 32.1 0 (100.0) 0 (100.0) 0 (100.0) 0.00
Fiscal year ending March 31, 2013
165,000 29.0 15,000 40.0 15,000 45.7 9,000 48.5 78.21
4. Other (1) Significant changes among major subsidiaries during the period: No (2) Changes in accounting policies, procedures, and methods of presentation for consolidated financial statements
1. Changes associated with revision in accounting standards: Yes 2. Other changes in accounting standards: No 3. Change in accounting estimate: Yes 4. Retrospective restatement: No
(3) Outstanding shares (common stock) 1. Number of shares issued and outstanding (including treasury stock):
As of March 31, 2012 115,370,596 As of March 31, 2011 115,370,596
2. Number of treasury stock: As of March 31, 2012 301,247 As of March 31, 2011 299,594
3. Average number of shares during the period (cumulative): Fiscal year ended March 31, 2012 115,070,185 Fiscal year ended March 31, 2011 115,072,040
Disclaimer: (1) This document is a translation of the Japanese language “Kessan Tanshin” prepared in accordance with the guidelines of the Tokyo Stock Exchange. The Japanese language document shall prevail in the event any differences or discrepancies exist between this English translation and the original. (2) At the time of disclosure of this report, audit procedures for financial statements pursuant to the Financial Instruments and Exchange Law had not been completed. (3) The forward-looking statements in this document are based upon the information currently available and necessarily include elements that are not entirely predictable. Actual results may differ from the forward-looking statements in this document. (4) For additional information about forecasts, please refer to “Consolidated forecasts” section on page 2.

Supplemental Information – Index Page
1. Consolidated Results for the Fiscal Year Ended March 31, 2012 1
(1) Analysis of consolidated business results 1
(2) Analysis of consolidated financial position 3
(3) Basic policy for profit distribution and dividends 4
2. The Group’s Outline of Operations 5
3. Management Policy 7
(1) Management philosophy 7
(2) Management targets 7
(3) Medium- and long-term management strategy 7
(4) Issues facing management 7
4. Consolidated Financial Statements 8
(1) Consolidated Balance Sheets 8
(2) Consolidated Income Statement and Consolidated Statement of Comprehensive Income 10
(3) Consolidated Statements of Changes in Net Assets 13
(4) Consolidated Statements of Cash Flows 15
5. Segment Information 17

1. Consolidated Results for the Fiscal Year Ended March 31, 2012
(1) Analysis of consolidated business results
The Square Enix Group (the “Group”) is continuing determined efforts to strengthen the competitiveness
and profitability of its business segments of Digital Entertainment, Amusement, Publication and
Merchandising.
Net sales for the fiscal year ended March 31, 2012 totaled ¥127,896 million (an increase of 2.1% from the
prior fiscal year), operating income amounted to ¥10,713 million (an increase of 46.2% from the prior fiscal
year) and recurring income amounted to ¥10,297 million (an increase of 91.0% from the prior fiscal year).
A discussion of results by segment for the fiscal year ended March 31, 2012 follows.
• Digital Entertainment
The Digital Entertainment segment plans, develops, distributes and operates digital entertainment content
primarily in the form of games. Digital entertainment content is offered to meet customer lifestyles across a
variety of usage environments such as consumer game consoles (including handheld game machines),
personal computers and mobile phones (including smartphones).
During the fiscal year ended March 31, 2012, the Group released major titles on consumer game consoles
(“FINAL FANTASY XIII-2” [Japan, North America, Europe]; “DEUS EX: HUMAN REVOLUTION” [North
America, Europe, Japan]), which favorably grew sales of packaged software. Regarding content on
platforms such as browser and smartphone, an online simulation game called “SENGOKU IXA” in
partnership with Yahoo! Japan, launched in August 2010 continues to post favorable results. Further,
starting January 2012, services for a Mobage-based social game called “FINAL FANTASY BRIGADE”
whose total registered users exceeded 2 million in March 2012 enjoys robust growth.
Net sales and operating income in the Digital Entertainment segment totaled ¥71,871 million (an increase of
11.9% from the prior fiscal year) and ¥12,602 million (an increase of 11.7% from the prior fiscal year),
respectively.
• Amusement
The Amusement segment consists of the operation of amusement facilities and the planning, development
and distribution of arcade game machines and related products for amusement facilities.
During the fiscal year ended March 31, 2012, due to the softening market conditions, amusement facilities
operations stagnated on sales during the second half of the fiscal year. However, the Group showed steady
increase on operating income compared to the prior fiscal year from the efficiency in operations of
amusement facilities and investment in machinery.
1

Net sales and operating income in the Amusement segment totaled ¥41,921 million (a decrease of 6.9%
from the prior fiscal year) and ¥2,552 million (an increase of 17.2% from the prior fiscal year), respectively.
• Publication
The Publication segment includes comic books, game strategy books and comic magazines.
During the fiscal year ended March 31, 2012, due to the completion of larger serial manga titles, monthly
magazines and comic books stagnated on sales. On the other hand, the Group has been dedicated to
developing network-based publication businesses including the Group’s GANGAN ONLINE, a web-based
comic magazine.
Net sales and operating income in the Publication segment totaled ¥11,335 million (a decrease of 13.1%
from the prior fiscal year) and ¥2,575 million (a decrease of 19.6% from the prior fiscal year), respectively.
• Merchandising
The Merchandising segment includes the planning, production, distribution and licensing of derivative
products of titles owned by the Group.
During the fiscal year ended March 31, 2012, the Group continued to distribute and license items such as
character goods and soundtracks based on the Group’s own IPs while diversifying new opportunities for
profit by strengthening its character goods lineup with additional products based on third party content and
overseas expansions.
Net sales and operating income in the Merchandising segment totaled ¥2,767 million (a decrease of 8.3%
over the prior fiscal year) and ¥742 million (an increase of 9.1% over the prior fiscal year), respectively.
(Consolidated forecasts)
The Group is prepared to meet the new business environment that is expanding its customer base through
the proliferation of broadband networks and a wider selection of digital entertainment environment. The
Group views this change as an opportunity to capture new profit sources and are making every effort to
expand its financially well-established network related businesses to have the Group’s attractive content
enjoyed by an ever-growing number of customers.
In the current fiscal year ending March 31, 2013, the Group is focusing all efforts on a substantial earnings
improvement.
2

(2) Analysis of consolidated financial position
(i) Assets, liabilities and net assets
• Assets
As of March 31, 2012, total current assets were ¥172,161 million, increasing by 4.8% compared to the prior
fiscal year. This was mainly due to increases in content production account of ¥5,157 million and notes and
accounts receivable of ¥2,957 million, respectively.
Fixed assets were ¥41,819 million, decreasing by 0.5% compared to the prior fiscal year. This was mainly
due to a decrease in deferred tax assets by ¥621 million, offset by an increase in rental deposits of ¥469
million.
As a result, total assets increased by 3.7% to ¥213,981 million.
• Liabilities
As of March 31, 2012, total current liabilities were ¥33,778 million, an increase of 18.5% compared to the
end of the prior fiscal year. This was mainly due to increases in short-term loans of ¥3,914 million and
accrued income taxes of ¥1,765 million.
Non-current liabilities increased by 0.5% to ¥42,906 million. The increase was mainly due to an increase in
allowance for employees’ retirement benefits of ¥747 million, offset by a decrease of ¥508 million in asset
retirement obligation.
As a result, total liabilities increased by 7.7% to ¥76,684 million.
• Net assets
As of March 31, 2012, net assets were ¥137,297 million (an increase of 1.6% compared to March 31, 2011).
This was mainly due to net income of ¥6,060 million, dividend payments of ¥3,452 million, and a decrease
in foreign currency translation adjustments of ¥767 million.
(ii) Consolidated Cash Flow
As of March 31, 2012, cash and cash equivalents totaled ¥110,116 million, an increase of ¥364 million
compared to March 31, 2011. Cash flows during the fiscal year ended March 31, 2012 as well as the
principal factors behind these cash flows are described below.
• Cash flows from operating activities
Net cash provided by operating activities during the fiscal year ended March 31, 2012 totaled ¥6,786 million
(a decrease of 54.2% compared to the prior fiscal year).
Income before income taxes and minority interests of ¥9,866 million, increases in inventories of ¥5,137
million and notes and accounts receivable-trade of ¥3,008 million, and depreciation and amortization of
¥5,039 million led to the overall provision of cash from operating activities.
3

• Cash flows from investing activities
Net cash used in investing activities totaled ¥5,778 million (compared to net cash provided by investing
activities of ¥30,407 million in the prior fiscal year).
Main factors are proceeds from collection of rental deposits of ¥1,084 million, payments for rental deposits
of ¥1,492 million, and purchase of property and equipment of ¥4,620 million.
• Cash flows from financing activities
Net cash provided by financing activities totaled ¥299 million (compared to net cash used in financing
activities of ¥42,354 million in the prior fiscal year). The main factors are an increase in short-term loans
payable of ¥3,791 million and cash dividends paid of ¥3,446 million.
(3) Basic policy for profit distribution and dividends
The Group recognizes the return of profits to shareholders as one of its most important management tasks.
The Group maintains internal reserves to enable priority to be given to investments that will enhance the
value of the Group. Such investments may include capital investments and M&A for the purpose of
expanding existing businesses and developing new businesses. The retention of internal reserves is done
while also taking into account return to shareholders, operating performance and the optimal balance for
stable dividends. The Group therefore strives to maintain stable and continuous dividends. The portion of
dividends linked to operating results is determined by setting a consolidated payout ratio target of
approximately 30%.
Regarding dividend payments for the fiscal year ended March 31, 2012, the Group projects annual
dividends of 30 yen per share, including 20 yen per share to be submitted for resolution at the Board of
Directors’ Meeting planned for May 18, 2012.
4

2. The Group’s Outline of Operations
The following outline of operations lists the Group’s primary business segments and major subsidiaries.
(Consolidated subsidiaries)
Domain Primary Business Description Region Company Name
Digital Entertainment
Plans, develops, distributes, and
operates games digital
entertainment primarily in the form
of computer games
Japan SQUARE ENIX CO., LTD. TAITO CORPORATION SMILE-LAB CO., LTD.
North America
SQUARE ENIX, INC. CRYSTAL DYNAMICS, INC. EIDOS INTERACTIVE CORP.
Europe SQUARE ENIX LTD. IO INTERACTIVE A/S
Asia SQUARE ENIX (China) CO., LTD. HUANG LONG CO., LTD.
Amusement
Operation of amusement facilities
and planning, development and
distribution of arcade game
machines for amusement facilities
and related products
Japan TAITO CORPORATION SQUARE ENIX CO., LTD.
Publication Comic books, game strategy
books, comic magazines, etc.
Japan SQUARE ENIX CO., LTD.
North America
SQUARE ENIX, INC.
Europe SQUARE ENIX LTD.
Merchandising
Planning, production, distribution
and licensing of derivative
products of titles owned by the
Group
Japan SQUARE ENIX CO., LTD. TAITO CORPORATION
North America
SQUARE ENIX, INC.
Europe SQUARE ENIX LTD.
(Note) The above table lists major consolidated subsidiaries only.
5

The Group’s Business Diagram:
Note: Above business diagram only includes key consolidated subsidiaries.
Note: Above business diagram only includes key consolidated subsidiaries.
6

3. Management Policy
(1) Management philosophy
With a philosophy "to spread happiness across the globe by providing unforgettable experiences," the
Group offers advanced, high-quality content and services. The Group strives to reward shareholders by
maximizing profit based on efficient use of resources in the generation of sustained business development
and growth.
(2) Management targets
The Group recognizes the utmost importance of achieving growth underpinned by profitability. The Group
pursues targets of generating an earnings per share growth rate of over 10% and a recurring income to
sales ratio of above 20%.
(3) Medium- and long-term management strategy
Management’s key task is to create advanced, high-quality content and services that allow the Group to
grow in the medium- and long-term while maintaining profitability. As the development and popularization of
information technology (IT) and network environments rapidly advance, the Group anticipates a major
transformation in the structure of the digital entertainment industry. The Group believes that this will be
driven by factors such as increased consumer needs in the area of network-compliant entertainment and
growing access to a diverse range of content by users of multi-function devices. The Group strives to
respond to these changes, and has adopted a medium- to long-term management strategy that focuses on
pioneering a new era in digital entertainment.
(4) Issues facing management
In order to achieve the Group’s medium- to long-term strategy, it is imperative to expand its global business
and meet customers’ diverse content needs. To do so, it is critically important that the Group acquires and
develops ideally suited human resources.
7

4. Consolidated Financial Statements
(1) Consolidated Balance Sheets
(Millions of yen)
As of March 31, 2012 As of March 31, 2011
Assets
Current assets
Cash and deposits 111,495 111,126
Notes and accounts receivable 18,431 15,474
Merchandise and finished goods 2,343 2,992
Work in progress 738 287
Raw materials and supplies 573 427
Content production account 25,047 19,890
Deferred tax assets 5,022 4,493
Income taxes receivable 6,396 6,907
Other 2,236 2,821
Allowance for doubtful accounts (124) (120)
Total current assets 172,161 164,301
Non-current assets
Property and equipment
Buildings and structures 16,645 17,617
Accumulated depreciation (12,414) (12,771)
Buildings and structures (net) 4,231 4,846
Tools and fixtures 11,147 10,840
Accumulated depreciation (9,245) (9,031)
Tools and fixtures (net) 1,902 1,808
Amusement equipment 19,601 19,948
Accumulated depreciation (17,008) (17,643)
Amusement equipment (net) 2,593 2,304
Other 193 188
Accumulated depreciation (127) (99)
Other (net) 65 89
Land 8,102 8,277
Construction in progress 288 2
Total property and equipment 17,183 17,328
Intangible assets
Other 10,121 10,324
Total intangible assets 10,121 10,324
Investments and other assets
Investment securities 598 386
Rental deposits 12,785 12,316
Deferred tax assets 460 1,082
Other 1,341 1,280
Allowance for doubtful accounts (672) (683)
Total investments and other assets 14,514 14,382
Total non-current assets 41,819 42,034
Total assets 213,981 206,336
8

(Millions of yen)
As of March 31, 2012 As of March 31, 2011
Liabilities
Current liabilities
Notes and accounts payable 9,220 7,777
Short-term loans 5,253 1,338
Accrued income taxes 4,034 2,269
Reserve for bonuses 1,200 1,453
Allowance for sales returns 1,545 1,780
Allowance for game arcade closings 260 487
Asset retirement obligation 2 63
Other 12,258 13,332
Total current liabilities 33,778 28,504
Non-current liabilities
Corporate bonds 35,000 35,000
Allowance for employees' retirement benefits 3,808 3,061
Allowance for directors' retirement benefits 234 266
Allowance for game arcade closings 584 590
Deferred tax liabilities 2,605 2,577
Asset retirement obligation 149 657
Other 523 534
Total non-current liabilities 42,906 42,687
Total liabilities 76,684 71,192
Net assets
Shareholders' equity
Common stock 15,204 15,204
Capital surplus 44,444 44,444
Retained earnings 85,320 82,711
Treasury stock (861) (859)
Total shareholders' equity 144,108 141,501
Accumulated other comprehensive income
Unrealized loss on revaluation of other investment securities 124 (14)
Foreign currency translation adjustments (8,696) (7,929)
Total accumulated other comprehensive income (8,572) (7,943)
Stock acquisition rights 977 814
Minority interests in consolidated subsidiaries 783 771
Total net assets 137,297 135,143
Total liabilities and net assets 213,981 206,336
9

(2) Consolidated Income Statement and Consolidated Statement of Comprehensive Income
Consolidated Income Statement
(Millions of yen)
Fiscal year ended Fiscal year ended
March 31, 2012 March 31, 2011
Net sales 127,896 125,271
Cost of sales 76,268 75,846
Gross profit 51,627 49,424
Reversal of allowance for sales returns 1,706 4,046
Provision for allowance for sales returns 1,502 1,779
Net gross profit 51,831 51,691
Selling, general and administrative expenses
Packaging freight charge 1,812 2,336
Advertising expense 7,258 7,935
Sales promotion expense 63 67
Provision for allowance for doubtful accounts 67 -
Compensation for directors 541 596
Salaries 12,195 12,534
Provision of reserve for bonuses 1,814 1,408
Net periodic pension costs 1,288 1,135
Provision to reserve for directors' retirement benefits 13 15
Welfare expense 1,523 1,463
Rental expense 1,616 1,782
Commissions paid 4,621 4,228
Depreciation and amortization 1,000 1,903
Other 7,298 8,956
Total selling, general and administrative expenses 41,118 44,365
Operating income 10,713 7,325
Non-operating income
Interest income 136 95
Dividends received 4 36
Rental income 17 24
Miscellaneous income 127 190
Total non-operating income 286 347
Non-operating expenses
Interest expenses 61 59
Commissions paid 100 44
Foreign exchange loss 536 2,149
Miscellaneous loss 3 28
Total non-operating expenses 701 2,282
Recurring income 10,297 5,390
10

Consolidated Income Statement
(Millions of yen)
Fiscal year ended Fiscal year ended
March 31, 2012 March 31, 2011
Extraordinary gain
Gain on sale of property and equipment - 1
Gain on sale of investment securities 48 0
Gain on sale of stocks of subsidiaries and affiliates 192 -
Reversal of allowance for doubtful accounts - 94
Gain on reversal of subscription rights to shares 46 125
Gain on disposition of foreign currency translation adjustment - 317
Other 18 94
Total extraordinary gain 305 633
Extraordinary loss
Loss on sale of property and equipment 30 1
Loss on disposal of property and equipment 352 621
Loss on liquidation of subsidiaries and affiliates - 136
Loss on evaluation of investment securities 0 175
Impairment loss 130 8,853
Provision of allowance for game arcade closings 78 311
- 462
Loss on content - 2,074
Loss on disposal of content 93 2,398
Other 55 969
Total extraordinary loss 741 16,007
9,862 (9,983)
Dividends distribution from silent partnership (tokumei-kumiai) (4) (12)
Income (loss) before income taxes and minority interests 9,866 (9,970)
Income taxes-current 3,763 1,738
Refunded income taxes (50) (2,249)
Deferred income taxes 79 2,594
Total income taxes 3,792 2,083
Income (loss) before net income or minority interests 6,074 (12,054)
Minority interests income (loss) 13 (11)
Net income (loss) 6,060 (12,043)
Income (loss) before dividends distribution from silent partnership,
income taxes (tokumei-kumiai)
Loss on adjustment for changes of accounting standard for asset
retirement obligation
11

Consolidated Statement of Comprehensive Income
(Millions of yen)
Fiscal year ended Fiscal year ended
March 31, 2012 March 31, 2011
Income (loss) before net income or minority interests 6,074 (12,054)
Other comprehensive income
Valuation difference on available-for-sale securities 139 (5)
Foreign currency translation adjustment (761) (3,034)
Other comprehensive income (622) (3,040)
Comprehensive income 5,451 (15,094)
(Breakdown)
Comprehensive income attributable to owners of the parent 5,431 (15,026)
Comprehensive income attributable to minority interests 19 (67)
12
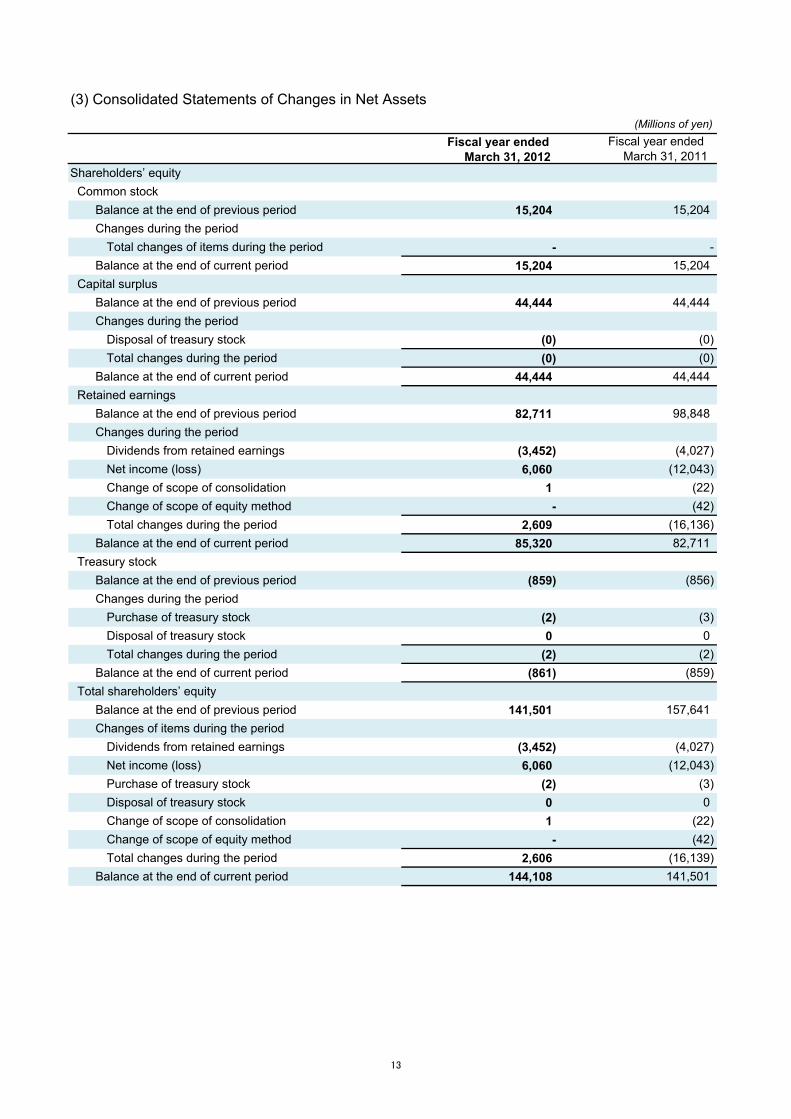
(3) Consolidated Statements of Changes in Net Assets
(Millions of yen)
Fiscal year ended Fiscal year ended
March 31, 2012 March 31, 2011
Shareholders’ equity
Common stock
Balance at the end of previous period 15,204 15,204
Changes during the period
Total changes of items during the period - -
Balance at the end of current period 15,204 15,204
Capital surplus
Balance at the end of previous period 44,444 44,444
Changes during the period
Disposal of treasury stock (0) (0)
Total changes during the period (0) (0)
Balance at the end of current period 44,444 44,444
Retained earnings
Balance at the end of previous period 82,711 98,848
Changes during the period
Dividends from retained earnings (3,452) (4,027)
Net income (loss) 6,060 (12,043)
Change of scope of consolidation 1 (22)
Change of scope of equity method - (42)
Total changes during the period 2,609 (16,136)
Balance at the end of current period 85,320 82,711
Treasury stock
Balance at the end of previous period (859) (856)
Changes during the period
Purchase of treasury stock (2) (3)
Disposal of treasury stock 0 0
Total changes during the period (2) (2)
Balance at the end of current period (861) (859)
Total shareholders’ equity
Balance at the end of previous period 141,501 157,641
Changes of items during the period
Dividends from retained earnings (3,452) (4,027)
Net income (loss) 6,060 (12,043)
Purchase of treasury stock (2) (3)
Disposal of treasury stock 0 0
Change of scope of consolidation 1 (22)
Change of scope of equity method - (42)
Total changes during the period 2,606 (16,139)
Balance at the end of current period 144,108 141,501
13

(Millions of yen)
Fiscal year ended Fiscal year ended
March 31, 2012 March 31, 2011
Accumulated other comprehensive income
Unrealized gain on revaluation of other investment securities
Balance at the end of previous period (14) (9)
Changes during the period
Net changes in items other than shareholders’ equity 139 (5)
Total changes during the period 139 (5)
Balance at the end of current period 124 (14)
Foreign currency translation adjustments
Balance at the end of previous period (7,929) (4,951)
Changes during the period
Net changes in items other than shareholders’ equity (767) (2,977)
Total changes during the period (767) (2,977)
Balance at the end of current period (8,696) (7,929)
Total accumulated other comprehensive income
Balance at the end of previous period (7,943) (4,960)
Changes during the period
Net changes in items other than shareholders’ equity (628) (2,983)
Total changes during the period (628) (2,983)
Balance at the end of the current period (8,572) (7,943)
Stock acquisition rights
Balance at the end of previous period 814 715
Changes during the period
Net changes in items other than shareholders’ equity 163 98
Total changes during the period 163 98
Balance at the end of current period 977 814
Minority interests in consolidated subsidiaries
Balance at the end of previous period 771 861
Changes during the period
Net changes in items other than shareholders’ equity 12 (90)
Total changes during the period 12 (90)
Balance at the end of current period 783 771
Total net assets
Balance at the end of previous period 135,143 154,258
Changes during the period
Dividends from retained earnings (3,452) (4,027)
Net income (loss) 6,060 (12,043)
Purchase of treasury stock (2) (3)
Disposal of treasury stock 0 0
Change of scope of consolidation 1 (22)
Change of scope of equity method - (42)
Net changes in items other than shareholders’ equity (453) (2,975)
Total changes during the period 2,153 (19,115)
Balance at the end of current period 137,297 135,143
14

(4) Consolidated Statements of Cash Flows
(Millions of yen)
Fiscal year ended Fiscal year ended
March 31, 2012 March 31, 2011
Cash flows from operating activities
Income (loss) before income taxes and minority interest 9,866 (9,970)
Depreciation and amortization 5,039 6,608
Amortization of goodwill - 1,492
Impairment loss 130 8,853
- 462
Loss on content - 1,174
Loss on disposal of content - 731
Loss on disaster - 48
Increase (decrease) in allowance for doubtful accounts (1) (394)
Increase (decrease) in provision for bonuses (232) (121)
Increase (decrease) in provision for sales returns (203) (2,026)
Increase (decrease) in provision for retirement benefits 747 891
Increase (decrease) in provision for directors' retirement benefits (31) 15
Increase (decrease) in provision for loss on store closing (186) 166
Interest and dividends income (141) (131)
Interest expenses paid 61 59
Foreign exchange losses (gains) 399 2,206
Loss (gain) on sales of investment securities (48) (0)
Loss (gain) on sales of stocks of subsidiaries and affiliates (192) -
Loss (gain) on valuation of investment securities 0 175
Loss on retirement of noncurrent assets 352 621
Loss on sales of noncurrent assets 30 1
Decrease (increase) in notes and accounts receivable-trade (3,008) 13,800
Decrease (increase) in inventories (5,137) (4,827)
Increase (decrease) in notes and accounts payable-trade 1,102 (2,007)
Decrease (increase) in other current assets 547 2,218
Decrease (increase) in other noncurrent assets 56 67
Increase (decrease) in other current liabilities (1,078) (2,447)
Other, net (26) 258
Subtotal 8,048 17,927
Interest and dividends income received 108 198
Interest expenses paid (39) (54)
Income taxes paid (1,842) (1,994)
Income taxes refund 961 1,226
Income taxes paid for prior periods (450) (2,475)
Net cash provided by operating activities 6,786 14,827
Loss on adjustment for changes of accounting standard for asset
retirement obligations
15

(Millions of yen)
Fiscal year ended Fiscal year ended
March 31, 2012 March 31, 2011
Cash flows from investing activities
Payments into time deposits (748) (1,062)
Proceeds from withdrawal of time deposits 747 1,052
Proceeds from redemption of securities - 35,000
Proceeds from sales of investment securities 49 0
Purchase of property and equipment (4,620) (4,700)
Proceeds from sales of property and equipment 180 45
Purchase of intangible assets (842) (931)
Proceeds from sales of intangible assets - 0
Purchase of investments in subsidiaries (9) (20)
Proceeds from the sale of stocks of subsidiaries and affiliates 192 -
Payments for rental deposits (1,492) (143)
Proceeds from collection of rental deposits 1,084 1,482
Other, net (319) (314)
Net cash provided by (used in) investing activities (5,778) 30,407
Cash flows from financing activities
Increase (decrease) in short-term loans payable 3,791 (1,325)
Redemption of bonds - (37,000)
Purchase of treasury stock (2) (3)
Cash dividends paid (3,446) (4,026)
Other, net (42) 0
Net cash provided by (used in) financing activities 299 (42,354)
Effect of exchange rate change on cash and cash equivalents (879) (2,744)
Net increase (decrease) in cash and cash equivalents 428 135
Cash and cash equivalents at the beginning of the year 109,751 109,717
(64) (101)
Cash and cash equivalents at end of the year 110,116 109,751
Decrease in cash and cash equivalents resulting from exclusion of
subsidiaries from consolidation
16

5. Segment Information
1. Outline of reporting segments
2. Information on sales and income by reporting segment
Fiscal Year Ended March 31, 2011
(Millions of yen)
Reporting SegmentsDigital
Entertainment Amusement Publication Merchandising Total
Adjustment
(Note 1)
Consolidated
total (Note 2)
Sales and operating income
Net sales
(1) Sales to outside customers 64,203 45,012 13,045 3,009 125,271 - 125,271
(2) Intersegment sales 0 0 - 8 9 (9) -
Total 64,204 45,012 13,045 3,018 125,280 (9) 125,271
Segment operating income 11,283 2,178 3,204 680 17,346 (10,021) 7,325
Segment assets 44,471 23,241 5,252 2,803 75,768 130,568 206,336
Other items
Depreciation and amortization 1,855 3,987 22 18 5,884 724 6,608
874 3,779 11 12 4,677 685 5,363
Notes: 1. (1)
(2)
(3)
(4)
2.
3. Information on sales and income by reporting segment
Fiscal Year Ended March 31, 2012
Reporting Segments (Millions of yen)
Digital
Entertainment Amusement Publication Merchandising Total
Adjustment
(Note 1)
Consolidated
total (Note 2)
Sales and operating income
Net sales
(1) Sales to outside customers 71,871 41,921 11,335 2,767 127,896 - 127,896
(2) Intersegment sales - - - 0 0 0 -
Total 71,871 41,921 11,335 2,767 127,896 0 127,896
Segment operating income 12,602 2,552 2,575 742 18,472 (7,759) 10,713
Segment assets 49,401 23,916 5,492 2,957 81,767 132,213 213,981
Other items
Depreciation and amortization 1,589 3,363 22 16 4,991 48 5,039
936 3,932 1 - 4,870 339 5,209
Notes: 1. (1)
(2)
(3)
(4)
2.
4. Information on sales by region
Fiscal Year Ended March 31, 2012
(Millions of yen)
Japan Asia Total
Consolidated sales 101,686 2,415 127,896
Note: The classification of geographic segments is based on location of customer.
13,180
Segment adjustments (7,759 million yen) include unallocated corporate general and administrative expenses (7,784
million yen).
Segment assets adjustment of ¥132,213 million includes unallocated assets of ¥132,329 million. These assets mainly
consist of surplus funds (including cash and deposits).
Segment operating income is adjusted in operating income on the consolidated income statement.
Increases in property, plant and equipment and
intagible assets
North America Europe
10,614
Depreciation and amortization adjustment of ¥48 million relates to unallocated corporate assets.
The adjustment increase of ¥339 million in property, plant and equipment and intangible assets relates to unallocated
corporate assets.
The Group’s reporting segments are business units for which discrete financial data is available and periodically reviewed by the Board of
Directors in the determination of resource allocation as well as the evaluation of business performance.
Segment assets adjustment of ¥130,568 million includes unallocated assets of ¥130,440 million. These assets mainly
consist of surplus funds (including cash and deposits).
Segment operating income is adjusted in operating income on the consolidated income statement.
Under internationally renowned brands such as SQUARE ENIX, TAITO and EIDOS, the Square Enix Group strives to offer high quality
entertainment content and services through a variety of usage environments to match customer lifestyles.
To this end, the Group offers entertainment content and services in a variety of forms including: (1) interactive digital content for game consoles
(including handheld game machines), personal computers and mobile phones (including smartphones) in the “Digital Entertainment” segment;
(2) amusement facility operation as well as the sales and rental of arcade game machines in the “Amusement” segment; (3) publication of comic
books, game strategy books and comic magazines in the “Publication” segment; and (4) planning, production, distribution and licensing of
derivative products in the “Merchandising” segment. These four classifications serve as the Group’s reporting segments.
Segment adjustments (10,021 million yen) include amortization of goodwill (1,492 million yen) and unallocated corporate
operating expenses (8,573 million yen).
Increases in property, plant and equipment and
intagible assets
Depreciation and amortization adjustment of ¥724 million relates to unallocated corporate assets.
The adjustment increase of ¥685 million in property, plant and equipment and intangible assets relates to unallocated
corporate assets.
17


