
CONSUMER LEISURE BEHAVIOR CHANGE
BASED ON THE NEW WEEKEND POLICY IN TAIWAN, R.O.C
by Yi-Ping Lan
A Research Paper
Submitted in Partial fulfillment of the Requirements for the
Master of Science Degree With a Major in
Hospitality and Tourism
Approved: 6 Semester Credits
___________________________
Dr. Christine J. Clements Thesis Advisor
Thesis Committee Members:
___________________________
Dr. Charles J. Metelka
___________________________ Dr. Sharon A. Nero
The Graduate College University of Wisconsin-Stout
December, 2000
i
The Graduate College
University of Wisconsin-Stout
Menomonie, WI 54751
ABSTRACT
Lan Yi-Ping Y.L.
(Writer) (Last Name) (First) (Initial)
Consumer Leisure Behavior Change Based on the New Weekend Policy in Taiwan
(Title)
Hospitality and Tourism Christine J. Clements 12/2000 122
(Graduate Major) (Research Advisor) (Month/Year) (No. of Pages)
American Psychological Association (A. P. A) Style
(Name of Style Manual Used in this Study)
Keywords: tourism, leisure, recreation, travel, weekend, policy, consumer behavior,
barrier, consideration, earthquake, and Taiwan.
Following the continuous expansion of the economy in Taiwan, income keeps
increasing. Simultaneously, more Taiwanese think highly of quality of life as well as
leisure. In particular, leisure times, attitudes, and activities change most dramatically as
Taiwan move from being a rural-agrarian to being an urban-industrial society. The
expanding economic environment has stimulated the growth of the tourism industry in
Taiwan. On January 10th 1998, the government put into effect the alternating two-day
weekend policy, a policy whereby the second and fourth Saturdays of every month would
be days off.
The purpose of this study was to analyze the changes in consumer leisure patterns
in addition to the domestic travel patterns based on the new weekend policy in Taiwan,
R.O.C. Objectives of the study were to identify the development stage of the alternating
ii
two-day weekend policy, the consumer leisure preferences, the effects of the new
weekend policy in consumer leisure behavior, and the factors impacting domestic travel
decisions. Five hundred seventy questionnaires were delivered to consumers through 12
travel agents in Taipei, Taiwan, and 445 completed and valid questionnaires were
obtained throughout the study with a 78.1 percent response rate.
The findings of this study show that the usage of the weekends was continuously
increased since the implementation of the alternating two-day weekend policy. In fact,
consumers’ leisure and travel patterns in Taiwan have been changed since the
implementation of the alternating two-day weekend policy. The alternating two-day
weekend policy has promoted leisure and travel market in Taiwan. People are willing to
spend more time on leisure activities. The majority of respondents preferred to go travel
suburban recreation areas with friends or families for one or two days during two-day
weekends. Also, respondents travel not for sightseeing and pleasure purpose anymore but
for escaping from the ordinary.
However, travel jams and crowds kept many respondents away from domestic
travel. Thus, many respondents chose to stay close to home for fear of traffic and crowds.
Indeed, the majority of respondents frequently participated leisure activities within the
normal living environment. Also, leisure activities with high social content with other
people are well liked in large metropolitan area. Urban activities and more easily
accessible entertainment options seem to be on the way, including exercise. Safety and
security were the most important concerns for the travel decisions.
No doubt, more leisure related facilities are considered necessary and requested
by the people in Taiwan. The government and the industry are definitely needed to work
iii
on the development of the leisure related facilities. Furthermore, the five-day workweek
policy already be passed in Taiwan and will soon implement in the following year, a
solution for all the problems occurred by the alternating two-day weekend policy has
emerged.
iv
ACKNOWLEDGEMENTS
I would like to express my heartfelt thanks and acknowledge everyone who has
been instrumental in making this study a success. A deep sense of indebtedness and
gratitude to my committee members Dr. Christine Clements, Dr. Charles Metelka, and
Dr. Sharon Nero for advising me to design a study of action and guiding me to its
completion. A very special thanks and deep sense of appreciation to Dr. Christine
Clements, Committee Chairperson, whose unceasing help, relentless patience, persistent
motivation, and worthy information has made this study possible. A special thanks and
admiration to Dr. Charles Metelka for his valuable suggestions and professional
knowledge, and to Dr. Sharon A. Nero for always being an enthusiastic supporter of this
study and instructed me when I needed suggestions.
Appreciation is also express to fifteen Taiwanese students at the University of
Wisconsin-Stout who are also my friends for their help with the pilot test. Gratitude is
also expressed to the research assistants in the travel agents in Taipei, Taiwan. They
made easier for me to collected all data needed for the study. Finally, I would especially
thank my family, professors, and friends who have given their support and
encouragement to me at the time for fulfilling this study.

v
TABLE OF CONTENTS
ABSTRACT------------------------------------------------------------------------------------------ i
ACKNOWLEDGEMENTS-----------------------------------------------------------------------iv
TABLE OF CONTENTS ------------------------------------------------------------------------- v
LIST OF TABLES --------------------------------------------------------------------------------ix
LIST OF FIGURES -------------------------------------------------------------------------------xi
CHAPTER ONE: INTRODUCTION
New Weekend Policy Stimulates the Tourism Industry in Taiwan ---------------- 2
Statement of Problem -------------------------------------------------------------------- 5
Objectives ---------------------------------------------------------------------------------- 6
Limitations --------------------------------------------------------------------------------- 7
Definition of Terms ---------------------------------------------------------------------- 7
CHAPTER TWO: REVIEW OF LITERATURE
Historical Development of the Two-Day Weekend Policy ------------------------- 9
Historical Development Stages of the Two-Day Weekend Policy
in Japan------------------------------------------------------------------------------ 16
A Profile of Taiwan --------------------------------------------------------------------- 19
Taipei at a Glance ----------------------------------------------------------------- 20
Trends in Leisure, Recreation, and Travel in Taiwan ------------------------------- 21
Leisure, Recreation, and Travel Patterns--------------------------------------- 23
Barriers to Leisure, Recreation, and Travel -------------------------------- 24
The Alternating Two-Day Weekend Policy ----------------------------------------- 28
Five-day Workweek in 2001 ---------------------------------------------------- 32
vi
Earthquake Hurts the Tourism Industry in Taiwan --------------------------------- 33
Safety Issues------------------------------------------------------------------------ 33
Environmental Impacts on Tourist Destination ------------------------------ 34
Leisure and Recreation ------------------------------------------------------------------ 35
Leisure ------------------------------------------------------------------------------ 35
Leisure and Time ----------------------------------------------------------- 37
Leisure and Work ---------------------------------------------------------- 38
Theories of work-leisure relationship ---------------------------- 39
Leisure, Psychological Well-Being, and Mental Health -------------- 40
Leisure and Tourism ------------------------------------------------------ 42
Recreation --------------------------------------------------------------------------- 42
Classification of Recreational Activities -------------------------------- 43
Chinese Leisure Perceptions ----------------------------------------------------------- 45
Realms of the Self ----------------------------------------------------------------- 45
The Aesthetic Self and Confucian Responsibility ---------------------------- 46
Leisure Environment and Leisure Behavior ----------------------------------- 47
The Leisured Class? The Moneyed Class! ------------------------------------- 48
Consumer Behavior in Travel and Tourism ------------------------------------------ 49
Consumers’ Needs and Wants --------------------------------------------------- 53
Motivation -------------------------------------------------------------------------- 55
Summary ---------------------------------------------------------------------------- 56
CHAPTER THREE: METHODOLOGY
Research Design -------------------------------------------------------------------------- 58
vii
Sources of Data --------------------------------------------------------------------------- 60
Population -------------------------------------------------------------------------- 60
Sample Selection ------------------------------------------------------------------ 60
Survey Administration ------------------------------------------------------------------ 61
Instrumentation --------------------------------------------------------------------------- 63
Pilot Study--------------------------------------------------------------------------------- 66
Data Analysis ----------------------------------------------------------------------------- 67
Research Schedule ----------------------------------------------------------------------- 68
CHAPTER FOUR: RESULTS AND DISCUSSIONS
General Information of Respondents -------------------------------------------------- 70
The Preferences in Consumer Leisure Patterns ------------------------------------- 75
Changes in Consumer Leisure Patterns ----------------------------------------------- 80
Changes in Domestic Travel Patterns ------------------------------------------------- 83
Day of Week ----------------------------------------------------------------------- 84
Leisure Area ------------------------------------------------------------------------ 85
Purpose for Travel ----------------------------------------------------------------- 86
Type of Travel --------------------------------------------------------------------- 87
Organizing Method for Travel --------------------------------------------------- 88
Length of Trip ---------------------------------------------------------------------- 89
The Factors Impacting Consumers’ Decisions on Travel -------------------------- 91
The Primary Barriers for Travel ------------------------------------------------ 91
Considerations Affecting Travel Decisions ------------------------------------ 95
The Impacts of the Earthquake on Domestic Travel ------------------------- 97
viii
Summary ---------------------------------------------------------------------------------- 99
CHAPTER FIVE: SUMMARY, RECOMMENDATIONS, AND CONCLUSION
Summary -------------------------------------------------------------------------------- 101
Recommendations---------------------------------------------------------------------- 104
Recommendations for the Government in Taiwan ------------------------- 104
Recommendations for Leisure and Tourism Providers (the Industry)---- 105
Recommendations for Future Study ------------------------------------------ 106
Conclusion ------------------------------------------------------------------------------ 106
REFERENCES ---------------------------------------------------------------------------------- 109
APPENDIX A: Cover Letter------------------------------------------------------------------- 117
APPENDIX B: Questionnaire ----------------------------------------------------------------- 118
ix
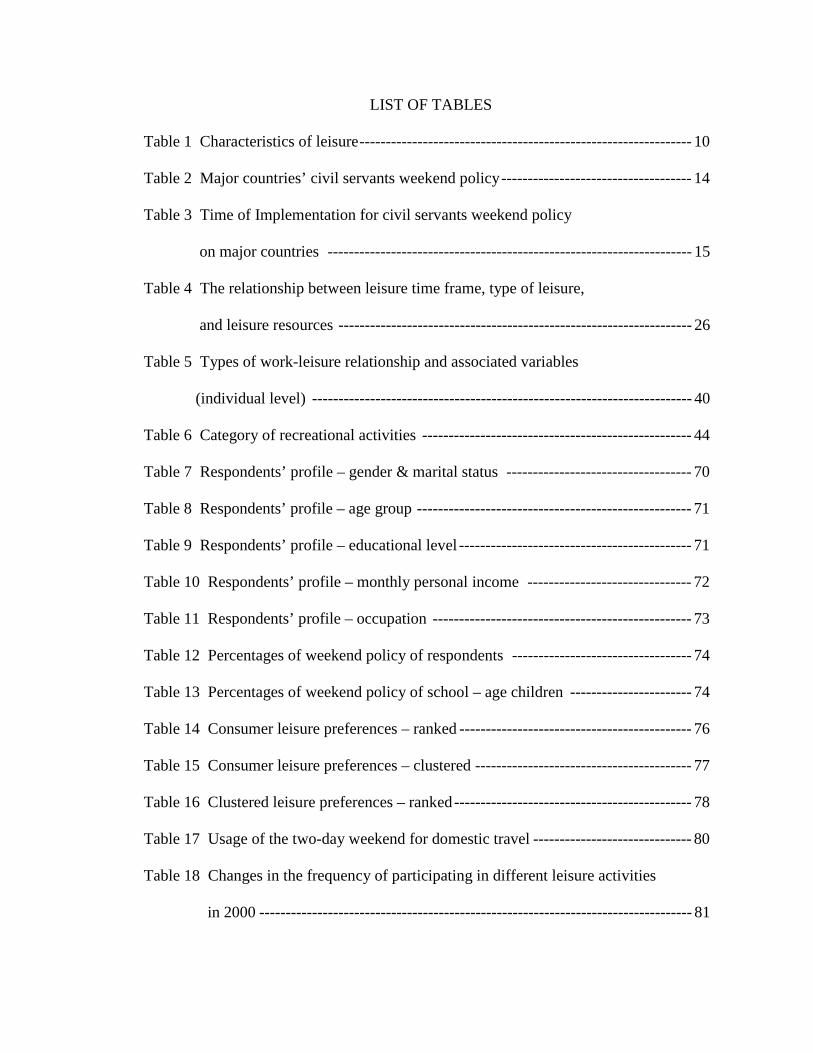
LIST OF TABLES
Table 1 Characteristics of leisure--------------------------------------------------------------- 10
Table 2 Major countries’ civil servants weekend policy------------------------------------ 14
Table 3 Time of Implementation for civil servants weekend policy
on major countries --------------------------------------------------------------------- 15
Table 4 The relationship between leisure time frame, type of leisure,
and leisure resources ------------------------------------------------------------------- 26
Table 5 Types of work-leisure relationship and associated variables
(individual level) ------------------------------------------------------------------------ 40
Table 6 Category of recreational activities --------------------------------------------------- 44
Table 7 Respondents’ profile – gender & marital status ----------------------------------- 70
Table 8 Respondents’ profile – age group ---------------------------------------------------- 71
Table 9 Respondents’ profile – educational level -------------------------------------------- 71
Table 10 Respondents’ profile – monthly personal income ------------------------------- 72
Table 11 Respondents’ profile – occupation ------------------------------------------------- 73
Table 12 Percentages of weekend policy of respondents ---------------------------------- 74
Table 13 Percentages of weekend policy of school – age children ----------------------- 74
Table 14 Consumer leisure preferences – ranked -------------------------------------------- 76
Table 15 Consumer leisure preferences – clustered ----------------------------------------- 77
Table 16 Clustered leisure preferences – ranked--------------------------------------------- 78
Table 17 Usage of the two-day weekend for domestic travel ------------------------------ 80
Table 18 Changes in the frequency of participating in different leisure activities
in 2000 ---------------------------------------------------------------------------------- 81
x
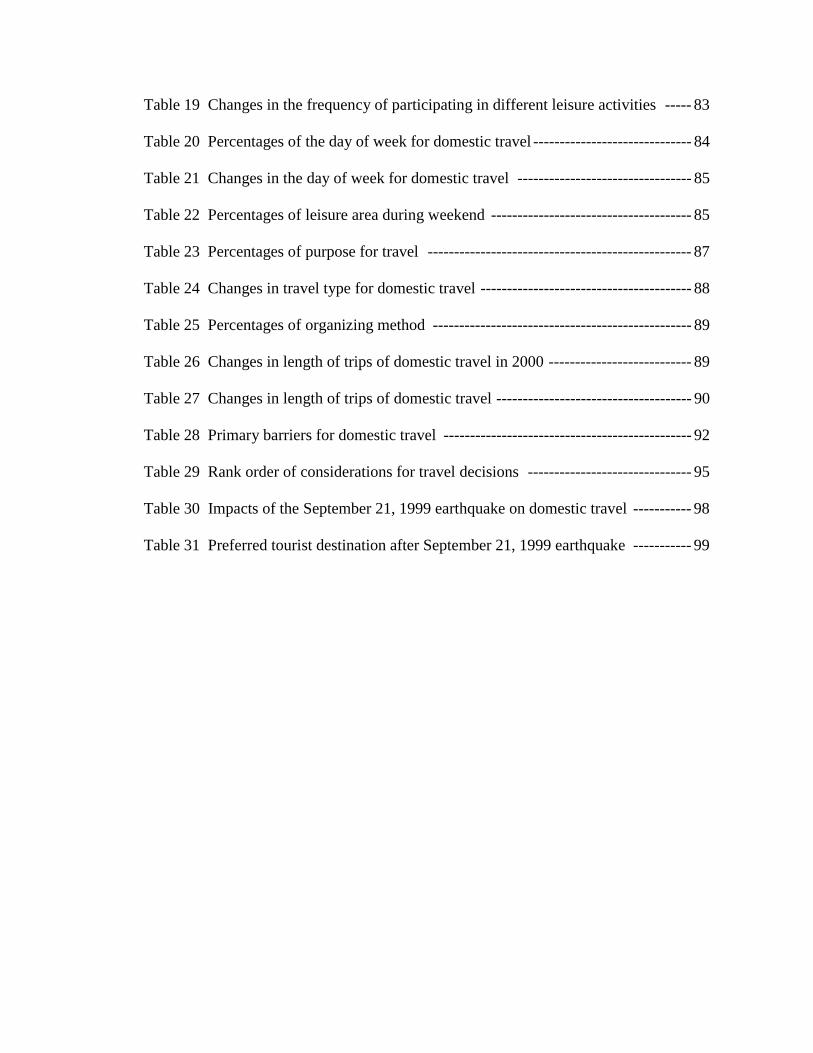
Table 19 Changes in the frequency of participating in different leisure activities ----- 83
Table 20 Percentages of the day of week for domestic travel ------------------------------ 84
Table 21 Changes in the day of week for domestic travel --------------------------------- 85
Table 22 Percentages of leisure area during weekend -------------------------------------- 85
Table 23 Percentages of purpose for travel -------------------------------------------------- 87
Table 24 Changes in travel type for domestic travel ---------------------------------------- 88
Table 25 Percentages of organizing method ------------------------------------------------- 89
Table 26 Changes in length of trips of domestic travel in 2000 --------------------------- 89
Table 27 Changes in length of trips of domestic travel ------------------------------------- 90
Table 28 Primary barriers for domestic travel ----------------------------------------------- 92
Table 29 Rank order of considerations for travel decisions ------------------------------- 95
Table 30 Impacts of the September 21, 1999 earthquake on domestic travel ----------- 98
Table 31 Preferred tourist destination after September 21, 1999 earthquake ----------- 99
xi
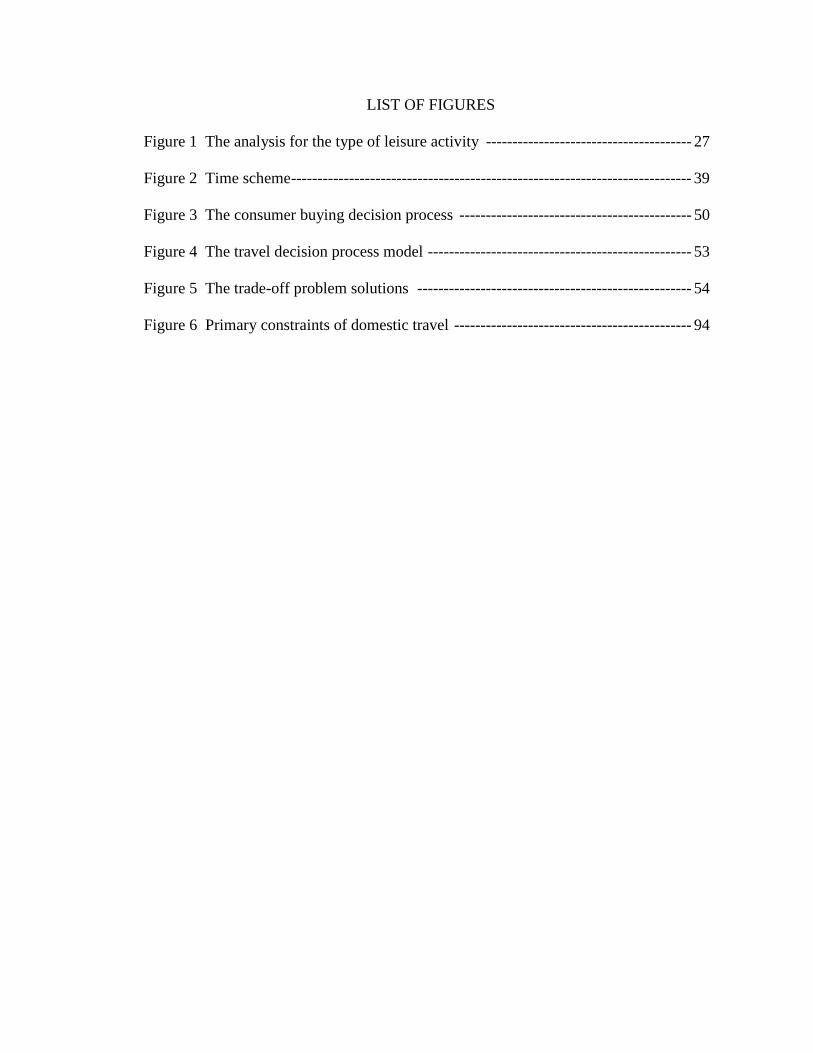
LIST OF FIGURES
Figure 1 The analysis for the type of leisure activity --------------------------------------- 27
Figure 2 Time scheme---------------------------------------------------------------------------- 39
Figure 3 The consumer buying decision process -------------------------------------------- 50
Figure 4 The travel decision process model -------------------------------------------------- 53
Figure 5 The trade-off problem solutions ---------------------------------------------------- 54
Figure 6 Primary constraints of domestic travel --------------------------------------------- 94
CHAPTER ONE
INTRODUCTION
In the twentieth century, people have increased living standards and better health
to extend life. Indeed, the importance of leisure in human life has grown to the point that
it represents larger expenditures for many individuals and families than outlays for
housing, medicine and health, or food (Plog, 1991). In particular, as the rapid
technological innovation and the spread of the factory system made workers’ tasks more
routine. Thus, they tried to find new forms of relief from the monotony of repetitive
work. As urbanization and industrialization altered the existing fabric of society, the shift
of leisure was set in motion. The changed meaning of leisure to relate to everyone rather
than to a privileged few is integrally connected with economic, technological, and social
change (Braden, 1988).
Based on Maslow’s hierarchy of needs, lower level needs must be met before the
higher level needs become important (Maslow, 1943). The physiological needs, such as
hunger and thirst, usually have to be satisfied prior to anything else. With increasing
education, people explore the demands on their lives, and it also brings people’s needs
into the higher level of Maslow’s hierarchy. Besides, a declining percentage of lives
devoted to work, and greater personal freedom have provided an increased potential for
leisure. In addition, the usage of free time in voluntary and pleasurable ways is part of
human life in society.
Kelly and Godbey (1992) mentioned that leisure is experienced through a myriad
of social activities. Social experiences shape not only people’s life satisfaction and self-
definition, but also influence family relations, friendships, the environment, and the
2
economy. Therefore, leisure becomes a major segment of the society. In the United
States, total spending on leisure is estimated at about $600 billion a year. The average
household spends about seven percent of its income directly on leisure (Godbey, 1999).
Furthermore, leisure-based tourism is the primary resource of the external investment and
spending of the major domestic industries in many other countries.
New Weekend Policy Stimulates the Tourism Industry in Taiwan
Following the continuous expansion of the economy in Taiwan, income keeps
increasing. Simultaneously, more Taiwanese think highly of quality of life as well as
leisure. In particular, leisure times, attitudes, and activities change most dramatically as
Taiwan move from being a rural-agrarian to being an urban-industrial society. The
expanding economic environment has stimulated the growth of the tourism industry in
Taiwan. The frequency of domestic travel has increased along with the rise of personal
income. According to the survey on domestic tourism conducted by the Tourism Bureau
in 1997, the number of domestic travelers was 71 million, which was doubled since 1991
(Tourism Bureau, Ministry of Transportation and Communications, Republic of China,
1997). No doubt, tourism is exploding in Taiwan.
On Saturday, January 10th 1998, the government put into effect the alternating
two-day weekend policy, a policy whereby the second and fourth Saturdays of every
month would be days off. That is, the second and fourth weekends of every month are
two-day weekends while the first, third, and fifth weekends of every month are only one
and half day weekends. Before the implementation of the alternating two-day weekend
policy, the one and half day weekend policy was the official weekend policy in Taiwan.
3
Yet, there had been reverberating in Taiwan for some time about making
Saturdays a day off. Government agencies, such as the Council for Economic Planning
and Development (CEPD) and the Central Personnel Administration (CPA) investigated,
planned and then repeatedly fine-tuned the policy (Hsien, 1998). Departments responsible
for travel and leisure resources, such as the Tourism Bureau, the Construction and
Planning Administration (which oversees national parks), the Council for Cultural Affairs
(which is responsible for cultural centers), and local governments, all pitched in to create
activities that would absorb the masses of people expected to be looking for something to
do (Hsieh, 1998). Some people believe Taiwan has become more of a leisure society
rather than an industrial society because of the alternating two-day weekend policy.
Some people assert that more leisure time represents more consumption that may bring
more business. In the blink of an eye, leisure has become one of Taiwan’s hottest topics
of discussion.
As indicated by the Annual Report on Tourism of the Tourism Bureau, Ministry
of Transportation and Communication, Republic of China (R. O. C) in 1996,
approximately 42 million people visited 79 primary tourist destinations and leisure areas,
and in excess of 50 million people actually participated in travel and other leisure
activities. By calculating the leisure expenditures for each person on transportation, play,
dining, lodging, and other leisure activities, an approximate $40 billion annual business is
estimated for the domestic leisure and travel market in Taiwan. In addition to the effects
of the alternating two-day weekend policy, an additional $8 billion business was added
onto the domestic leisure and travel market (Fung, 1998).
4
Nevertheless, many people in Taiwan have a preference to spend their leisure
time with particular types of leisure activities during the holidays or weekends. Indeed,
many people believe that only the tourism destinations will be able to provide abundant
facilities and services for high quality leisure travel. Unfortunately, the concentrated
population density and the total land usage in Taiwan will somehow limit the
development of leisure-related facilities. Moreover, the existing public transportation
systems and tourism destinations in Taiwan have limited carrying capacity, which should
not be allowed to overload. According to the statistic report, above 70 percent of
Taiwanese prefer to travel during weekends and official vacations (Department of
Statistics, Ministry of Transportation and Communications, R.O.C, 1999). As a result,
traffic jams are foreseen ubiquitously in Taiwan whenever the long-holiday comes. In
particular, nearly all tourism destinations are too crowded by tourists. People often
complain about the lack of leisure facilities and a public transportation system.
While this study looks at the new weekend policy, there is also an earthquake that
impacted consumers’ travel behavior after September 21, 1999. Most people in Taiwan
were asleep at 1:47 a.m. on September 21, 1999 when its most powerful earthquake in
100 years hit the island. Experts estimated that the destructive power of the Chichi
earthquake was double that of the 1995 earthquake in Kobe, Japan. As stated by available
government figures, the Chichi earthquake on September 21, 1999 caused an estimated
$9.2 billion in damage, equal to 3.3 percent of the country’s gross domestic product. The
7.6 magnitude tremor killed 2,321 people, and damaged 82,000 housing units, with its
epicenter in central Nantou County, where agriculture and tourism are the mainstays of
the local economy (Chen, 1999).
5
The earthquake devastated the tourism industry in Taiwan. The Chichi earthquake
left huge scars across a wide swath of the Taiwanese landscape. Indeed, many famous
tourist areas in Nantou County were cut off from the outside world when the road was hit
by a landslide. Taiwan’s strongest earthquake in decades laid waste to key sightseeing
areas and scared away tourists, costing the industry around $281 million. Based on the
industry statistics, 210,000 foreign travelers canceled their visits to Taiwan, and local
travel by Taiwanese had dropped by 90 percent following the quake. Lee Ching-sung, the
head of a tourist association, emphasized that government support was needed to reassure
visitors and rebuild the island’s tourism infrastructure. In 1998, Taiwan received about
2.3 million visitors (Chen, 1999).
Statement of the Problem
The new weekend policy conceived to provide the Taiwanese with more
opportunity for relaxation has also brought anxiety and irritability. Obviously, there were
high expectations that people would embrace this extra time off. Yet, the new weekend
policy had been the cause of many headaches, at least during the initial period of
adjustment. The lack of early planning for the alternating two-day weekend policy caused
many initial problems. For instance, Taiwan’s leisure facilities and transport systems
could not fulfill people’s demand for concentrating their leisure activities onto the
weekends. Besides, not all private businesses followed the government’s weekend policy
by making an extra day off on Saturday. Thus, many parents worried about their children
staying home alone while they still needed to work for the private enterprises during
weekends.
6
In addition, the tourism industry depends on maintaining the attractiveness of the
destinations that travelers would like to see and experience. A high-quality leisure travel
experience is fabricated on the conservation of natural resources, the protection of the
tourism destination environment, and the preservation of the cultural heritage (McIntosh
& Goeldner & Ritchie, 1995). In fact, the environment is the core of the tourism product.
The negative impacts on a tourist destination image could be serious and long lasting.
The purpose of this study was to analyze the changes in consumer leisure patterns
in addition to the domestic travel patterns based on the new weekend policy in Taiwan,
R.O.C.
Objectives
The objectives of this study are as follows:
1. To identify the historical development of the alternating two-day weekend policy in
Taiwan, and the development stages of the two-day weekend policy in Japan.
2. To identify the effects of the alternating two-day weekend policy in leisure patterns in
Taipei, Taiwan.
3. To analyze changes in type, purpose, leisure area, length of trip, and day of week of
domestic travel in Taipei, Taiwan.
4. To determine factors impacting travel decisions based on the new weekend policy in
Taipei, Taiwan.
7
Limitations
The limitations of this particular study would be the following:
1. The translation of the questionnaire between English and Chinese may cause
translation error.
2. The consumer leisure behavior will vary from area to area. Thus, the results of this
study can only be corresponded to the specific area (metropolis) because the sample
was drawn from Taipei, the capital city in Taiwan.
3. In view of the fact that the new holiday policy has only been implemented for two
and half years, certain types of changes in leisure and domestic travel patterns might
not be recognized within short period of time.
4. Because the survey was conducted through travel agencies, the leisure behavior for
those people who did not require assistance from a travel agency or who did not
actually travel would not be included in this study.
5. The aftershock reaction of the September 21 earthquake may cause atypical behavior
changes due to the negative influences on the economic or the living environment.
Definition of Terms
Alternating two-day weekend policy: a policy whereby the second and fourth Saturdays
of every month would be days off in Taiwan.
Long-Weekend: Two days off weekend.
Short-Weekend: One and half day off weekend.
Consumer behavior: A process that includes the acquisition phase, moving to
consumption, and ending with the disposition of the product or service (Lewis,
Chambers, & Chacko, 1995).
8
Domestic tourism: Domestic tourism involves people visiting destinations within their
own country's boundaries (Jafari, 2000).
Leisure: The free time beyond what was required for existence, for individuals to spend
as they please (Boniface & Cooper, 1994).
Recreation: “A pleasurable activity, which may be relatively sedentary, largely pursued
for intrinsic motivation during leisure” (Smith, 1990, p. 253).
Tourism: “When we think of tourism, we think primarily of people who are visiting a
particular place for sightseeing, visiting friends and relatives, taking a vacation, and
having a good time. They may spend their leisure time engaging in various sports,
sunbathing, talking, singing, taking rides, touring, reading, or simply enjoying the
environment” (Goeldner, Ritchie, & McIntosh, 2000, p. 13).
Travel agency in Taiwan: A travel agency is the business, which provides services in
processing travel certificates (includes passport and visa), arranging tours,
accommodations, meals, and other related services (Tang, 1989).
Work: The activities involved in earning a living, and necessary subsidiary activities such
as traveling to work (Parker, 1971).
CHAPTER TWO
REVIEW OF LITERATURE
This chapter covers a review of literature regarding the research. First, an
overview on the development of the two-day weekend policy is contained in this study.
In particular, Japan is studied to give a detailed discussion due to the similar cultural
background. Second, a profile of Taiwan and Taipei where the research took place is
provided. Third, the trends in leisure, recreation, and travel in Taiwan before the
implementation of an alternating two-day weekend policy are reviewed in this section.
Also, the significant factors impacting people’s travel patterns needed to be interpreted
with the effect of the alternating two-day weekend policy. Fourth, more details about the
planning stages as well as the implementation of the alternating two-day weekend policy
are discussed. Fifth, the influences of the September 21, 1999 earthquake played a
consequential factor in the changes of consumer behavior. The sixth section contains
general concepts of leisure, recreation, its related study areas, and its impacts on human
life. Seventh, this study specifies the differences in Chinese leisure perceptions based on
cultural diversity. Consumer behavior in travel and tourism is embodied in the last
section of this chapter.
Historical Development of the Two-Day Weekend Policy
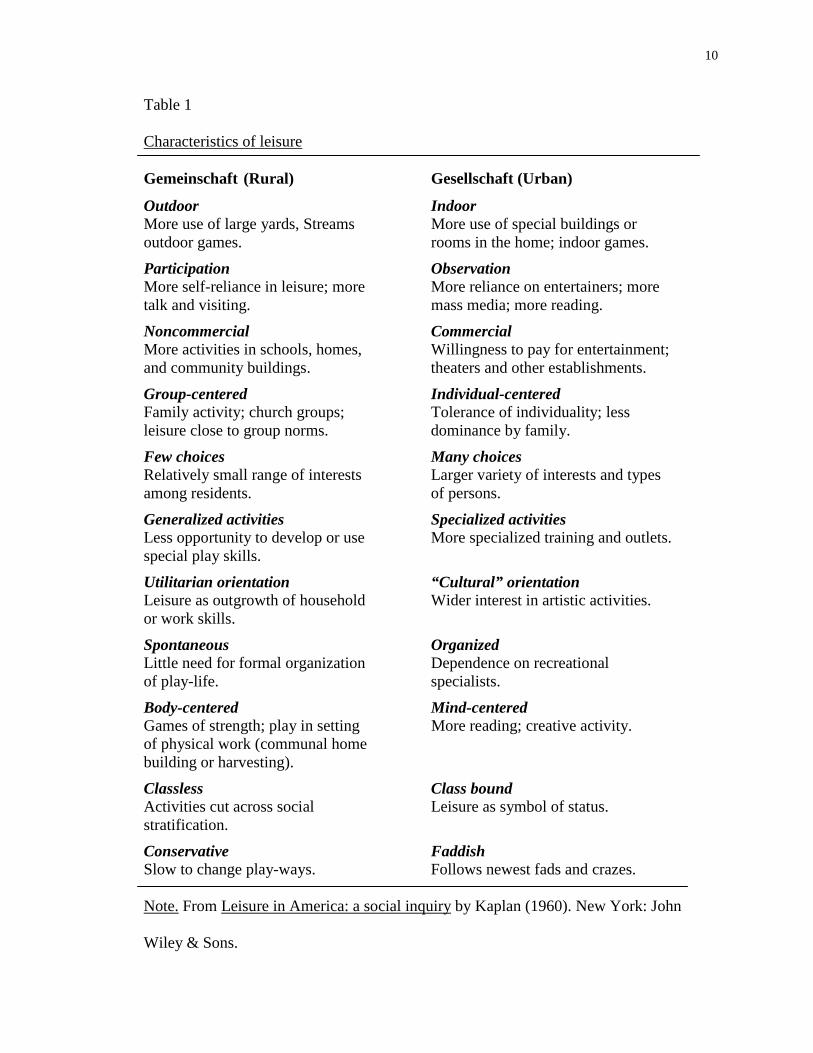
Godbey (1999) indicated that the characteristics of leisure have changed
systematically during the transition from pre-industrial to industrial society. Kaplan
(1960) identified these changes by using the ideal type Gemeinschaft-Gesellschaft
devised by the German sociologist Tonnies in 1940 (Table 1).
10
Table 1
Characteristics of leisure
Gemeinschaft (Rural) Gesellschaft (Urban)
Outdoor Indoor More use of large yards, Streams More use of special buildings or outdoor games. rooms in the home; indoor games.
Participation Observation More self-reliance in leisure; more More reliance on entertainers; more talk and visiting. mass media; more reading.
Noncommercial Commercial More activities in schools, homes, Willingness to pay for entertainment; and community buildings. theaters and other establishments.
Group-centered Individual-centered Family activity; church groups; Tolerance of individuality; less leisure close to group norms. dominance by family.
Few choices Many choices Relatively small range of interests Larger variety of interests and types among residents. of persons.
Generalized activities Specialized activities Less opportunity to develop or use More specialized training and outlets. special play skills.
Utilitarian orientation “Cultural” orientation Leisure as outgrowth of household Wider interest in artistic activities. or work skills.
Spontaneous Organized Little need for formal organization Dependence on recreational of play-life. specialists.
Body-centered Mind-centered Games of strength; play in setting More reading; creative activity. of physical work (communal home building or harvesting).
Classless Class bound Activities cut across social Leisure as symbol of status. stratification.
Conservative Faddish Slow to change play-ways. Follows newest fads and crazes. Note. From Leisure in America: a social inquiry by Kaplan (1960). New York: John
Wiley & Sons.
11
Indeed, Kaplan (1960) showed the division that distinguishes the differences
between rural (simple) societies and urban (complex) societies. The industrial society
tended to produce more material goods for the common people, and the needs for goods
became incorporated into a materialistic style of life (Godbey, 1999). Further, many
people had faith in the idea that more free time was viewed as a social good, a sign of
progress. It was necessary that the worker began to accept and seek the consumption of
material goods.
In the late nineteenth century, some progresses were made in reducing work hours
to ten or eleven hours per day, but most of them were for women and children in factory
work (Godbey, 1999). By the 1890s, some wealthy nations, such as Britain and the
United States, reduced the working time to nine or ten hours per workday. Nevertheless,
the international movement for an eight-hour workday was ignored from its inception
until World War I.
Weekend was one of the specially preferred leisure time slots. In this respect, the
last several decades brought more changes than in other slots. Mieczkowski (1990)
highlighted “the biblical injunction: “Six days shalt thou labor” became obsolete when
the two day weekend has been gradually achieved in most DCs after the Second World
War. The most recent tendencies foreshadow further extension of the weekend even at
the expense of a longer working day” (p. 94).
In the United States, free time not only became more controlled by people, but
also increased due to several reasons including the rise in productivity of the labor force,
the efforts of labor unions, and a policy of support for shorter work hours from the
Federal Government. Weekly work hours in the United States dropped sharply during the
12
first 40 years of the 20th century, with an associated movement away from Sunday, and
Saturday work (Hamermesh, 1998). In 1920, Henry Ford first introduced a five-day
weekly work system into the automobile industry (Huang, 1990). Most people did not
give a positive response to the new system because it altered the traditional working
practice, which had been identified for a long time. In 1929, the U.S. government was
offering moral support to reduce the workweek until the Great Depression. The Fair
Labor Standards Act, which governs the official working hours of many Americans, has
not decreased from 40 hours since 1929 (Godbey, 1999).
In 1970, America and Canada adopted a new working system to condense the
total working hours by decreasing the weekly workday but increasing the daily work
hours (Huang, 1990). In North America, only 2.7 percent of the American full-time
workers worked three or four days a week which was more common in Western Europe
(Lange, 1986). Based on this scheme, the employees worked four days a week at nine or
ten hours per shift or even three days at twelve hours weekly. The total amount of work
time remained basically the same or was only slightly decreased. According to a research
conducted by the University of Michigan in 1990, the workers in America set the weekly
work hours to 32 hours. Also, some labor unions in Sweden and Ireland targeted 30 work
hours per week as their long-term goals (Huang, 1990).
Lately, the Industrial Revolution began an extensive process of transformation.
Through unionization, workers would be able to lessen work hours due to the increase in
production and the improvement in work environment (Cheng, 1997). Kando (1975)
stated “the length of the average workweek seems to have declined from 69.7 hours in
1850 to 37.6 hours in 1972 – a gain of 32.1 hours of free time per week” (p. 79). Around
13
World War II, many European and American countries, Thailand and the Philippines
implemented the two-day weekend policy (Committee of Economic Research and
Development, Ministry of Economic Affairs, R.O.C, 1991). Some countries established
new labor laws, and some countries set up agreements to accomplish the goal of a two-
day weekend. In 1983, the American government stipulated 40 hours as the official
workweek in the Fair Labor Standards Act. France and New Zealand also set 40 hours as
the standard workweek by law (Cheng, 1997).
Accordingly, each government establishes its regulations on work time based on
its geographical environment, economic development, traditional custom, and people’s
feelings. Also, the weekly and daily work hours vary among countries based on the
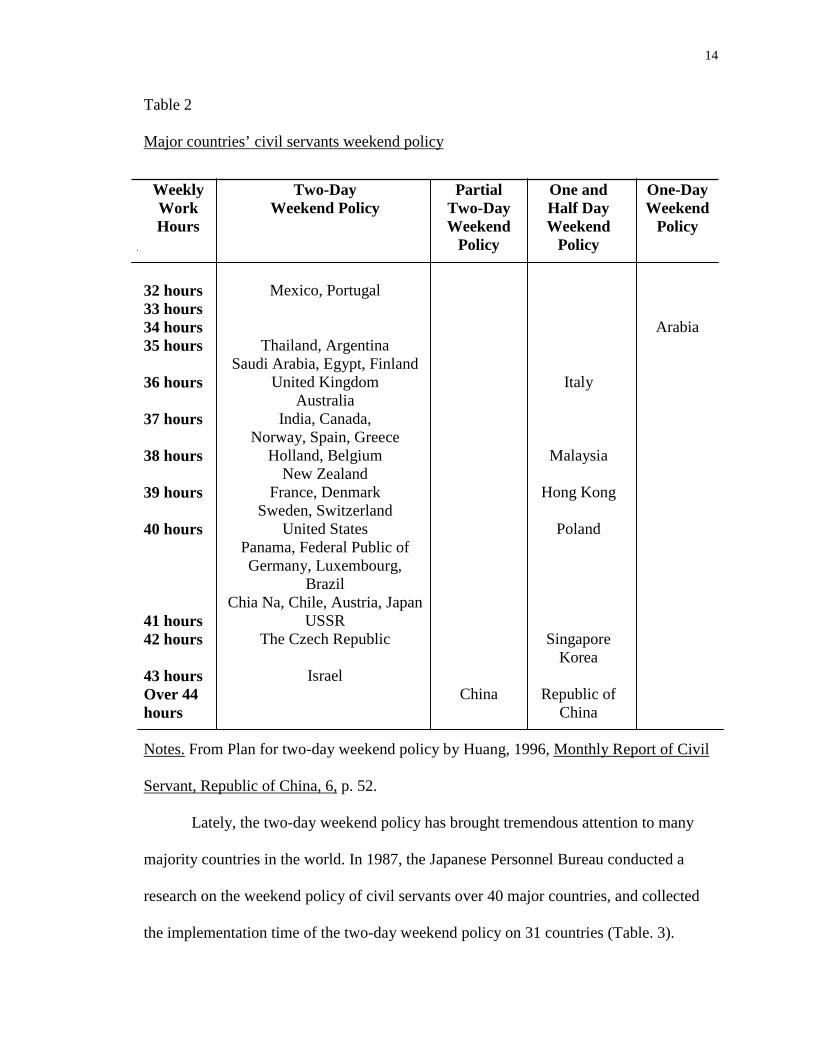
regulations, government institutions, and collective bargaining. The Examination Yuan,
Republic of China (1997) reviewed the average work hours per week and the weekend
policy of civil servants for over 40 major countries (Table 2). Among the world, the
longest workweek is six workdays while the shortest workweek is only five workdays. In
Mexico and Portugal, they only have 32 weekly working hours. Differently, the official
weekly work hour is 48 hours in Taiwan recently (Huang, 1996).
14
Table 2
Major countries’ civil servants weekend policy
Weekly Work Hours
Two-Day Weekend Policy
Partial Two-Day Weekend
Policy
One and Half Day Weekend
Policy
One-Day Weekend
Policy
32 hours
Mexico, Portugal
33 hours 34 hours Arabia 35 hours Thailand, Argentina
Saudi Arabia, Egypt, Finland
36 hours United Kingdom Australia
Italy
37 hours India, Canada, Norway, Spain, Greece
38 hours Holland, Belgium New Zealand
Malaysia
39 hours France, Denmark Sweden, Switzerland
Hong Kong
40 hours United States Panama, Federal Public of Germany, Luxembourg,
Brazil Chia Na, Chile, Austria, Japan
Poland
41 hours USSR 42 hours The Czech Republic Singapore
Korea
43 hours Israel Over 44 hours
China Republic of China
Notes. From Plan for two-day weekend policy by Huang, 1996, Monthly Report of Civil
Servant, Republic of China, 6, p. 52.
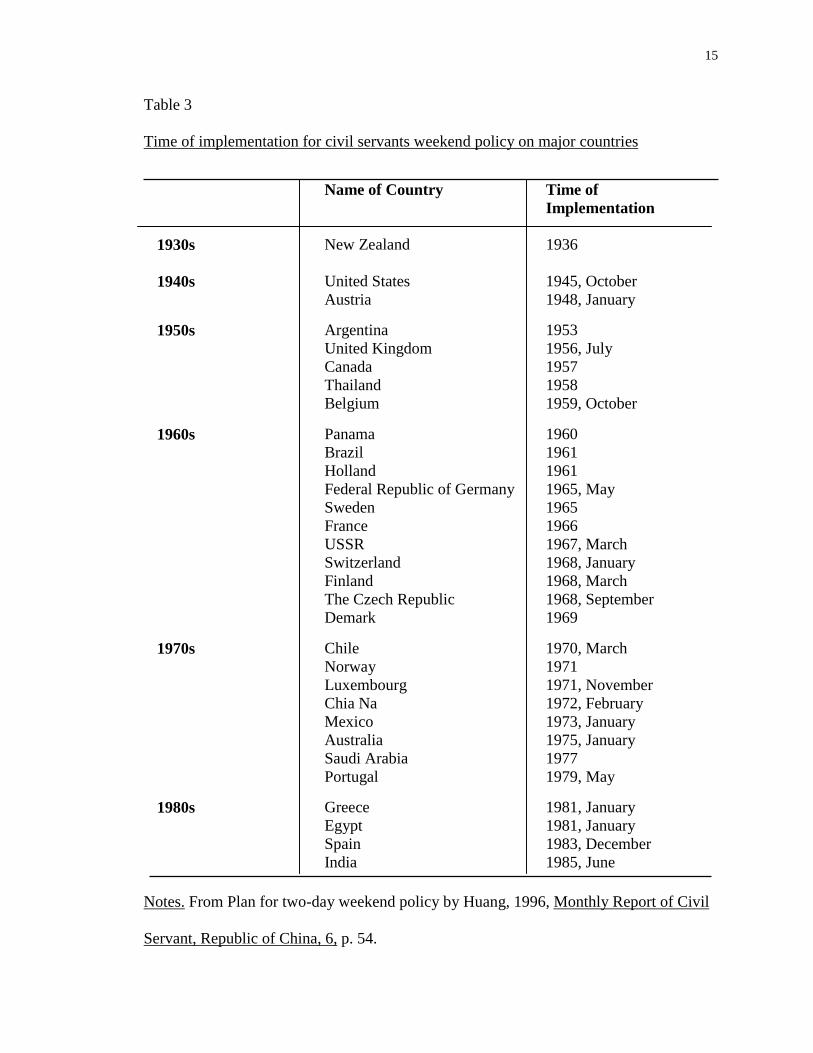
Lately, the two-day weekend policy has brought tremendous attention to many
majority countries in the world. In 1987, the Japanese Personnel Bureau conducted a
research on the weekend policy of civil servants over 40 major countries, and collected
the implementation time of the two-day weekend policy on 31 countries (Table. 3).
15
Table 3
Time of implementation for civil servants weekend policy on major countries
Name of Country Time of Implementation
1930s New Zealand 1936
1940s United States Austria
1945, October 1948, January
1950s Argentina United Kingdom Canada Thailand Belgium
1953 1956, July 1957 1958 1959, October
1960s Panama Brazil Holland Federal Republic of Germany Sweden France USSR Switzerland Finland The Czech Republic Demark
1960 1961 1961 1965, May 1965 1966 1967, March 1968, January 1968, March 1968, September 1969
1970s Chile Norway Luxembourg Chia Na Mexico Australia Saudi Arabia Portugal
1970, March 1971 1971, November 1972, February 1973, January 1975, January 1977 1979, May
1980s Greece Egypt Spain India
1981, January 1981, January 1983, December 1985, June
Notes. From Plan for two-day weekend policy by Huang, 1996, Monthly Report of Civil
Servant, Republic of China, 6, p. 54.
16
According to the advanced western country’s experience, the more automations
are used in the industrial society, the less labor will be needed. Furthermore, more free
time can be managed by humans. Consequently, leisure demands are certainly taken as a
primary consideration of quality living for human beings worldwide.
Nevertheless, it would not be appropriate to discuss Taiwanese leisure behaviors
by comparing them to a completely different culture because of the variances between
western and eastern cultures. Thus, the researcher chose Japan, has a comparable
historical background and culture with Taiwan, as the point of convergence in the next
section. In fact, Japan is the most tourism-generated country in Asia. Japan is also one of
the minority advanced countries that has implemented the two-day weekend policy
progressively within the last ten years among eastern countries. Thus, the Japanese
experience in the two-day weekend policy implementation should be considered while
studying the two-day weekend policy in Taiwan.
Historical Development Stages of the Two-Day Weekend Policy in Japan
After World War II, Japan recovered rapidly from postwar ruins. Japanese
economic power stayed in third place behind the U.S. and Germany before the petroleum
crisis in 1980. Japanese merchandises and its funds were all over the world. Yet, Western
countries started to criticize Japan due to trade friction. In particular, over-time working
was one of the major criticisms for the unequal competition on the economy. In 1986, the
average work hours per year in Japan were 2,150 hours while the American only worked
1,924 hours per year. Meanwhile, Germany only worked 1,655 hours per year (Wang,
1990).
17
By reason of the forceful pressure from many western countries, the Japanese
government started a new policy on decreasing working time progressively in 1981. In
January of 1981, Japan implemented a new weekend policy which meant only one two-
day weekend per month, and the rest of weekends stayed the same as one and half day
weekend for the central government institutions. The result was not very efficient with
only 36.7 percent of the private businesses in Japan following the new weekend policy.
In 1986, the central government tested another new weekend policy, which made
every other Saturdays off per month. The implementation rate for private companies,
which had over 100 employees, was raised to 51 percent. Meanwhile, the Japanese labor
and economic environment changed due to factory automation, office automation, and
the generalization of informational machines. Likewise, many Japanese enterprises
started to move their manufacturing strongpoint overseas in order to release the pressure
from the domestic labor market (Wang, 1990).
The Japanese government reduced its official work hours from 48 to 40 per week
in September 1986. After changing the labor law and establishing the implementation
schedules for the two-day weekend policy, the Japanese government officially
inaugurated the two-day weekend policy in the central government offices in January
1989. Yet, a six-year long transition policy was made to conquer the difficulties
encountered by some private businesses. The official work hours were 46 hours per week
before 1990. In 1991 and 1992, the official work hours were 44 hours per week. Since
1994, the two-day weekend policy was implemented entirely for both governmental
institutions and private enterprises in Japan (Pan, 1997).
18
The implementation of the two-day weekend policy brought dramatic impacts to
the Japanese society. The changes in leisure patterns and the increasing of leisure
expenses affected the travel and tourism markets. Generally, there is a significant
difference between a one-day weekend and a two-day weekend. People view the one-day
off as the working annex or prolongation. The primary purpose of leisure activities during
the one-day weekend is for resting or relieving boredom from the daily schedule.
Conversely, with a two-day weekend, leisure becomes more meaningful and active as a
result of the changing patterns between work and leisure. Thereupon, the primary
intention of weekend leisure activities transfers from resting and entertainment to healthy,
knowledgeable, and pleasurable leisure activities to benefit oneself (Pan, 1997).
Due to the changes in leisure awareness, the total revenue generated from the
leisure market was raised from $5.4 billion to $5.9 billion Japanese yen in 1990. The total
number of people relieved from work on Saturdays, which included civil servants,
financiers, people in private enterprise, was 2.5 million per week in 1990. Consequently,
travel and tourism industries achieved the biggest benefit out of the two-day weekend
policy. The two-day weekend promoted both short-term international travel and domestic
travel. In addition, gyms and sports facilities became more popular than before.
According to the research in consumer behavior conducted by a famous Japanese
department store in 1990, 51 percent of consumers started their weekend plans on Friday
nights while 21 percent of consumers even started on Thursday nights. In addition, there
was an approximate $172,200 Japanese yen extra spending on leisure per household a
year due to the two-day weekend policy. The Japanese Labor Department expected that
19
the two-day weekend policy would reduce the average work time to 1,800 hours per year
(Wang, 1990).
Altogether, Japan spent over 10 years in planning the two-day weekend policy to
avoid many problems during the development stages. The Japanese government began
with reducing the official work hours in order to encourage private businesses to
participate in the new holiday policy. In particular, the six-year long transition period not
only assisted many businesses to overcome difficulties but also indoctrinated Japanese
apropos leisure perspectives. Accordingly, the Japanese experience on developing the
two-day weekend policy would be a good learning model for Taiwan to emulate due to
the similar culture backgrounds.
After looking at other countries’ development of the two-day weekend policy, the
next section provide a brief introduction to Taiwan and its’ biggest city Taipei, where this
study was conducted.
A Profile of Taiwan
For centuries, Taiwan has been familiar to the West as Formosa, a name derived
from the 16th century. Portuguese mariners sighted the island from a galleon, and named
it "Ilha Formosa" (Beautiful Island). Taiwan is situated in the Western Pacific about 160
kilometers (100 miles) off the southeastern coast of the Asiatic Continent. Taiwan is
lying midway between Korea and Japan to the north and Hong Kong and the Philippines
to the south. Taiwan and the adjacent islands have an area of approximate 36,000 square
kilometers (14,000 square miles). The main island of Taiwan is about 394 kilometers
(245 miles) long and 144 kilometers (89 miles) wide at its broadest point (Government
Information Office, 2000).
20
Owing to the scarce natural resources and high population density of the island,
agriculture is the main industry in the early years of Taiwan’s economic development.
However, with the stable and rapid growth of the economy initiated in 1950, the focus of
Taiwan's industry was shifted to the manufacturing and financial sectors. Presently,
Taiwan's Gross Domestic Product (GDP) stand at US $261,400 million. The annual
average per capita income is US $12,040 (Government Information Office, 2000).
The population of Taiwan is more than 22 million in June 2000. The island's
population density is the second highest in the world after Bangladesh, estimated at 609
per square kilometer. Highly populated urban areas have grown around the official limits
of major cities, forming large metropolitan areas, defined as urban centers with
populations of over 1 million people. In 1998, the urban population continued to grow,
and it was 68.09 percent of Taiwan's total population. The metropolitan area with the
highest population remains the Taipei-Keelung Greater Metropolitan Area, with 6.4
million residents and almost 42.86 percent of Taiwan's urban population. Taipei is
Taiwan's most populous city (2.64 million) (Government Information Office, 2000).
Taipei at A Glance
Taipei City is located in Taipei Basin in the northern part of Taiwan Island,
stretches 18 kilometers (11.18 miles) from east to west and 27 kilometers (16.78 miles)
from south to north. Taipei City covers 271.80 square kilometers (104. 92 square miles)
accounting for 0.76 percent of the entire Taiwan area, and it is the political, economic,
financial, and cultural center of the Republic of China. It has a thriving arts and academic
scene and countless modern commercial buildings. With its vibrant cultural and
economic growth, it has become a modern international metropolis. Since Taipei City is
21
upgraded to a municipality, its economy has seen quick development, with industrial and
commercial business getting more and more prosperous. Income and living standards in
Taipei have been steadily rising (Taipei City Government, 2000).
At the end of May 1999, the demographic statistics showed that the City has 2.64
million residents, with an average of 3.04 persons per household. The population density
of the Taipei City is 9,173 persons per square kilometer. The monthly regular income of
an average family in 1999 amount to New Taiwanese dollar (NT) $107,266 compared to
NT $6,159 in 1971 (Taipei City Government, 2000).
The urban development plans in Taipei cover the entire city that has an area of
271.80 square kilometers (104. 92 square miles). Urban development land can be
classified into various zones based on location, mode of use, socioeconomic structure,
and future trend of development. The largest portion of the urban development in Taipei
is the land used for public facilities occupying 24.6 percent of the city. The residential
zone occupies 14.3 percent of the city. Agricultural and scenic zones account for 2.5
percent of the city while water covering zone occupies six percent of the city. (Taipei
City Government, 2000).
Trends in Leisure, Recreation, and Travel in Taiwan
This section describes the trends in leisure, recreation, and travel patterns in
Taiwan before the implementation of the alternating two-day weekend policy. In order to
identify the changes in leisure and travel patterns in Taiwan, an understanding of
previous research on domestic tourism before the implementation of the alternating two-
day weekend policy is necessary. Furthermore, the important factors impacting leisure
and travel patterns will also be covered.
22
The Tourism Bureau in Taiwan conducts the domestic tourism survey on a two-
year basis. The report on the 1997 R.O.C domestic tourism survey showed the leisure and
travel patterns before the implementation of the alternating two-day weekend policy. The
main objectives of the survey were to provide policy makers accurate and comprehensive
information about the characteristics of travel and travelers, to assist in improving the
traveling environment, to develop new tourist attractions, and to improve the quality of
tourism. The survey period was from January 1, 1997 to December 31, 1997. The survey
was conducted via telephone by using a computer-assisted telephone interviewing system
(CATI), and 3,448 persons responded.
According to the survey on domestic tourism in 1997, 89.3 percent of people
traveled, and 11 percent of people did not do. The majority of people (64%) did not make
any domestic travel because they did not have time for traveling. Almost 42 percent of
people would prefer to travel during weekends while only 30.3 percent of people traveled
during the week, and 27.8 percent of people traveled during official holidays. Most trips
(53%) were planned to take place in one day. The primary purposes for domestic travel
were sightseeing and pleasure (72.5%), and visiting friends/relatives (20.8%). The top
three leisure activities were: (1) enjoying sights of nature (65.5%), (2) field walking,
mountain climbing (17%), and (3) theme park activities (12.4%) (Tourism Bureau,
Ministry of Transportation and Communications, R.O.C, 1997).
In addition, nearly half of people (47%) preferred immediate family travel while
34.2 percent of people chose to travel with friends or relatives. By looking at the
considerations for domestic travel, type of leisure activities was the most important factor
affecting traveler decisions. Travel distance was the second important factor affecting the
23
traveler decisions on traveling (Tourism Bureau, Ministry of Transportation and
Communications, R.O.C, 1997).
Leisure, Recreation, and Travel Patterns
According to the research report on the citizens’ domestic travel patterns
conducted by the Taiwan Tourism Bureau in 1986, a definition of travel was developed
based on Taiwanese culture. The primary purpose of travel is “free from worry” and
enhancing information and knowledge by visiting scenic spots, historical sites or
manmade areas. Consequently, jogging or walking in nearby parks does not belong to
travel but leisure and sports activities. Conversely, visiting tourist destinations should be
viewed as travel activities. Comparably, if people choose to do certain leisure or sports
activities away from their regular living environment, those activities will automatically
become one type of travel activity (Tourism Bureau, Ministry of Transportation and
Communications, R.O.C, 1997). Murphy (1985) indicated that leisure activities would
leap over the level of travel due to the increased number of leisure areas and free time.
Any type of travel activity is usually undertaken during leisure time.
Consequently, the amount of leisure time affects travel demands but it is not necessary to
be accompanied by travel activities. According to the report prepared by the Statistic
Office of the Executive Yuan over the years (1987, 1990, 1994), the average leisure time
for Taiwanese was 43 hours per week. Typically, urban people are interested in specific
types of leisure activities, such as shopping, social events, participating in shows or
exhibits, indoor recreation, sports, and outdoor recreation. In particular, there is only two
hours time per week for outdoor recreation, and only one hour is used for travel activities.
24
In general, Taiwanese leisure mostly focuses on physical inactive pursuit or
motionless activities. Certain types of indoor recreation involved with electronic
equipment and facilities seem to be more attractive. However, outdoor leisure and travel
has grown rapidly following the escalating number of tourism facilities and destinations
in Taiwan during the last few years. Based on the report on the 1997 R.O.C Domestic
Tourism Survey, the number of domestic travelers grew from 39 million in 1991 to 71
million in 1997 (Tourism Bureau, Ministry of Transportation and Communications,
R.O.C, 1997). The vigorous growth of domestic tourism is detected not only from the
increasing number of tourists in the tourist destinations but also from the flourishing of
outdoor leisure magazines and various travel information collections going on the market.
“Holiday Page”, “Leisure Page”, “Outdoor Travel Page”, and “Leisure Travel Page” are
published on a regular basis in almost every newspaper. However, while the multiplying
publications on travel or leisure information might not be able to sufficiently represent
the shift of tourism or outdoor leisure, it could be perceived as the indication of
expanding demand for leisure and tourism (Hsiao, 1991).
Barriers to Leisure, Recreation, and Travel
Crawford and Godbey (1987) elaborated on three primary barriers for leisure
activities: (1) intrapersonal constraint, (2) interpersonal constraint, and (3) structural
constraint. First of all, intrapersonal constraint is related to personal mind and
characteristics, such as pressure, anxiety, and attitude. Secondly, interpersonal constraint
is interpersonal relationships, such as appropriate travel companions. Finally, structural
constraints mostly an external factor, such as weather, transportation, financial condition,
and time. If a person can conquer his intrapersonal constraint, leisure appreciation will be
25
formed. Also, people need to overcome their interpersonal constraint by looking for
someone compatible either to travel with or to participate in leisure activities with.
Besides, structural constraints will need to be overcome (Crawford & Godbey, 1987).
Kay and Jackson (1991) discovered that time and costs are the primary constraints
for leisure and travel. Most people would choose to reduce their leisure activities if they
have conflicts on time arrangements. Yet, some people are willing to give up time for
work and shopping in exchange for more leisure activities. Thereby, the barrier
preventing people from leisure and travel can be possibly overcome. However, time is the
primary barrier for people to participate in leisure activities detected by the domestic
tourism surveys in 1993, 1995, and 1997 (Department of Statistics, Ministry of
Transportation and Communications, R.O.C, 1999). The report showed that lack of is the
main reason blocking people from travel, and the percentage is 40.7 percent, 55.6 percent
and 64.1 percent in 1993, 1995, and 1997 respectively, which was growing year after
year.
Furthermore, the timing of travel, type of travel as well as the travel resources are
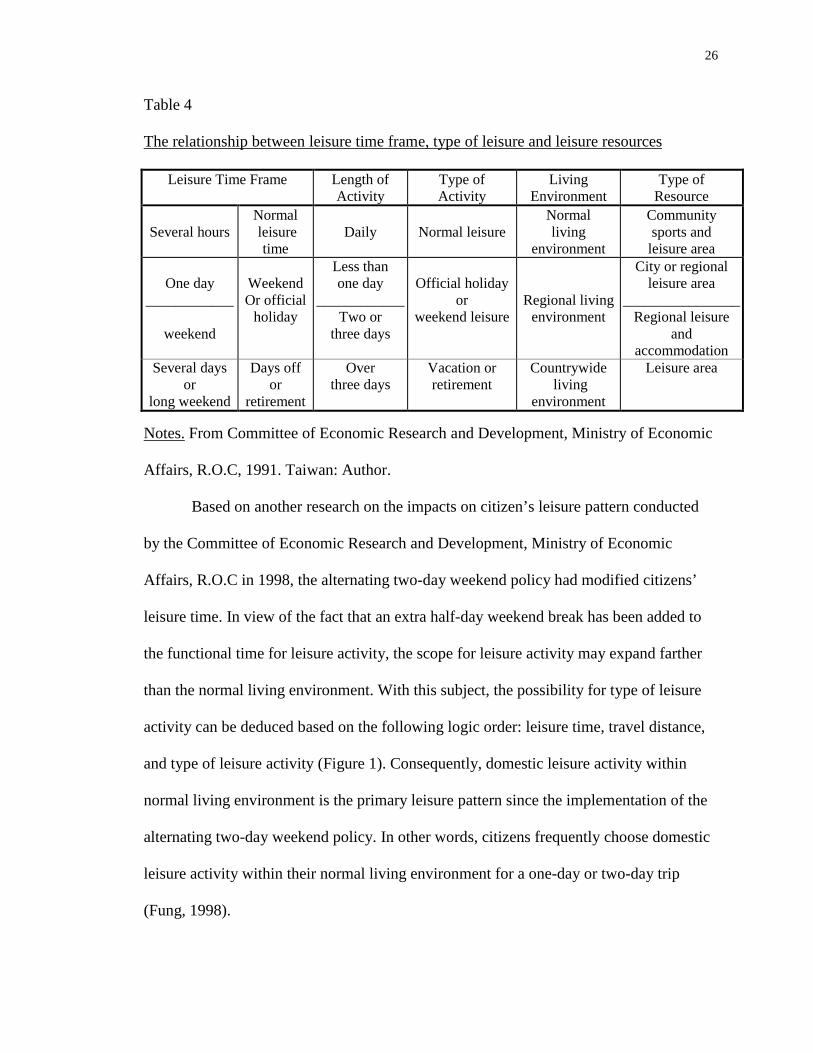
varied based on the different time frames for leisure (Committee of Economic Research
and Development, Ministry of Economic Affairs, 1991). Table 4 shows the relationship
between leisure time frame, type of leisure activities, and the type of leisure resources.
Due to the variance in the length of free time or vacations, people will have different
demands on leisure resources and their leisure patterns.
26
Table 4
The relationship between leisure time frame, type of leisure and leisure resources
Leisure Time Frame Length of Activity
Type of Activity
Living Environment
Type of Resource
Several hours
Normal leisure
time
Daily
Normal leisure
Normal living
environment
Community sports and leisure area
One day
____________
weekend
Weekend Or official
holiday
Less than one day
____________Two or
three days
Official holiday
or weekend leisure
Regional living environment
City or regional leisure area
________________Regional leisure
and accommodation
Several days or
long weekend
Days off or
retirement
Over three days
Vacation or retirement
Countrywide living
environment
Leisure area
Notes. From Committee of Economic Research and Development, Ministry of Economic
Affairs, R.O.C, 1991. Taiwan: Author.
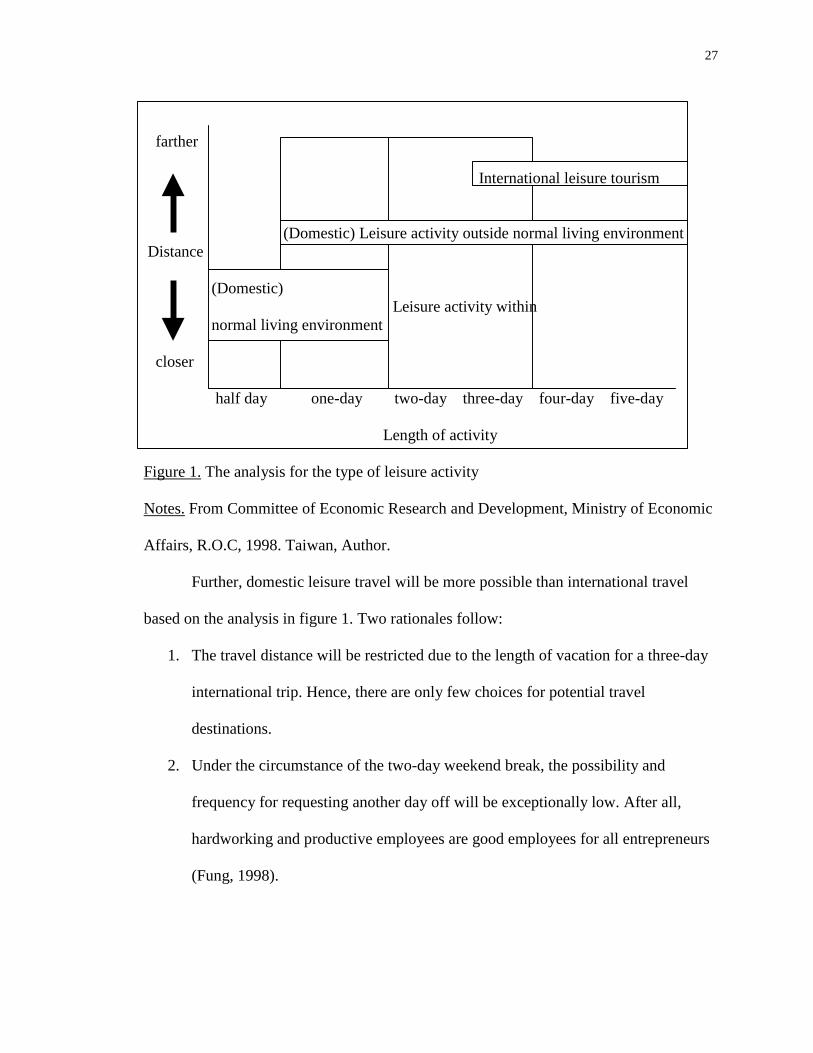
Based on another research on the impacts on citizen’s leisure pattern conducted
by the Committee of Economic Research and Development, Ministry of Economic
Affairs, R.O.C in 1998, the alternating two-day weekend policy had modified citizens’
leisure time. In view of the fact that an extra half-day weekend break has been added to
the functional time for leisure activity, the scope for leisure activity may expand farther
than the normal living environment. With this subject, the possibility for type of leisure
activity can be deduced based on the following logic order: leisure time, travel distance,
and type of leisure activity (Figure 1). Consequently, domestic leisure activity within
normal living environment is the primary leisure pattern since the implementation of the
alternating two-day weekend policy. In other words, citizens frequently choose domestic
leisure activity within their normal living environment for a one-day or two-day trip
(Fung, 1998).
27
farther International leisure tourism (Domestic) Leisure activity outside normal living environment Distance (Domestic)
Leisure activity within normal living environment closer half day one-day two-day three-day four-day five-day Length of activity
Figure 1. The analysis for the type of leisure activity
Notes. From Committee of Economic Research and Development, Ministry of Economic
Affairs, R.O.C, 1998. Taiwan, Author.
Further, domestic leisure travel will be more possible than international travel
based on the analysis in figure 1. Two rationales follow:
1. The travel distance will be restricted due to the length of vacation for a three-day
international trip. Hence, there are only few choices for potential travel
destinations.
2. Under the circumstance of the two-day weekend break, the possibility and
frequency for requesting another day off will be exceptionally low. After all,
hardworking and productive employees are good employees for all entrepreneurs
(Fung, 1998).
28
In summary, time is the significant consideration when people make travel
decisions. The time constraint has been reduced since more leisure time was obtainable
after the implementation of the alternating two-day weekend. Whether the alternating
two-day weekend policy modify people’s travel interest or not, it should be considered
while discussing the change in leisure behavior in Taiwan. This section focuses on the
trends in leisure, recreation, and travel in Taiwan. The next section of this literature
review concentrates on the development of the alternating two-day weekend policy in
Taiwan and how it affects people’s leisure behavior.
The Alternating Two-Day Weekend Policy
As the standard of living in Taiwan is continuously to rise, citizens are seeking for
a more balanced lifestyle on sports and recreational activities to provide a suitable
physical and spiritual counterpoise to the frenetic pace of national development. The
growing value in leisure is also apparent at the individual consumer level. According to
the Directorate-General of Budget, Accounting and Statistics (DGBAS), spending on
sports and recreation by the Taiwan’s citizens have increased around an average of 10
percent each year over the last decade (Cheng, 1997).
Based on the Labor Law, civil servants have been required to work 44 hours per
week since 1966. Most private enterprises followed the governmental institutes’ working
policy to implement the one and a half day weekend. However, the value system of the
younger generation has been changed in the employment market. Workers think highly of
the quality of life and leisure by reducing the total work hours.
Therefore, the Taiwanese government implemented a new weekend policy that
gives its employees every other Saturdays off in January 1998. This has provided
29
everyone with more quality time to spend with their family or to pursue hobbies and
recreational activities. The purpose of the two-day weekend policy is to improve labor
quality by decreasing the working day and increasing leisure time so that the quality of
life will be enhanced (Cheng, 1997).
The Personnel Bureau started the first meetings for the two-day weekend policy in
May 1995, and completed the research on governmental office hours by the following
year. The Executive Yuan was requested by Taiwan’s central government to examine the
laws related to civil servants in 1996 and 1997. On April 18, 1997, the Legislature passed
the decree for the implementation of the alternating two-day weekend policy without
changing the basic working hours requirements. Both the Executive Yuan and the
Examination Yuan released “The implementation plan of two times two-day weekend per
month for civil servants” on October 18, 1997. In January 1998, the Taiwan Government
started a new weekend policy, which gave civil servants every other Saturday off by
trimming down the number of existing official holidays, such as Retrocession Day and
Constitution Day (Hsien, 1998). The government’s hope was that this move would lead
private enterprises to do the same. Under the old workweek policy, civil servants worked
half a day every Saturday.
The impacts of the alternating two-day weekend policy resulted in the changes of
leisure habits of Taiwanese people. In July 1999, the Department of Statistics, Ministry of
Transportation and Communications, published the research on how the alternating two-
day weekend policy impacted citizens’ domestic travel activities. A survey was
conducted with 2,142 tourists in tourist destinations from December of 1998 to January
of 1999. The questionnaire was also mailed to the tourism and hospitality industries,
30
which numbered 263 travel agencies, 394 hotels, and 262 tourist destinations and private
recreation areas (Department of Statistics, Ministry of Transportation and
Communications, R.O.C, 1999). The results of the research followed:
! The alternating two-day weekend policy assists the improvement of the
domestic travel market because almost all people are willing to increase the
frequency of domestic travel.
! The scope of leisure activities expands from people’s living circle to regional
leisure areas due to the increasing needs for overnight accommodation.
Further, the alternating two-day weekend policy improves local community
development.
! The increasing frequency of group travel with families and friends helps
enhance interpersonal relationships.
! Many people think that the transportation and accommodation problems
resulting from the alternating two-day weekend policy should be ameliorated.
! Travel and tourism industries believe that the alternating two-day weekend
policy brings positive effect to business performance. Travel agencies should
follow marketing trends to please consumers with quality domestic tour
products.
! Travel agencies expect that the alternating two-day weekend policy will spur
the domestic travel market. Hence, many cooperative marketing strategies
have been implemented to strive for consumers.
31
! Over 50 percent of domestic recreation areas and tourist destinations have
increased their revenue since consumers are more willing to engage in
domestic travel.
! Due to the implementation of the alternating two-day weekend, the frequency
of traffic overload is increased as well as the lack of quality accommodations.
! Most of the tourist destination managers view the new holiday policy
positively and were willing to cooperate on both short-term and long-term
marketing strategies.
! Hotel managers are not optimistic with their short-term marketing prospects.
They believe that only full implementation of the two-day weekend will
improve the long-term development for the tourism and hospitality industries.
! A need as has been shown to promote both weekend and non-weekend travel
and leisure activities to exploit tourism resources properly.
Based on the research, people’s leisure patterns have been changed since the
implementation of the alternating two-day weekend policy. Seventy-eight percent have
increased their frequency of domestic travel, 35.6 percent have increased audio-visual
leisure activities, 33.3 percent have increased outdoor leisure activities, and 65 percent
have raised their personal leisure expenditures since the holiday pattern change. Also,
people’s leisure patterns extend from day-to-day living environment to the regional
leisure areas. Forty percent of people have more short-term domestic travel (includes
one-day and two-day trips) because of decreasing of the official holidays (usually more
than two days). In addition, 60 percent prefer to be accompanied by friends or families
for domestic travel. The relationship and interaction between friends and families is
32
stronger than before (Department of Statistics, Ministry of Transportation and
Communication, R.O.C, 1999).
Five-day Workweek in 2001
In the last lawmaking session before the summer break in 2000, the Legislature
passed amendments granting all public servants a five-day workweek starting January 1,
2001. The Public Service law amendments stated that the public servants would get two
days off every week starting from the calendar year of 2001. In other words, the two-day
workweek policy will replace the current alternating two-day weekend policy in Taiwan.
In addition, the Legislature attached a resolution asking the Cabinet to trim the total
number of the official holidays to partially compensate for the extra weekends. For
instance, Commemorative Holiday and Constitution Day are likely to be axed while the
traditional festivals are still kept to maintain the total number of holiday at 115 to 116
days per year. According to the legislation, government agencies with “special duties” are
required to have some staffs to work on weekends as a flextime system to cope with the
five-day week. In the meantime, the Legislature revised the Labor law by reducing
official work hours from 48 hours to 42 hours per week. As a result, people will have a
total number of holidays as 110 days per year including two-day weekends (The China
Post, 2000).
In summary, the alternating two-day weekend policy has made a tremendous
impact in leisure and travel patterns in Taiwan. Since the government put the alternating
two-day weekend policy into effect on January 10th 1998, leisure time has increased
compared to the past. The expectation of the alternating two-day weekend policy is to
33
stimulate domestic tourism as well as the expansion of leisure. The next section reviews
the effects of the earthquake.
Earthquake Hurts the Tourism Industry in Taiwan
Taiwan is in one of the six most earthquake-prone areas in the world. The quake
of September 21, 1999 occurred just one kilometer from the earth’s surface. The
geologists categorized the quake as a “shallow earthquake.” Indeed, shallow earthquakes
have a greater impact near the epicenter than deeper ones do. This earthquake occurred
near the center of Taiwan, about 160 kilometers (100 miles) SSW of the capital city of
Taipei at 01:47 AM local time on September 21, 1999. It was a shallow thrust
earthquake, caused by the collision between the Philippine Sea and Eurasian plates. In
fact, most of Taiwan's earthquakes have occurred at this island's eastern side. Thus, the
inland location of the earthquake was unusual. Because of this earthquake's location,
there was minimal tsunami risk, but high risk to regional population centers (Chen,
1999).
Safety Issues
World Tourism Organization (WTO) and World Meteorological Organization
(1998) informed that natural disasters killed more than one million people and left
thousands homeless. Also, the global economic losses from the natural disasters were
innumerable. The tourism industry is an important global phenomenon involving the
movement of millions of people to all countries on the surface of the globe. Thus, the
threats of natural disasters should not be ignored by the tourism industry.
Nevertheless, the natural environment is crucial for the attractiveness of almost all
travel destinations. Travelers are always attracted to natural resources either actually or
34
vicariously (Gartner, 1996). Therefore, tourism managers promote the natural features as
attractions to the tourists. Yet, tourism can either destroy or protect natural environments
depending on how much the tourism industry cared about the natural resources.
Conversely, the environmental impacts will also influence the development of tourist
destinations.
The Environmental Impact on Tourist Destinations
The level, extent, and concentration of recreational activities are the primary
factors influencing the natural environment (Farrell & Runyan, 1991). The concept of
carrying capacity is used to identify the relationship between intensity of use and the
management objectives for a nature resource area. Often, environmental damage will
affect the consumers’ decisions on their travel destinations. If the environmental carrying
capacity is exceeded, the image of tourist destinations is usually devastated. As a result,
tourists will no longer be attracted to the tourist destination. Further, ecotourism is a
relatively new study that focuses on the environment in a special manner to preserve
environmental quality while at the same time protecting tourism. Tourist destination
development is definitely affected by the host environment. Laws (1995) illustrated that
the phases of destination development created a destination development cycle. In
addition, the purpose of destination development is to minimize harmful effects on the
natural environment (Howell, 1992). Natural disaster is also included in the destination
development cycle as a cause of interruptions in the tourism industry. Thus, a tourist
destination that experienced a natural catastrophe will definitely scare away incoming
tourists before its full recovery.
35
To conclude, natural environments are the primary resources for the tourism
industry. Once the tourist destinations are damaged by a natural disaster, not only the
tourist destination’s image but also the area’s economics will be influenced. The Chi Chi
earthquake destroyed the most famous tourist destination in central Taiwan on September
21, 1999. Many domestic travels were canceled due to safety and economic concerns. In
addition, governmental support was required for the tourism industry to reassure visitors
and rebuild the island’s tourism infrastructure. The first five sections of the review of
literature provided the bulk of knowledge on the study area. The following section will
contribute an overview on the general concepts of leisure, recreation, its related study
areas, and its impacts on human life.
Leisure and Recreation
Leisure and recreation are not synonymous but they are closely related (Clawson,
1960). Indeed, leisure is the free time available for an individual when the disciplines of
work, sleep and other basic needs have been met. Recreation includes, broadly, any
pursuit taken up during leisure time. In fact, the distinctions between leisure, recreation,
and many tourist activities are increasingly blurred by changing lifestyles and terms are
often interchangeable (Band-Bovy & Lawson, 1998).
Leisure
Kelly and Godbey (1992) indicated that leisure is not what we do when every
important thing is achieved. Also, leisure can not be a separate area cut off from the
central elements of work, family, community, and religion in human life. Three elements
are involved in the study of leisure: (1) individual life, (2) social system, and (3) culture.
Many early leisure studies sought to identify the extent of leisure in a group, its uses and
36
meanings, the relationship between work and leisure, the philosophical foundation of
leisure, its historical development in different societies, and the role of various
“possessive variables” on the structure of leisure (Kelly & Godbey, 1992). For instance,
Robinson (1977) studied time usage to understand the sequences of work and leisure in
everyday life, allocation of time to specific the forms of leisure activities, and the
relationship between time spending and satisfaction levels.
Previously, people used to define leisure as leftover time. The Dictionary of
Sociology defined leisure as the free time after the practical necessities of life have been
attended to. Yang (1998) believed that the word “Leisure” in English is from “Licere” in
Latin meaning license and liberty time. Also, the time must be allowed by the society,
and was fully controlled by the individual. Brightbill (1963) insisted that leisure is time
beyond what is required for existence, things people must do to stay alive. Leisure is a
time that people’s feelings of compulsion should be minimal. In particular, leisure is
discretionary time used according to one’s own judgment or choice. Nevertheless, many
humanists profess leisure is part of being human, not leftover time or a reward for doing
something else.
As a modern concept, leisure is conceptualized as free time. Neulinger (1974)
suggested that leisure is the perception of freedom, the orientation of intrinsic motivation,
and the meaning of final rather than instrumental goals. Indeed, leisure is defined in terms
of what is perceived in the experience itself. Many sociologists defined leisure as an
important sector of the economy, a significant dimension of the culture, and a major
element of the social institutions of the society. Differently, many social psychologists
preferred to characterize leisure as a state of mind. They emphasized leisure as perceived
37
freedom, internal locus of control, optimal arousal, and intrinsic motivations in their
researches (Smith & Godbey, 1991). In this study, leisure is defined as the free time
beyond what was required for existence, time for individuals to spend as they please
(Boniface & Cooper, 1994).
Leisure and Time
In modern society, leisure does not mean leftover time only. To most people,
leisure means the time during which they feel free to do whatever they want to do
(Parker, 1971). The estimates of leisure time are influenced by how people feel about
their time. Some activities may make people feel less open and free, less leisurely. If
people believe that they are under time pressure, they may underrate the amount of time
they really have available. Accordingly, the lack of highlights of involvement and
intensity in leisure time could be estimated on its quantity as well as quality (Kelly &
Godbey, 1992).
Nevertheless, modern life makes humans slaves to a busy schedule. According to
a Gallup poll conducted in 1996, people were working an average of four weeks more per
year than they were in 1970 (Rinzler & Arena, 1996). People are working longer and
harder. Yet, many people are trying to take back times. From the result of interviews and
focus groups across the country, Rinzler and Arena (1996) found that all generations feel
the urge for more time, Generation Xers have the most opportunity to effect change. In
particular, many people would rather choose low paying, low time-commitment jobs. A
research conducted by Marquette University indicated that 80 percent of Americans who
are trying to start a new business are between the ages of 18 and 34. Indeed, people want
to balance their needs of career, friends and family. Also, they do not seek just more time,
38
but better time for their own lives. In short, people like to find balance in their lives and
feel more in control of themselves (Rinzler & Arena, 1996).
Leisure and Work
Parker (1971) stated that the quantity of leisure time is increasing for many people
because working time is getting less. In the sociology field, leisure and work are
concerned in two types of relationships to be studied: (1) the relationship between
society’s needs for work to be done, and for the benefits that its members may
collectively derive from leisure; and (2) the relationship between the functions of work
and leisure to individuals themselves. The relationship between work and leisure also
raises a serious question about what leisure is for unemployed people based on an
implicit assumption that unemployed people have nothing other than leisure (Cassidy,
1996).
Leisure may be significant but not required in human life. Theoretically, people
work because they want to be productive, useful, and socially engaged. Realistically,
many people are employed because of the paycheck. In short, many people “work to live”
rather than “live to work.” Parker (1971) provided a time scheme for the analysis of life
space (Figure 2). Work may be explained as the activities involved in earning a living,
and necessary subsidiary activities such as traveling to work. Work obligations include
voluntary overtime and doing things beyond normal working hours associated with the
job or work. It is not necessary to have a second job. Non-work obligations are roughly
called semi-leisure (Parker, 1971).
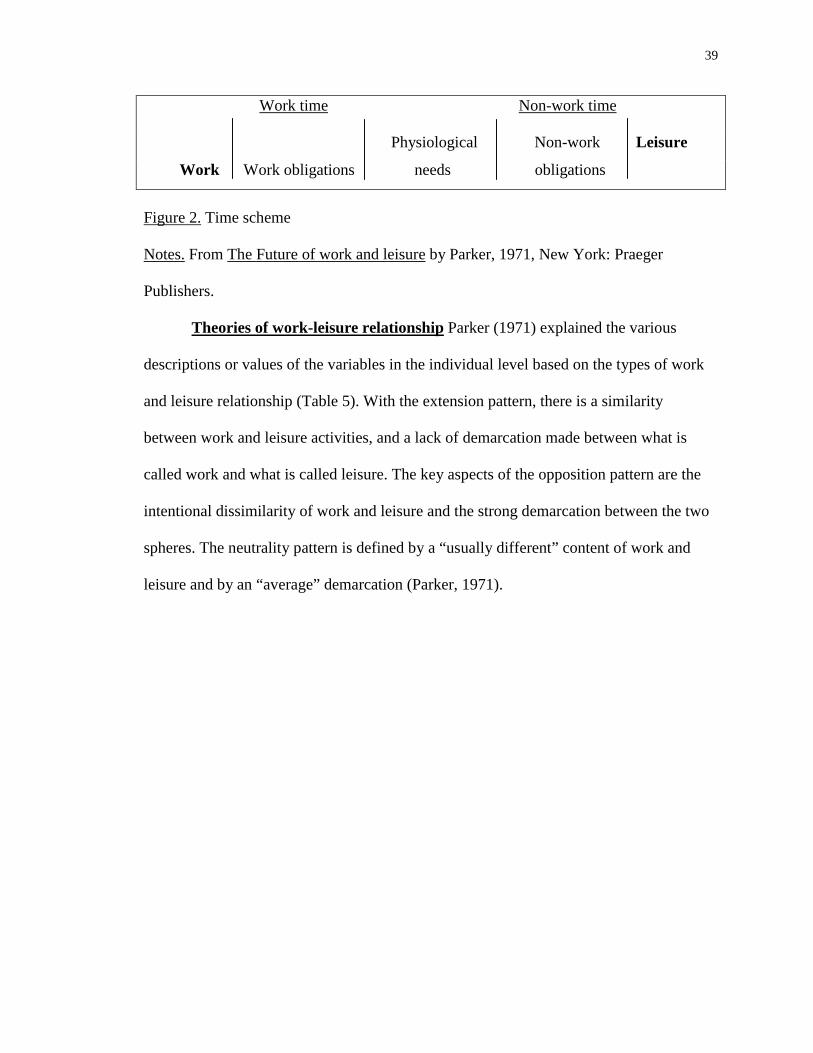
39
Work time Non-work time
Physiological Non-work Leisure
Work Work obligations needs obligations
Figure 2. Time scheme
Notes. From The Future of work and leisure by Parker, 1971, New York: Praeger
Publishers.
Theories of work-leisure relationship Parker (1971) explained the various
descriptions or values of the variables in the individual level based on the types of work
and leisure relationship (Table 5). With the extension pattern, there is a similarity
between work and leisure activities, and a lack of demarcation made between what is
called work and what is called leisure. The key aspects of the opposition pattern are the
intentional dissimilarity of work and leisure and the strong demarcation between the two
spheres. The neutrality pattern is defined by a “usually different” content of work and
leisure and by an “average” demarcation (Parker, 1971).
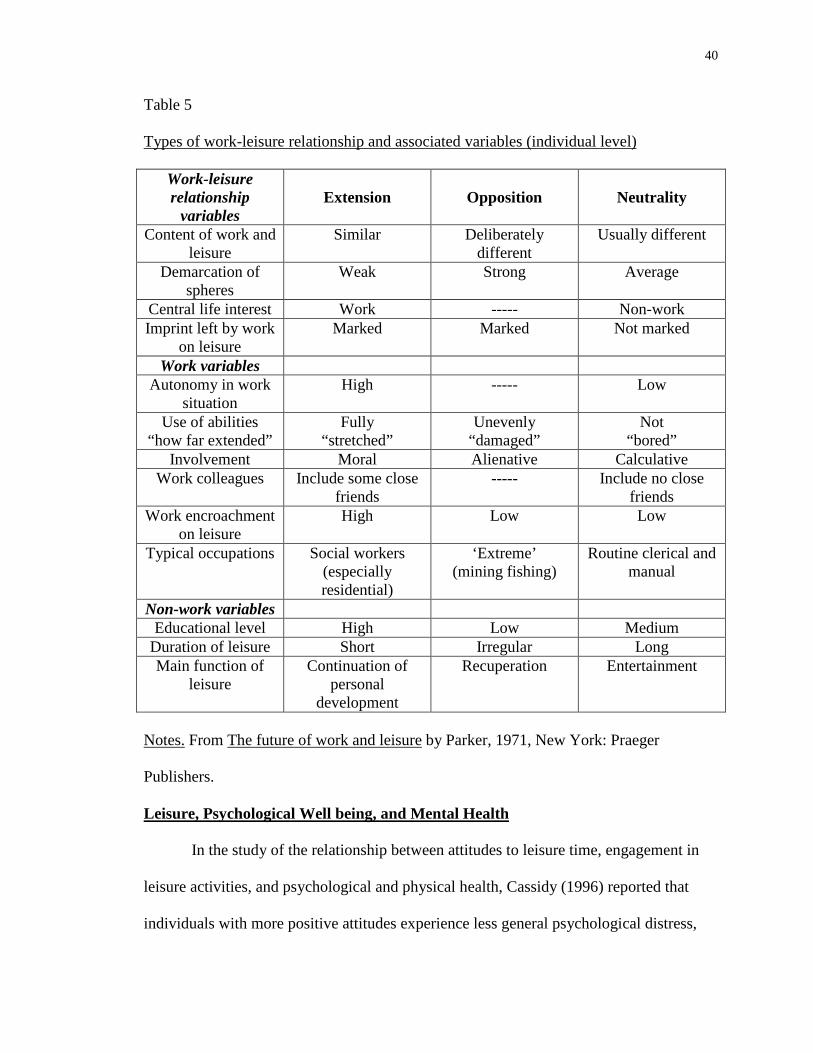
40
Table 5
Types of work-leisure relationship and associated variables (individual level)
Work-leisure relationship
variables
Extension
Opposition
Neutrality
Content of work and leisure
Similar Deliberately different
Usually different
Demarcation of spheres
Weak Strong Average
Central life interest Work ----- Non-work Imprint left by work
on leisure Marked Marked Not marked
Work variables Autonomy in work
situation High ----- Low
Use of abilities “how far extended”
Fully “stretched”
Unevenly “damaged”
Not “bored”
Involvement Moral Alienative Calculative Work colleagues Include some close
friends ----- Include no close
friends Work encroachment
on leisure High Low Low
Typical occupations Social workers (especially residential)
‘Extreme’ (mining fishing)
Routine clerical and manual
Non-work variables Educational level High Low Medium
Duration of leisure Short Irregular Long Main function of
leisure Continuation of
personal development
Recuperation Entertainment
Notes. From The future of work and leisure by Parker, 1971, New York: Praeger
Publishers.
Leisure, Psychological Well being, and Mental Health
In the study of the relationship between attitudes to leisure time, engagement in
leisure activities, and psychological and physical health, Cassidy (1996) reported that
individuals with more positive attitudes experience less general psychological distress,
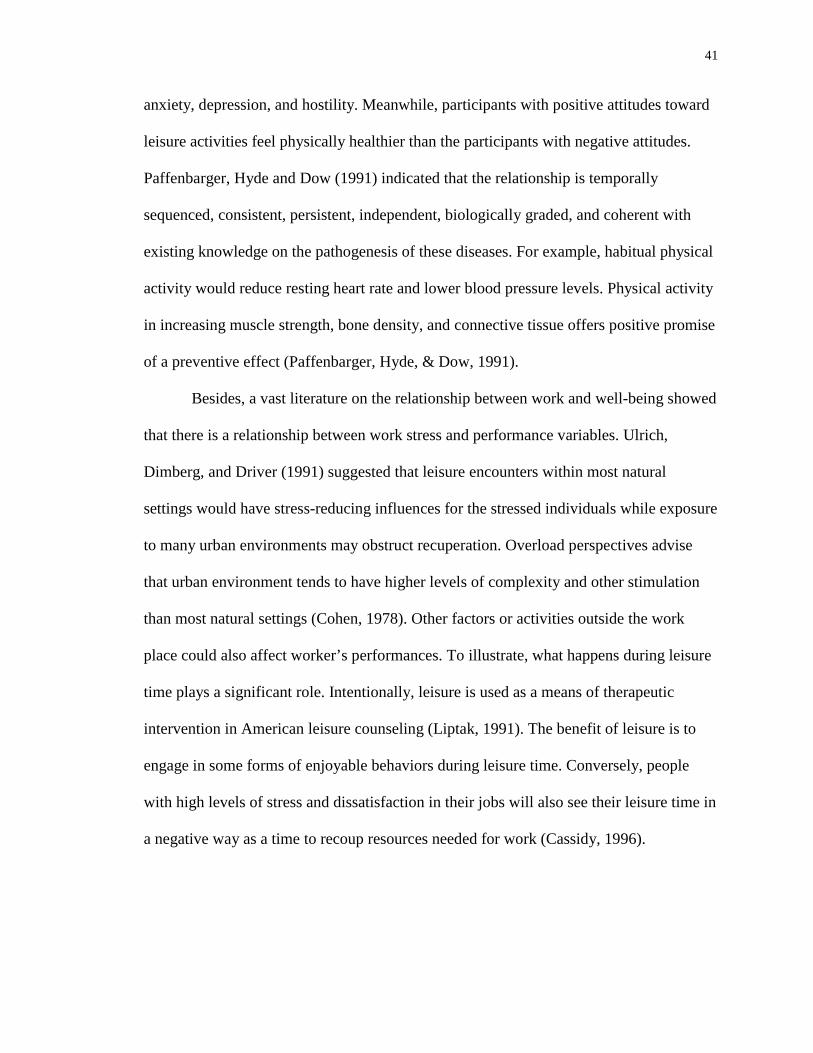
41
anxiety, depression, and hostility. Meanwhile, participants with positive attitudes toward
leisure activities feel physically healthier than the participants with negative attitudes.
Paffenbarger, Hyde and Dow (1991) indicated that the relationship is temporally
sequenced, consistent, persistent, independent, biologically graded, and coherent with
existing knowledge on the pathogenesis of these diseases. For example, habitual physical
activity would reduce resting heart rate and lower blood pressure levels. Physical activity
in increasing muscle strength, bone density, and connective tissue offers positive promise
of a preventive effect (Paffenbarger, Hyde, & Dow, 1991).
Besides, a vast literature on the relationship between work and well-being showed
that there is a relationship between work stress and performance variables. Ulrich,
Dimberg, and Driver (1991) suggested that leisure encounters within most natural
settings would have stress-reducing influences for the stressed individuals while exposure
to many urban environments may obstruct recuperation. Overload perspectives advise
that urban environment tends to have higher levels of complexity and other stimulation
than most natural settings (Cohen, 1978). Other factors or activities outside the work
place could also affect worker’s performances. To illustrate, what happens during leisure
time plays a significant role. Intentionally, leisure is used as a means of therapeutic
intervention in American leisure counseling (Liptak, 1991). The benefit of leisure is to
engage in some forms of enjoyable behaviors during leisure time. Conversely, people
with high levels of stress and dissatisfaction in their jobs will also see their leisure time in
a negative way as a time to recoup resources needed for work (Cassidy, 1996).
42
Leisure and Tourism
Frequently, many tourism literatures concentrate more on the determinants of
tourism choice and holiday behavior. The overlap between leisure and tourism is when
the phenomenon of visiting friends and relatives (VFR) tourism is considered (Smith &
Godbey, 1991). Indeed, leisure travel is more than a summer vacation trip. Outdoor
recreation opportunities usually require access to a car for even the simplest planned
family picnic. Travel to leisure sites is a daily and weekly activity and not reserved for
the long trip. The nature of leisure motivation related to tourism is due to the concepts of
boredom and frustration. One emerging leisure travel market is the shorter vacation
market referred to as the “getaway” vacation. Generally, a getaway vacation is weekend
oriented and approximately 200-300 miles driving distance from home (MacKay &
Fesenmaier, 1998). Davis (1990) indicated that getaway vacations often include hotel
accommodations at a cost saving and participation in activities, such as shopping and
sightseeing. The main purpose of a getaway trip is rest and relaxation, and escape from
routine.
Recreation
In the Dictionary of Sociology (1994), recreation is defined as “any activity
pursued during leisure…” (p. 251). The term of recreation comes from the Latin
“recreare”, to restore or refresh which means “refreshment of the strength and spirits after
work” (Webster, 1976). In other words, recreation has the purpose of re-creating human
physical and mental resources depleted by work, literally the recreation of energy.
Mieczkowski (1990) referred recreation as an experience (an activity or an inactivity) for
renewal of body, mind, and spirit in order to prepare the individual for better performance
43
of work. The terms “recreation” and “leisure” are used synonymously and are almost
interchangeable. Braden (1988) explained recreation as a subcategory of leisure since
recreation is normally an organized and goal-oriented activity that people pursue during
their leisure time for pleasure and satisfaction. Clawson (1964) stated “If leisure is time
available for choosing, recreation is one major activity chosen for such available time”
(p. 3). In short, leisure emphasizes the time element while recreation refers to the content,
and to the way the leisure time is spent.
Clawson also (1960) pointed out "The recreational activities may range from the
most active to the most passive and may take varied forms. The essential element is not
what the person does but the spirit in which he does it and the satisfactions he gets from
it” (p. 7). Recreation may mean creative activity or passivity based on the nature of the
activity that varies from person to person.
Classification of Recreational Activities
Recreational activities may be classified in many ways. They are normally
grouped depending on the types, the age or sex of the person participating, space
requirements, skills, costs, seasons, numbers taking part, or forms of organization. In
North America, a division of indoor and outdoor recreation has been established
(Mieczkowski,1990). Indoor recreation is under a building (mainly home-based) or a
kind of roof cover, and outdoor recreation is under a free sky. The Outdoor Recreation
Resources Review Commission (1962) defined outdoor recreation as “leisure time
activity undertaken in a relatively non-urban environment characterized by a natural
setting” (p. 1). Baud-Bovy and Lawson (1998) grouped recreational activities into six
categories based on their nature and the types of facilities used in Table 6.
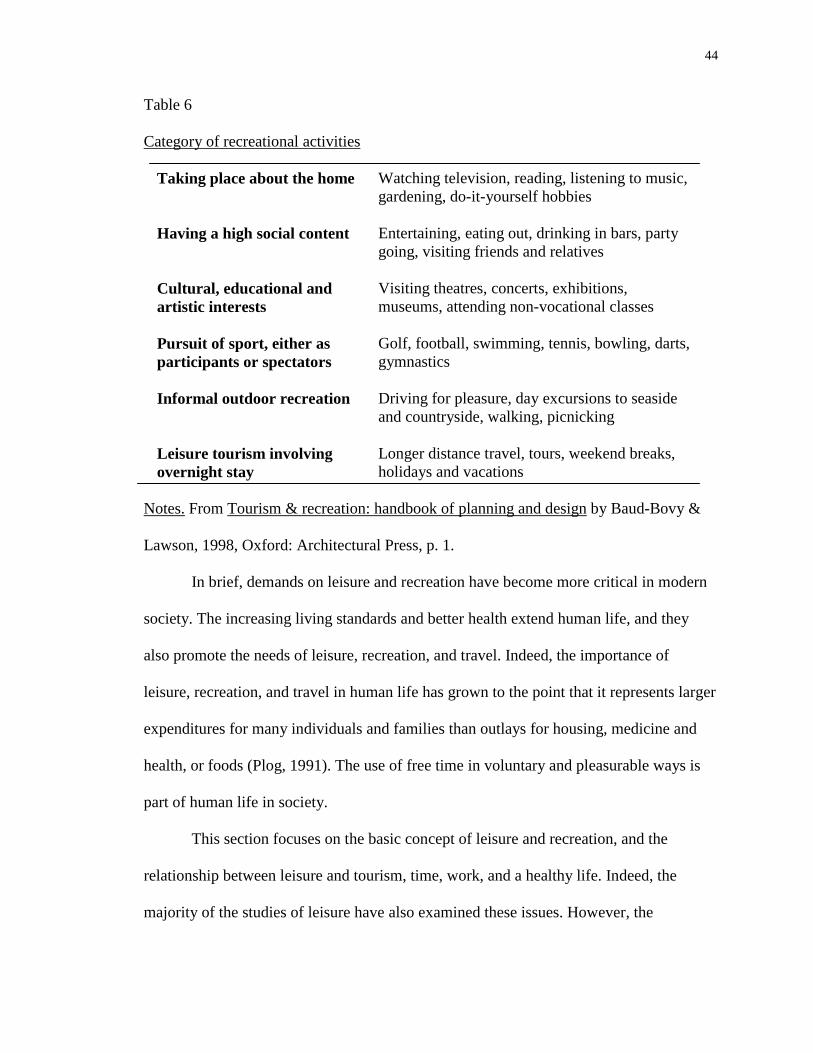
44
Table 6
Category of recreational activities
Taking place about the home
Watching television, reading, listening to music, gardening, do-it-yourself hobbies
Having a high social content Entertaining, eating out, drinking in bars, party going, visiting friends and relatives
Cultural, educational and artistic interests
Visiting theatres, concerts, exhibitions, museums, attending non-vocational classes
Pursuit of sport, either as participants or spectators
Golf, football, swimming, tennis, bowling, darts, gymnastics
Informal outdoor recreation Driving for pleasure, day excursions to seaside and countryside, walking, picnicking
Leisure tourism involving overnight stay
Longer distance travel, tours, weekend breaks, holidays and vacations
Notes. From Tourism & recreation: handbook of planning and design by Baud-Bovy &
Lawson, 1998, Oxford: Architectural Press, p. 1.
In brief, demands on leisure and recreation have become more critical in modern
society. The increasing living standards and better health extend human life, and they
also promote the needs of leisure, recreation, and travel. Indeed, the importance of
leisure, recreation, and travel in human life has grown to the point that it represents larger
expenditures for many individuals and families than outlays for housing, medicine and
health, or foods (Plog, 1991). The use of free time in voluntary and pleasurable ways is
part of human life in society.
This section focuses on the basic concept of leisure and recreation, and the
relationship between leisure and tourism, time, work, and a healthy life. Indeed, the
majority of the studies of leisure have also examined these issues. However, the
45
perceptions about leisure in western and eastern cultures are varied. Some indication of
the emotions implied by the Chinese for “leisure” can be gained from the construction of
its ideogram, which consists of a moon inside a window. What are the ideas behind the
Chinese concept of leisure? What role does leisure play in Chinese life? The purpose of
this study is to identify the consumer leisure behavior in Taiwan. Based on the culture
diversity, a brief overview on Chinese leisure perceptions is necessary. Thus, the next
section of this review of literature will present the leisure perceptions in Chinese culture.
Chinese Leisure Perceptions
The classical idea of leisure in Chinese is to cultivate the individual’s soul, spirit,
and personality (Yang, 1998). The basic concept of leisure for Chinese is the thing
remaining after anything else. As a result, people will not concern themselves about
leisure unless all requirements for living are met.
Realms of the Self
Compared to the Western philosophy, leisure is more an indicative of the
emotions implied for Chinese. The cultural background and the tradition of thought are
the most representative of its ethos for Chinese leisure. And, ethos starts out from the
realms of the self.
The fundamental realm of self can be specified as the “constructive
consciousness,” which involves laying down rules and standards and establishing social
order (Lao, 1998). In this realm, the individual is required to perform the constructive
functions of transforming nature and ordering human affairs. This can also be called the
“moral self.” Besides, it is not concerned with establishing order but with wanting to
grasp certain knowledge and understand the principles that govern things.
46
Representative of this tradition is the thinking of Socrates and Plato, which has
been central to the European tradition right up to the appearance of modern philosophy.
This is what we call the “cognitive self.” These two realms of the self are in the
mainstream from an historical perspective. Both of them rise from the most important
affairs of human life, and they illustrate how people understand the exterior world and
how people establish order. The moral self gave birth to a system of rules, and the
cognitive self gave birth to scientific consciousness (Lao, 1998).
The Aesthetic Self and Confucian Responsibility
Lao (1998) also indicated that leisure constitutes another realm of the self, and
this was something expressed in Zhuangzi’s section on “unburdened roaming.” It is an
artistic and emotional realm, and philosophical Daoism gives it a theoretical foundation.
When the Chinese converse about emotional issues, moral or objective knowledge is not
involved but aesthetic is. Indeed, the aesthetic self is not concerned with the realization of
responsibilities or values. People are not only seeking knowledge and goods, but also
beauty. How the enjoyment of leisure is related to the other parts of life is one of the
questions needing to be answered while people treat sentiments of leisure as part of
Chinese tradition. How could people find a life of leisure without interrupting certain
responsibilities and obligations in real life?
Yu-tang, Lin, the great essayist, indicated that machine culture eventually lead to
an age of leisure (Lao, 1998). Human will finally tire of uninterrupted progress on their
work, and material conditions will be improved. And sickness will be eradicated, and
poverty will be reduced. Consequently, there will be more food, and people will live
47
longer. By that time, people will not be as busy as they used to be. Yet, the most
contagious disease of the late twentieth century has become “hard work.”
Leisure Environment and Leisure Behavior
The demand for leisure facilities increases dramatically because of the alternating
two- day weekend policy. Long limited by problems of insufficient land, facilities, and
restrictive regulations, development of recreational facilities is eagerly awaited by the
Taiwanese. In the past, the government’s tourism planning often focused on long trips
that brought people from outside the community (Hsieh, 1998). In fact, people need more
local facilities such as parks, green spaces and athletic facilities for leisure rather than the
facilities they need for long trips.
Naturally, there are high expectations that people will embrace the extra time off.
Sociologists suggested that leisure should include three parts: (1) relaxation, (2)
entertainment, and (3) individual development. Yang (1998) claimed that high quality of
leisure activities must consist of six necessary conditions based on the English spelling of
leisure.
! L (Legal): The foundation of high quality leisure activities must be legal.
! E (Education): The classical concept of leisure is seeking true knowledge,
enlightening of wisdom, and increasing of virtues. Also, learning and
observing are the true meanings of leisure.
! I (Information): Leisure activities are based on sufficient travel information.
! S (Safety): Safety is the only way back home.
! U (Useful): Leisure activities must have certain functions or benefits
otherwise they are not useful.
48
! RE (Re-creation/Recreational): The purpose of leisure is to recharge batteries
for the individual’s performance improvement at work.
The Leisured Class! The Moneyed Class!
In the past, people believed that the leisured class was equal to the moneyed class.
The epitome of the leisure seeker who has not yet caught the pernicious habit of success,
do not worry about whether it is night or day, or about the efficient use of time. The
pictures of such people are always men with servants in train, and they are able to throw
away money with abandon.
Notwithstanding, leisure does not mean having to spend money. Chao-shu, Tseng,
professor of Chinese at the National Central University, stressed that compared to
ostentatious luxuries, leisure involves the least expenditure and it is not necessarily the
monopoly of males. Wang (1998) highlighted that a break and a chat are really the great
pleasures of life while striving to make a living. People can put aside extravagant ways,
and make a life of leisure cheaper and simpler. The argument is how could people seek
the balance between hard work and leisure.
In a rural society, people followed the rhythm of working when the sun rose and
resting when it set. When the work was finished, the farmers would sit under a big tree to
gossip and play music, relaxing in a natural way. A problem arose when modern
“machine society” became too far removed from the natural rhythm. Modern life is
divided into work and leisure and is looked at as the basis of efficiency. In an urban
environment, finding a true enjoyment of leisure would be a grueling test. When it is time
to finish work or have a day off, tension is relaxed but this is not necessarily leisure.
49
People recover their energy by eating, drinking, and sleeping, and continue to make their
contribution to the economy.
In short, for Chinese, leisure time can be used to restore our shattered selves by
following the rhythm of nature, fixing one’s own timetable, and getting back a feeling of
freedom. Professor Chao-hsu, Tseng observed that leisure is actually a good opportunity
for people to recover themselves from the busy life (Wang, 1998). People can also use
their leisure time to collect together their interests after work. By that time, they will be
able to have and to enjoy leisure.
The last two sections concentrate on the general concepts of leisure and
recreation, and the leisure perceptions of Chinese culture to understand leisure in a cross-
cultural perspective. However, people, consumer, travel, and tourism products have
become more important in tourism research in the past two decades. The next section of
this literature review will discuss consumer behavior in the travel and tourism industry.
Consumer Behavior in Travel and Tourism
The study of consumer behavior is to be able to understand the psychological,
sociological, and economic factors that influence human behavior (Mowen, 1990).
Consumer behavior involves a sequence of decisions and activities, and it is influenced
by many factors both before and after the purchase. Decrop (1999) indicated that
decision-making processes are characterized by logic that encourages thought,
discussion, and personal judgment. Lewis, Chambers, and Chacko (1995) defined
consumer behavior as a process that includes the acquisition phase, moving to
consumption, and ending with the disposition of the product or service (Figure 3).
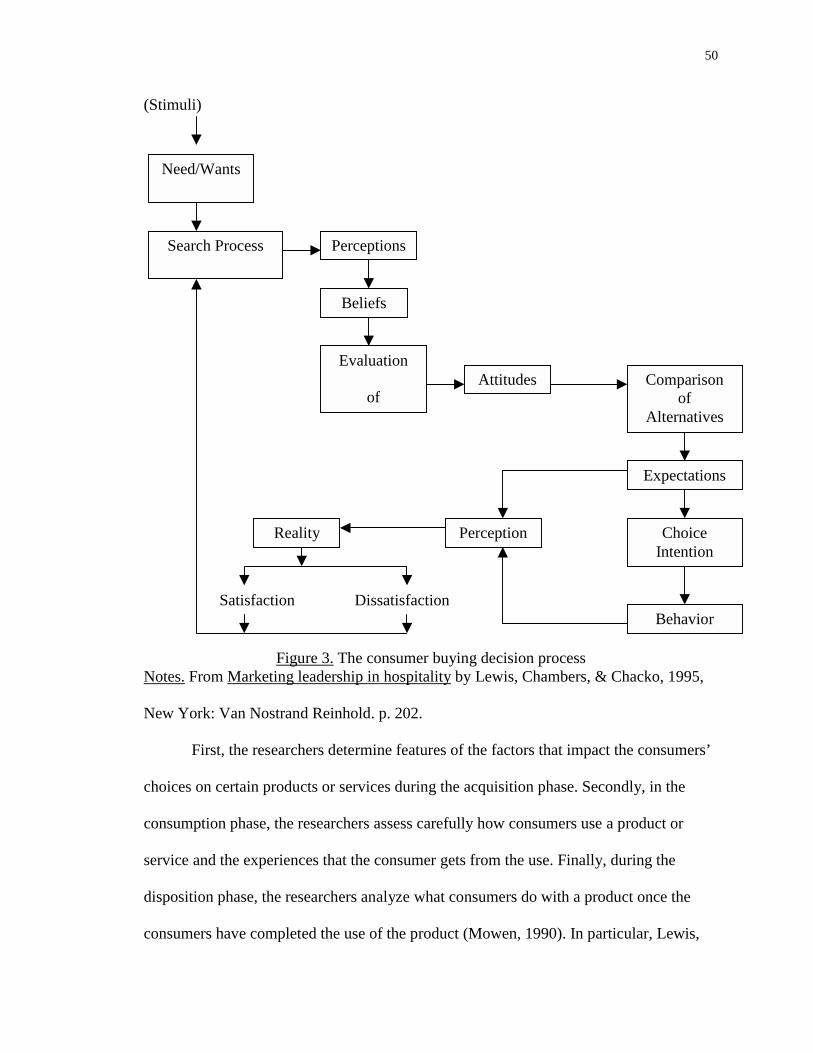
50
(Stimuli) Satisfaction Dissatisfaction
Figure 3. The consumer buying decision process Notes. From Marketing leadership in hospitality by Lewis, Chambers, & Chacko, 1995,
New York: Van Nostrand Reinhold. p. 202.
First, the researchers determine features of the factors that impact the consumers’
choices on certain products or services during the acquisition phase. Secondly, in the
consumption phase, the researchers assess carefully how consumers use a product or
service and the experiences that the consumer gets from the use. Finally, during the
disposition phase, the researchers analyze what consumers do with a product once the
consumers have completed the use of the product (Mowen, 1990). In particular, Lewis,
Need/Wants
Search Process
Evaluation
of
Perceptions
Beliefs
Attitudes Comparison of
Alternatives
Expectations
Reality Perception
Behavior
Choice Intention
51
Chambers, and Chacko (1995) emphasized that creating and keeping consumers is the
primary objective of any marketing.
However, Hudson (1999) stressed that the tourism product is intangible, and there
is usually a time lag between the purchase of the product and its actual consumption.
Consequently, travelers will develop a cognitive image, which is distinguished from
perception and attitude of the tourism product they bought. Mayo and Jarvis (1981)
described perception as “the process by which an individual receives, selects, organizes
and interprets information to create a meaningful picture of the world” (p. 67). Sussmann
and Űnel (1999) highlighted that each individual is unique based on his psychological
makeup. Thus, the same message could be interpreted differently by different audiences,
or even individual members of the same audience.
On the other hand, Allport (1954), the social psychologist, defined attitude as “a
mental or neural state of readiness, organized through experience, exerting a directive or
dynamic influence upon the individual’s response to all objects and situations with which
it is related” (p. 505). Attitudes are often formed selectively by the individual’s needs in
the past and present (Sussmann & Űnel, 1999). Information exposure, group membership,
environment, and satisfaction of needs are the four primary sources for the individual’s
attitudes.
Lumsdon (1997) advised that the tourism marketers must consider three related
aspects of consumer behavior: consumer motivation, consumer typologies, and consumer
purchasing. Several questions are employed by tourism marketers to understand, explain,
and predict consumers’ travel behavior. These are: (1) why people travel, (2) how people
make the travel decision, and (3) how they choose the travel destination.
52
Schmoll (1977) built a model and analyzed that the decision process and its
eventual outcome were influenced by four sets of variables: customer goals, travel
opportunities, communications effort, and intervening or independent variables (Figure
4). The eventual decision has involved several successive stages or phases.
Notwithstanding, Schmoll’s model could not be quantified but only showed the relevant
variables and their interrelationships (Hudson, 1999).
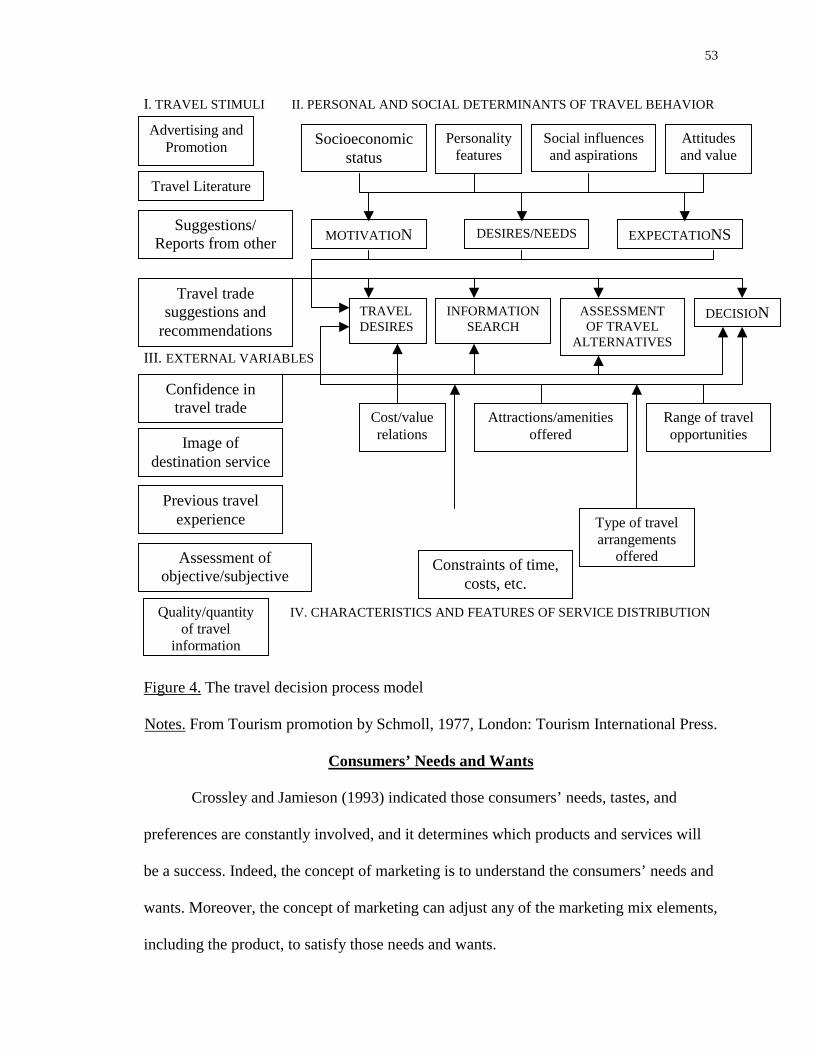
53
I. TRAVEL STIMULI II. PERSONAL AND SOCIAL DETERMINANTS OF TRAVEL BEHAVIOR III. EXTERNAL VARIABLES IV. CHARACTERISTICS AND FEATURES OF SERVICE DISTRIBUTION
Figure 4. The travel decision process model
Notes. From Tourism promotion by Schmoll, 1977, London: Tourism International Press.
Consumers’ Needs and Wants
Crossley and Jamieson (1993) indicated those consumers’ needs, tastes, and
preferences are constantly involved, and it determines which products and services will
be a success. Indeed, the concept of marketing is to understand the consumers’ needs and
wants. Moreover, the concept of marketing can adjust any of the marketing mix elements,
including the product, to satisfy those needs and wants.
Advertising and Promotion
Travel Literature
Suggestions/ Reports from other
Travel trade suggestions and
recommendations
Confidence in travel trade
Image of destination service
Previous travel experience
Assessment of objective/subjective
Constraints of time, costs, etc.
Socioeconomic status
Personality features
Social influences and aspirations
Attitudes and value
MOTIVATION DESIRES/NEEDS EXPECTATIONS
TRAVEL DESIRES
INFORMATION SEARCH
ASSESSMENT OF TRAVEL
ALTERNATIVES
DECISION
Cost/value relations
Attractions/amenities offered
Range of travel opportunities
Quality/quantity of travel
information
Type of travel arrangements
offered
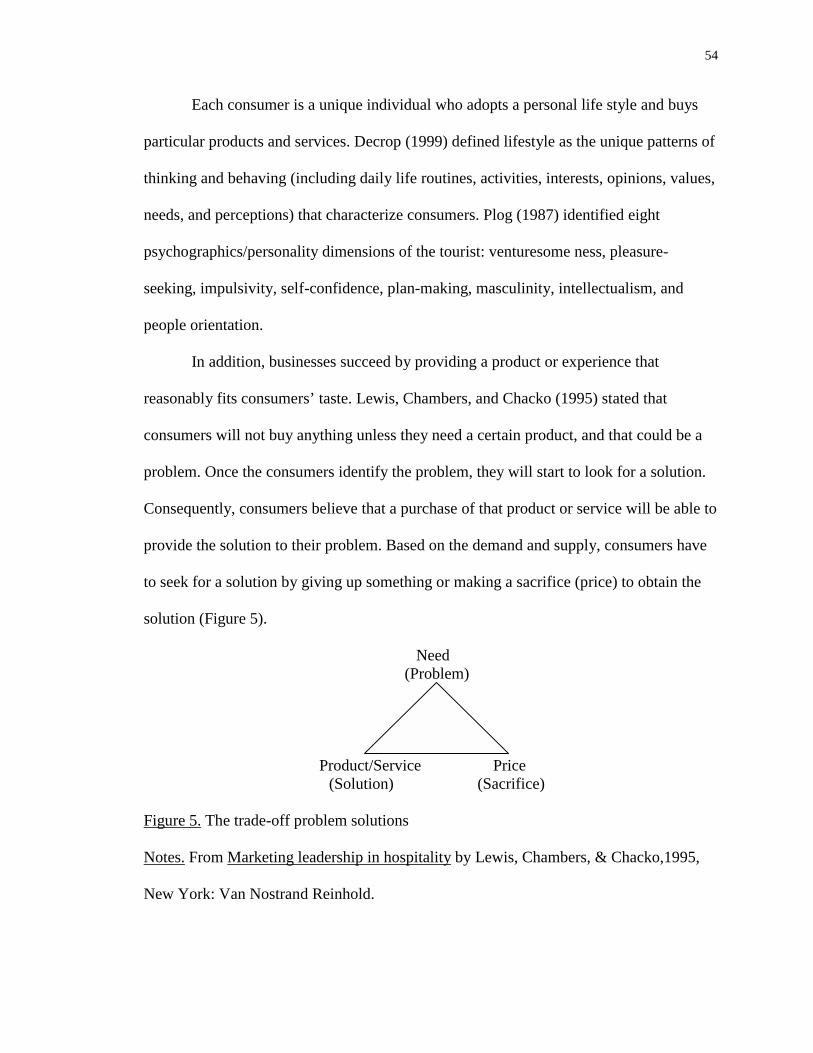
54
Each consumer is a unique individual who adopts a personal life style and buys
particular products and services. Decrop (1999) defined lifestyle as the unique patterns of
thinking and behaving (including daily life routines, activities, interests, opinions, values,
needs, and perceptions) that characterize consumers. Plog (1987) identified eight
psychographics/personality dimensions of the tourist: venturesome ness, pleasure-
seeking, impulsivity, self-confidence, plan-making, masculinity, intellectualism, and
people orientation.
In addition, businesses succeed by providing a product or experience that
reasonably fits consumers’ taste. Lewis, Chambers, and Chacko (1995) stated that
consumers will not buy anything unless they need a certain product, and that could be a
problem. Once the consumers identify the problem, they will start to look for a solution.
Consequently, consumers believe that a purchase of that product or service will be able to
provide the solution to their problem. Based on the demand and supply, consumers have
to seek for a solution by giving up something or making a sacrifice (price) to obtain the
solution (Figure 5).
Need (Problem)
Product/Service Price
(Solution) (Sacrifice) Figure 5. The trade-off problem solutions
Notes. From Marketing leadership in hospitality by Lewis, Chambers, & Chacko,1995,
New York: Van Nostrand Reinhold.
55
Motivations
Gnoth (1999) defined motivation as “The results of specific person-situation
interactions. It contains motives influenced and operationalized by a person’s values and
his perception of given situations” (p. 264). Why consumers behave as they do is
essential to understanding the decision-making processes. Much of the conceptual and
empirical research recognizes that leisure behavior and preferences are likely to be useful
for tourism researchers' interests in motivations for leisure and pleasure travel (Smith &
Godbey, 1991). Decrop (1999) emphasized that motives and personal characteristics
determine a person’s disposition that leads to behavior. Mowen (1990) defined
motivation as an activated state within a person that leads to goal-directed behavior
within a consumer behavior context.
Motivation plays a significant role in determining tourists’ behavior. Krippendorf
(1987) explained tourism motivation as two theories. First, travel is motivated by “going
away from” rather than “going toward” something. Secondly, travelers’ motives and
behavior are markedly self-oriented. In addition, many consumer behavior models in the
tourism industry use psychographics to explain travel motivation. Psychographics
research is used to support such tourism decisions as how to develop destinations and
support services, how to position a tourism service to target certain segments of the
population, and how to advertise, promote and package the product (Plog, 1987).
Gee, Makens, and Choy (1997) indicated the psychological factors that motivate
people involved with pleasure travel including cultural experience, leisure or escape,
personal values, social contact, and social trends. Once consumers realize the existence of
a problem, in which a need is perceived, the need creates a motivated drive state. As a
56
result, the drive state pushes the consumers to engage in goal-directed action to satisfy
their needs (Mowen, 1990). Motivation relates to the tourism marketers’ desire for
satisfaction. Maslow (1954) explained how people are motivated, and their motivations
are based on different needs in different contexts. Pearce (1982) supported the approach-
avoidance paradigm developed by Iso-Ahola (1980), especially in the context of
Maslow’s hierarchy of needs:
Tourists are attracted to holiday destinations because of the possibility of fulfilling
self-actualization, love and belongingness needs, and physiological needs in that
order of importance. When one considers the avoidance side of the motivational
paradigm, a concern with safety is the predominant feature, with additional
emphasis being placed on the failure to satisfy psychological needs, love and
belongingness needs, and self-esteem needs. (p. 129)
The concept in Maslow’s hierarchy is that lower level needs have to be met before the
higher-level needs become important. Based on Maslow’s hierarchy of needs, the
physiological needs such as hunger and thirst usually have to be satisfied before anything
else. The others remain secondary in human motivation until the physiological needs are
met. The main purpose of consumer behavior study is to assist tourism managers in their
decision-making, providing marketing researchers with a theoretical base from which to
make an analysis. In addition, the study of consumer behavior can help the consumer in
making better purchase decisions (Mowen, 1990).
Summary
In summary, a review of the literature has shown that the two-day weekend policy
has become the current trend in the work place worldwide. Indeed, the two-day weekend
57
has brought tremendous attention to a majority of the countries in the world. In the new
millennium, increasing living standards provide people a healthier and longer life.
Consequently, leisure demands will be taken as a primary consideration of quality living
for people worldwide. The need for decreasing the office hours as well as the two-day
weekend is essential to the people. Consequently, the impact of the alternating two-day
weekend policy results in changing the leisure patterns of the people in Taiwan.
This chapter focuses on the historical development of the two-day weekend policy
worldwide as well as the development stages and implementation of the alternating two-
day weekend policy in Taiwan. The purpose of this study is to identify the change in
consumer leisure behavior. Thus, the researcher has largely emphasized leisure concepts
and its related study areas, which directly affect consumer leisure activities. However, the
examination of cultural differences is particularly relevant to the study of leisure
perspectives. Furthermore, the tourism product is intangible, and there is usually a time
lag between the purchase of the product and its actual consumption. This study addresses
the characteristics of consumer behavior in the tourism industry in the literature by
presenting the decision making process, in the context of needs, wants, and motivation.
CHAPTER THREE
METHODOLOGY
The intention of this chapter is to discuss the research methodology of the study.
The research design and procedures employed for this descriptive study are to answer
questions concerning the objectives of this study. The objectives for this study are as
follows:
1. To identify the historical development of the alternating two-day weekend policy
pattern in Taiwan, and the development stages of the two-day weekend policy in
Japan.
2. To identify the effects of the alternating two-day weekend policy in leisure
patterns in Taipei, Taiwan.
3. To analyze changes in type, purpose, leisure area, length of trip, and day of week
of domestic travel in Taipei, Taiwan.
4. To determine factors impacting travel decisions based on the new weekend policy
in Taipei, Taiwan.
This chapter includes the following sections: research design, instrumentation, sources of
data, pilot study, data analysis, and research schedule.
Research Design
This study was designed to identify the changes in consumer leisure behavior in
Taiwan based on the effects of the alternating two-day weekend policy. This research
used a questionnaire to record the respondent’s selection and participation frequency in
leisure activities and domestic travel. In order to analyze the change in consumer leisure
behavior, it is necessary to compare the differences between the previous studies and this
59
study. Thus, three previous studies on domestic travel in Taiwan were utilized as the
secondary resources for this study to identify the changes in consumer leisure behavior
for this study. Three previous studies used as the secondary resources in this study were
as follows:
1. Report on the domestic tourism survey conducted by the Tourism Bureau,
Ministry of Transportation and Communication, R.O.C in 1997.
2. Report on how the alternating two-day weekend policy impacts citizens’
domestic travel activities conducted by the Tourism Bureau, Ministry of
Transportation and Communication, R.O.C in 1998.
3. The research on how the alternating two-day weekend policy impacts citizens’
domestic travel activities conducted by the Department of Statistics, Ministry
of Transportation and Communications, R.O.C in 1999.
These previous studies also indicated that the travel agency is the primary
resource when people look for leisure related activities in Taiwan. Thus, the researcher
decided to conduct the survey through the travel agencies. This quantitative research was
chosen based on the availability and accessibility of the selected consumers from travel
agencies in Taipei, Taiwan. Systematic sampling technology was employed to yield 445
completed surveys. The researcher sent the whole research package to 12 selected travel
agencies on June 28 to June 30, 2000, and the travel agencies played as the research
assistants and conducted the survey from July 1 to August 5, 2000.
In the research package sent to each selected travel agency were the research
instructions, a cover letter to the travel agency, and 40 questionnaires with cover letters
and consent forms. Information including research instructions, cover letter to the travel
60
agency, cover letter and consent form to the potential respondents, and the questionnaire
were all in the Chinese version. The researcher collected data on a weekly basis
throughout the month of July and August 2000, and a follow-up study was made from
August 7 to 18, 2000. All data collection was completed on August 18, 2000.
Sources of Data
Population
The population of this study was the people who use the travel agent as their
primary resource while planning domestic travel in Taiwan. Leisure perception differs
from area to area depending upon where people live. Thus, this study focused on the
changes of consumer behavior in the urban area due to the accessibility of the target
population. The data were collected from Taipei, the capital city of Taiwan, which had
residents of 2,641, 321 based on the Statistical Abstract of Taipei City (Ministry of the
Interior, 1999).
Sample Selection
The travel service industry in Taiwan is divided into three levels: Consolidated
travel agency (Wholesaler), Class A travel agency, and Class B travel agency based on
their company size, scope of business, and type of customer. According to the annual
report on tourism statistics in 1997, the total number and the characteristics of each level
of travel agency are below (Tourism Bureau, Ministry of Transportation and
Communications, R.O.C, 1997).
! Consolidated travel agency (Wholesaler): 50
# Qualification: $300,000 deposit in the Tourism Bureau
# Size: over 50 employees
61
# Scope: International travel and domestic travel
# Type of customer: Class A and Class B travel agencies, direct contact
with travelers
! Class A travel agency: 814
# Qualification: $150,000 deposit in the Tourism Bureau
# Size: 20-50 employees
# Scope: International travel and domestic travel
# Type of customer: Direct contact with travelers
! Class B travel agency:12
# Qualification: $30,000 deposit in the Tourism Bureau
# Size: 5-10 employees
# Scope: Domestic travel
# Type of customer: Direct contact with travelers
The total number of travel agencies in Taipei is 976, which is 55 percent of the
total number of travel agencies in Taiwan. The Class A travel agency occupies over 83
percent of the total number of the travel agencies in Taipei. Therefore, this study focused
on the Class A travel agency as the primary source of data collection. The sample of this
study was from a subset of Class A agencies’ consumers who inquired about travel
information, or travel services during the months of July and August in 2000.
Survey Administration
The questionnaire was given to the consumers who inquired about domestic
travel information, or bought domestic travel products from July 1 to August 5, 2000.
Twelve Class A travel agencies located in Taipei were selected as the primary sources for
62
the data collection. The survey was given to the consumers who came to the travel
agency requesting a group tour, airline ticket, overnight accommodation or other travel
information. The respondents were asked to complete the survey in the travel agency.
The sales representatives of the Class A travel agency were the research assistants who
actually guided the consumer to complete the questionnaire correctly. Also, only one
sales representative from each pre-selected Class A travel agency acted as the research
assistant and was responsible for the data collection.
The research assistants were required to give the questionnaire to consumers who
came to the travel agencies at 2:00pm, 3:00pm, 4:00pm, and 5:00pm during Thursday
and Friday afternoons of the first and third week, or on Tuesday and Wednesday
afternoons of the second and fourth week of July and August 2000. The questionnaires
were printed in different colors for first/third weeks, and second/fourth weeks. Also, the
researcher labeled the questionnaire with colored stickers for different times (2:00pm,
3:00pm, 4:00pm, and 5:00pm) to remind the research assistants to give out the survey in
the correct manner.
To ensure survey quality, a training program for all research assistants was
implemented prior to the survey. The training program included a brief overview of this
research and the correct procedure for the survey. The sales representatives were
requested to review each question to insure their understanding of the questionnaire so
they could provide appropriate assistance as needed to their customers while conducting
the survey. To avoid bias, the sales representatives were not allowed to give any personal
opinion or interrupt consumers during the survey. The researcher contacted all research
assistants one week after the survey as a follow-up step.
63
Instrumentation
The previous studies conducted by the Taiwan Tourism Bureau in the literature
review were utilized as the fundamental resource for the research instrument. The
primary instrument for this study was a questionnaire (see Appendix B for the research
questionnaire). Questions from the previous studies were used to provide a basis for
comparison. The questionnaire was designed based on a pre-interview with the Taiwan
Tourism Bureau and consumers from selected travel agencies in the Taipei metro area.
The research instruments, including a cover letter, were given to potential respondents
through research assistants. The cover letter stated the purposes of the study and the
method to be followed in administering the survey (see Appendix A for the cover letter).
The questionnaire contains seven sections within five pages. An introductory and
directional paragraph was placed at the beginning of the questionnaire. The first section
of the questionnaire was used to identify the alternating two-day weekend policy leading
to changes in consumer leisure patterns. The answer from question one “What type of
weekend policy does your company or school have?” was adopted to indicate the external
factors impacting changes on leisure behavior. Question two “Are you parents of school-
age children?” was used as a qualification question for question three. Question three
“What type of weekend policy does your children’s school have?” was employed to
identify another external factor impacting changes in consumer leisure behavior.
Question four “Have you ever used the alternating two-day weekend off for
domestic travel since the government implemented the new holiday policy on January
10th 1998?” in the second section was employed to identify the effects of the new
weekend policy in Taiwanese leisure pattern. Question five “Has your frequency of
64
participating in the following leisure activities increased or decreased since the
implementation of the alternating two-day weekend policy?” asked the changes in
frequency of different types of leisure activities. The nominal scale was utilized for
questions four and five to accomplish objective two.
The questions in the third section of this questionnaire were applied to analyze the
changes in type, leisure area, purpose, length of trip, and day of week of domestic travel
patterns. Questions six through eight in this section addressed the changes in travel
purpose, leisure area, and timing of travel due to the alternating two-day weekend policy
to accomplish objective three. The answer for question six “When do you prefer to travel
since the implementation of the alternating two-day weekend policy?” examined the
changes on the day of the week for domestic travel. Question seven “Where do you often
go during the weekend since the implementation of the alternating two-day weekend
policy?” and question eight “What is the main purpose of domestic travel since the
implementation of the alternating weekend policy?” were used to analyze the change in
leisure areas and travel purposes.
The answer for question nine “What type of travel do you frequently engage in
since the alternating two-day weekend policy was implemented?” and question ten ”How
do you organize your travel?” were used to analyze the change in travel patterns.
Question eleven “Has your frequency of domestic travel changed since the
implementation of the alternating two-day weekend?” was employed to recognize the
changes in domestic travel frequency as well as to qualify for questions twelve and
thirteen. If the answer to question eleven was “yes”, the respondents would have needed
to answer question twelve. Otherwise, the respondents would have to skip to question
65
thirteen. Question twelve “How has the number of each of the following type of trips
changed?” was utilized to discover the changes in the length of trip of Taiwanese
domestic travel. The nominal scale was utilized from question six to question twelve to
achieve objective three. In addition, question thirteen “If the frequency of your domestic
travel hasn’t changed, what is the primary barrier preventing you from travel?”
investigated the barrier preventing people from travel. The nominal scale was employed
for question thirteen to fulfill objective four.
The fourth section of the questionnaire was used to determine the impacts of the
earthquake on domestic travel. Question fourteen “Has the earthquake affected your
domestic travel plans?” and question fifteen “What is your preferred domestic travel
destination after the earthquake?” were employed to identify the impact of the
earthquake. The nominal scale was used in the fourth section to address the impact of the
earthquake for objective four.
The fifth section of the questionnaire was utilized to analyze consumer leisure
preferences. Question sixteen was a multiple-choice question where respondents were
asked to check off all leisure activities they regularly participate in from 24 possible
leisure activities listed on the questionnaire. The nominal scale was employed for
question sixteen to ascertain consumer leisure patterns based on personal leisure
preferences.
The questions in the sixth section measured the importance of the internal factors
when the respondents make travel decision to achieve objective four. The ordinal scale
was employed in question seventeen with 10 possible considerations affecting peoples’
66
travel decisions. A 5-point Likert scale was used with 1 being determined as least
important and 5 being determined as most important.
The final section was used for the demographics of the sample. The main purpose
of this section was to collect basic information from each respondent. The questions on
the demographics of gender, marital status, age, educational background, number of
children, occupation, and personal monthly income involved the validity and reliability of
the collected data among a list of variables. The variables that were used on the
questionnaire were selected on the basis of a review of the literature and the previous
research conducted by the Tourism Bureau, Ministry of Transportation and
Communications, Republic of China as indicated in chapter two.
Pilot Study
A pilot study was used to test whether the questionnaire had any error. The
significant objective of administering a questionnaire is to acquire a reliable and valid
measurement of an individual’s opinions on a prescribed issue. This process allows the
researcher to make corrections in wording or layout prior to the full administration of the
questionnaire in order to modify the questionnaire if needed.
The pilot study contained two parts. First, 15 Taiwanese students at the University
of Wisconsin-Stout were asked to review and critique the questionnaire prior to full-scale
administration to make sure each element of the questionnaire was appropriate in terms
of accessibility and convenience. The first part of the pilot study at the University of
Wisconsin-Stout containing both the Chinese and the English versions of the
questionnaire was conducted from May 5 to May 7, 2000. Secondly, the questionnaire
was sent to 19 travel agency’s consumers to examine whether the questionnaire was able
67
to get at the factors the researcher intended it to. The second part of the pilot test in
Taiwan containing only the Chinese version questionnaire was e-mailed to one pre-
selected travel agency sales representative from May 8 to May 12, 2000.
From the pilot study of both Taiwanese students at the University of Wisconsin-
Stout and the selected travel agency’s consumers, the questionnaire were made to
correspond with the study, and necessary changes were found. In the part of the pilot
study, there were two different versions so that the translation was emphasized. Several
unclear points were detected by the Taiwanese students at the University of Wisconsin-
Stout. Many of the Taiwanese students at the University of Wisconsin-Stout indicated
that it was hard to answer questions three, thirteen, and seventeen as a result of the
translation problem. In the second part of this study, the sales representative mentioned
that some consumers had difficulty answering questions due to the confusion of selected
answers as well as the translation problem.
Data Analysis
Statistical Package for the Social Sciences (SPSS) was used to analyze the
statistics. Data were tabulated by individual questions and in some areas merged with
other like questions for comparison with the previous researches. While 445
questionnaires were received, not all respondents answered every question. Thus,
tabulated responses were based on the number respondent to question. Crosschecks were
made to ensure accuracy of the tabulations. Descriptive statistics were applied for
computing means, and standard deviations.
The nominal scale of measurement that involved frequency and percentage
distributions was used from question one through question sixteen. The ordinal scale was
68
utilized in question seventeen to test the internal factors impacting consumer leisure
behavior. The nominal data involved frequency and percentage distributions for the last
part of the questionnaire regarding gender, marital status, age, educational background,
occupation, and personal monthly income were used for the demographics of the sample.
Research Schedule
The primary data for this study was conducted from July 1 to August 5, 2000.
The researcher stayed in touch with the travel agencies on a weekly basis while data was
collected. A follow-up study was made from August 7 to 18, 2000. After the data
collection process, the researcher coded the data and used SPSS to analyze the results.
CHAPTER FOUR
RESULTS AND DISCUSSIONS
This chapter contains the results and discussions of the study. This chapter
presents the results and findings regarding the data obtained from the responses to the
questionnaire. Data and information found in this study were analyzed and discussed in
accordance with the research objectives introduced in chapter one. The chapter concludes
with the discussions of the results as they related to the review of literature.
In this study, 570 questionnaires were distributed to the consumers who came to
the travel agency requesting a group tour, airline ticket, overnight accommodation or
other travel information from July 1 to August 18, 2000 in Taipei, Taiwan. Four hundred
and sixteen questionnaires were returned by August 5, 2000. Indeed, 408 of the total
returned questionnaires were completed and valid. A follow-up study was conducted
from August 7 to 18, 2000, and 43 questionnaires were returned. Thirty-seven
questionnaires were completed and valid in the follow-up study. As a result, 445
completed and valid questionnaires were obtained throughout this study. The overall
response rate was 78.1 percent.
The Statistic Package of the Social Sciences (SPSS) was utilized to analyze the
data received in this study. The frequencies of response were tabulated from most of the
question items, which were based upon multiple-choice. While 445 questionnaires were
received, not all respondents answered every question. Therefore, tabulated responses
were based on the number of respondents to each question. Data were tabulated by
individual question and in some areas merged with other like questions for comparison
with previous research. The cross-tabulation was used to describe the demography of all
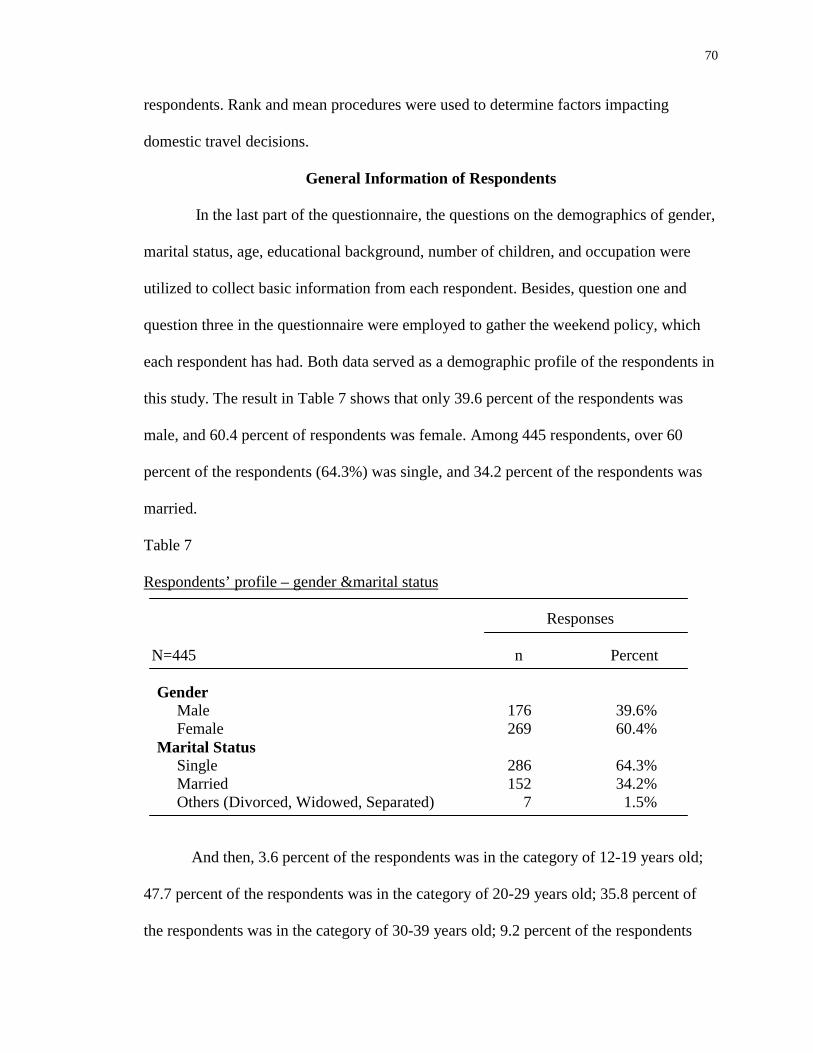
70
respondents. Rank and mean procedures were used to determine factors impacting
domestic travel decisions.
General Information of Respondents
In the last part of the questionnaire, the questions on the demographics of gender,
marital status, age, educational background, number of children, and occupation were
utilized to collect basic information from each respondent. Besides, question one and
question three in the questionnaire were employed to gather the weekend policy, which
each respondent has had. Both data served as a demographic profile of the respondents in
this study. The result in Table 7 shows that only 39.6 percent of the respondents was
male, and 60.4 percent of respondents was female. Among 445 respondents, over 60
percent of the respondents (64.3%) was single, and 34.2 percent of the respondents was
married.
Table 7
Respondents’ profile – gender &marital status
Responses
N=445 n Percent
Gender Male Female
176269
39.6%60.4%
Marital Status Single Married Others (Divorced, Widowed, Separated)
286152
7
64.3%34.2%1.5%
And then, 3.6 percent of the respondents was in the category of 12-19 years old;
47.7 percent of the respondents was in the category of 20-29 years old; 35.8 percent of
the respondents was in the category of 30-39 years old; 9.2 percent of the respondents
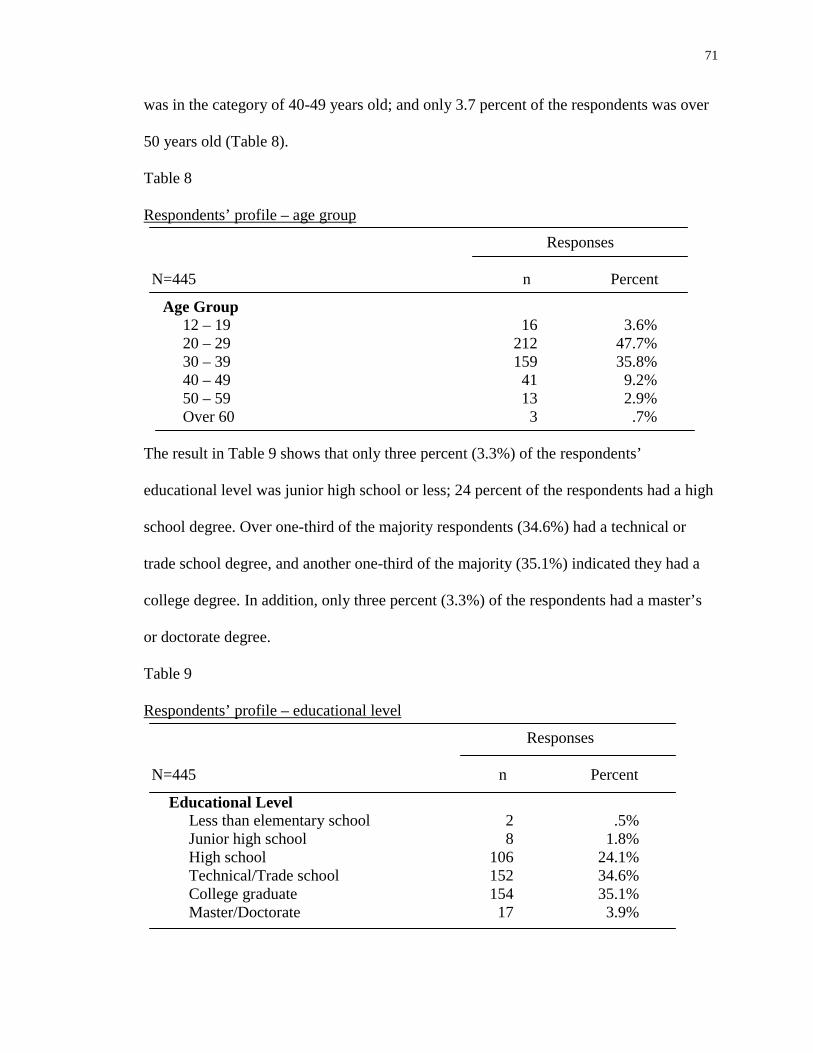
71
was in the category of 40-49 years old; and only 3.7 percent of the respondents was over
50 years old (Table 8).
Table 8
Respondents’ profile – age group
Responses
N=445 n Percent
Age Group 12 – 19 20 – 29 30 – 39 40 – 49 50 – 59 Over 60
1621215941133
3.6%
47.7% 35.8% 9.2% 2.9% .7%
The result in Table 9 shows that only three percent (3.3%) of the respondents’
educational level was junior high school or less; 24 percent of the respondents had a high
school degree. Over one-third of the majority respondents (34.6%) had a technical or
trade school degree, and another one-third of the majority (35.1%) indicated they had a
college degree. In addition, only three percent (3.3%) of the respondents had a master’s
or doctorate degree.
Table 9
Respondents’ profile – educational level
Responses
N=445 n Percent
Educational Level Less than elementary school Junior high school High school Technical/Trade school College graduate Master/Doctorate
2 8
106 152 154 17
.5%
1.8% 24.1% 34.6% 35.1% 3.9%
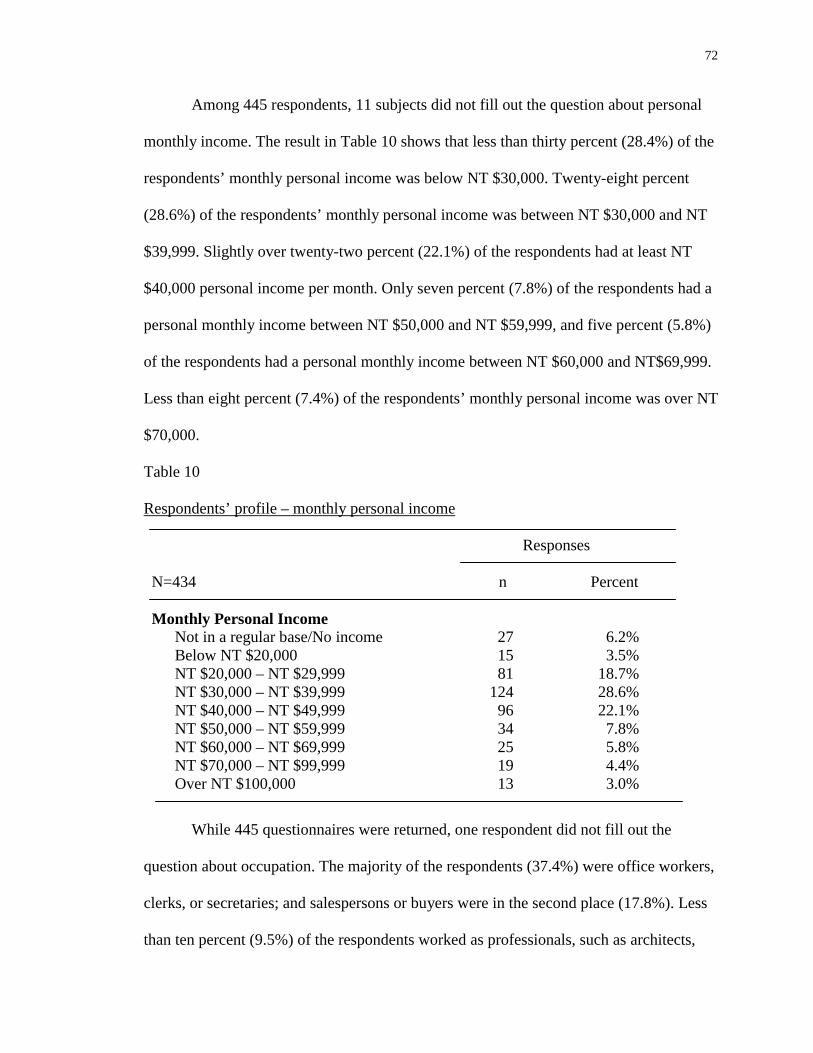
72
Among 445 respondents, 11 subjects did not fill out the question about personal
monthly income. The result in Table 10 shows that less than thirty percent (28.4%) of the
respondents’ monthly personal income was below NT $30,000. Twenty-eight percent
(28.6%) of the respondents’ monthly personal income was between NT $30,000 and NT
$39,999. Slightly over twenty-two percent (22.1%) of the respondents had at least NT
$40,000 personal income per month. Only seven percent (7.8%) of the respondents had a
personal monthly income between NT $50,000 and NT $59,999, and five percent (5.8%)
of the respondents had a personal monthly income between NT $60,000 and NT$69,999.
Less than eight percent (7.4%) of the respondents’ monthly personal income was over NT
$70,000.
Table 10
Respondents’ profile – monthly personal income
Responses
N=434 n Percent
Monthly Personal Income Not in a regular base/No income Below NT $20,000 NT $20,000 – NT $29,999 NT $30,000 – NT $39,999 NT $40,000 – NT $49,999 NT $50,000 – NT $59,999 NT $60,000 – NT $69,999 NT $70,000 – NT $99,999 Over NT $100,000
27 15 81
124 96 34 25 19 13
6.2% 3.5%
18.7% 28.6% 22.1% 7.8% 5.8% 4.4% 3.0%
While 445 questionnaires were returned, one respondent did not fill out the
question about occupation. The majority of the respondents (37.4%) were office workers,
clerks, or secretaries; and salespersons or buyers were in the second place (17.8%). Less
than ten percent (9.5%) of the respondents worked as professionals, such as architects,
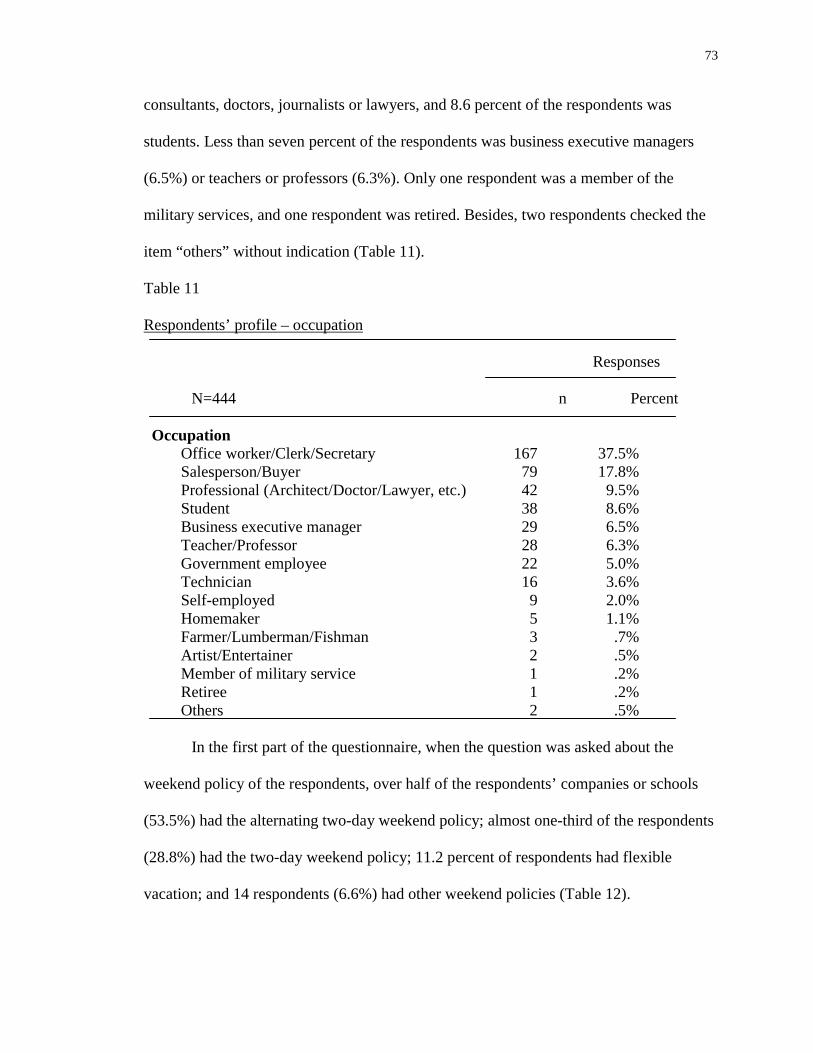
73
consultants, doctors, journalists or lawyers, and 8.6 percent of the respondents was
students. Less than seven percent of the respondents was business executive managers
(6.5%) or teachers or professors (6.3%). Only one respondent was a member of the
military services, and one respondent was retired. Besides, two respondents checked the
item “others” without indication (Table 11).
Table 11
Respondents’ profile – occupation
Responses
N=444 n Percent
Occupation Office worker/Clerk/Secretary 167 37.5% Salesperson/Buyer 79 17.8% Professional (Architect/Doctor/Lawyer, etc.) 42 9.5% Student 38 8.6% Business executive manager 29 6.5% Teacher/Professor 28 6.3% Government employee 22 5.0% Technician 16 3.6% Self-employed 9 2.0% Homemaker 5 1.1% Farmer/Lumberman/Fishman 3 .7% Artist/Entertainer 2 .5% Member of military service 1 .2% Retiree 1 .2% Others 2 .5%
In the first part of the questionnaire, when the question was asked about the
weekend policy of the respondents, over half of the respondents’ companies or schools
(53.5%) had the alternating two-day weekend policy; almost one-third of the respondents
(28.8%) had the two-day weekend policy; 11.2 percent of respondents had flexible
vacation; and 14 respondents (6.6%) had other weekend policies (Table 12).
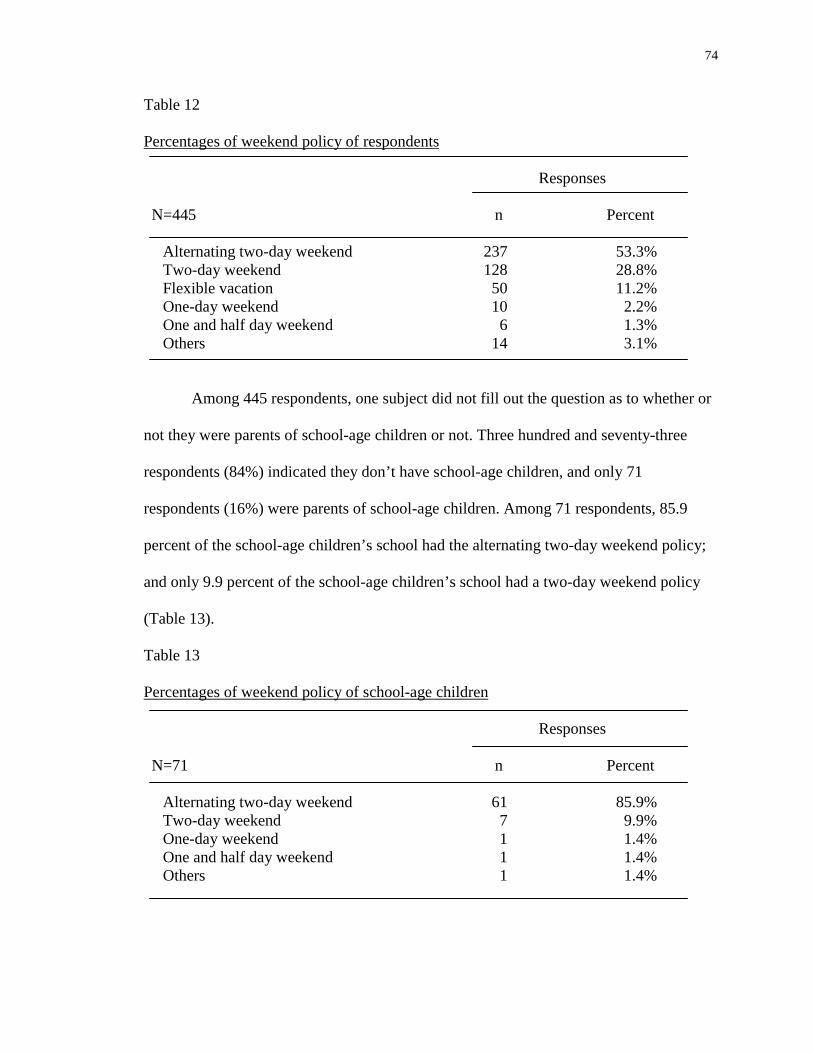
74
Table 12
Percentages of weekend policy of respondents
Responses
N=445 n Percent
Alternating two-day weekend Two-day weekend Flexible vacation One-day weekend One and half day weekend Others
237 128 50 10 6
14
53.3%28.8%11.2%2.2%1.3%3.1%
Among 445 respondents, one subject did not fill out the question as to whether or
not they were parents of school-age children or not. Three hundred and seventy-three
respondents (84%) indicated they don’t have school-age children, and only 71
respondents (16%) were parents of school-age children. Among 71 respondents, 85.9
percent of the school-age children’s school had the alternating two-day weekend policy;
and only 9.9 percent of the school-age children’s school had a two-day weekend policy
(Table 13).
Table 13
Percentages of weekend policy of school-age children
Responses
N=71 n Percent
Alternating two-day weekend Two-day weekend One-day weekend One and half day weekend Others
61 7 1 1 1
85.9%9.9%1.4%1.4%1.4%
75
The Preferences in Consumer Leisure Patterns
The result from question sixteen was utilized to analyze consumer leisure patterns
based on the preferences in leisure activities. The preferences in consumer leisure
activities are listed in rank order in Table 14. “Audio-visual activities” was the most
popular leisure activity as perceived by the respondents. The top ten leisure activities that
respondents regularly participate in were ranked by respondents as follows: audio-visual
activities, shopping, talking or visiting friends, reading books or magazines, enjoying the
sight of nature, internet, famous tourist destinations, field walking or mountain climbing,
swimming, and visiting spa.
The top one was audio-visual activities in which over 64 percent (64.7%) of the
respondents participated. Secondly, over half of the respondents (52.8%) checked off the
activity “shopping” as the leisure activity they regularly participate in. Talking or visiting
friends was ranked third with a 38 percent response rate. Over one-third of the
respondents (36.2%) checked off “reading books or magazines” as the favorite leisure
activity. Among 445 respondents, 130 people responded (29.2%) on the designated
activity “enjoying the sight of nature.” Internet was ranked 6th with a 29 percent response
rate as a frequent leisure activity. As illustrated in Table 14, the rest of the top ten leisure
activities (famous tourist destination, field walking or mountain climbing, swimming, and
visiting spa) were also popular with at least 100 responses as a leisure preference.
The five least frequent leisure activities were visiting historical site or cultural
tour, water sports, fishing, photographing, or sketching, and observing wildlife or bird
watching. Among 445 respondents, three subjects checked off “others” and indicated that
they regularly participated in listening to music, KTV, and Mah-Jong.
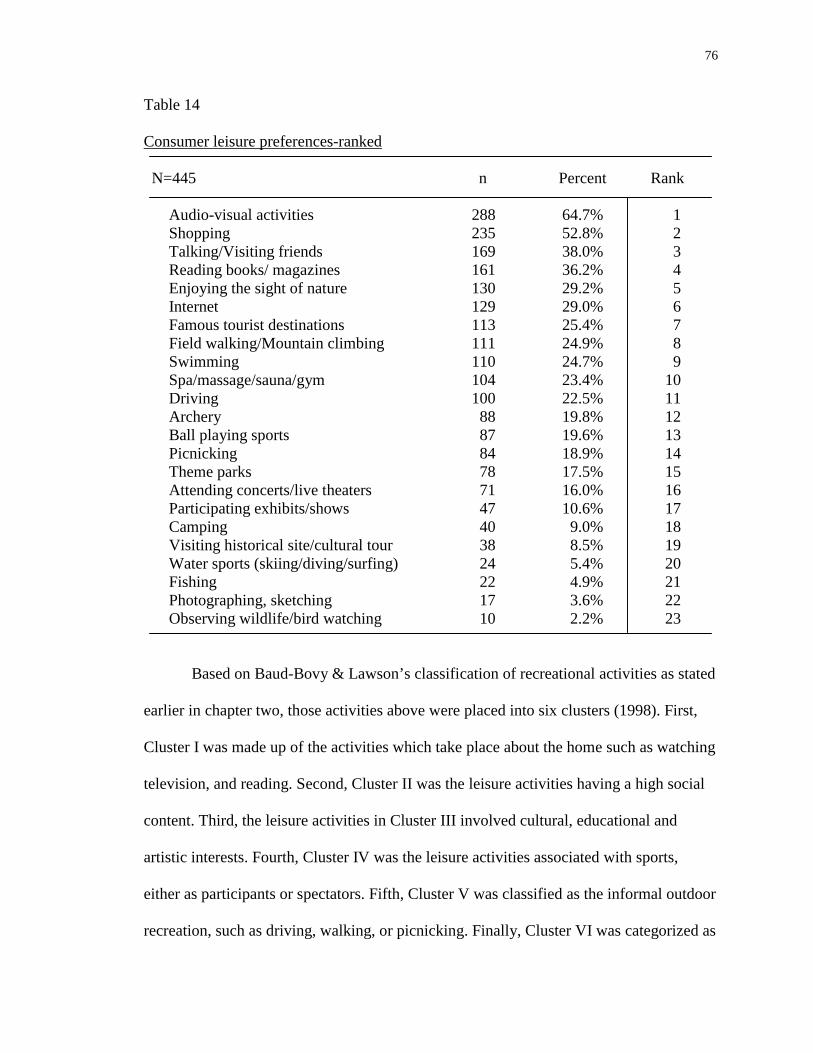
76
Table 14
Consumer leisure preferences-ranked
N=445 n Percent Rank
Audio-visual activities Shopping Talking/Visiting friends Reading books/ magazines Enjoying the sight of nature Internet Famous tourist destinations Field walking/Mountain climbing Swimming Spa/massage/sauna/gym Driving Archery Ball playing sports Picnicking Theme parks Attending concerts/live theaters Participating exhibits/shows Camping Visiting historical site/cultural tour Water sports (skiing/diving/surfing) Fishing Photographing, sketching Observing wildlife/bird watching
288235169161130129113111110104100888784787147403824221710
64.7% 52.8% 38.0% 36.2% 29.2% 29.0% 25.4% 24.9% 24.7% 23.4% 22.5% 19.8% 19.6% 18.9% 17.5% 16.0% 10.6% 9.0% 8.5% 5.4% 4.9% 3.6% 2.2%
1 2 3 4 5 6 7 8 9
10 11 12 13 14 15 16 17 18 19 20 21 22 23
Based on Baud-Bovy & Lawson’s classification of recreational activities as stated
earlier in chapter two, those activities above were placed into six clusters (1998). First,
Cluster I was made up of the activities which take place about the home such as watching
television, and reading. Second, Cluster II was the leisure activities having a high social
content. Third, the leisure activities in Cluster III involved cultural, educational and
artistic interests. Fourth, Cluster IV was the leisure activities associated with sports,
either as participants or spectators. Fifth, Cluster V was classified as the informal outdoor
recreation, such as driving, walking, or picnicking. Finally, Cluster VI was categorized as
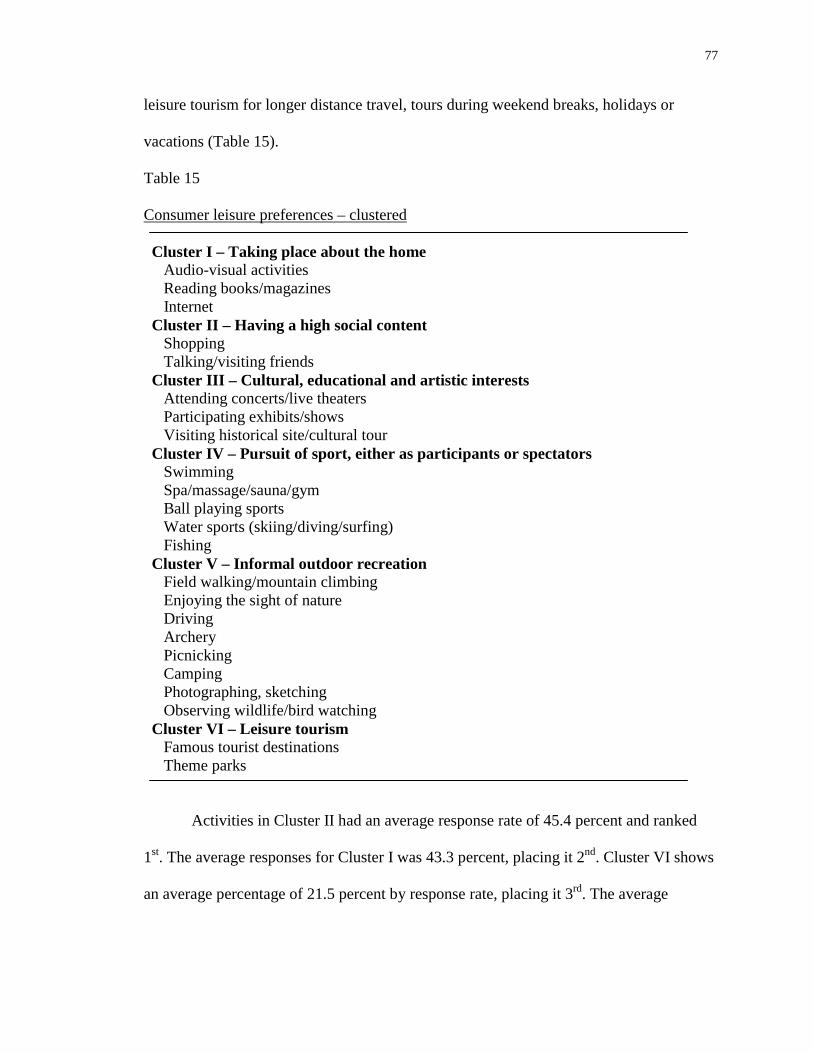
77
leisure tourism for longer distance travel, tours during weekend breaks, holidays or
vacations (Table 15).
Table 15
Consumer leisure preferences – clustered
Cluster I – Taking place about the home Audio-visual activities Reading books/magazines Internet Cluster II – Having a high social content Shopping Talking/visiting friends Cluster III – Cultural, educational and artistic interests Attending concerts/live theaters Participating exhibits/shows Visiting historical site/cultural tour Cluster IV – Pursuit of sport, either as participants or spectators Swimming Spa/massage/sauna/gym Ball playing sports Water sports (skiing/diving/surfing) Fishing Cluster V – Informal outdoor recreation Field walking/mountain climbing Enjoying the sight of nature Driving Archery Picnicking Camping Photographing, sketching Observing wildlife/bird watching Cluster VI – Leisure tourism Famous tourist destinations Theme parks
Activities in Cluster II had an average response rate of 45.4 percent and ranked
1st. The average responses for Cluster I was 43.3 percent, placing it 2nd. Cluster VI shows
an average percentage of 21.5 percent by response rate, placing it 3rd. The average
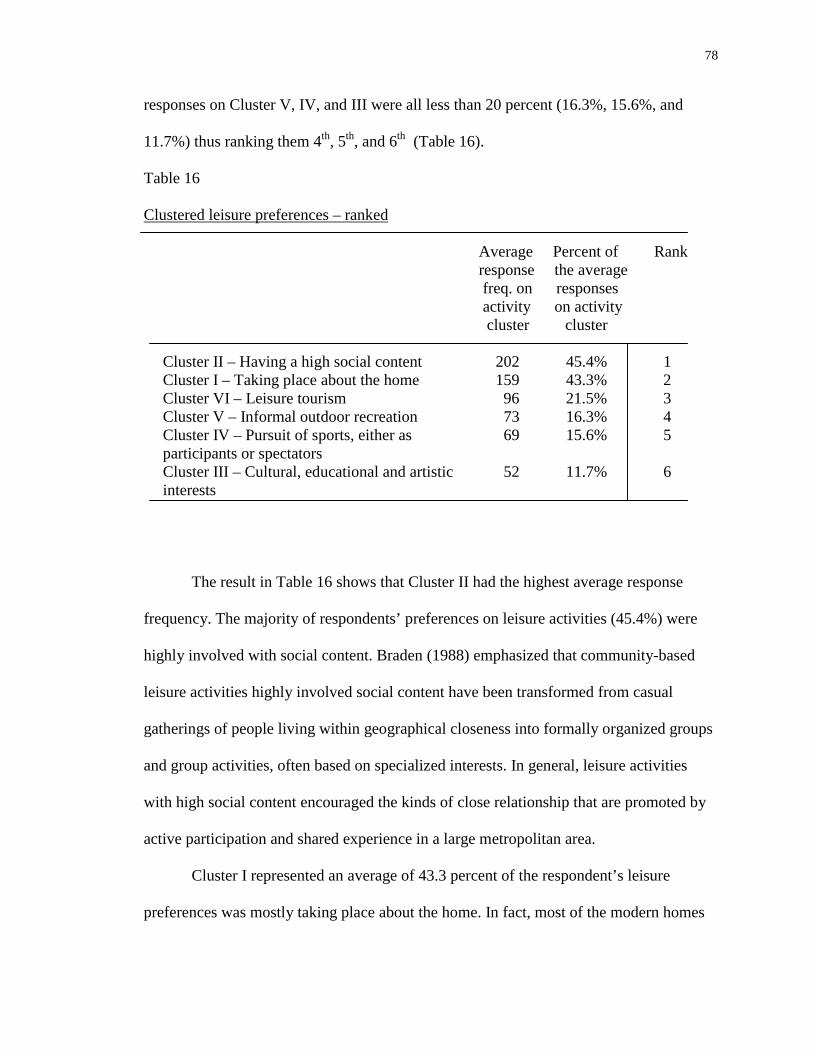
78
responses on Cluster V, IV, and III were all less than 20 percent (16.3%, 15.6%, and
11.7%) thus ranking them 4th, 5th, and 6th (Table 16).
Table 16
Clustered leisure preferences – ranked
Average Percent of Rank response the average freq. on responses activity on activity
cluster cluster
Cluster II – Having a high social content 202 45.4% 1 Cluster I – Taking place about the home 159 43.3% 2 Cluster VI – Leisure tourism 96 21.5% 3 Cluster V – Informal outdoor recreation 73 16.3% 4 Cluster IV – Pursuit of sports, either as participants or spectators
69 15.6% 5
Cluster III – Cultural, educational and artistic interests
52 11.7% 6
The result in Table 16 shows that Cluster II had the highest average response
frequency. The majority of respondents’ preferences on leisure activities (45.4%) were
highly involved with social content. Braden (1988) emphasized that community-based
leisure activities highly involved social content have been transformed from casual
gatherings of people living within geographical closeness into formally organized groups
and group activities, often based on specialized interests. In general, leisure activities
with high social content encouraged the kinds of close relationship that are promoted by
active participation and shared experience in a large metropolitan area.
Cluster I represented an average of 43.3 percent of the respondent’s leisure
preferences was mostly taking place about the home. In fact, most of the modern homes
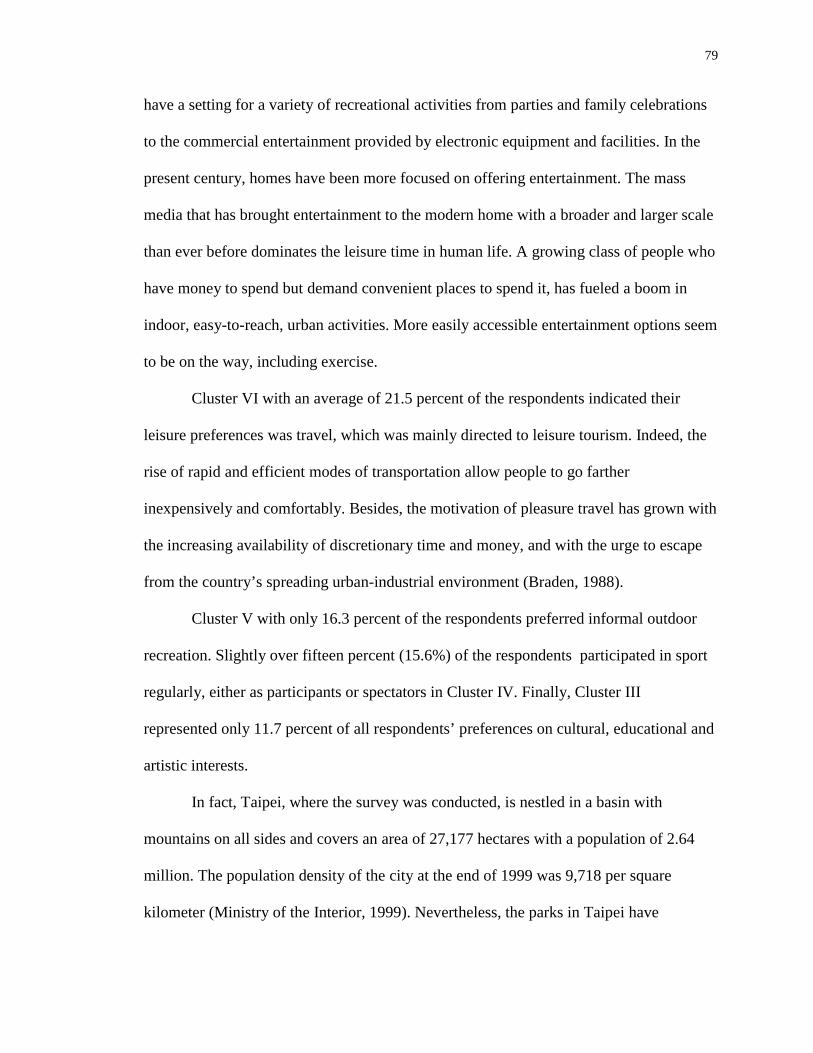
79
have a setting for a variety of recreational activities from parties and family celebrations
to the commercial entertainment provided by electronic equipment and facilities. In the
present century, homes have been more focused on offering entertainment. The mass
media that has brought entertainment to the modern home with a broader and larger scale
than ever before dominates the leisure time in human life. A growing class of people who
have money to spend but demand convenient places to spend it, has fueled a boom in
indoor, easy-to-reach, urban activities. More easily accessible entertainment options seem
to be on the way, including exercise.
Cluster VI with an average of 21.5 percent of the respondents indicated their
leisure preferences was travel, which was mainly directed to leisure tourism. Indeed, the
rise of rapid and efficient modes of transportation allow people to go farther
inexpensively and comfortably. Besides, the motivation of pleasure travel has grown with
the increasing availability of discretionary time and money, and with the urge to escape
from the country’s spreading urban-industrial environment (Braden, 1988).
Cluster V with only 16.3 percent of the respondents preferred informal outdoor
recreation. Slightly over fifteen percent (15.6%) of the respondents participated in sport
regularly, either as participants or spectators in Cluster IV. Finally, Cluster III
represented only 11.7 percent of all respondents’ preferences on cultural, educational and
artistic interests.
In fact, Taipei, where the survey was conducted, is nestled in a basin with
mountains on all sides and covers an area of 27,177 hectares with a population of 2.64
million. The population density of the city at the end of 1999 was 9,718 per square
kilometer (Ministry of the Interior, 1999). Nevertheless, the parks in Taipei have
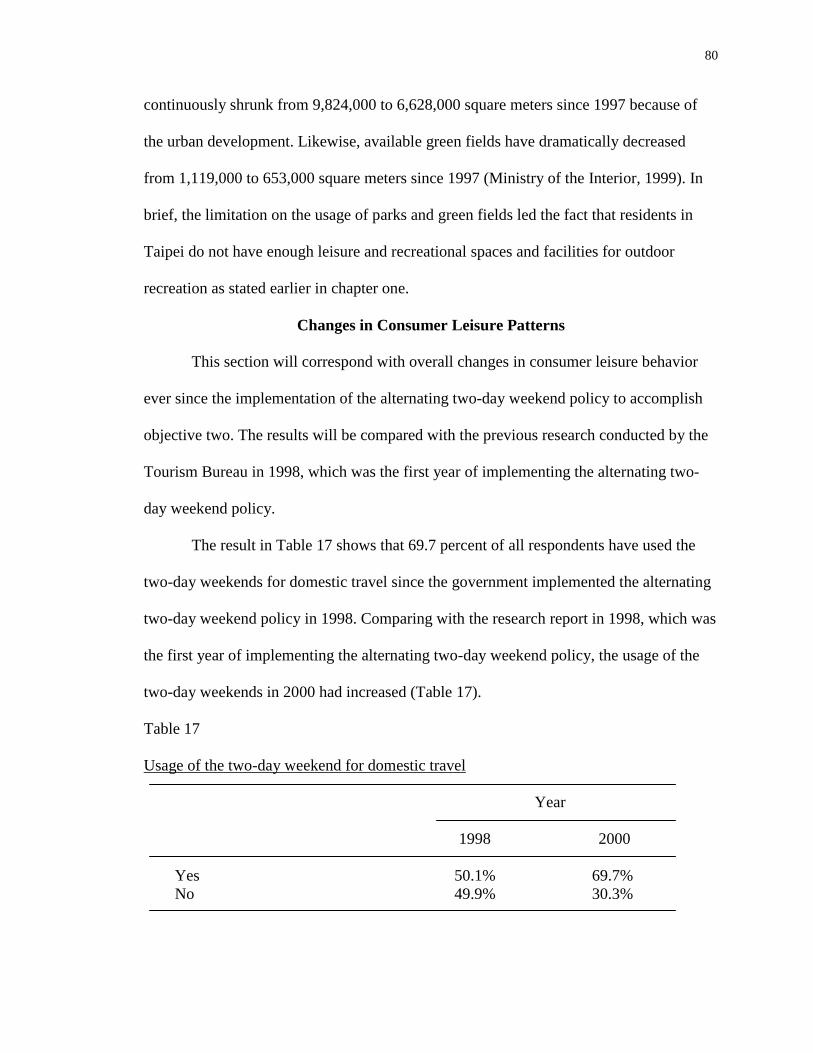
80
continuously shrunk from 9,824,000 to 6,628,000 square meters since 1997 because of
the urban development. Likewise, available green fields have dramatically decreased
from 1,119,000 to 653,000 square meters since 1997 (Ministry of the Interior, 1999). In
brief, the limitation on the usage of parks and green fields led the fact that residents in
Taipei do not have enough leisure and recreational spaces and facilities for outdoor
recreation as stated earlier in chapter one.
Changes in Consumer Leisure Patterns
This section will correspond with overall changes in consumer leisure behavior
ever since the implementation of the alternating two-day weekend policy to accomplish
objective two. The results will be compared with the previous research conducted by the
Tourism Bureau in 1998, which was the first year of implementing the alternating two-
day weekend policy.
The result in Table 17 shows that 69.7 percent of all respondents have used the
two-day weekends for domestic travel since the government implemented the alternating
two-day weekend policy in 1998. Comparing with the research report in 1998, which was
the first year of implementing the alternating two-day weekend policy, the usage of the
two-day weekends in 2000 had increased (Table 17).
Table 17
Usage of the two-day weekend for domestic travel
Year
1998 2000
Yes No
50.1% 49.9%
69.7% 30.3%
81
The statistical data in Table 18 illustrates that over half of the respondents’
frequency of time killing activities (56.4%) was increased. Likewise, 53.7 percent of the
respondents increased the frequency of entertainment activities. Almost half of the
respondents (46.7%) increased the frequency of outdoor leisure activities. However, forty
percent of the respondents (40.9%) increased their frequency of domestic travel, and 56.4
percent of the respondents’ frequency of domestic travel hasn’t changed. Only one-third
(34.6%) of the respondents increased personal growth activities. Less than thirty percent
(29.9%) of the respondents increased the frequency of indoor leisure activities.
Table 18
Changes in the frequency of participating in different leisure activities in 2000
Percent of Percent of Percent of N=445 Increase No Change Decrease
Domestic travel 40.9 56.4 2.7 Personal growth activities 34.6 61.1 4.3 Time killing activities 56.4 40.9 2.7 Entertainment 53.7 43.4 2.9 Indoor activities 29.9 63.1 7.0 Outdoor activities 46.7 48.8 4.5 Other hobbies 18.9 75.0 6.1
Also, the results from this study were contrasted with the previous research
conducted by the Tourism Bureau in 1998 in Table 19 to see if there was any difference
in consumer leisure by the year of 2000.
Several changes were found regarding the comparison of research findings. First
of all, respondents had a lower increasing rate of domestic travel, 40.9 percent in this
study compared to that of the year of 1998 with 47.7 percent. In fact, respondents were
asked the primary barrier preventing them from travel if the frequency of their domestic
82
travel has not changed in question thirteen of the questionnaire. The result shows that the
barrier "could not stand the traffic jams and crowds" was ranked 1st, and "too crowded at
the tourist destination " placed 2nd. As presented earlier in chapter one, many citizens
often complain about the lack of leisure facilities and a public transportation system.
Likewise, the increasing rate of outdoor leisure activities in this study (46.7%) was lower
than the year of 1998 (51.5%).
Secondly, the finding regarding the frequency of time killing leisure activities,
such as audio-visual activities and video games, had a higher increasing rate in this study
(56.4%) than the previous study (45.3%) in 1998. In like manner, the increasing rate of
indoor leisure activities from this study (29.9%) was also higher than the previous study
(21.2%) in 1998. As stated in the last section on the preferences in consumer leisure
behavior, 64.4 percent of the respondents checked "audio-visual activities", which was
ranked the most popular leisure activities. "Internet", and "spa, massage, sauna, gym"
were combined as a part of indoor activities were placed 6th and 10th in consumer leisure
preferences. In particular, indoor leisure activities involving electronic equipment and
facilities seem to be more attractive to most people due to the limitation of leisure
facilities in urban areas.
Thirdly, the result in Table 19 shows that the majority of respondents' frequency
of entertainment, such as talking or seeing friends and shopping, had increased (53.7%)
since the implementation of the alternating two-day weekend policy in 1998. Similarly,
the increasing rate for entertainment in 1998, the first year of the implementation of the
two-day weekend policy, was also over fifty percent (56%). Besides, "shopping" and
"talking and visiting friends" ranked 2nd and 3rd in leisure preferences as presented earlier
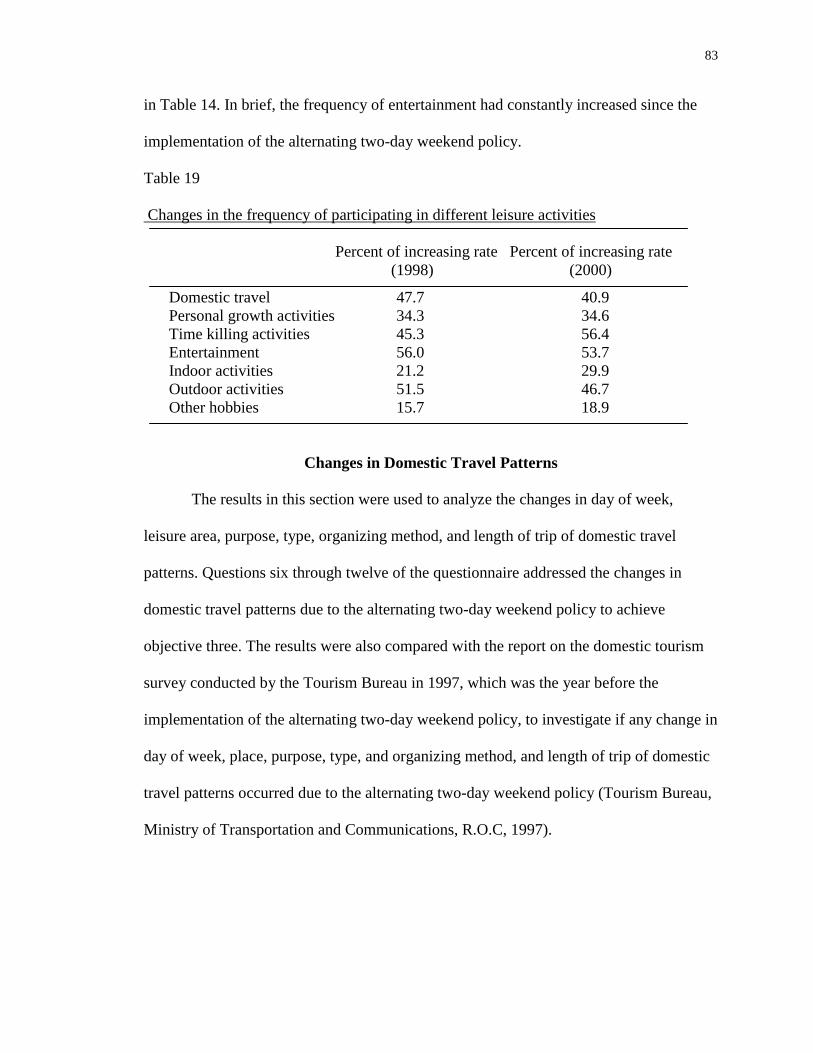
83
in Table 14. In brief, the frequency of entertainment had constantly increased since the
implementation of the alternating two-day weekend policy.
Table 19
Changes in the frequency of participating in different leisure activities
Percent of increasing rate Percent of increasing rate (1998) (2000)
Domestic travel 47.7 40.9 Personal growth activities 34.3 34.6 Time killing activities 45.3 56.4 Entertainment 56.0 53.7 Indoor activities 21.2 29.9 Outdoor activities 51.5 46.7 Other hobbies 15.7 18.9
Changes in Domestic Travel Patterns
The results in this section were used to analyze the changes in day of week,
leisure area, purpose, type, organizing method, and length of trip of domestic travel
patterns. Questions six through twelve of the questionnaire addressed the changes in
domestic travel patterns due to the alternating two-day weekend policy to achieve
objective three. The results were also compared with the report on the domestic tourism
survey conducted by the Tourism Bureau in 1997, which was the year before the
implementation of the alternating two-day weekend policy, to investigate if any change in
day of week, place, purpose, type, and organizing method, and length of trip of domestic
travel patterns occurred due to the alternating two-day weekend policy (Tourism Bureau,
Ministry of Transportation and Communications, R.O.C, 1997).
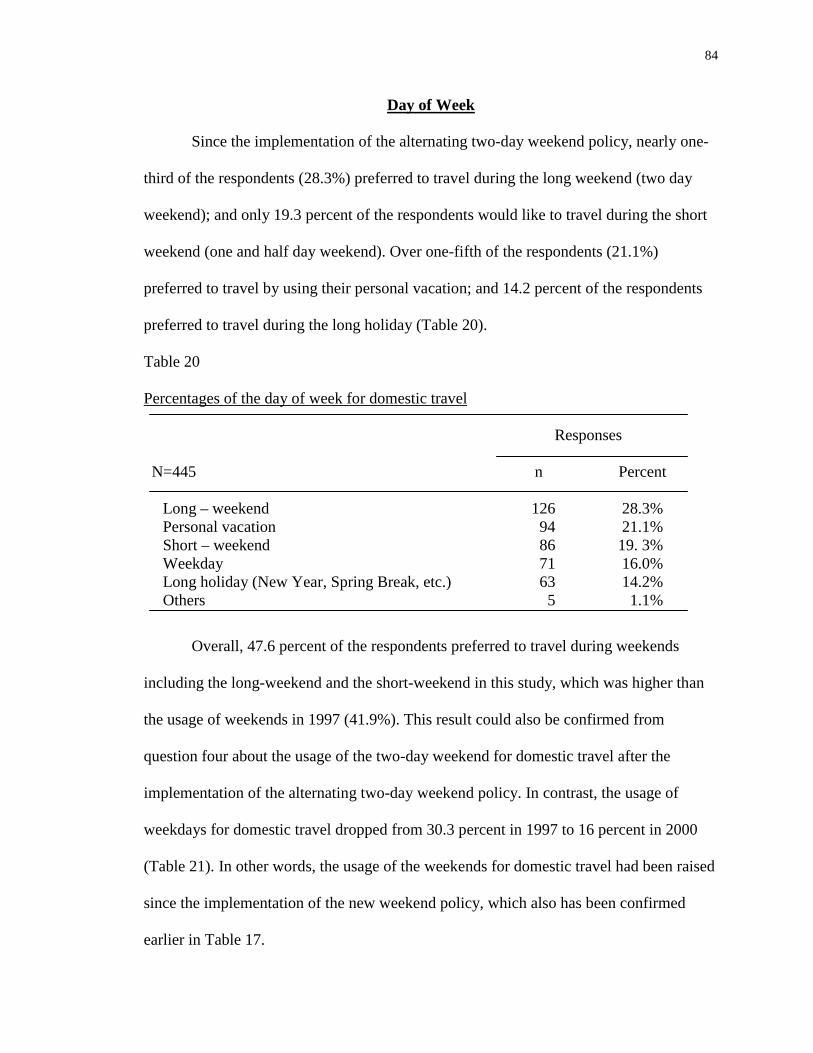
84
Day of Week
Since the implementation of the alternating two-day weekend policy, nearly one-
third of the respondents (28.3%) preferred to travel during the long weekend (two day
weekend); and only 19.3 percent of the respondents would like to travel during the short
weekend (one and half day weekend). Over one-fifth of the respondents (21.1%)
preferred to travel by using their personal vacation; and 14.2 percent of the respondents
preferred to travel during the long holiday (Table 20).
Table 20
Percentages of the day of week for domestic travel
Responses
N=445 n Percent
Long – weekend Personal vacation Short – weekend Weekday Long holiday (New Year, Spring Break, etc.) Others
126948671635
28.3% 21.1%
19. 3% 16.0% 14.2% 1.1%
Overall, 47.6 percent of the respondents preferred to travel during weekends
including the long-weekend and the short-weekend in this study, which was higher than
the usage of weekends in 1997 (41.9%). This result could also be confirmed from
question four about the usage of the two-day weekend for domestic travel after the
implementation of the alternating two-day weekend policy. In contrast, the usage of
weekdays for domestic travel dropped from 30.3 percent in 1997 to 16 percent in 2000
(Table 21). In other words, the usage of the weekends for domestic travel had been raised
since the implementation of the new weekend policy, which also has been confirmed
earlier in Table 17.
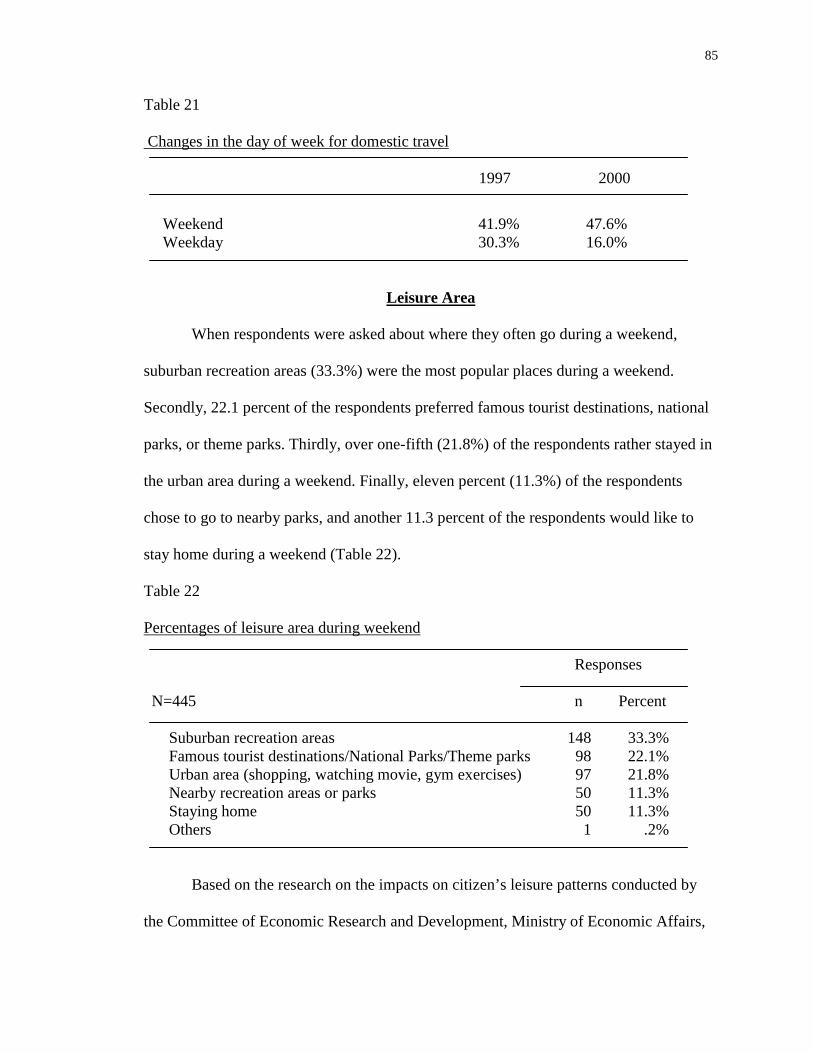
85
Table 21
Changes in the day of week for domestic travel
1997 2000
Weekend Weekday
41.9% 30.3%
47.6%16.0%
Leisure Area
When respondents were asked about where they often go during a weekend,
suburban recreation areas (33.3%) were the most popular places during a weekend.
Secondly, 22.1 percent of the respondents preferred famous tourist destinations, national
parks, or theme parks. Thirdly, over one-fifth (21.8%) of the respondents rather stayed in
the urban area during a weekend. Finally, eleven percent (11.3%) of the respondents
chose to go to nearby parks, and another 11.3 percent of the respondents would like to
stay home during a weekend (Table 22).
Table 22
Percentages of leisure area during weekend
Responses N=445 n Percent
Suburban recreation areas Famous tourist destinations/National Parks/Theme parks Urban area (shopping, watching movie, gym exercises) Nearby recreation areas or parks Staying home Others
148989750501
33.3%22.1%21.8%11.3%11.3%
.2% Based on the research on the impacts on citizen’s leisure patterns conducted by
the Committee of Economic Research and Development, Ministry of Economic Affairs,
86
R.O.C in 1998, the alternating two-day weekend policy has modified the partition of
citizens’ leisure time. Consequently, domestic leisure activity within the normal living
environment is the primary leisure pattern because of the concern for an available time
frame for leisure activity. Besides, suburban recreation areas are categorized as regional
leisure and accommodation which urban people would like to get to during one day or
weekend break based on the time frame developed by the Economic and Development
Bureau, Ministry of Economic Affairs, R.O.C in 1991 as presented in chapter two. In the
same manner, urban areas (shopping, watch movie, gym exercises), nearby recreation
areas or parks, and staying home are categorized as the community sports or leisure areas,
or cities or regional leisure areas for only few hours. Altogether, the majority of the
respondents (77.7%) chose community or regional leisure areas as their preferred leisure
areas during a weekend.
Purpose for Travel
Question eight of the questionnaire asked the main purpose of domestic travel
since the implementation of the alternating two-day weekend policy. “Escaping from the
ordinary and relaxation” was the number one choice of the respondents (51.2%). Forty
percent (41.6%) of the respondents traveled with the purpose of sightseeing and pleasure.
Among 445 respondents, only 18 respondents (4%) primarily traveled with the purpose
of visiting friends or relatives. Seven people (1.6%) responded with “combining business
and pleasure”, and five people (1.1%) responded with “religious activities” as the primary
travel purpose (Table 23).
The primary travel purpose for the majority of respondents in this study was to
escape from ordinary or to relax. Travel for sightseeing or pleasure purposes in the year
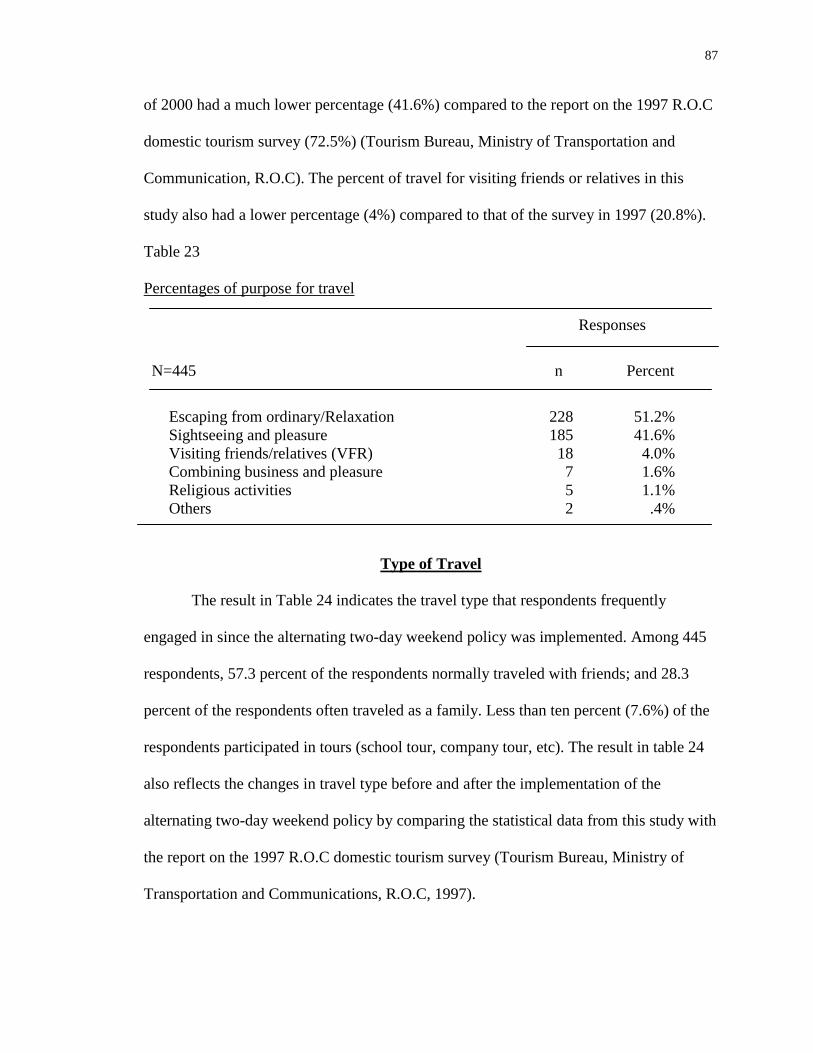
87
of 2000 had a much lower percentage (41.6%) compared to the report on the 1997 R.O.C
domestic tourism survey (72.5%) (Tourism Bureau, Ministry of Transportation and
Communication, R.O.C). The percent of travel for visiting friends or relatives in this
study also had a lower percentage (4%) compared to that of the survey in 1997 (20.8%).
Table 23
Percentages of purpose for travel
Responses
N=445 n Percent
Escaping from ordinary/Relaxation Sightseeing and pleasure Visiting friends/relatives (VFR) Combining business and pleasure Religious activities Others
228 185 18 7 5 2
51.2% 41.6% 4.0% 1.6% 1.1% .4%
Type of Travel
The result in Table 24 indicates the travel type that respondents frequently
engaged in since the alternating two-day weekend policy was implemented. Among 445
respondents, 57.3 percent of the respondents normally traveled with friends; and 28.3
percent of the respondents often traveled as a family. Less than ten percent (7.6%) of the
respondents participated in tours (school tour, company tour, etc). The result in table 24
also reflects the changes in travel type before and after the implementation of the
alternating two-day weekend policy by comparing the statistical data from this study with
the report on the 1997 R.O.C domestic tourism survey (Tourism Bureau, Ministry of
Transportation and Communications, R.O.C, 1997).
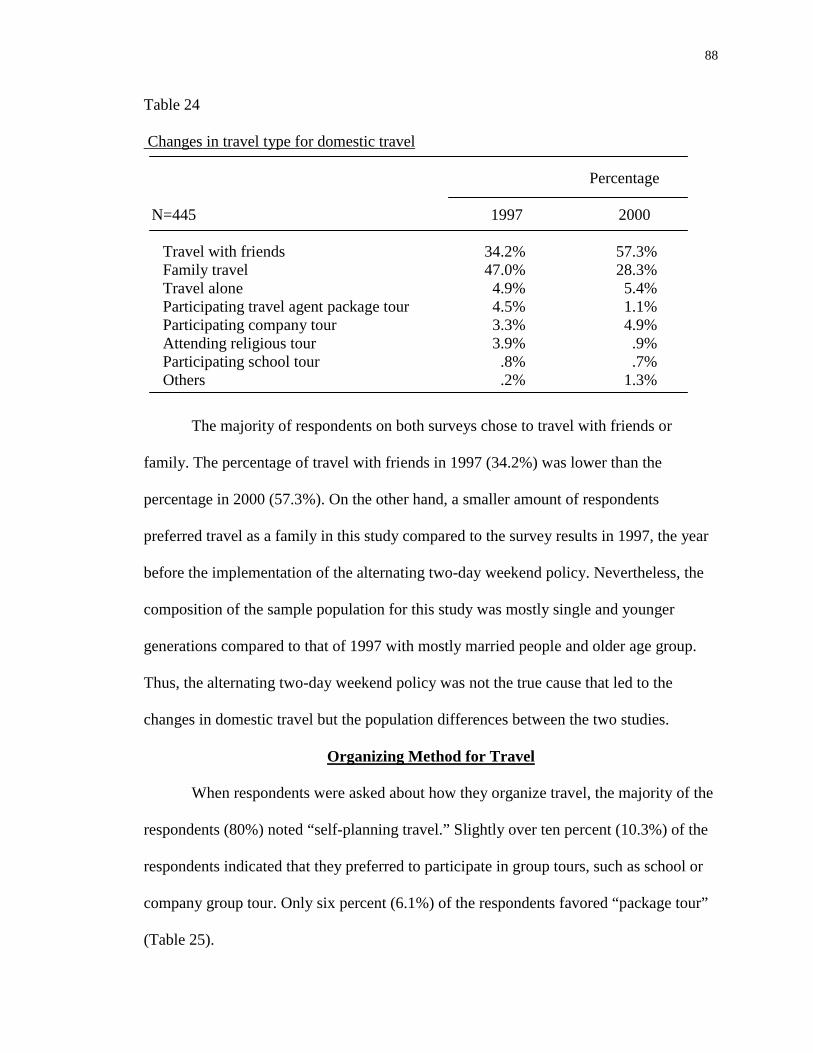
88
Table 24
Changes in travel type for domestic travel
Percentage
N=445 1997 2000
Travel with friends Family travel Travel alone Participating travel agent package tour Participating company tour Attending religious tour Participating school tour Others
34.2% 47.0% 4.9% 4.5% 3.3% 3.9% .8% .2%
57.3% 28.3% 5.4% 1.1% 4.9% .9% .7%
1.3%
The majority of respondents on both surveys chose to travel with friends or
family. The percentage of travel with friends in 1997 (34.2%) was lower than the
percentage in 2000 (57.3%). On the other hand, a smaller amount of respondents
preferred travel as a family in this study compared to the survey results in 1997, the year
before the implementation of the alternating two-day weekend policy. Nevertheless, the
composition of the sample population for this study was mostly single and younger
generations compared to that of 1997 with mostly married people and older age group.
Thus, the alternating two-day weekend policy was not the true cause that led to the
changes in domestic travel but the population differences between the two studies.
Organizing Method for Travel
When respondents were asked about how they organize travel, the majority of the
respondents (80%) noted “self-planning travel.” Slightly over ten percent (10.3%) of the
respondents indicated that they preferred to participate in group tours, such as school or
company group tour. Only six percent (6.1%) of the respondents favored “package tour”
(Table 25).
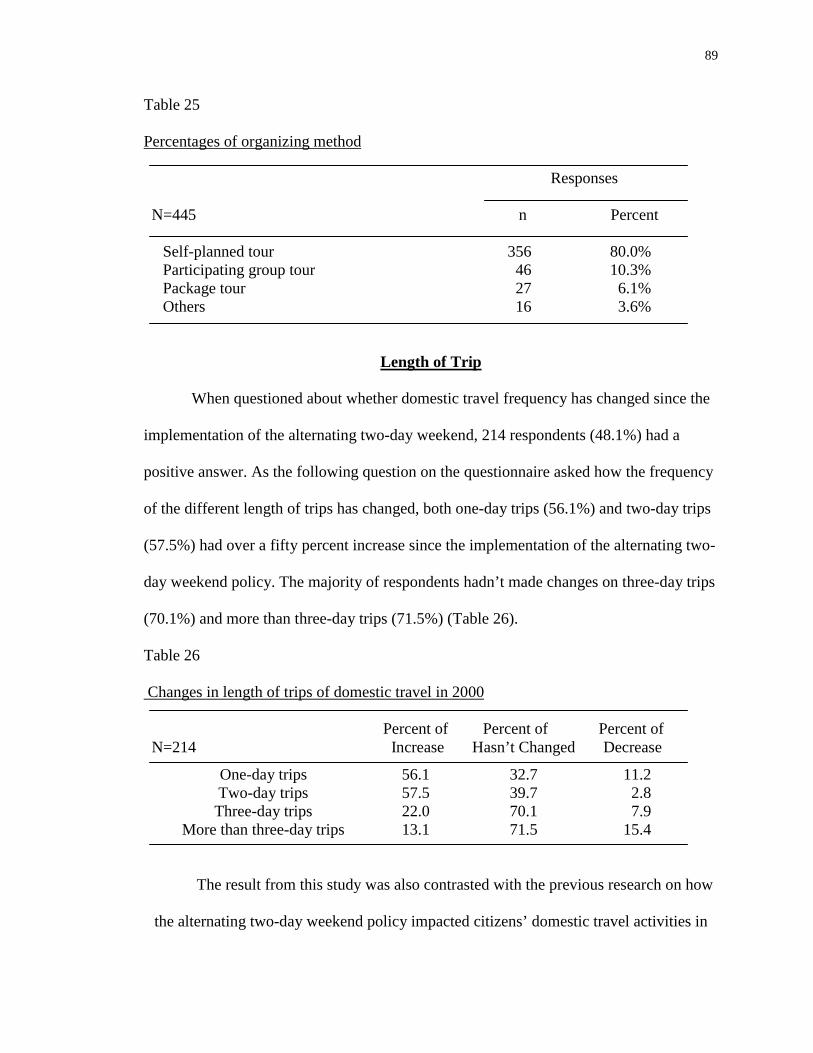
89
Table 25
Percentages of organizing method
Responses
N=445 n Percent
Self-planned tour Participating group tour Package tour Others
356462716
80.0% 10.3% 6.1% 3.6%
Length of Trip
When questioned about whether domestic travel frequency has changed since the
implementation of the alternating two-day weekend, 214 respondents (48.1%) had a
positive answer. As the following question on the questionnaire asked how the frequency
of the different length of trips has changed, both one-day trips (56.1%) and two-day trips
(57.5%) had over a fifty percent increase since the implementation of the alternating two-
day weekend policy. The majority of respondents hadn’t made changes on three-day trips
(70.1%) and more than three-day trips (71.5%) (Table 26).
Table 26
Changes in length of trips of domestic travel in 2000
Percent of Percent of Percent of N=214 Increase Hasn’t Changed Decrease
One-day trips 56.1 32.7 11.2 Two-day trips 57.5 39.7 2.8
Three-day trips 22.0 70.1 7.9 More than three-day trips 13.1 71.5 15.4
The result from this study was also contrasted with the previous research on how
the alternating two-day weekend policy impacted citizens’ domestic travel activities in
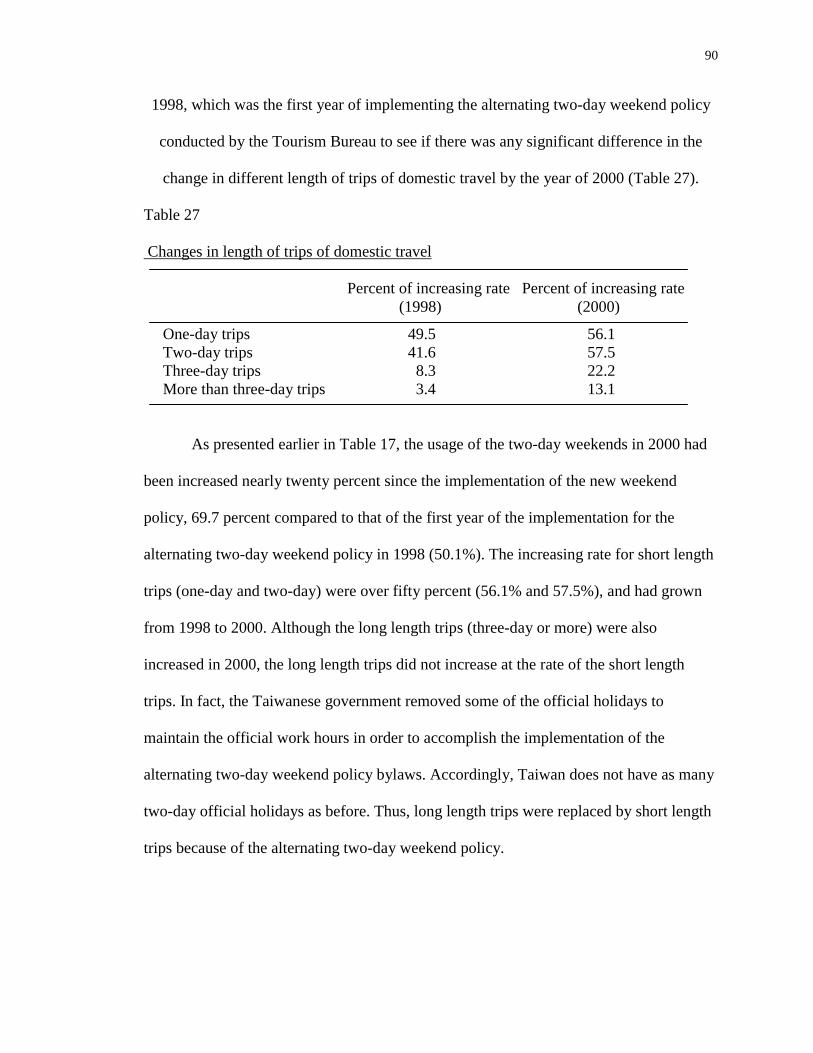
90
1998, which was the first year of implementing the alternating two-day weekend policy
conducted by the Tourism Bureau to see if there was any significant difference in the
change in different length of trips of domestic travel by the year of 2000 (Table 27).
Table 27
Changes in length of trips of domestic travel
Percent of increasing rate Percent of increasing rate (1998) (2000)
One-day trips 49.5 56.1 Two-day trips 41.6 57.5 Three-day trips 8.3 22.2 More than three-day trips 3.4 13.1
As presented earlier in Table 17, the usage of the two-day weekends in 2000 had
been increased nearly twenty percent since the implementation of the new weekend
policy, 69.7 percent compared to that of the first year of the implementation for the
alternating two-day weekend policy in 1998 (50.1%). The increasing rate for short length
trips (one-day and two-day) were over fifty percent (56.1% and 57.5%), and had grown
from 1998 to 2000. Although the long length trips (three-day or more) were also
increased in 2000, the long length trips did not increase at the rate of the short length
trips. In fact, the Taiwanese government removed some of the official holidays to
maintain the official work hours in order to accomplish the implementation of the
alternating two-day weekend policy bylaws. Accordingly, Taiwan does not have as many
two-day official holidays as before. Thus, long length trips were replaced by short length
trips because of the alternating two-day weekend policy.
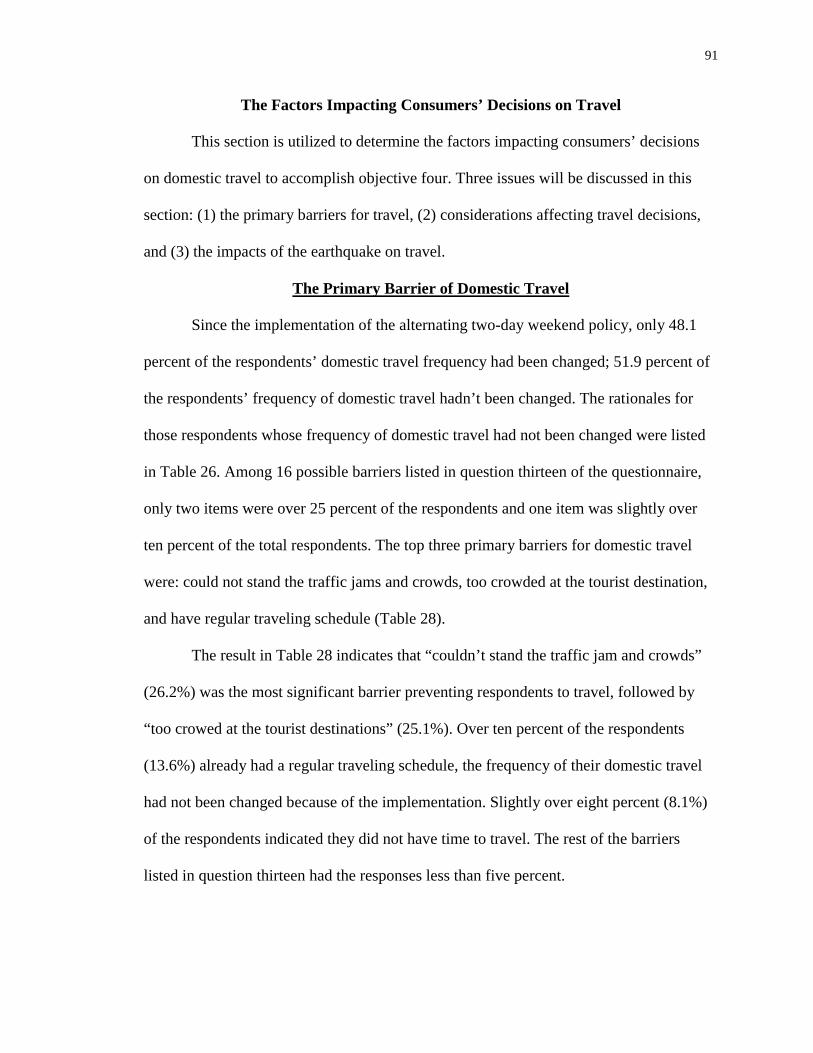
91
The Factors Impacting Consumers’ Decisions on Travel
This section is utilized to determine the factors impacting consumers’ decisions
on domestic travel to accomplish objective four. Three issues will be discussed in this
section: (1) the primary barriers for travel, (2) considerations affecting travel decisions,
and (3) the impacts of the earthquake on travel.
The Primary Barrier of Domestic Travel
Since the implementation of the alternating two-day weekend policy, only 48.1
percent of the respondents’ domestic travel frequency had been changed; 51.9 percent of
the respondents’ frequency of domestic travel hadn’t been changed. The rationales for
those respondents whose frequency of domestic travel had not been changed were listed
in Table 26. Among 16 possible barriers listed in question thirteen of the questionnaire,
only two items were over 25 percent of the respondents and one item was slightly over
ten percent of the total respondents. The top three primary barriers for domestic travel
were: could not stand the traffic jams and crowds, too crowded at the tourist destination,
and have regular traveling schedule (Table 28).
The result in Table 28 indicates that “couldn’t stand the traffic jam and crowds”
(26.2%) was the most significant barrier preventing respondents to travel, followed by
“too crowed at the tourist destinations” (25.1%). Over ten percent of the respondents
(13.6%) already had a regular traveling schedule, the frequency of their domestic travel
had not been changed because of the implementation. Slightly over eight percent (8.1%)
of the respondents indicated they did not have time to travel. The rest of the barriers
listed in question thirteen had the responses less than five percent.
92
Table 28
Primary barriers for domestic travel
Percent Rank
Couldn’t stand the traffic jams and crowds 26.2% 1 Too crowded at the tourist destination 25.1% 2 Have regular traveling schedule 13.6% 3 No time 8.1% 4 Couldn’t find someone to travel with 4.7% 5 Don’t feel like going 4.7% 5 Don’t know where to go 4.2% 7 Weather condition 3.6% 8 Not enough money 2.5% 9 Others 2.5% 9 Personal transportation problems 1.9% 11 Work pressure/too much school work 1.4% 12 Not interested in traveling 1.1% 13 Earthquake .3% 14
In metropolitan Taipei, rush-hour traffic frequently triples regular commuting
time. It can be even worse on holidays and long weekends. Although Taiwan boasts six
national parks, accounting for 8.5 percent of the island's land, many people seldom visit
them for fear of traffic problems. Consequently, many people stick close to home
(Government Information Office, 2000). According to the report conducted by the
Department of Statistics, Ministry of Transportation and Communications, R.O.C in
1999, over 70 percent of Taiwanese (72.5%) believed that travel conditions were getting
worse after the implementation of the alternating two-day weekend policy.
As stated in chapter one, most tourism destinations are too crowded by tourists.
People often complain about the lack of leisure facilities and a public transportation
system. When respondents were asked about the level of difficulty in making reservations
for public transportation, such as airplanes or trains, in the report conducted by the
93
Department of Statistics, R.O.C in 1999, 27.4 percent of the respondents suffered more
difficulty on airplanes reservation, and 31.7 percent of the respondents felt more
difficulty on trains reservation compared with the past. Almost half of the respondents
had a much more difficult time in making reservations for hotels, resorts, and other types
of leisure facilities in most tourist destinations (Department of Statistics, Ministry of
Transportation and Communications, R.O.C, 1999).
In contrast with the top three barriers, the last two barriers were “not interested in
traveling”, and “earthquake”. Because the survey was conducted through travel agencies,
and the respondents were the customers who inquired for travel services, such a lower
response as “not interested in traveling” could be anticipated. Less than one percent
(0.3%) indicated that the earthquake was the primary barrier for their domestic travel
plan. As the third issue, the impact of the earthquake, this section will show later that less
than fifty percent (46.3%) of respondents’ domestic travel plans were influenced by the
earthquake.
Further, Crawford and Godbey (1987) elaborated on three primary barriers for
leisure activities: (1) intrapersonal constraint, (2) interpersonal constraint, and (3)
structural constraint. The barriers in this survey can be categorized in these three ways.
First, intrapersonal constraint was related to personal mind and characteristics
including “don’t feel like going”, “not interested in traveling”, “work pressure/too much
school work”, “health concerns”, and “have regular traveling schedule already”.
Secondly, interpersonal constraint was interpersonal relationships, which only include
“couldn’t find someone to travel with”. Finally, structural constraint was mostly an
external factor including “no time”, “weather conditions”, “personal transportation
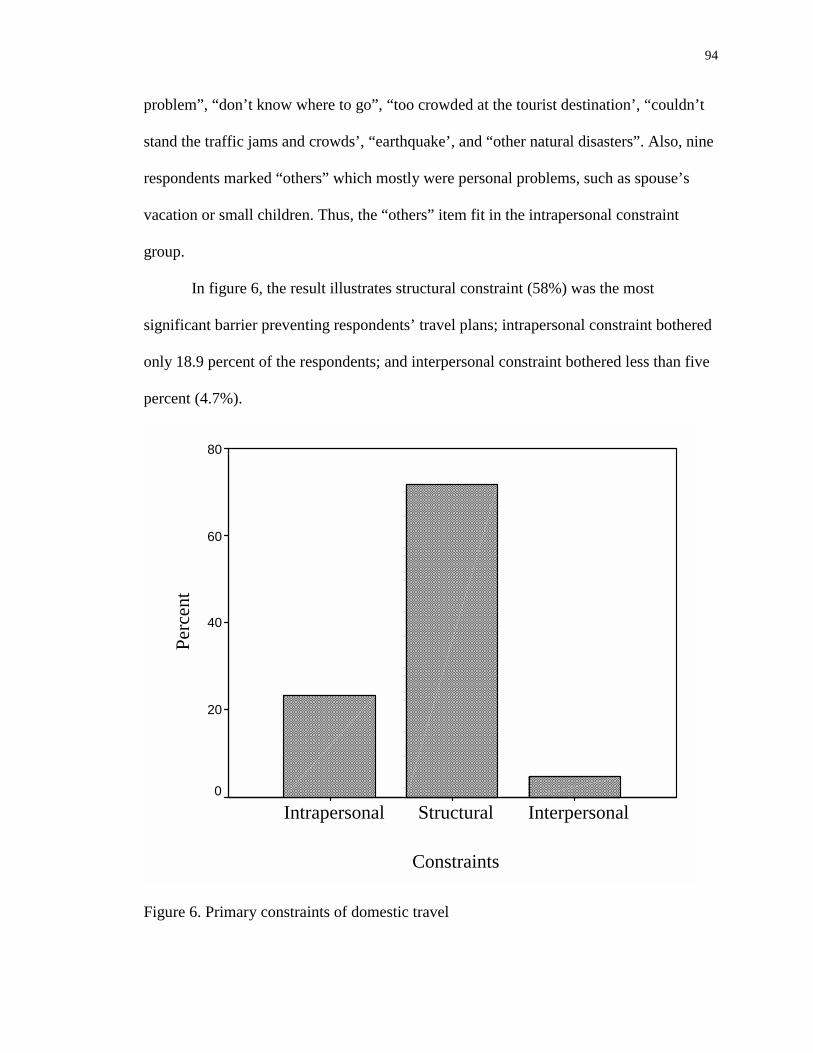
94
problem”, “don’t know where to go”, “too crowded at the tourist destination’, “couldn’t
stand the traffic jams and crowds’, “earthquake’, and “other natural disasters”. Also, nine
respondents marked “others” which mostly were personal problems, such as spouse’s
vacation or small children. Thus, the “others” item fit in the intrapersonal constraint
group.
In figure 6, the result illustrates structural constraint (58%) was the most
significant barrier preventing respondents’ travel plans; intrapersonal constraint bothered
only 18.9 percent of the respondents; and interpersonal constraint bothered less than five
percent (4.7%).
Constraints
InterpersonalStructuralIntrapersonal
Perc
ent
80
60
40
20
0
Figure 6. Primary constraints of domestic travel
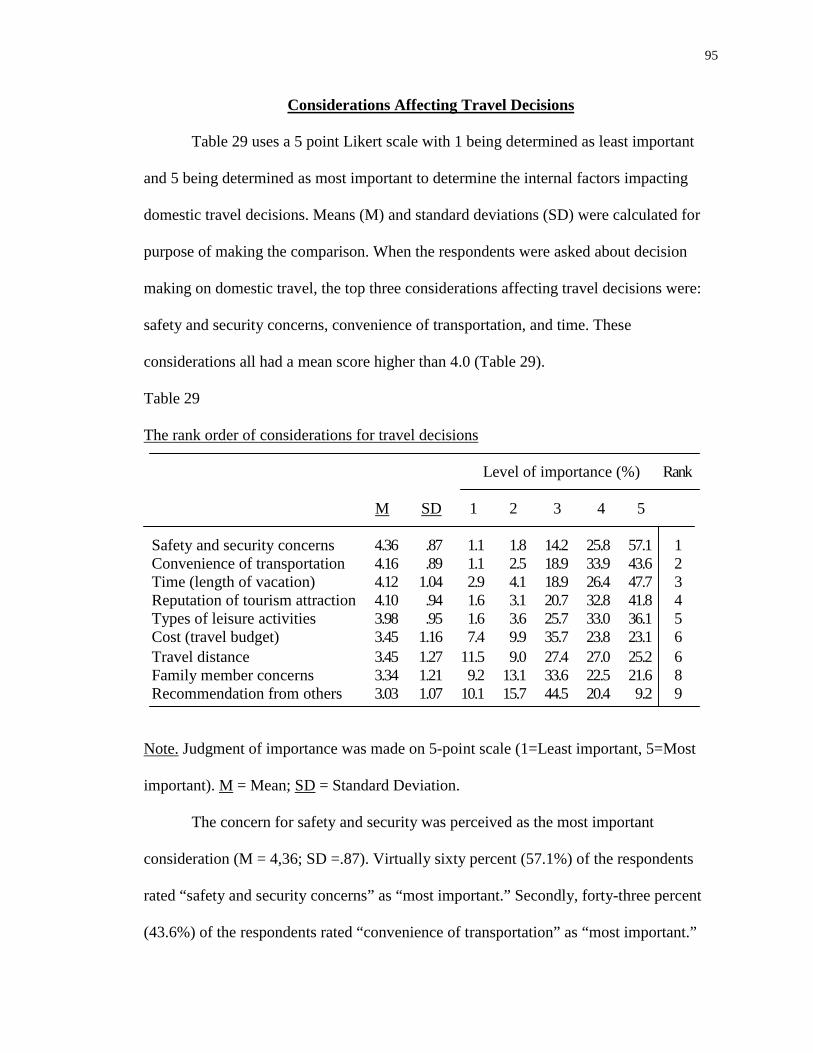
95
Considerations Affecting Travel Decisions
Table 29 uses a 5 point Likert scale with 1 being determined as least important
and 5 being determined as most important to determine the internal factors impacting
domestic travel decisions. Means (M) and standard deviations (SD) were calculated for
purpose of making the comparison. When the respondents were asked about decision
making on domestic travel, the top three considerations affecting travel decisions were:
safety and security concerns, convenience of transportation, and time. These
considerations all had a mean score higher than 4.0 (Table 29).
Table 29
The rank order of considerations for travel decisions
Level of importance (%) Rank M SD 1 2 3 4 5
Safety and security concerns 4.36 .87 1.1 1.8 14.2 25.8 57.1 1 Convenience of transportation 4.16 .89 1.1 2.5 18.9 33.9 43.6 2 Time (length of vacation) 4.12 1.04 2.9 4.1 18.9 26.4 47.7 3 Reputation of tourism attraction 4.10 .94 1.6 3.1 20.7 32.8 41.8 4 Types of leisure activities 3.98 .95 1.6 3.6 25.7 33.0 36.1 5 Cost (travel budget) 3.45 1.16 7.4 9.9 35.7 23.8 23.1 6 Travel distance 3.45 1.27 11.5 9.0 27.4 27.0 25.2 6 Family member concerns 3.34 1.21 9.2 13.1 33.6 22.5 21.6 8 Recommendation from others 3.03 1.07 10.1 15.7 44.5 20.4 9.2 9
Note. Judgment of importance was made on 5-point scale (1=Least important, 5=Most
important). M = Mean; SD = Standard Deviation.
The concern for safety and security was perceived as the most important
consideration (M = 4,36; SD =.87). Virtually sixty percent (57.1%) of the respondents
rated “safety and security concerns” as “most important.” Secondly, forty-three percent
(43.6%) of the respondents rated “convenience of transportation” as “most important.”
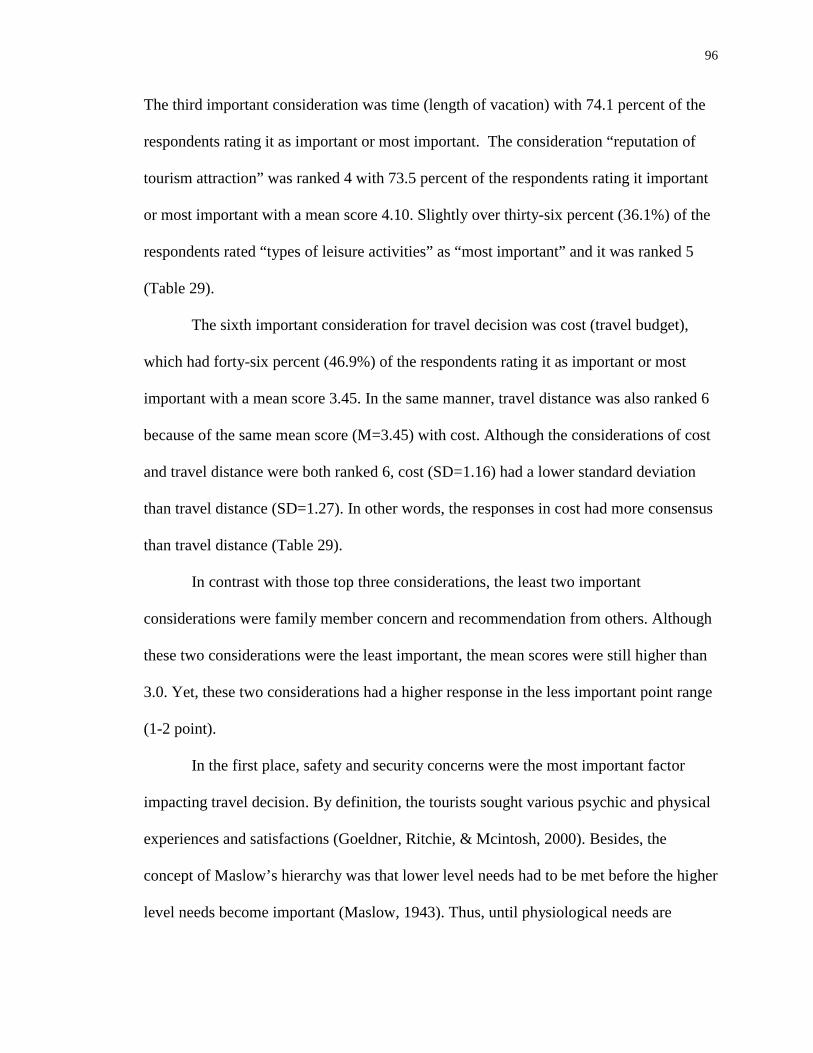
96
The third important consideration was time (length of vacation) with 74.1 percent of the
respondents rating it as important or most important. The consideration “reputation of
tourism attraction” was ranked 4 with 73.5 percent of the respondents rating it important
or most important with a mean score 4.10. Slightly over thirty-six percent (36.1%) of the
respondents rated “types of leisure activities” as “most important” and it was ranked 5
(Table 29).
The sixth important consideration for travel decision was cost (travel budget),
which had forty-six percent (46.9%) of the respondents rating it as important or most
important with a mean score 3.45. In the same manner, travel distance was also ranked 6
because of the same mean score (M=3.45) with cost. Although the considerations of cost
and travel distance were both ranked 6, cost (SD=1.16) had a lower standard deviation
than travel distance (SD=1.27). In other words, the responses in cost had more consensus
than travel distance (Table 29).
In contrast with those top three considerations, the least two important
considerations were family member concern and recommendation from others. Although
these two considerations were the least important, the mean scores were still higher than
3.0. Yet, these two considerations had a higher response in the less important point range
(1-2 point).
In the first place, safety and security concerns were the most important factor
impacting travel decision. By definition, the tourists sought various psychic and physical
experiences and satisfactions (Goeldner, Ritchie, & Mcintosh, 2000). Besides, the
concept of Maslow’s hierarchy was that lower level needs had to be met before the higher
level needs become important (Maslow, 1943). Thus, until physiological needs are
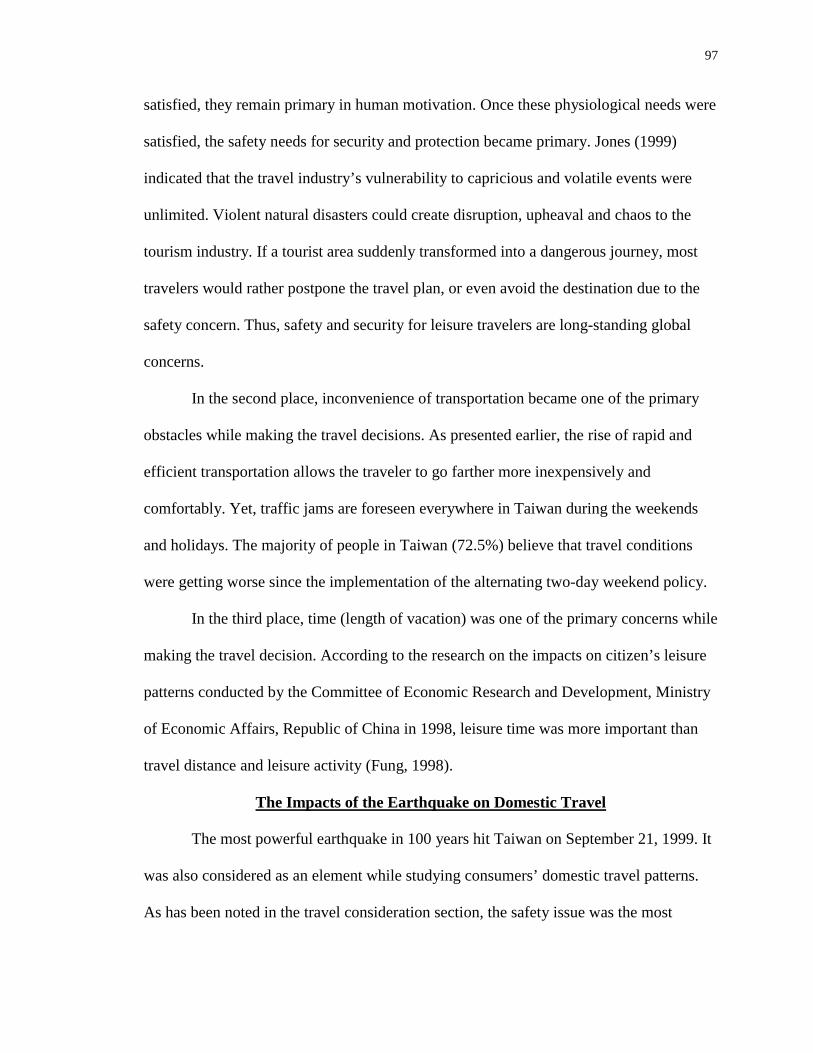
97
satisfied, they remain primary in human motivation. Once these physiological needs were
satisfied, the safety needs for security and protection became primary. Jones (1999)
indicated that the travel industry’s vulnerability to capricious and volatile events were
unlimited. Violent natural disasters could create disruption, upheaval and chaos to the
tourism industry. If a tourist area suddenly transformed into a dangerous journey, most
travelers would rather postpone the travel plan, or even avoid the destination due to the
safety concern. Thus, safety and security for leisure travelers are long-standing global
concerns.
In the second place, inconvenience of transportation became one of the primary
obstacles while making the travel decisions. As presented earlier, the rise of rapid and
efficient transportation allows the traveler to go farther more inexpensively and
comfortably. Yet, traffic jams are foreseen everywhere in Taiwan during the weekends
and holidays. The majority of people in Taiwan (72.5%) believe that travel conditions
were getting worse since the implementation of the alternating two-day weekend policy.
In the third place, time (length of vacation) was one of the primary concerns while
making the travel decision. According to the research on the impacts on citizen’s leisure
patterns conducted by the Committee of Economic Research and Development, Ministry
of Economic Affairs, Republic of China in 1998, leisure time was more important than
travel distance and leisure activity (Fung, 1998).
The Impacts of the Earthquake on Domestic Travel
The most powerful earthquake in 100 years hit Taiwan on September 21, 1999. It
was also considered as an element while studying consumers’ domestic travel patterns.
As has been noted in the travel consideration section, the safety issue was the most
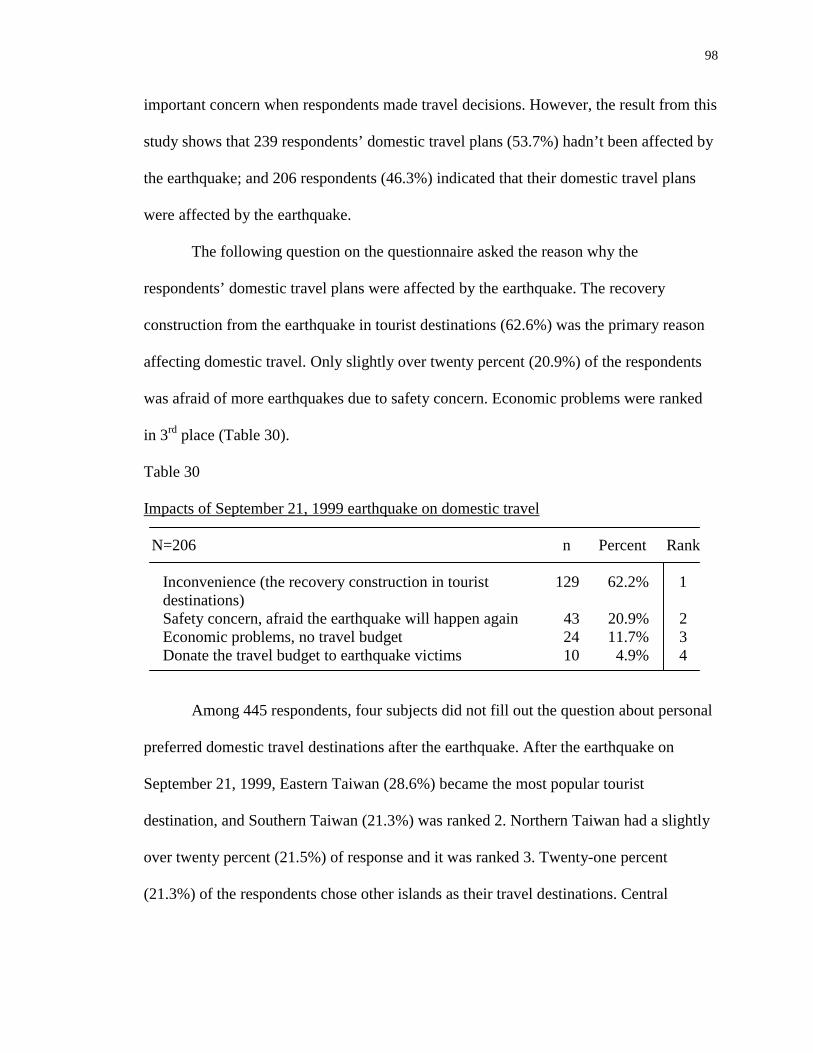
98
important concern when respondents made travel decisions. However, the result from this
study shows that 239 respondents’ domestic travel plans (53.7%) hadn’t been affected by
the earthquake; and 206 respondents (46.3%) indicated that their domestic travel plans
were affected by the earthquake.
The following question on the questionnaire asked the reason why the
respondents’ domestic travel plans were affected by the earthquake. The recovery
construction from the earthquake in tourist destinations (62.6%) was the primary reason
affecting domestic travel. Only slightly over twenty percent (20.9%) of the respondents
was afraid of more earthquakes due to safety concern. Economic problems were ranked
in 3rd place (Table 30).
Table 30
Impacts of September 21, 1999 earthquake on domestic travel
N=206 n Percent Rank
Inconvenience (the recovery construction in tourist destinations)
129 62.2% 1
Safety concern, afraid the earthquake will happen again 43 20.9% 2Economic problems, no travel budget 24 11.7% 3Donate the travel budget to earthquake victims 10 4.9% 4
Among 445 respondents, four subjects did not fill out the question about personal
preferred domestic travel destinations after the earthquake. After the earthquake on
September 21, 1999, Eastern Taiwan (28.6%) became the most popular tourist
destination, and Southern Taiwan (21.3%) was ranked 2. Northern Taiwan had a slightly
over twenty percent (21.5%) of response and it was ranked 3. Twenty-one percent
(21.3%) of the respondents chose other islands as their travel destinations. Central
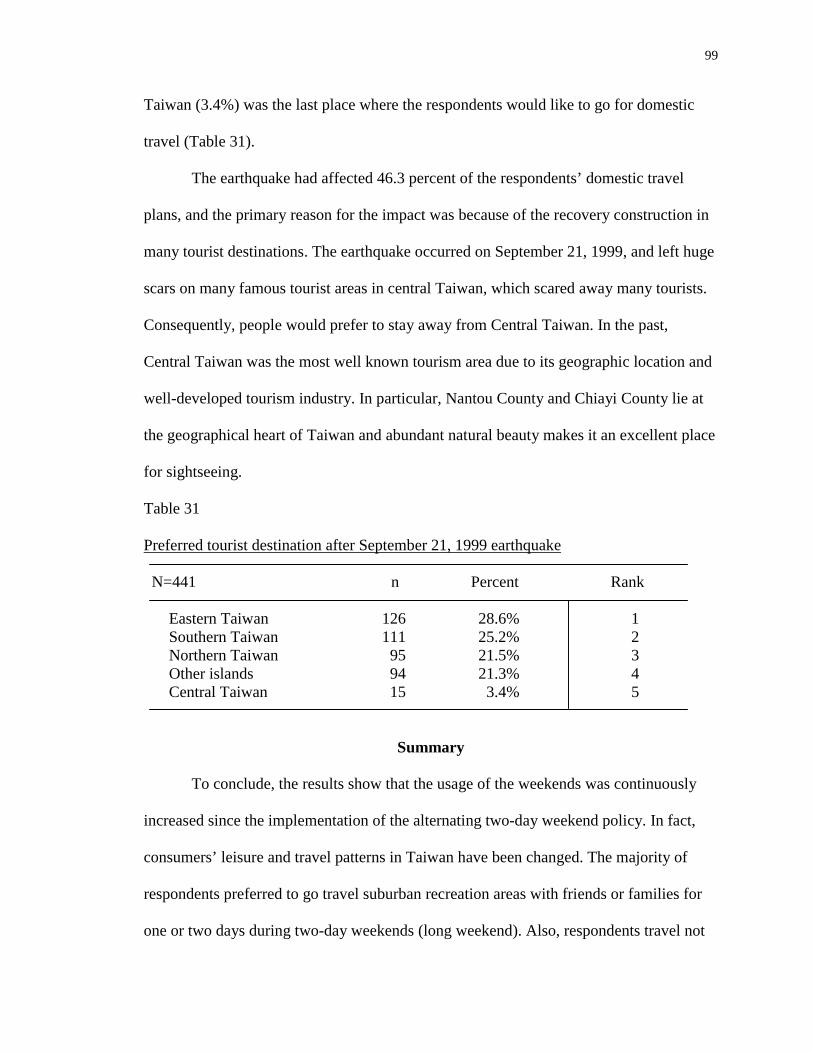
99
Taiwan (3.4%) was the last place where the respondents would like to go for domestic
travel (Table 31).
The earthquake had affected 46.3 percent of the respondents’ domestic travel
plans, and the primary reason for the impact was because of the recovery construction in
many tourist destinations. The earthquake occurred on September 21, 1999, and left huge
scars on many famous tourist areas in central Taiwan, which scared away many tourists.
Consequently, people would prefer to stay away from Central Taiwan. In the past,
Central Taiwan was the most well known tourism area due to its geographic location and
well-developed tourism industry. In particular, Nantou County and Chiayi County lie at
the geographical heart of Taiwan and abundant natural beauty makes it an excellent place
for sightseeing.
Table 31
Preferred tourist destination after September 21, 1999 earthquake
N=441 n Percent Rank
Eastern Taiwan Southern Taiwan Northern Taiwan Other islands Central Taiwan
126111959415
28.6% 25.2% 21.5% 21.3% 3.4%
1 2 3 4 5
Summary
To conclude, the results show that the usage of the weekends was continuously
increased since the implementation of the alternating two-day weekend policy. In fact,
consumers’ leisure and travel patterns in Taiwan have been changed. The majority of
respondents preferred to go travel suburban recreation areas with friends or families for
one or two days during two-day weekends (long weekend). Also, respondents travel not
100
for sightseeing and pleasure purpose anymore but for escaping from the ordinary. Instead
of following a group itinerary, scheduling personal travel plan become more popular.
However, travel jams and crowds kept many respondents away from domestic
travel. Thus, many respondents chose to stay close to home for fear of traffic and crowds.
Indeed, the majority of respondents frequently participated in leisure activities within the
normal living environment. Also, leisure activities with high social content with other
people are well liked in a large metropolitan area. Urban activities and more easily
accessible entertainment options seem to be on the way, including exercise. Safety and
security were the most important concerns for the travel decision. Yet, less than half of
the respondents were not affected by the earthquake. Although Central Taiwan was
replaced by Eastern Taiwan as the most popular travel destinations, the primary reason
was inconvenience due to the reconstruction.
Again, the purpose of this study is to identify the changes in consumer leisure
behavior based on the new weekend policy. This chapter brings together the results and
discussions regarding the data obtained from the responses of the questionnaire in
consumers’ leisure preferences, the changes on leisure patterns, the domestic travel
patterns, and the factors impacting consumers’ domestic travel decisions to accomplish
objectives two to four listed in chapter one. Furthermore, the results and findings have
been corroborated with the literature review and previous studies.
101
CHAPTER FIVE
SUMMARY, RECOMMEDATIONS, AND CONCLUSION
With the growth of leisure and travel in Taiwan, a study on the change of
consumer behavior is required to assist leisure and tourism managers in their decision-
making, and to provide marketing researchers with a theoretical base from which to
analyze. Accordingly, the purpose of this study was to analyze the changes in leisure
patterns as well as the domestic travel patterns in Taiwan based on the alternating two-
day weekend policy. This chapter provides a summary, recommendations for
government, tourism and leisure providers (the industry), further research, and
conclusions.
Summary
This study was designed to identify the changes in consumers’ leisure behavior as
it linked to leisure patterns in Taiwan. Consumers of 12 pre-selected travel agencies in
Taipei participated in this study by completing a questionnaire on leisure and travel. A
total of 570 questionnaires were distributed to the consumers who came to the travel
agency requesting a group tour, airline ticket, overnight accommodation or other travel
information from July 1 to August 18, 2000 in Taipei. Among 570 questionnaires, 445
completed and valid questionnaires were returned for a 78.1 percent response rate.
Responses from the questionnaires were tabulated by the Statistic Package of the Social
Sciences (SPSS) and analyzed.
Slightly over sixty percent of the sample population was female and mostly single
with at least a high school or technical school degree. One-third of the total respondents
were office workers, clerks, or secretaries, and the majority of respondents (69.7%) had
102
monthly personal income from NT $20,000 to NT $49,999. Further, over fifty percent of
respondents’ company or school had the alternating two-day weekend policy.
The objectives listed in chapter one were achieved based on the results and
findings regarding the data obtained from responses to the questionnaire. Generally,
leisure activities involved with high social context were the most popular leisure
activities in this study. Indeed, people tend to link up with others by participating in
group activities based on their interests. Moreover, this type of leisure activity encourages
close relationships endorsed by active participation and shared experiences in a large
metropolitan area. Meanwhile, a variety of recreational activities provided by electronic
equipment and facilities in most of the modern homes in the urban area have led the
majority of respondents favoring some leisure activities taking place about the home.
Slightly over twenty percent of the respondents indicated that their leisure preferences
were travel-related activities due to the increasing availability of discretionary time and
money, and with the urge to escape from the country’s spreading urban-industrial
environment.
Objective two of this study was to identify the effects of the alternating two-day
weekend policy in leisure patterns. Both time killing leisure activities and entertainment
had over fifty percent increase, more than other types of leisure activities. Furthermore,
these two types of leisure activities had become more intensive since the implementation
of the alternating two-day weekend policy. Conversely, the increasing rate for both
domestic travel and outdoor leisure activities in this study were lower than 1998.
Objective three was to analyze changes in type, purpose, leisure area, length of
trip, and day of week of domestic travel patterns. The long weekend (two day weekend)
103
was the most popular day for domestic travel. In fact, the usage of the weekend for
domestic travel had increased since the implementation of the new weekend policy.
Moreover, leisure activity within city or regional leisure areas was the primary leisure
patterns. Instead of sightseeing and pleasure purposes, escaping from the ordinary or
relaxation had been converted into the main purpose for domestic travel. Travel with
friends on a self-planned tour was the most common travel type in Taipei. Long length
trips (more than two day) had been replaced by short length trips (one or two day trips)
because of the new weekend policy.
Objective four of this study was to determine the factors impacting travel
decisions based on the new weekend policy. In general, time, transportation, and safety
were the three important factors impacting the travel decisions. The alternating two-day
weekend policy added an extra half-day off onto the regular weekend break, which has
enlarged the elasticity of leisure activity. The scope for leisure activity even expands
farther than the normal living environment. Nevertheless, traffic jams ruin people’s mood
to enjoy their leisure time. Thus, many people stick close to home for fear of traffic
problems. Instead, people frequently involve themselves in certain types of leisure
activities taking place about the home or within their normal living environment. Urban
activities and more easily accessible entertainment options seem to be on the way,
including exercise. Also, leisure activities with high social content with other people are
well liked in a large metropolitan area like Taipei.
Also, safety or security concerns was the number one consideration while making
domestic travel decisions. Disturbance and chaos by artificial violence or natural disasters
suddenly transformed a tourist area into a dangerous journey. Most travelers would rather
104
postpone travel, or even avoid those destinations due to the safety concern. Nevertheless,
this might not be the true reason preventing urban people from visiting those tourist
destinations. In fact, since leisure travel was not as popular as other leisure activities for
urban people, the earthquake had not really affected their domestic travel plans.
Conversely, many urban people chose not to travel to certain tourist areas because of the
recovery construction from the earthquake.
In addition, the earthquake on September 21, 1999 has caused people to alter their
travel plans because of the recovery construction in certain tourism destinations. Thus,
Eastern Taiwan replaced Central Taiwan as the place having the most popular travel
destinations.
Recommendations
This study was based on consumer perceptions in Taiwan. Based on the analysis
of data and review of literature, some recommendations can be made to the government
in Taiwan, tourism and leisure providers, and for future study.
Recommendations for the Government in Taiwan
1. Traffic jam was the number one barrier preventing people from travel. The majority
of people feel that traffic conditions are getting worse since the implementation of the
alternating weekend policy. Thus, coordination of the public transportation system is
extremely important for promoting domestic travel on the alternating two-day
weekends.
2. Instead of spending time and money on building leisure facilities by the government
itself, the government should encourage private investment in leisure facilities to
overcome the weakness in leisure supply.
105
3. Because of the post-quake rescue operations that were undertaken, most people
preferred to change their travel plans to other tourist destinations. The result in this
study showed that people ignored those disaster areas because they felt inconvenience
due to the reconstruction. Thus, the promotion in major media should be strengthened
while accelerating reconstruction of tourist facilities in disaster areas.
4. Weekday travel should be promoted in order to balance the usage of various leisure
resources, and to avoid heavy traffic and crowds in tourist destinations or recreation
areas during long weekends.
Recommendations for the Leisure and Tourism Providers (The Industry)
1. The leisure and travel patterns have been changed since the implementation of the
alternating two-day weekend policy. Thus, tourism and leisure providers should be
aware of the changes on leisure and tourism markets.
2. The alternating two-day weekend policy has brought positive impacts on motivating
consumer demands for more leisure and travel. Further, the implementation of the
five-day workweek in 2001will be another stimulant for the market. Leisure and
travel related products and services should be improved and developed in order to
meet consumers’ wants and needs.
3. The majority of people go on the road at the same time, which has caused the
recreation areas to be exceptionally crowded. In particular, traffic gets worse on
holidays and long weekends. Most of the leisure and travel facilities are full of
complaints of poor service quality or service delay. In order to improve service
quality, tourism and leisure providers could endorse the weekday travel combining
with discounts or others promotions.
106
Recommendations for Future Study
1. This study was based on consumer perceptions of the alternating two-day weekend
policy, which could only provide the side of demands. The perceptions from the
government and tourism providers were not included in this study. Therefore, future
study can be conducted for both demand and supply.
2. Because the survey was conducted through travel agencies the leisure behavior from
those people who did not require assistance from a travel agency or who did not
actually travel would not be included in this study. For the future study, the survey
could be conducted by directing contact with consumers.
3. Since the five-day workweek policy will be implemented in January 2001, follow-up
research on the consumer leisure behavior reflecting the new policy could be
conducted.
4. A comparison study on the impacts of the weekend policy between Japan and Taiwan
could be conducted in the future to see if there is any difference between new holiday
policies across culture.
Conclusion
In recent years, due to rapid economic transformation, Taiwan has become a busy
and tense industrial and commercial society. Taipei City is the national capital that
possesses the most prosperous metropolitan style. It is also the place for the busiest life.
Every day, the crowded citizens have to face layers and layers of cement forest, busy and
obstructed traffic flow, smoky and dirty air and gray sky. Very often people want to run
away from the ordinary life. Under this trend of demand for the return to pasture, leisure,
recreation and travel start to prosper. The alternating two-day weekend has provided
107
people with more leisure time for a variety of leisure activities. The usage of the weekend
is essentially increased in intensity since the implementation of the alternating two-day
weekend policy. In fact, consumers’ leisure and travel patterns in Taiwan have been
changed since the implementation of the alternating two-day weekend policy. Indeed, the
alternating two-day weekend policy has promoted leisure and travel market in Taiwan.
People are willing to spend more time on leisure activities.
However, the development of the supporting facilities for leisure activities are not
fast enough with the law making processes in Taiwan. Indeed, the concentrated
population density and the total land usage in Taiwan somehow limit the development of
leisure facilities. Besides, most of the people in Taiwan overly focus on the long weekend
for their leisure activities because of the implementation of the new weekend policy. In
fact, both the government and the tourism providers largely promote the long weekend,
which has misled the general population in Taiwan. Under this circumstance, the
supporting leisure facilities will never be able to meet the demands by the people in
Taiwan.
Moreover, the five-day workweek policy has already been passed and will soon
be implemented in the following year, a solution for all the problems occurred by the
alternating two-day weekend policy has emerged. No doubt, more leisure related
facilities are considered necessary and requested by the people in Taiwan. The
government and the industry are definitely needed to work on the development of the
leisure related facilities. Yet, consumers' leisure consumptions should also be modified to
fit the new weekend policy. Thus, not only the facility improvement, but also the
108
adjustment of consumers’ leisure behavior toward the new weekend policy will be
desired to enhance leisure life quality in Taiwan.
109
REFERENCES
Allport, G. H. (1954). Nature of prejudice, reading. MA: Addison-Wesley.
Baud-Bovy, M., & Lawson, F. (1998). Tourism and Recreation: Handbook of
Planning and Design. Oxford: Architechural Press.
Boniface, B. G., & Cooper, C. (1994). The geography of travel & industry (2nd
ed.). Jordan Hill, Oxford: Butterworth-Heinemann.
Braden, D. R. (1988). Leisure and Entertainment in America. MI: Henry Ford
Museum & Greenfield Village.
Brightbill, C. K. (1963). The challenge of leisure. New York: Prentice Hall.
Cassidy, T. (1996). All work and no play: A focus on leisure time as a means for
promoting health. Counseling Psychology Quarterly, 9 (1), 77-90.
Chen, J. (1999). Disaster strike. Sinorama, 24 (11), 6-19.
Cheng, Y. (1997, October). The implementation of the alternating two-day
weekend policy and its’ impact. Chinese Labor, 973, 6-9.
Cheng, Y. J. (1998, February). Two-day weekend change citizen’s life and
industry. Labor Problem, 977, 6-9.
Clawson, M. (1960). The Dynamics of park demand. New York: Regional Plan
Association, Inc.
Clawson, M. (1964). How much Leisure, Now and in the Future? In J. C.
Charlesworth. (Eds.). Leisure in America: blessing or curse? American Academy of
Political and Social Science.
110
Cohen, S. (1978). Environmental load and the allocation of attention. In A. Baum,
J. E. Singer, & S. Valins. (Eds.). Advances in environmental psychology: Vol. 1.
Hillsdale, NJ: Lawrence Erlbaum.
Committee of Economic Research and Development, Ministry of Economic
Affairs. R. O. C. (1991). Report on R.O.C outdoor leisure policy. Taipei, Taiwan:
Author.
Committee of Economic Research and Development, Ministry of Economic
Affairs. R. O. C. (1998). Research on the impacts on citizen’s leisure pattern. Taipei,
Taiwan: Author.
Crawford, D. W., & Godbey, G. (1987). Reconceptualizing barriers to family
leisure, Leisure Science, 9 (2), 119-127.
Crossley, J. C., & Jamieson, L. M. (1993). Introduction to commercial and
entrepreneurial recreation (2nd ed.). Champaign, Ill.: Sagamore Publishing.
Davis, C. (1990). Emerging Markets: Getaway and business/pleasure travel. In
Alberta tourism outlook conference proceedings, Calgary: Canadian Tourism Research
Institute.
Decrop, A. (1999). Tourists’ decision-making and behavior processes. In A.
Pizam & Y. Mansfeld (Eds.), Consumer behavior in travel and tourism. (pp. 335-365).
New York: The Haworth Hospitality Press.
Department of Statistics, Ministry of Transportation and Communication. (1999).
Research on how the alternating two-day weekend policy impacts citizens’ domestic
travel activities. Taipei, Taiwan: Author.
Dictionary of sociology. (1944). New York: Philosophical Library.
111
Farrel, B. H., & Runyan, D. (1991). Ecology and tourism. Annual of Tourism
Research, 18 (1), 26-40.
Five-day workweek passes in final legislative drive. (2000, July 1). The China
Post, p. 1.
Fung, W. H. (1998 Spring). The alternating two-day weekend policy, business
chance for leisure tourism industry. Yuanta Investment Research. 80-85.
Gartner, W. C. (1996). Tourism development: principles, processes, and policies.
New York: Van Nostrand Reinhold.
Gee, C. Y., Makens, J. C., & Choy, D. J. L. (1997). The travel industry (3rd ed.).
New York: Van Nostrand Reinhold.
Gnoth, J. (1999). Tourism expectation formation: The case of Camper-Van tourist
in New Zealand. In A. Pizam & Y. Mansfeld (Eds.), Consumer behavior in travel and
tourism. (pp. 245-266). New York: The Haworth Hospitality Press.
Godbey, G. (1999). Leisure in your life: An exploration. (5th ed.). State College,
PA: Venture Publishing.
Goeldner, C. R., Ritchie, R. B. Jr., & McIntosh, R. W. (2000). Tourism principles,
practices, philosophies (8th ed.). New York: John Wiley & Sons.
Hamermesh, D. S. (1998). When we work. American Economic Aspects, 88 (2),
321-325.
Howell, D. W. (1992). Passport: An introduction to the travel and tourism
industry (2nd ed.). Cincinnati: South-Western Publishing.
Hsiao, S. H. (1991 April). Observation on leisure, ecotourism and other social
sciences. Friends of Labor, 484, 6-9.
112
Hsieh, S. (1998). Weekend shuffle: The two-day weekend hits the streets in
Taiwan. Sinorama, 23 (5), 6-17.
Huang, T. S. (1990, August). The discussion on five work days per week.
Personnel and Administration, 94, 30-37.
Huang, T. (1996). Plan for two-day weekend policy. Monthly Report of Civil
Servant, Republic of China, 6, 50-58.
Hudson, S. (1999). Consumer behavior related to tourism. In A. Pizam & Y.
Mansfeld (Eds.), Consumer behavior in travel and tourism. (pp. 7-32). New York: The
Haworth Hospitality Press.
Jafari, J. (Eds.). (2000). Encyclopedia of tourism. NY: Routoledge.
Jones, C. B. (1999). Tourism Impacts of Los Angeles Civil Disturbances.
[Online]. < http://eye.hooked.net/erasf/PAPERS/la_riots.html> [1999, November 24].
Kando, T. M. (1975). Leisure and popular culture in transition. St. Louis: The C.
V. Mosby Company.
Kaplan, M. (1960). Leisure in America: a social inquiry. New York: John Wiley
& Sons.
Kay, T., & Jackson, G. (1991). Leisure despite constraint: The impact of leisure
constraints on leisure participation. Journal of Leisure Research, 23 (4), 301-313.
Kelly, J. R., & Godbey, G. (1992). The sociology of leisure. State College, PA:
Venture Publishing.
Krippendorf, J. (1987). The holidaymakers. London: Heinemann.
Lange, W. D. (1986). Control of working time: attuning working time to
organization or individual needs. Labour and Society, 2 (1), 98-105.
113
Lao, S. K. (1998). Lao Ssu-Kuang on leisure. Sinorama, 23 (5), 32-37.
Laws, E. (1995). Tourist destination management. New York: Routledge.
Lewis, R. C., Chambers, R. E., & Chacko, H. E. (1995). Marketing leadership in
hospitality (2nd ed.). New York: Van Nostrand Reinhold.
Liptak, J. J. (1991). Leisure counseling: an antidote for the “living death.” Journal
of Employment Counseling, 28, 115-120.
Lumsdon, L. (1997). Tourism marketing. Boston, MA: International Thomson
Business Press.
MacKay, K. J., & Fesenmaier D. R. (1998). A process approach to segmenting the
getaway travel market. Journal of Travel & Tourism Marketing, 7 (3), 1-17.
Maslow, S. H. (1943).
Mayo, E. J., & Jarvis, L. (1981). The psychology of leisure travel: effective a
theory of human motivation. Psychological Review. 50, 370-396.
McIntosh, R. W., Goeldner, C. R., & Rtchie, R. B. Jr. (1995). Tourism: principles,
practices, philosophies. (7th ed.). New York: John Wiley & Sons, Inc.
McIntosh, R. W., Goeldner, C. R., & Rtchie, R. B. Jr. (2000). Tourism: principles,
practices, philosophies. (8th ed.). New York: John Wiley & Sons, Inc.
Mieczkowski, Z. (1990). World trends in tourism and recreation. New York: Peter
Lang Publishing, Inc.
Ministry of the Interior, Republic of China (1999). Statistical abstract of Taipei
city. Taipei, Taiwan: Author.
Mowen, J. C. (1990). Consumer behavior (2nd ed.). New York: Macmillan
Publishing Company.
114
Murphy, P. E. (1985). Tourism: A community approach. New York: Methuen.
Neulinger, J. (1974). The psychology of leisure. Springfield, IL: Chas. C Thomas.
Outdoor Recreation Resources Review Commission. (1962). The future of
outdoor recreation in metropolitan regions in the United States. Washington D.C.: U.S.
Government Printing Office.
Paffenbarger, R. S. Jr., Hyde, R. T., & Dow, A. (1991). Health benefits of
physical activity. In B. L. Driver, P. J. Brown, & G. L. Peterson (Eds.), Benefits of
leisure. (pp. 49-57). State College, PA: Venture Publishing, Inc.
Pan, L. (1997). The analysis of two-day weekend policy implementation in Japan.
Monthly Report of Civil Servant, Republic of China, 8, 47-54.
Parker, S. (1971). The future of work and leisure. New York: Praeger Publishers.
Pearce, P. L. (1982). The social psychology of tourist behavior. New York:
Pegamon Press, Inc.
Plog, S. C. (1987). Developing and using psychographics in tourism research. In
J. R. B. Ritchie, & C. R. Goeldner (Eds.), Travel, tourism and hospitality research: a
handbook for managers and researchers (pp. 209-218). New York: John Wiley & Sons.
Plog, S. C. (1991). Leisure travel: Making it a growth market – again. New York:
Wiley.
Rinzler, J., & Arena, C. (1996, December 9). Matters of time. Brandweek, 43
(47), 19-21.
Robinson, J. (1977). How Americans use time. New York: Holt, Rinehart and
Winston.
Schmoll, G. A. (1977). Tourism promotion. London: Tourism International Press.
115
Smith, S. L. Jr. (1990). Dictionary of concepts in recreation and leisure studies.
New York: Greenwood Press.
Smith, S. L. Jr., & Godbey, G. C. (1991). Leisure, recreation and tourism. Annals
of Tourism Research, 18 (1), 85-100.
Sussmann, S., & Űnel, A. (1999). Destination image and its modification after
travel: An empirical study on Turkey. In A. Pizam & Y. Mansfeld (Eds.), Consumer
behavior in travel and tourism. (pp. 207-226). New York: The Haworth Hospitality Press.
Tang, H. B. (1989). Introduction to tourism. Taipei, Taiwan: Hao-Fung.
Taipei. [Online]. Taipei City Government. <http://www.taipei.gov.tw/>
[2000, Nov. 1].
The Republic of China Yearbook. [Online]. Government Information Office.
<http://www.gio.gov.tw/info/book2000/> [2000, Nov. 1].
Tourism Bureau, Ministry of Transportation and Communications. (1997). Report
on the 1997 R.O.C domestic tourism survey. (ISBN 957-02-2000-7). Taipei, Taiwan:
Taiwan Government Printing Office.
Tourism Bureau, Ministry of Transportation and Communications. (1997).
Annual report on tourism 1997, Republic of China. (ISBN 957-02-1987-4). Taipei,
Taiwan: Taiwan Government Printing Office.
Tourism Bureau, Ministry of Transportation and Communications, R.O.C (1998).
Report on how the alternating two-day weekend policy impacts citizens’ domestic travel
activities. Taipei, Taiwan: Author.
116
Ulrich, R. S., Dimberg, U., & Driver, B. L. (1991). Psychophysiological
indicators of leisure benefits. In B. L. Driver, P. J. Brown & G. L. Peterson (Eds.),
Benefits of leisure. (pp. 73-89) State College, PA: Venture Publishing, Inc.
Wang, F. (1990). Two-day weekend policy in Japan. Japan Research, 306, 38-41.
Wang, J. (1998). In search of the great leisure seeker. Sinorama, 23 (5), 18-31.
Webster’s new collegiate dictionary. (1976). Springfield, Mass: G. & C. Meriam.
World Tourism Organization & World Meteorological Organization. (1998).
Handbook on natural disaster reduction in tourist areas. Madrid, Spain.
Yang, C. K. (1998). The framework of high quality leisure. Human Resources
Development, 48, 12-19.
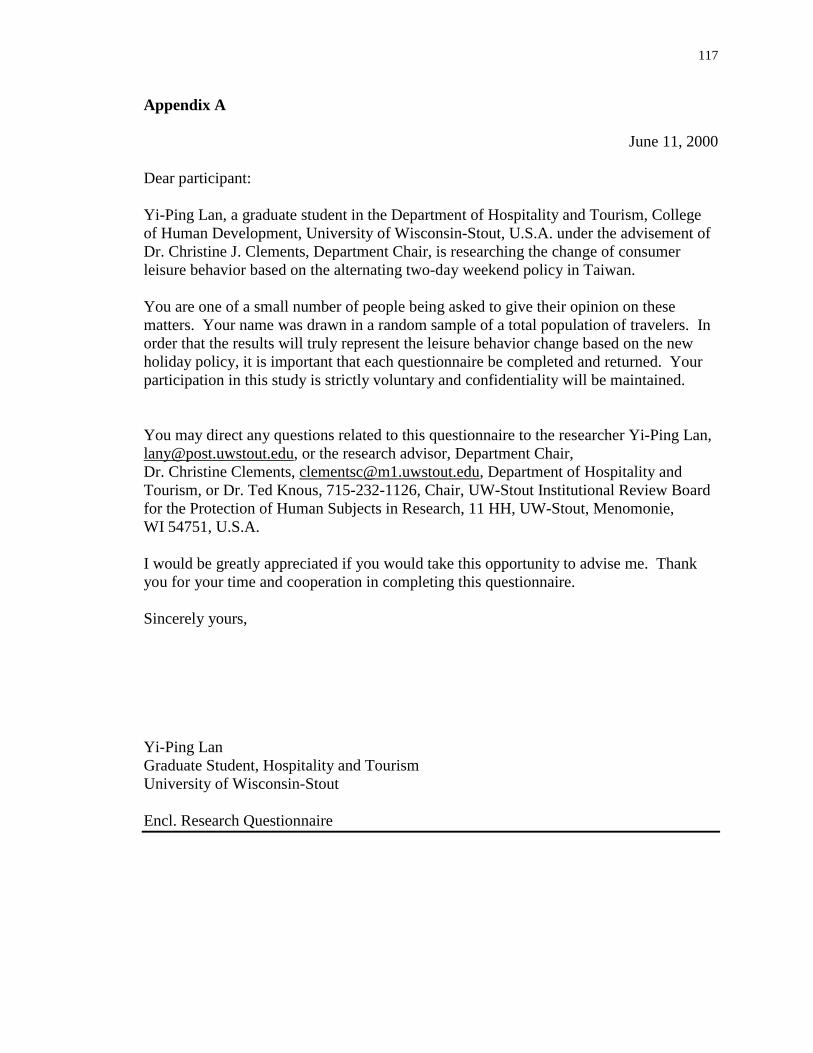
117
Appendix A
June 11, 2000 Dear participant: Yi-Ping Lan, a graduate student in the Department of Hospitality and Tourism, College of Human Development, University of Wisconsin-Stout, U.S.A. under the advisement of Dr. Christine J. Clements, Department Chair, is researching the change of consumer leisure behavior based on the alternating two-day weekend policy in Taiwan. You are one of a small number of people being asked to give their opinion on these matters. Your name was drawn in a random sample of a total population of travelers. In order that the results will truly represent the leisure behavior change based on the new holiday policy, it is important that each questionnaire be completed and returned. Your participation in this study is strictly voluntary and confidentiality will be maintained.
You may direct any questions related to this questionnaire to the researcher Yi-Ping Lan, [email protected], or the research advisor, Department Chair, Dr. Christine Clements, [email protected], Department of Hospitality and Tourism, or Dr. Ted Knous, 715-232-1126, Chair, UW-Stout Institutional Review Board for the Protection of Human Subjects in Research, 11 HH, UW-Stout, Menomonie, WI 54751, U.S.A. I would be greatly appreciated if you would take this opportunity to advise me. Thank you for your time and cooperation in completing this questionnaire. Sincerely yours,
Yi-Ping Lan Graduate Student, Hospitality and Tourism University of Wisconsin-Stout Encl. Research Questionnaire
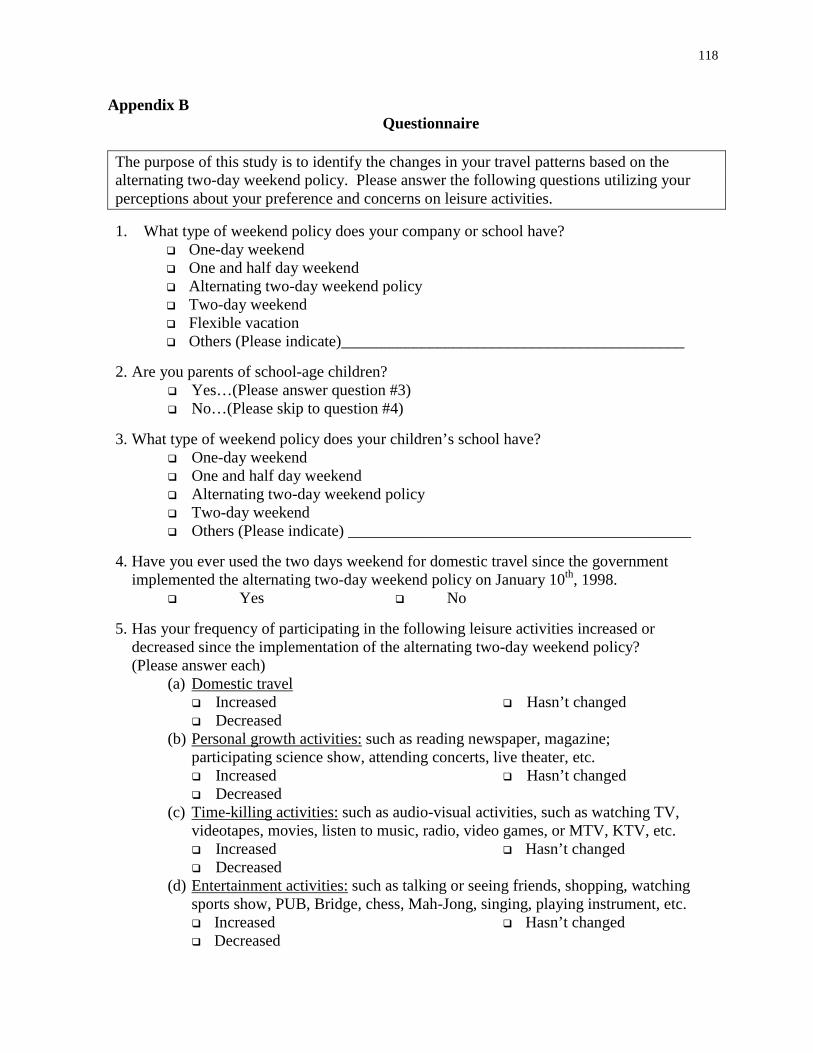
118
Appendix B Questionnaire
The purpose of this study is to identify the changes in your travel patterns based on the alternating two-day weekend policy. Please answer the following questions utilizing your perceptions about your preference and concerns on leisure activities.
1. What type of weekend policy does your company or school have?
$ One-day weekend $ One and half day weekend $ Alternating two-day weekend policy $ Two-day weekend $ Flexible vacation $ Others (Please indicate)___________________________________________
2. Are you parents of school-age children?
$ Yes…(Please answer question #3) $ No…(Please skip to question #4)
3. What type of weekend policy does your children’s school have?
$ One-day weekend $ One and half day weekend $ Alternating two-day weekend policy $ Two-day weekend $ Others (Please indicate) ___________________________________________
4. Have you ever used the two days weekend for domestic travel since the government
implemented the alternating two-day weekend policy on January 10th, 1998. $ Yes $ No
5. Has your frequency of participating in the following leisure activities increased or
decreased since the implementation of the alternating two-day weekend policy? (Please answer each)
(a) Domestic travel $ Increased $ Decreased
$ Hasn’t changed
(b) Personal growth activities: such as reading newspaper, magazine; participating science show, attending concerts, live theater, etc. $ Increased $ Decreased
$ Hasn’t changed
(c) Time-killing activities: such as audio-visual activities, such as watching TV, videotapes, movies, listen to music, radio, video games, or MTV, KTV, etc. $ Increased $ Decreased
$ Hasn’t changed
(d) Entertainment activities: such as talking or seeing friends, shopping, watching sports show, PUB, Bridge, chess, Mah-Jong, singing, playing instrument, etc. $ Increased $ Decreased
$ Hasn’t changed
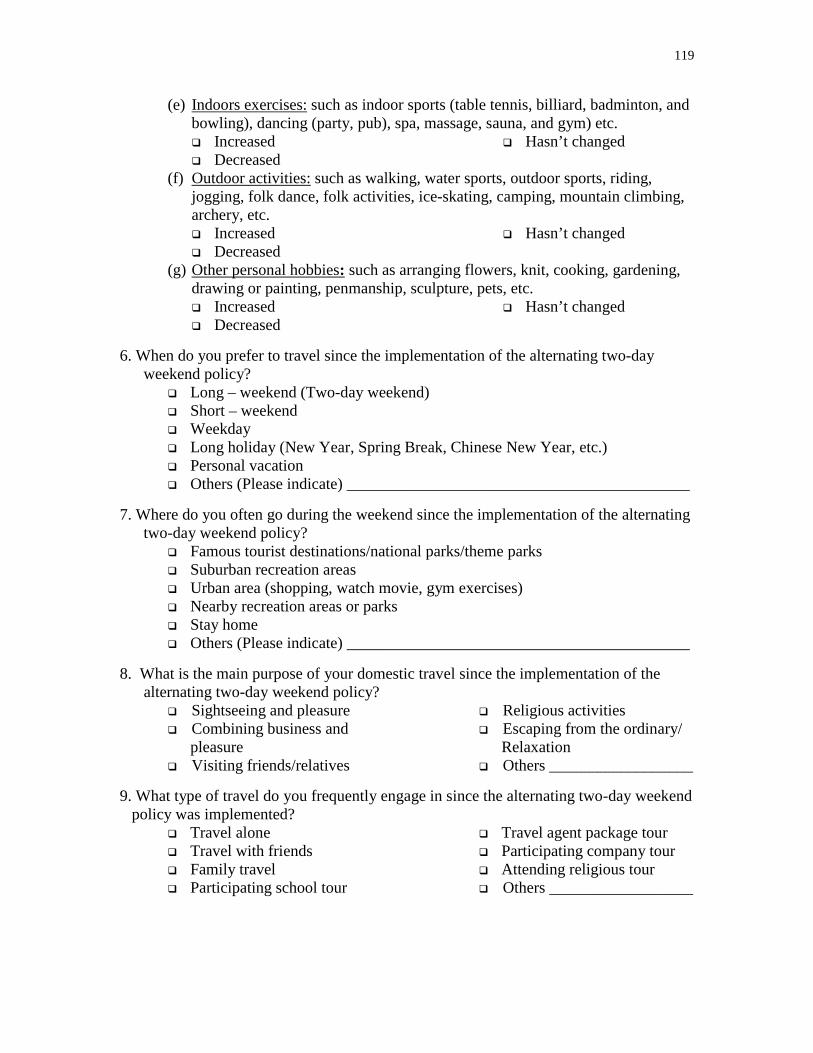
119
(e) Indoors exercises: such as indoor sports (table tennis, billiard, badminton, and bowling), dancing (party, pub), spa, massage, sauna, and gym) etc. $ Increased $ Decreased
$ Hasn’t changed
(f) Outdoor activities: such as walking, water sports, outdoor sports, riding, jogging, folk dance, folk activities, ice-skating, camping, mountain climbing, archery, etc. $ Increased $ Decreased
$ Hasn’t changed
(g) Other personal hobbies: such as arranging flowers, knit, cooking, gardening, drawing or painting, penmanship, sculpture, pets, etc. $ Increased $ Decreased
$ Hasn’t changed
6. When do you prefer to travel since the implementation of the alternating two-day
weekend policy? $ Long – weekend (Two-day weekend) $ Short – weekend $ Weekday $ Long holiday (New Year, Spring Break, Chinese New Year, etc.) $ Personal vacation $ Others (Please indicate) ___________________________________________
7. Where do you often go during the weekend since the implementation of the alternating
two-day weekend policy? $ Famous tourist destinations/national parks/theme parks $ Suburban recreation areas $ Urban area (shopping, watch movie, gym exercises) $ Nearby recreation areas or parks $ Stay home $ Others (Please indicate) ___________________________________________
8. What is the main purpose of your domestic travel since the implementation of the
alternating two-day weekend policy?$ Sightseeing and pleasure $ Combining business and
pleasure $ Visiting friends/relatives
$ Religious activities $ Escaping from the ordinary/
Relaxation $ Others __________________
9. What type of travel do you frequently engage in since the alternating two-day weekend
policy was implemented? $ Travel alone $ Travel with friends $ Family travel $ Participating school tour
$ Travel agent package tour $ Participating company tour $ Attending religious tour $ Others __________________
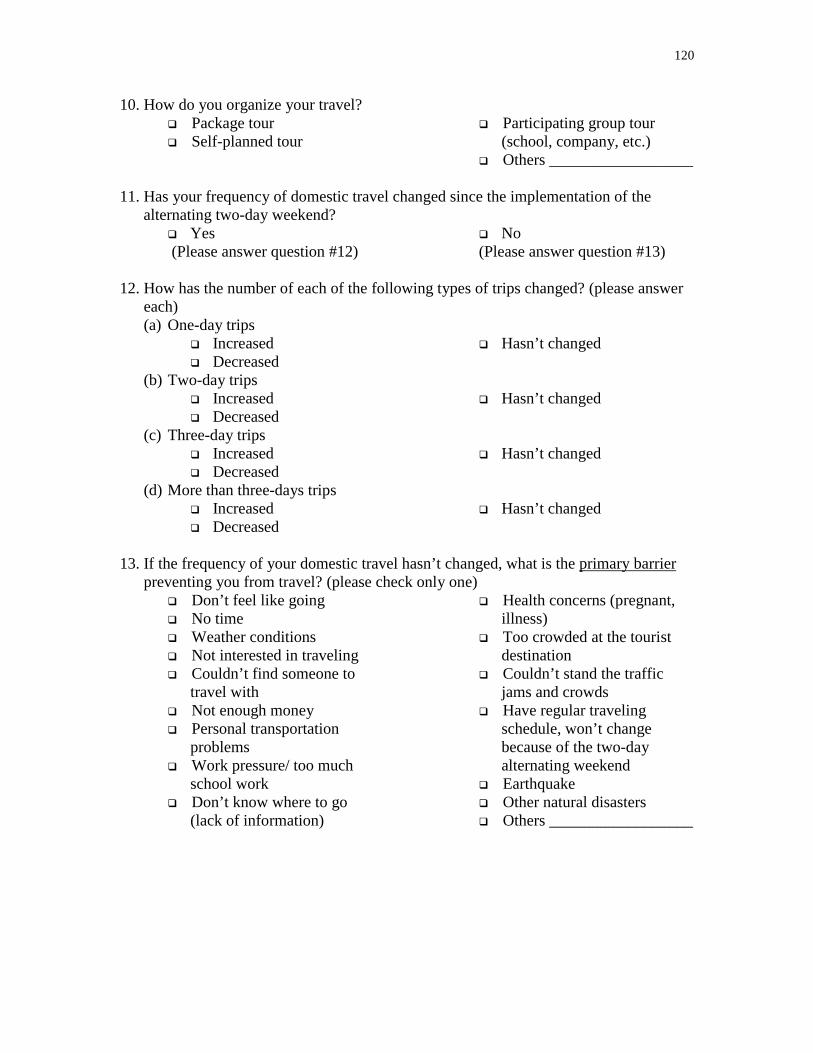
120
10. How do you organize your travel? $ Package tour $ Self-planned tour
$ Participating group tour (school, company, etc.)
$ Others __________________ 11. Has your frequency of domestic travel changed since the implementation of the
alternating two-day weekend? $ Yes (Please answer question #12)
$ No (Please answer question #13)
12. How has the number of each of the following types of trips changed? (please answer
each) (a) One-day trips
$ Increased $ Decreased
$ Hasn’t changed
(b) Two-day trips $ Increased $ Decreased
$ Hasn’t changed
(c) Three-day trips$ Increased $ Decreased
$ Hasn’t changed
(d) More than three-days trips$ Increased $ Decreased
$ Hasn’t changed
13. If the frequency of your domestic travel hasn’t changed, what is the primary barrier
preventing you from travel? (please check only one) $ Don’t feel like going $ No time $ Weather conditions $ Not interested in traveling $ Couldn’t find someone to
travel with $ Not enough money $ Personal transportation
problems $ Work pressure/ too much
school work $ Don’t know where to go
(lack of information)
$ Health concerns (pregnant, illness)
$ Too crowded at the tourist destination
$ Couldn’t stand the traffic jams and crowds
$ Have regular traveling schedule, won’t change because of the two-day alternating weekend
$ Earthquake $ Other natural disasters $ Others __________________
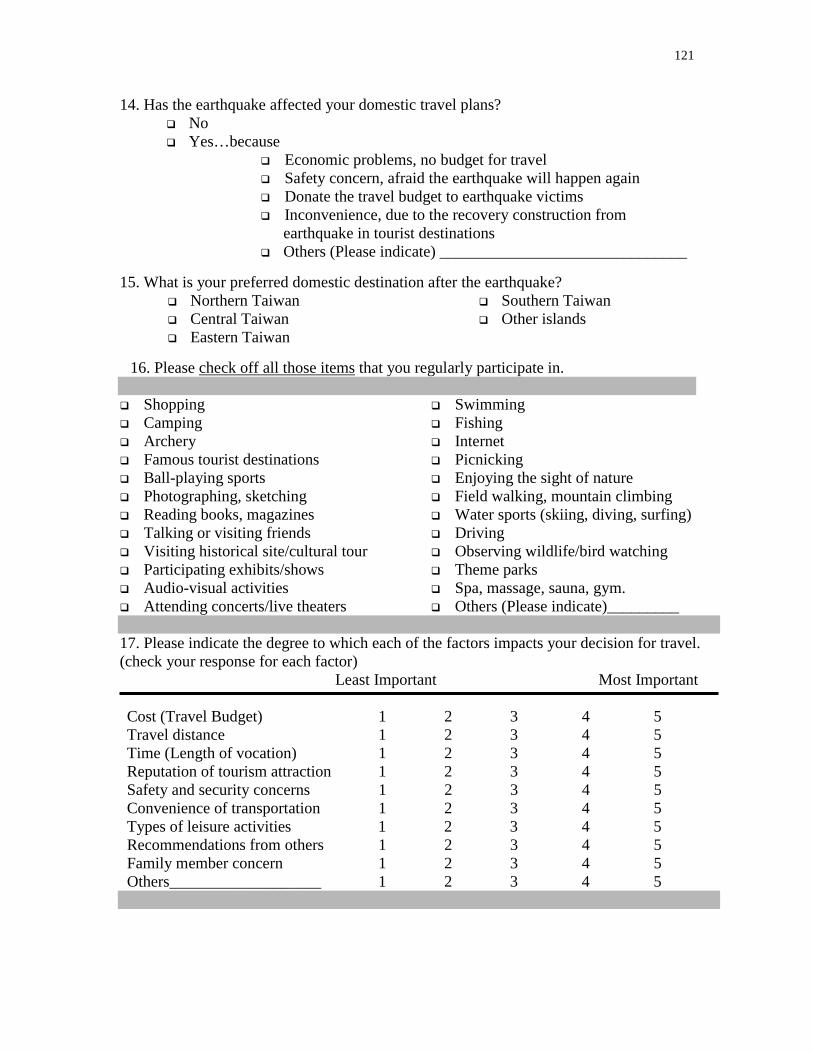
121
14. Has the earthquake affected your domestic travel plans? $ No $ Yes…because
$ Economic problems, no budget for travel $ Safety concern, afraid the earthquake will happen again $ Donate the travel budget to earthquake victims $ Inconvenience, due to the recovery construction from
earthquake in tourist destinations $ Others (Please indicate) _______________________________
15. What is your preferred domestic destination after the earthquake?
$ Northern Taiwan $ Central Taiwan $ Eastern Taiwan
$ Southern Taiwan $ Other islands
16. Please check off all those items that you regularly participate in.
$ Shopping $ Camping $ Archery $ Famous tourist destinations $ Ball-playing sports $ Photographing, sketching $ Reading books, magazines $ Talking or visiting friends $ Visiting historical site/cultural tour $ Participating exhibits/shows $ Audio-visual activities $ Attending concerts/live theaters
$ Swimming $ Fishing $ Internet $ Picnicking $ Enjoying the sight of nature $ Field walking, mountain climbing $ Water sports (skiing, diving, surfing) $ Driving $ Observing wildlife/bird watching $ Theme parks $ Spa, massage, sauna, gym. $ Others (Please indicate)_________
17. Please indicate the degree to which each of the factors impacts your decision for travel. (check your response for each factor)
Least Important Most Important Cost (Travel Budget) 1 2 3 4 5 Travel distance 1 2 3 4 5 Time (Length of vocation) 1 2 3 4 5 Reputation of tourism attraction 1 2 3 4 5 Safety and security concerns 1 2 3 4 5 Convenience of transportation 1 2 3 4 5 Types of leisure activities 1 2 3 4 5 Recommendations from others 1 2 3 4 5 Family member concern 1 2 3 4 5 Others___________________ 1 2 3 4 5
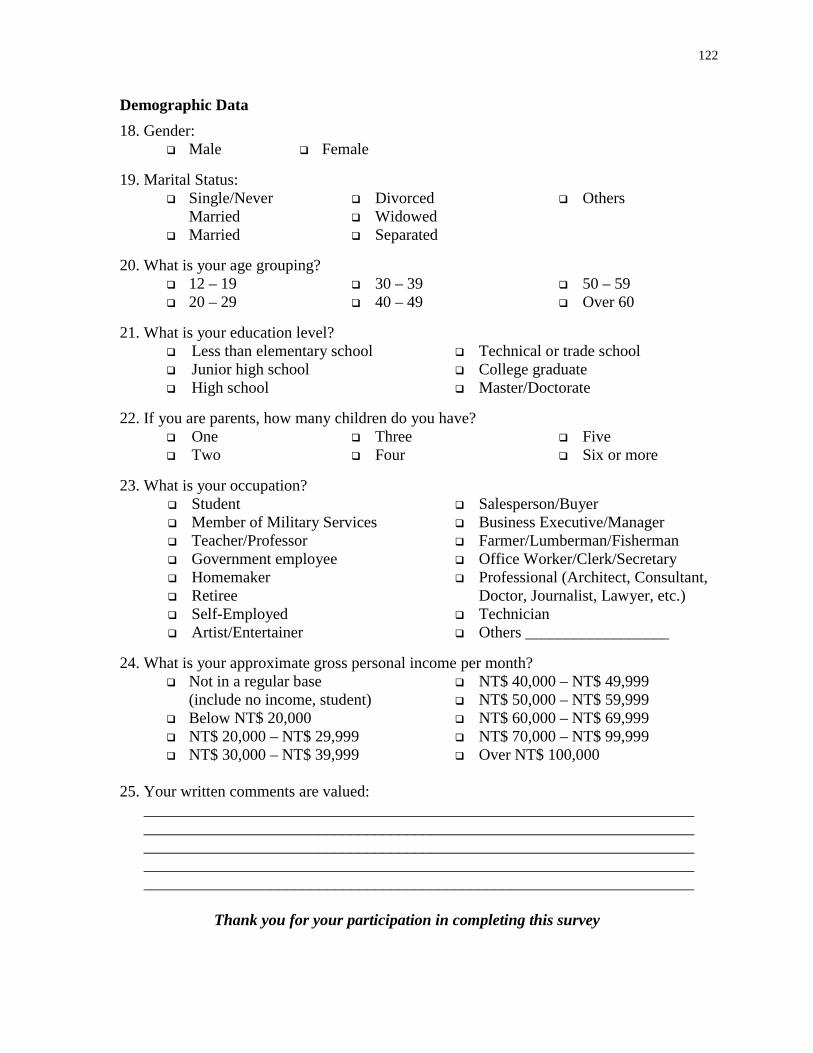
122
Demographic Data
18. Gender: $ Male $ Female
19. Marital Status:
$ Single/Never Married
$ Married
$ Divorced $ Widowed $ Separated
$ Others
20. What is your age grouping?
$ 12 – 19 $ 20 – 29
$ 30 – 39 $ 40 – 49
$ 50 – 59 $ Over 60
21. What is your education level?
$ Less than elementary school $ Junior high school $ High school
$ Technical or trade school $ College graduate $ Master/Doctorate
22. If you are parents, how many children do you have?
$ One $ Two
$ Three $ Four
$ Five $ Six or more
23. What is your occupation?
$ Student $ Member of Military Services $ Teacher/Professor $ Government employee $ Homemaker $ Retiree $ Self-Employed $ Artist/Entertainer
$ Salesperson/Buyer $ Business Executive/Manager $ Farmer/Lumberman/Fisherman $ Office Worker/Clerk/Secretary $ Professional (Architect, Consultant,
Doctor, Journalist, Lawyer, etc.) $ Technician $ Others __________________
24. What is your approximate gross personal income per month?
$ Not in a regular base (include no income, student)
$ Below NT$ 20,000 $ NT$ 20,000 – NT$ 29,999 $ NT$ 30,000 – NT$ 39,999
$ NT$ 40,000 – NT$ 49,999 $ NT$ 50,000 – NT$ 59,999 $ NT$ 60,000 – NT$ 69,999 $ NT$ 70,000 – NT$ 99,999 $ Over NT$ 100,000
25. Your written comments are valued:
_________________________________________________________________________________________________________________________________________________________________________________________________________________________________________________________________________________________________________________________________________________________
Thank you for your participation in completing this survey

123


