
ì eCommerce: Product Content and Search Visibility Study Study by Content Analy/cs Q4 2014
Copyright 2014, Content Analy5cs
ì Executive Summary Product Content and Search Visibility Study
Copyright 2014, Content Analy5cs
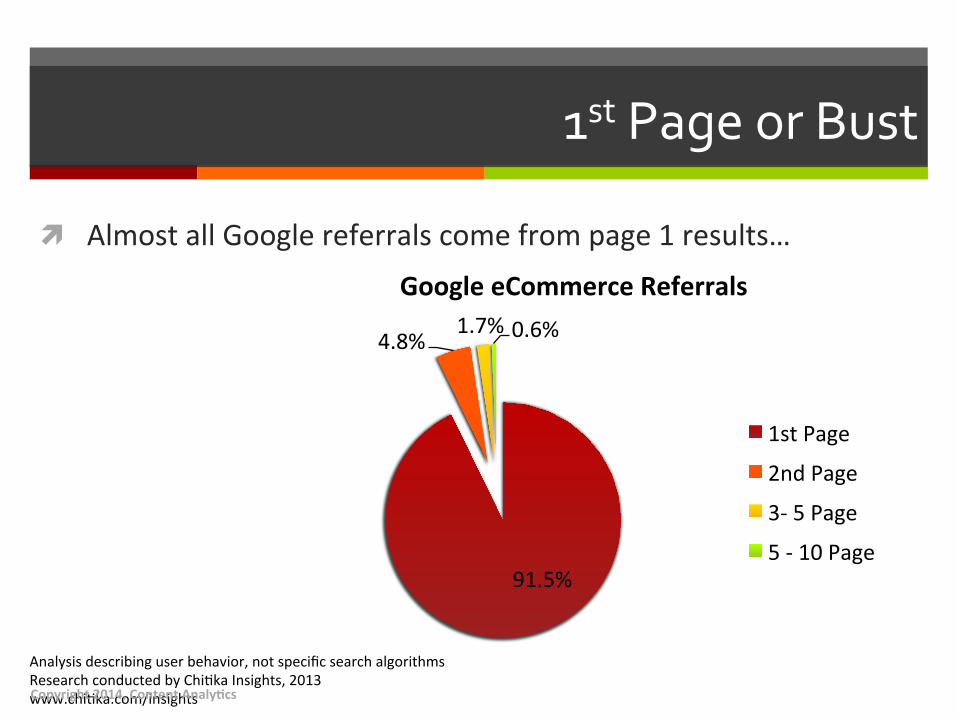
1st Page or Bust
ì Almost all Google referrals come from page 1 results…
91.5%
4.8% 1.7% 0.6%
Google eCommerce Referrals
1st Page
2nd Page
3-‐ 5 Page
5 -‐ 10 Page
Analysis describing user behavior, not specific search algorithms Research conducted by Chi/ka Insights, 2013 www.chi/ka.com/insights Copyright 2014, Content Analy5cs
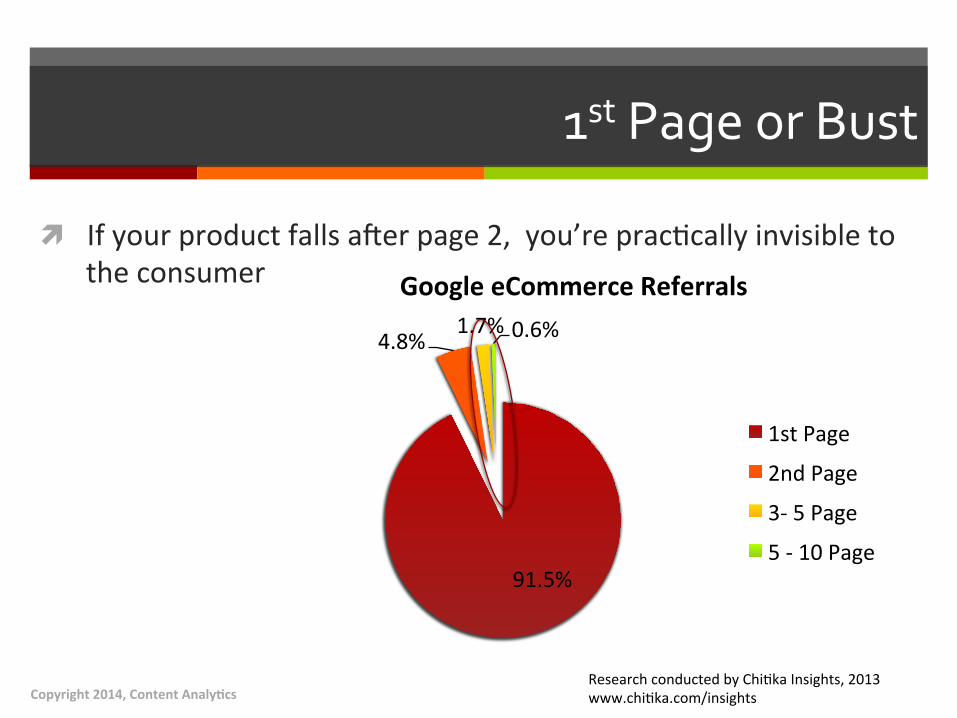
1st Page or Bust
ì If your product falls aSer page 2, you’re prac/cally invisible to the consumer
91.5%
4.8% 1.7% 0.6%
Google eCommerce Referrals
1st Page
2nd Page
3-‐ 5 Page
5 -‐ 10 Page
Research conducted by Chi/ka Insights, 2013 www.chi/ka.com/insights Copyright 2014, Content Analy5cs
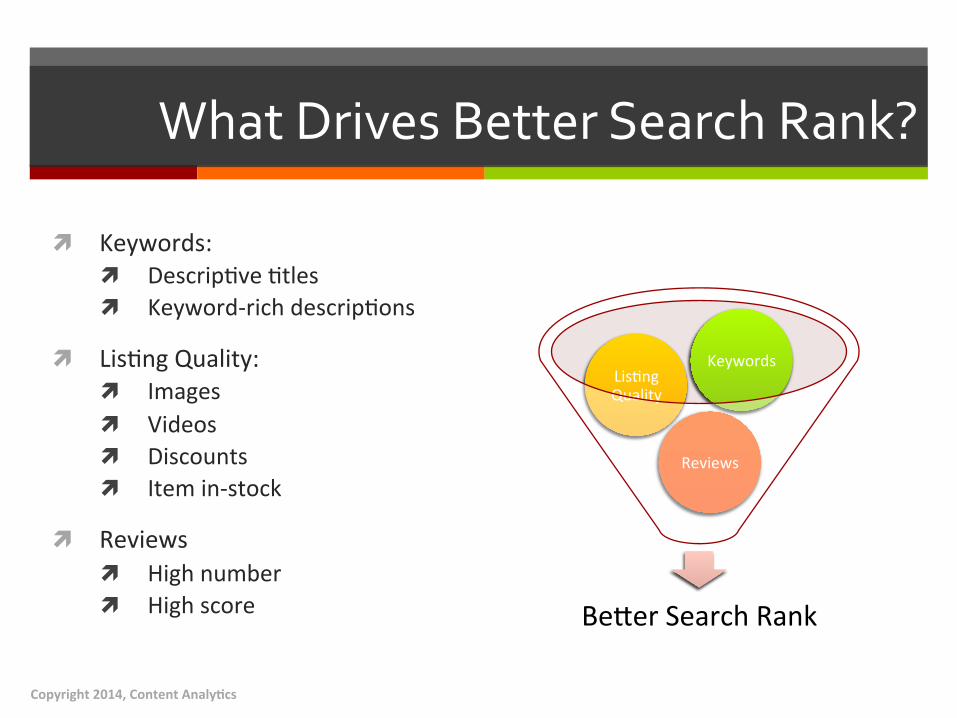
What Drives Better Search Rank?
ì Keywords: ì Descrip/ve /tles ì Keyword-‐rich descrip/ons
ì Lis/ng Quality: ì Images ì Videos ì Discounts ì Item in-‐stock
ì Reviews ì High number ì High score Be[er Search Rank
Reviews
Lis/ng Quality
Keywords
Copyright 2014, Content Analy5cs
ì Correlating Content to Rank Detailed findings
Copyright 2014, Content Analy5cs
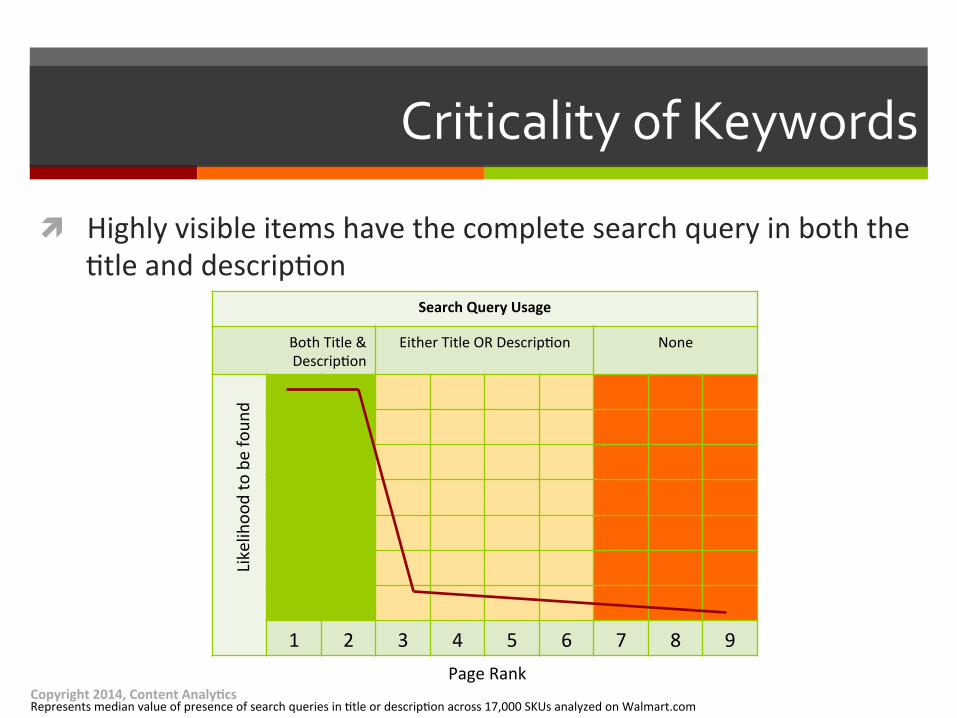
Criticality of Keywords
ì Highly visible items have the complete search query in both the /tle and descrip/on
Represents median value of presence of search queries in /tle or descrip/on across 17,000 SKUs analyzed on Walmart.com Copyright 2014, Content Analy5cs
Search Query Usage
Both Title & Descrip/on
Either Title OR Descrip/on None
1 2 3 4 5 6 7 8 9
Likelihoo
d to be foun
d
Page Rank

ì Impact Listing Quality Detailed findings
Copyright 2014, Content Analy5cs
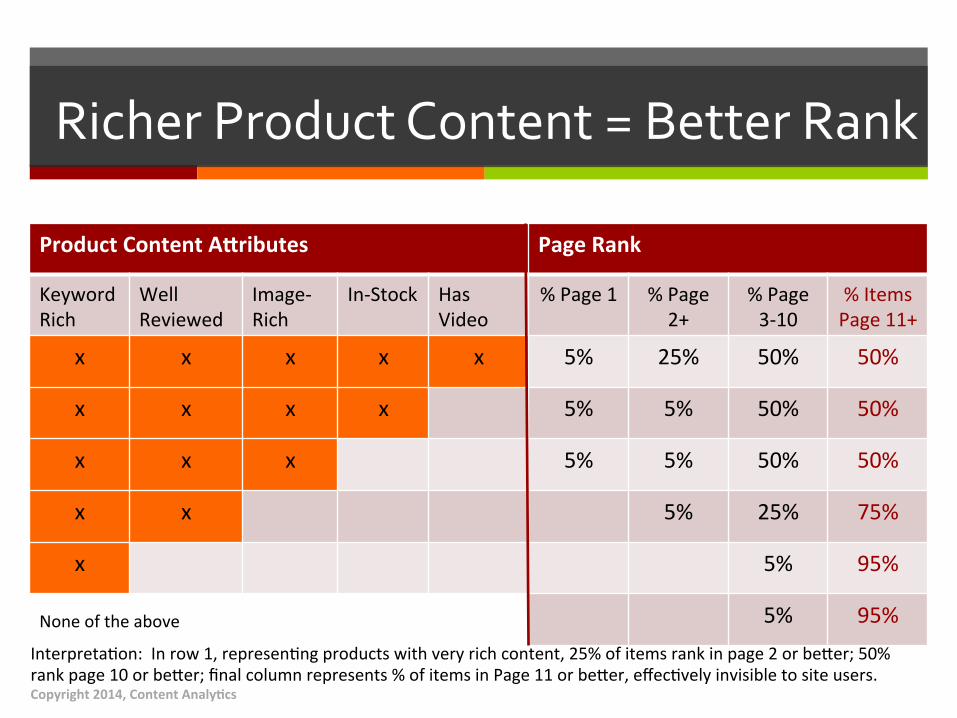
Richer Product Content = Better Rank
Product Content ABributes Page Rank
KeywordRich
Well Reviewed
Image-‐Rich
In-‐Stock Has Video
% Page 1 % Page 2+
% Page 3-‐10
% Items Page 11+
x x x x x 5% 25% 50% 50%
x x x x 5% 5% 50% 50%
x x x 5% 5% 50% 50%
x x 5% 25% 75%
x 5% 95%
None of the above 5% 95% Interpreta/on: In row 1, represen/ng products with very rich content, 25% of items rank in page 2 or be[er; 50% rank page 10 or be[er; final column represents % of items in Page 11 or be[er, effec/vely invisible to site users. Copyright 2014, Content Analy5cs
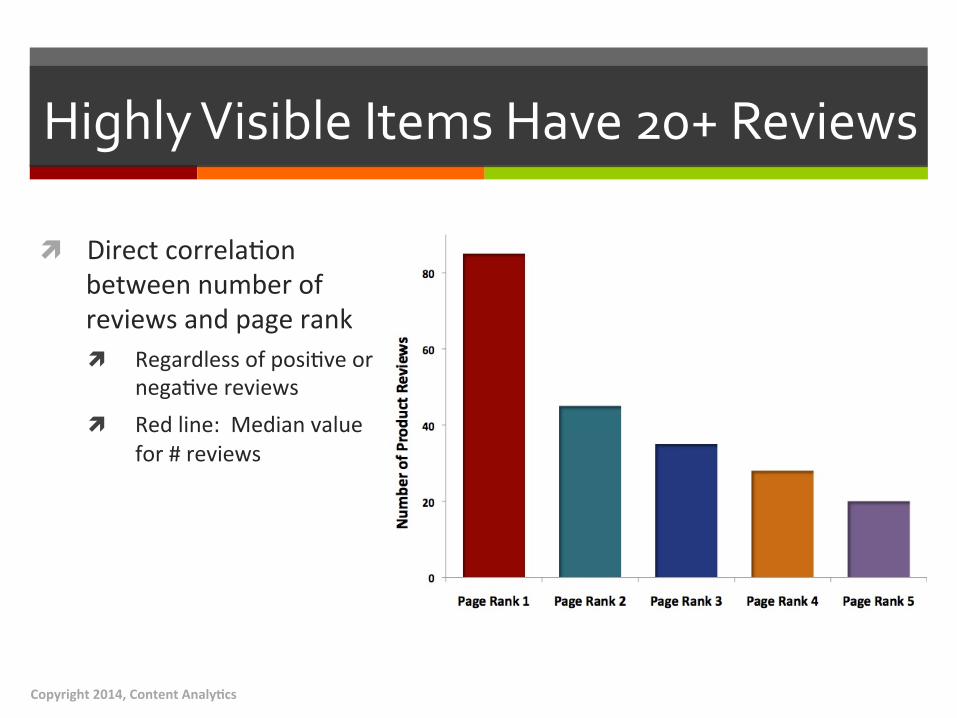
Highly Visible Items Have 20+ Reviews
ì Direct correla/on between number of reviews and page rank ì Regardless of posi/ve or
nega/ve reviews ì Red line: Median value
for # reviews
Copyright 2014, Content Analy5cs
!
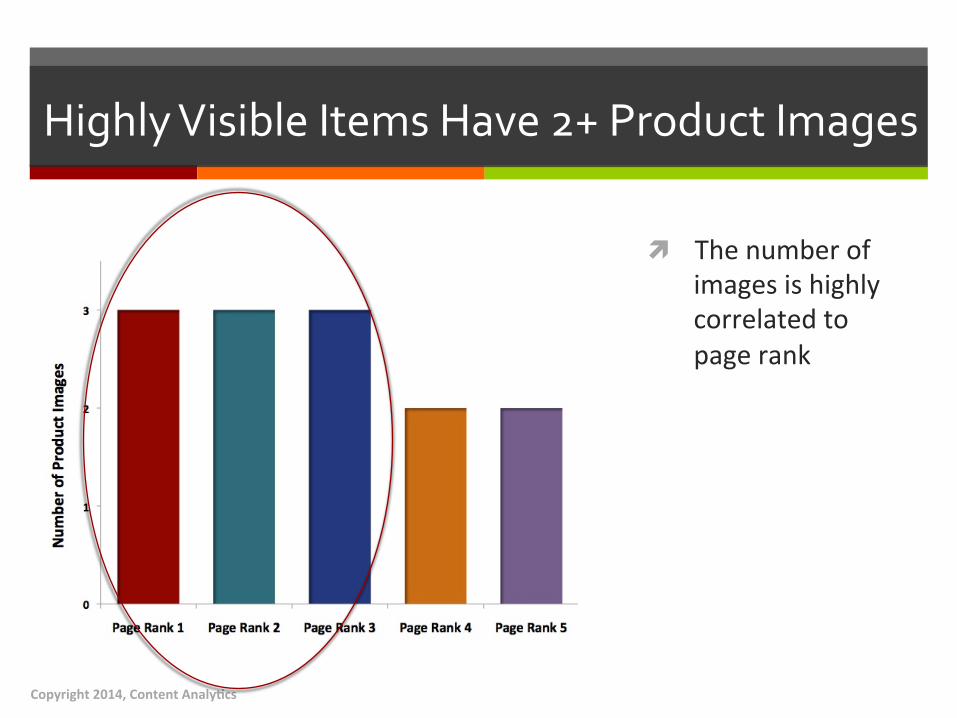
Highly Visible Items Have 2+ Product Images
ì The number of images is highly correlated to page rank
Copyright 2014, Content Analy5cs
!
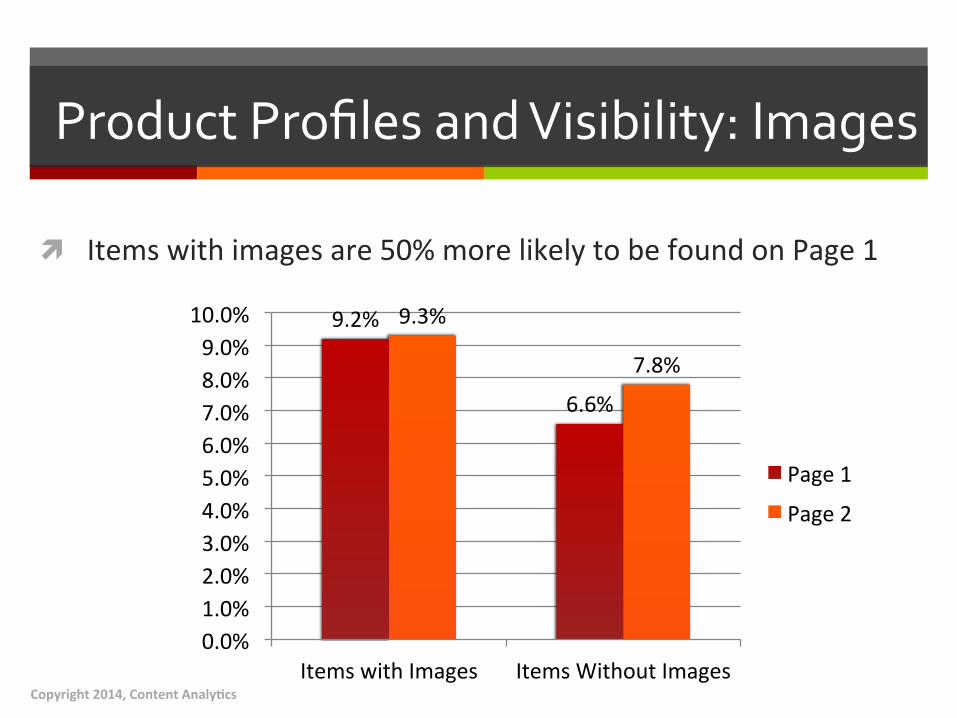
Product Profiles and Visibility: Images
ì Items with images are 50% more likely to be found on Page 1
9.2%
6.6%
9.3%
7.8%
0.0% 1.0% 2.0% 3.0% 4.0% 5.0% 6.0% 7.0% 8.0% 9.0% 10.0%
Items with Images Items Without Images
Page 1
Page 2
Copyright 2014, Content Analy5cs
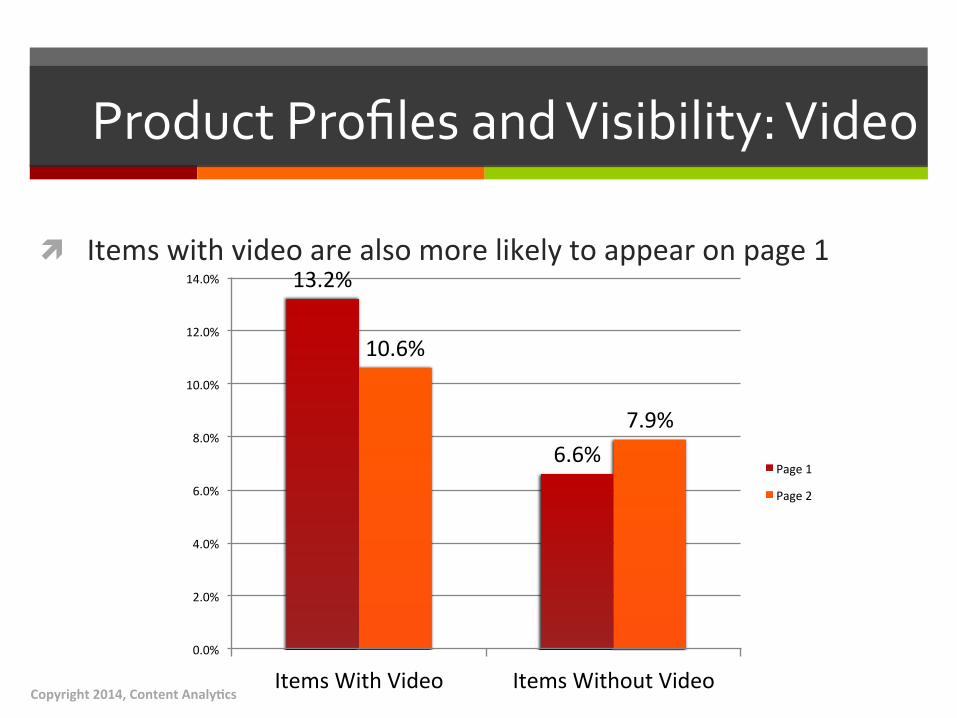
Product Profiles and Visibility: Video
ì Items with video are also more likely to appear on page 1 13.2%
6.6%
10.6%
7.9%
0.0%
2.0%
4.0%
6.0%
8.0%
10.0%
12.0%
14.0%
Items With Video Items Without Video
Page 1
Page 2
Copyright 2014, Content Analy5cs
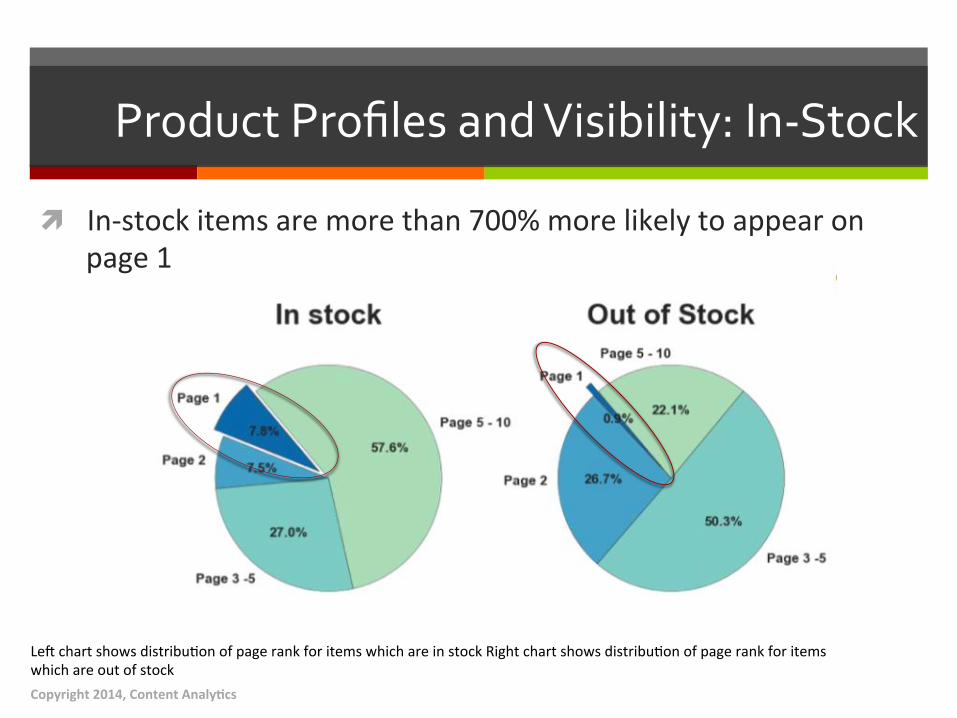
Product Profiles and Visibility: In-‐Stock
ì In-‐stock items are more than 700% more likely to appear on page 1
LeS chart shows distribu/on of page rank for items which are in stock Right chart shows distribu/on of page rank for items which are out of stock
Copyright 2014, Content Analy5cs

ì The Nuances of Online Pricing Detailed findings
Copyright 2014, Content Analy5cs
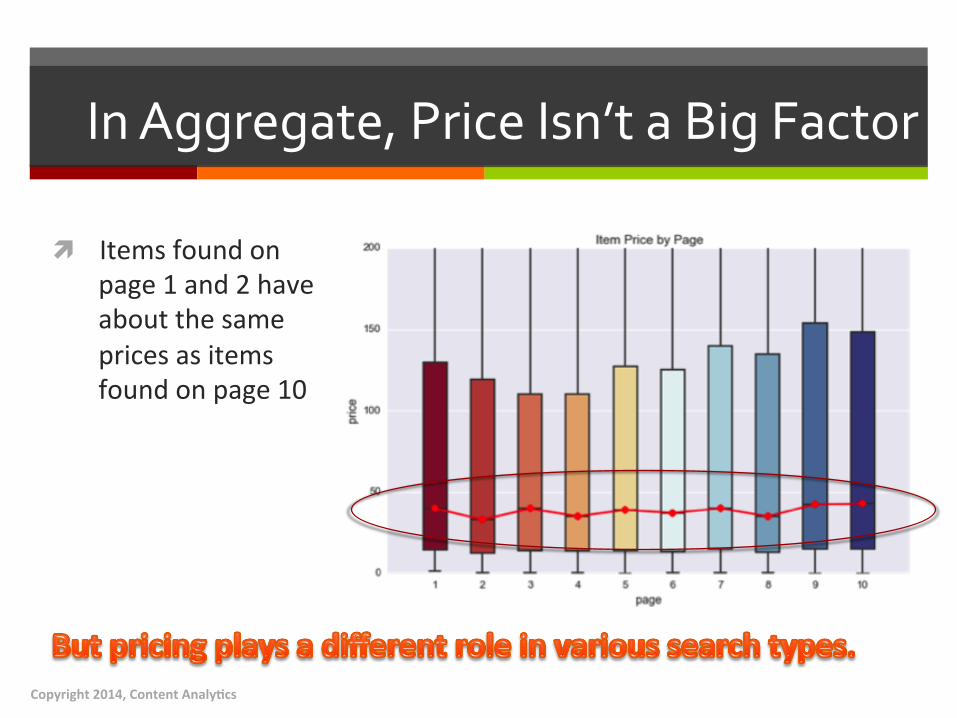
In Aggregate, Price Isn’t a Big Factor
ì Items found on page 1 and 2 have about the same prices as items found on page 10
Copyright 2014, Content Analy5cs
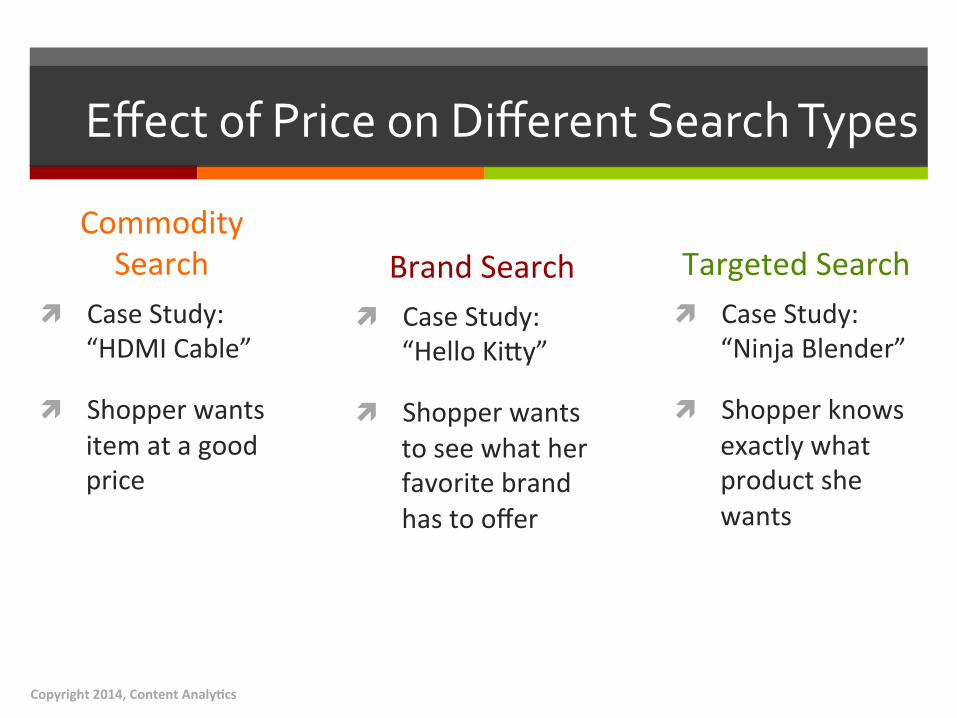
Effect of Price on Different Search Types
Brand Search ì Case Study:
“Hello Ki[y”
ì Shopper wants to see what her favorite brand has to offer
Commodity Search
ì Case Study: “HDMI Cable”
ì Shopper wants item at a good price
Targeted Search ì Case Study:
“Ninja Blender”
ì Shopper knows exactly what product she wants
Copyright 2014, Content Analy5cs
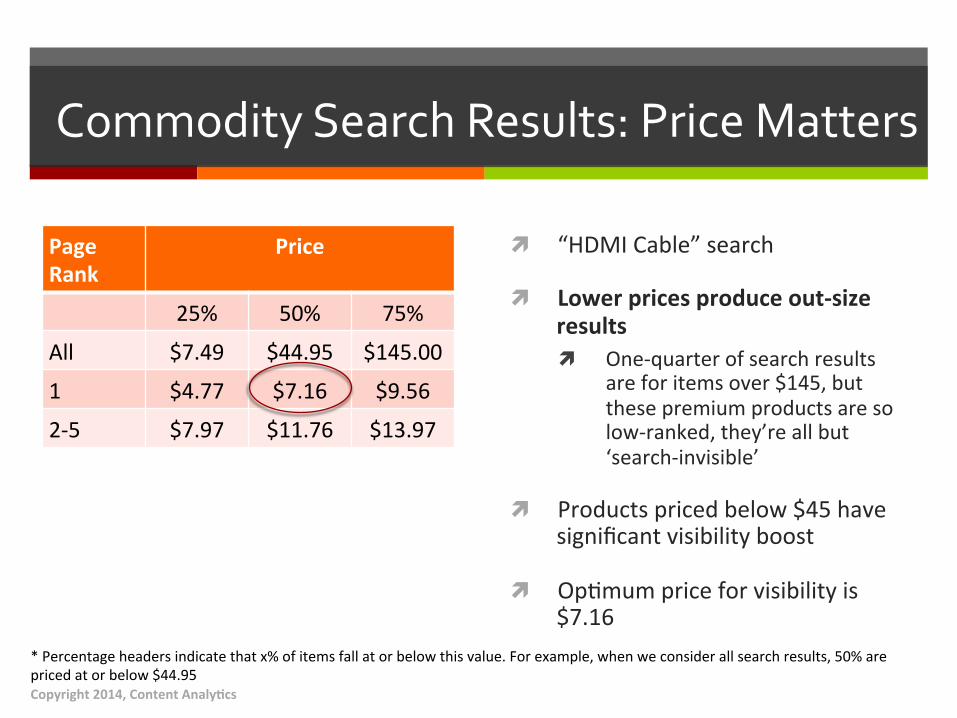
Commodity Search Results: Price Matters
Page Rank
Price
25% 50% 75%
All $7.49 $44.95 $145.00
1 $4.77 $7.16 $9.56
2-‐5 $7.97 $11.76 $13.97
ì “HDMI Cable” search
ì Lower prices produce out-‐size results ì One-‐quarter of search results
are for items over $145, but these premium products are so low-‐ranked, they’re all but ‘search-‐invisible’
ì Products priced below $45 have significant visibility boost
ì Op/mum price for visibility is $7.16
* Percentage headers indicate that x% of items fall at or below this value. For example, when we consider all search results, 50% are priced at or below $44.95
Copyright 2014, Content Analy5cs
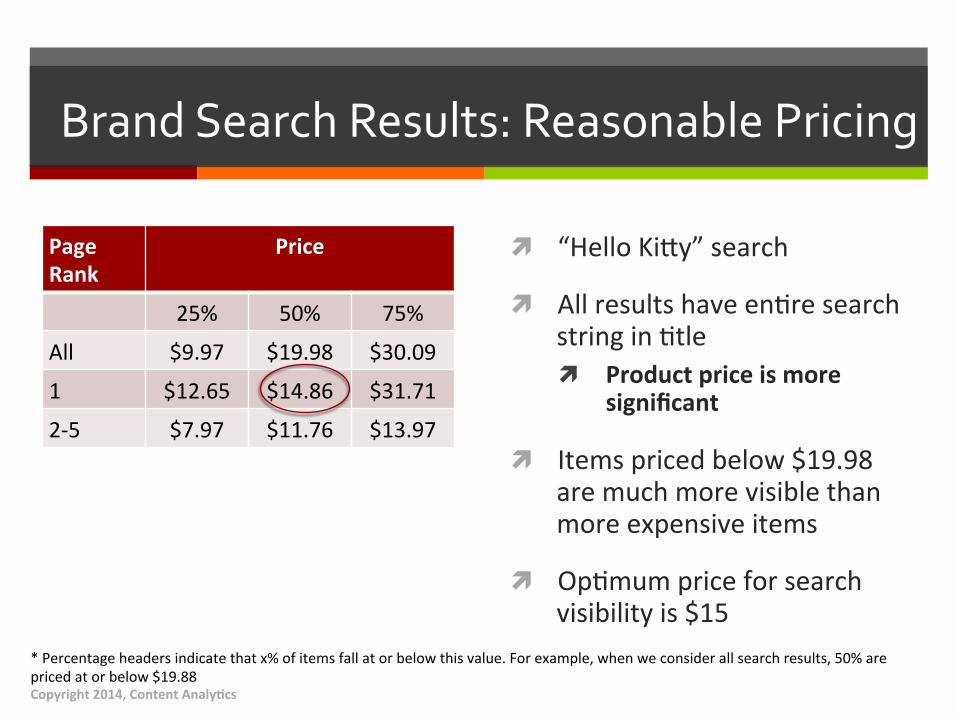
Brand Search Results: Reasonable Pricing
Page Rank
Price
25% 50% 75%
All $9.97 $19.98 $30.09
1 $12.65 $14.86 $31.71
2-‐5 $7.97 $11.76 $13.97
ì “Hello Ki[y” search
ì All results have en/re search string in /tle ì Product price is more
significant
ì Items priced below $19.98 are much more visible than more expensive items
ì Op/mum price for search visibility is $15
* Percentage headers indicate that x% of items fall at or below this value. For example, when we consider all search results, 50% are priced at or below $19.88
Copyright 2014, Content Analy5cs
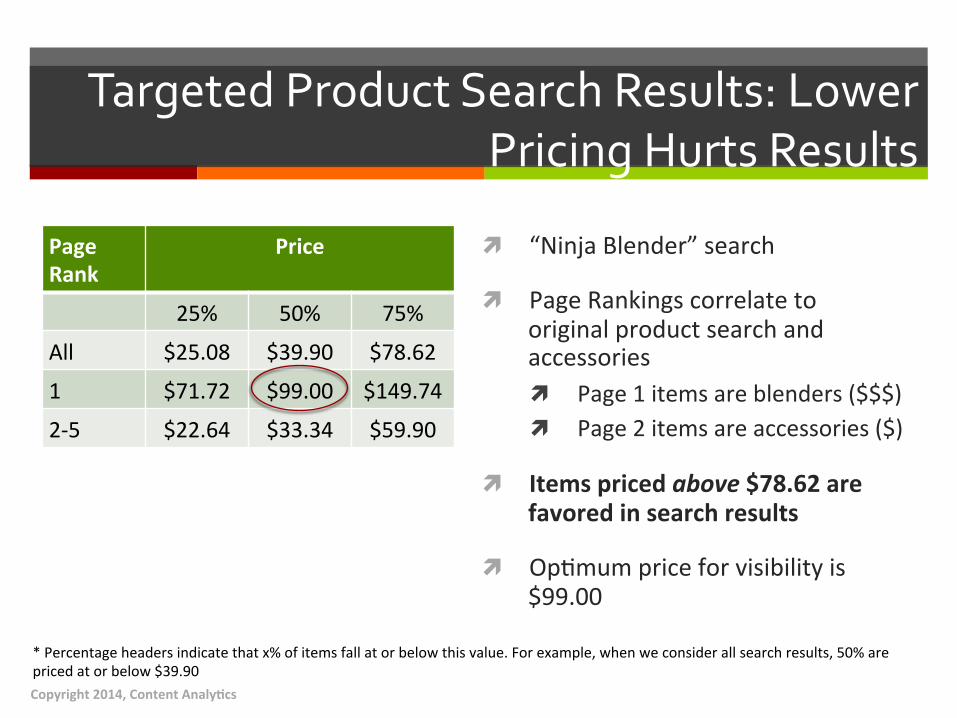
Targeted Product Search Results: Lower Pricing Hurts Results
Page Rank
Price
25% 50% 75%
All $25.08 $39.90 $78.62
1 $71.72 $99.00 $149.74
2-‐5 $22.64 $33.34 $59.90
ì “Ninja Blender” search
ì Page Rankings correlate to original product search and accessories ì Page 1 items are blenders ($$$) ì Page 2 items are accessories ($)
ì Items priced above $78.62 are favored in search results
ì Op/mum price for visibility is $99.00
* Percentage headers indicate that x% of items fall at or below this value. For example, when we consider all search results, 50% are priced at or below $39.90
Copyright 2014, Content Analy5cs
ì Study Recommendations Page Rank = Traffic = Sales
Copyright 2014, Content Analy5cs
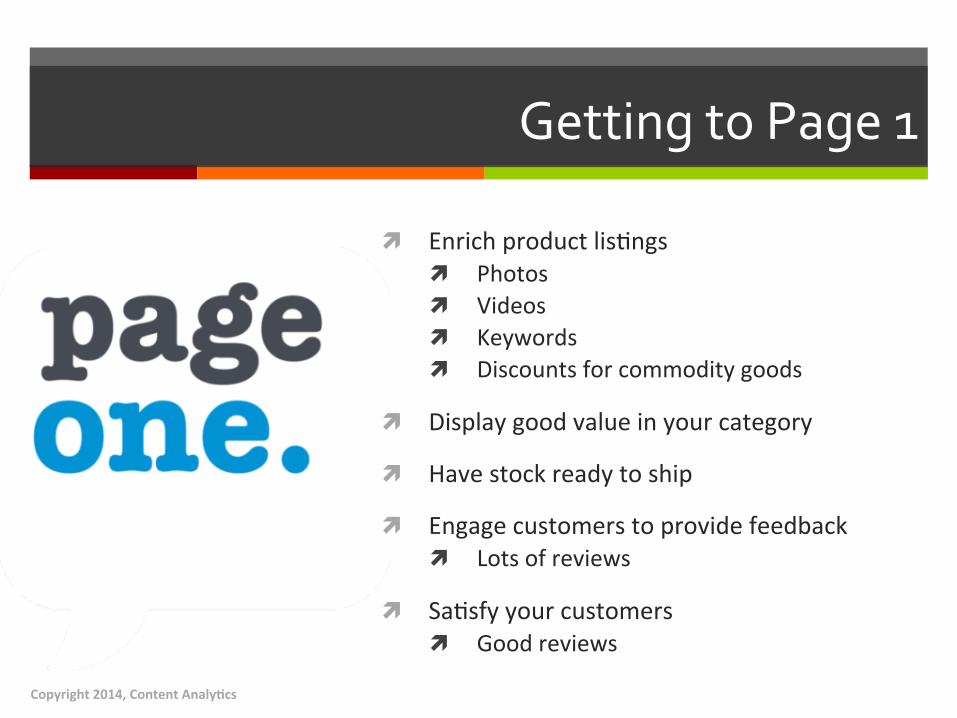
Getting to Page 1
ì Enrich product lis/ngs ì Photos ì Videos ì Keywords ì Discounts for commodity goods
ì Display good value in your category
ì Have stock ready to ship
ì Engage customers to provide feedback ì Lots of reviews
ì Sa/sfy your customers ì Good reviews
Copyright 2014, Content Analy5cs

ì Research Methodology 2014
Copyright 2014, Content Analy5cs
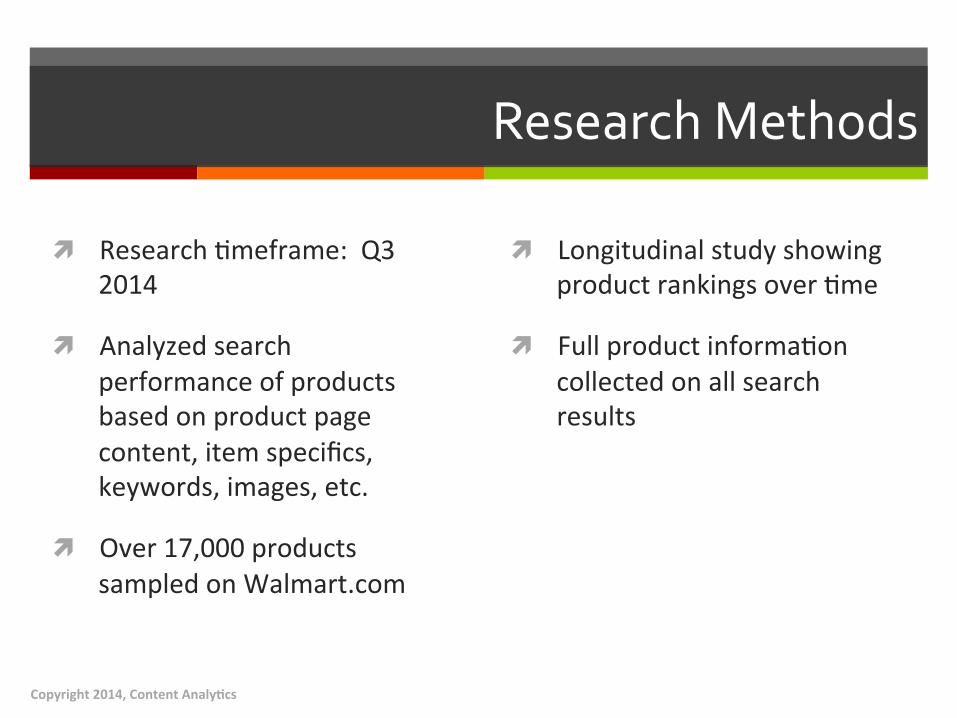
Research Methods
ì Research /meframe: Q3 2014
ì Analyzed search performance of products based on product page content, item specifics, keywords, images, etc.
ì Over 17,000 products sampled on Walmart.com
ì Longitudinal study showing product rankings over /me
ì Full product informa/on collected on all search results
Copyright 2014, Content Analy5cs


