
Converting Historical Industry Time Series Data from SIC to NAICS
Robert E. Yuskavage
U.S. Department of Commerce Bureau of Economic Analysis
Washington, DC
Paper prepared for the Federal Committee on Statistical Methodology
2007 Research Conference November 5-7, 2007
Arlington, VA
Converting Historical Industry Time Series Data from SIC to NAICS Robert E. Yuskavage
U.S. Bureau of Economic Analysis I. Introduction
The introduction of the North American Industry Classification System (NAICS) in the
late 1990’s offered the promise of more relevant U.S. industry time series data for the 21st
century. NAICS improved on the long-standing Standard Industrial Classification (SIC)
system because it provided greater detail for the fast-growing services and high-tech
manufacturing sectors and it more consistently classified establishments into industries
based on similar production processes. U.S. statistical agencies faced major challenges,
however, implementing NAICS for their on-going statistical programs. Perhaps an even
greater challenge, given the lack of NAICS source data before 1997, was the need to
convert historical industry time series data from SIC to NAICS.
Shortly before the introduction of NAICS, the U.S. experienced an acceleration of
economic growth that was driven partly by increased production of information and
communications technology (ICT). This faster growth helped to revive sluggish
productivity growth and spurred talk among economists about a "new economy."
Because the growth surge appeared to originate in a few key economic sectors, research
interest started to focus more on specific industries as parts of the broader aggregate
economy, especially the ICT-producing and consuming industries. While the SIC-based
industry data were initially used for this research, the way these data were organized
obscured some of the more important contributors to the growth acceleration. NAICS
was designed partly to more clearly identify these industries in economic statistics.
While researchers were generally pleased that the new industry data that were classified
on a NAICS basis better reflected the changing structure of the dynamic U.S. economy at
the turn of the century, they were also disappointed that consistent historical industry data
were no longer available. Consistent industry time series data are critical for studying
industry contributions to economic growth, structural change, and productivity. One of
the key datasets for studying these issues are the annual GDP-by-industry accounts
2
prepared by the U.S. Bureau of Economic Analysis (BEA), which provide time series
data on output and employment for industries going back to 1947. These data have been
widely used by researchers studying the sources of output and productivity growth at the
industry level in the postwar U.S. economy and are now available on a NAICS basis back
to 1947. 1
In describing the data sources and the methodology that were used to convert the
published SIC industry estimates for 1947 through 1997 to NAICS, this paper focuses on
how BEA developed dynamic (time-varying) concordances that capture changes over
time in the relative importance of new and emerging industries. As will be shown, this
feature of the conversion process was quite important to the overall reliability of the
NAICS estimates. The remainder of the paper is presented in three sections. Section II
provides background on NAICS, including the motivation for its development, how it
differs from the SIC system, and issues raised by its implementation. Section III provides
background on the GDP-by-industry accounts, how they are used for historical time
series analysis, and why it was important to recast these accounts on a consistent industry
classification basis. Section IV discusses the methodology that was used for the
conversion, how it compares to the methods used by other statistical agencies, and how
the resulting estimates were evaluated. Section V is a summary and conclusion.
II. Industry Classification and NAICS
Properly designed industry classification systems serve valuable purposes but they also
suffer from limited useful lives in a dynamic, changing economy. With such systems, a
trade-off exists between data that are relevant for recent periods and data that are
consistent over long periods. Industry classification systems allow statistical data for an
economy’s producing units (establishments or enterprises) to be aggregated into
meaningful categories (sectors), such as manufacturing, trade, and services. Aggregate
data are used by industry analysts and economic researchers to determine the relative
1 Output estimates on a NAICS basis for 1987-97 were released in November 2004 (Yuskavage and Pho) and output estimates for 1947-76 were released in December 2005 (Yuskavage and Fahim-Nader). Employment estimates on a NAICS basis were released in October 2006. To obtain these data, go to http://bea.gov/industry/gdpbyind_data.htm and look under the heading Historic Data.

3
sizes of sectors, changes over time in their importance in the economy, their contributions
to economic growth, and their performance compared with similar sectors in other
countries.
Industry classification systems can become increasingly irrelevant, however, as the
economy grows and as the relative importance of sectors changes. New and emerging
products and processes may not be recognized either because they did not exist or were
very small when the classification system was first developed. The high degree of
aggregation often used by statistical agencies for reporting the data, due to resource or
reliability constraints, is another limitation. Even if new or emerging products have a
clearly defined place in the classification system, their growth may be obscured if they
are a relatively small part of an aggregate that includes other types of products.
For more than 50 years, the SIC system was the framework used by the U.S. to classify
establishments into industries for the purpose of producing economic statistics. The SIC
coding system, which grouped establishments by their primary activity, was periodically
revised to better reflect the U.S. economy’s changing industrial organization and
structure. The most recent revision was in 1987. Despite ongoing efforts to maintain its
relevance, the SIC system was subject to criticism about the length of time between
revisions, inadequate representation of the fast-growing services and high-tech sectors,
and the lack of a clear conceptual rationale. These concerns were addressed at the 1991
International Conference on the Classification of Economic Activities in Williamsburg,
Virginia. A direct outcome of the conference was the creation the following year of the
Economic Classification Policy Committee (ECPC) by the Office of Management and
Budget. The ECPC was charged with taking a fresh look at how to design an industrial
classification system for a rapidly-changing economy.
The Bureau of Economic Analysis (BEA) chaired the ECPC, which included
representatives from the Census Bureau and the Bureau of Labor Statistics (BLS).
Ultimately, the ECPC decided to participate in a joint effort with the statistical agencies
of Canada and Mexico to develop the North American Industrial Classification System
4
(NAICS). The passage of the North American Free Trade Agreement in 1994 was also a
motivating force for developing a more up-to-date, uniform classification system because
it would allow more relevant comparisons of economic and financial statistics across
countries. NAICS was formally adopted as the new U.S. industrial classification system
in 1997. Subsequent revisions resulted in the 2002 version of NAICS and a revised 2007
version was released earlier this year.
In general, NAICS improves on the SIC as an industry classification system because it
more consistently classifies establishments into industries on the basis of similar
production processes, it recognizes new and emerging industries, and it provides greater
detail for the services sector. Some of its more valuable features are the establishment of
an “information” sector that includes software publishing and other new types of
communications services, the classification of auxiliaries according to the services they
provide rather than the industry they serve, and a clearer separation of different types of
high-tech goods and services such as computers and electronic products and information
services. The ECPC decided on a production-oriented classification structure for two
reasons. First, as a matter of principle, an industry classification system should be based
on producing units rather than products or services. Second, a supply-based conceptual
framework enables more accurate comparisons among industries because data are
consistently classified according to factors related to the production process, such as
outputs, inputs, and employment.
Implementation of NAICS posed many considerable statistical and logistical obstacles
because the scope of the changes was much greater than previous changes to the SIC
system. The 1997 version of NAICS was first implemented in the 1997 economic
censuses conducted by the Bureau of the Census, and these were released starting in
1999. Afterwards, the samples for the Census Bureau’s annual, quarterly, and monthly
surveys were re-drawn and these surveys were then conducted on a NAICS basis. The
Internal Revenue Service (IRS) Statistics of Income program incorporated NAICS for tax
year 1998 data that were released in 2000. BLS followed shortly afterwards in early
2003 with the conversion of its monthly employment and earnings surveys to the 2002
5
version of NAICS. BLS producer price indexes were converted in 2004. These primary
data sources then started filtering into downstream industry programs such as BEA’s
input-output (I-O) accounts, the BLS productivity programs, and the Federal Reserve
Board’s index of industrial production. Most industry economic programs were fully
converted to NAICS by 2004, seven years after the NAICS reference year.
III. GDP by Industry and the Annual Industry Accounts
BEA’s annual industry accounts (AIAs) include the integrated GDP-by-industry and
annual input-output (I-O) accounts. In these accounts, industries are defined on an
establishment basis according to NAICS. Estimates are published for 61 private
industries and four government classifications. The GDP-by-industry accounts feature
estimates of nominal and real value added by industry. Value added is defined as an
industry’s gross output (sales or receipts and other operating income) minus its
intermediate inputs (energy, materials, and purchased services). Value added summed
over all industries equals GDP. Intermediate inputs are goods and services acquired from
either domestic or foreign sources (imports). Price and quantity indexes of gross output,
intermediate inputs, and value added are published for industries, industry groups, and
broad sectors in the GDP-by-industry accounts. Several estimates of employment by
industry from the national income and product accounts (NIPAs) are also provided.
The GDP-by-industry accounts are used to study structural change and sources of growth
in the U.S. economy, to compare U.S. industrial performance with other countries, and to
assess the contributions of industries and sectors to aggregate productivity growth.
Because these accounts are conceptually and statistically consistent with the estimates of
gross domestic product (GDP) from the NIPAs, they can be used to determine the
contributions of industries and sectors to aggregate economic growth and inflation.
These accounts have been widely used by academic researchers studying the contribution
of industries to the U.S. productivity acceleration of the late 1990’s and to the recent
acceleration since 2001. (See Corrado et. al., Nordhaus, Stiroh, and Triplett and
Bosworth for examples.) By providing annual estimates of nominal and real gross
output, intermediate inputs, and value added for all industries, these accounts allow
6
researchers to understand changes over time in the relative importance of industries. The
nominal (current-dollar) value added estimates provide measures of industry size relative
to GDP, and the real value added estimates provide measures of industry contributions to
real GDP growth.
The annual I-O accounts, which are integrated with the GDP-by-industry accounts,
provide a time series of detailed, consistent information on the flows of goods and
services that are inputs into industry production processes and that are included in final
expenditures. These accounts are presented in standard make and use tables and several
supplementary tables, and they provide more detail than the GDP-by-industry accounts
on the commodities included in gross output and intermediate inputs. The make table
shows the commodities (goods and services) that are produced by each industry. The use
table shows the commodity inputs to industry production and the commodities that are
consumed by final users.
BEA released the NAICS-based integrated GDP-by-industry and annual I-O accounts for
the years 1998-2003 in June 2004 (Moyer, Planting, Kern, and Kish). The new
methodology featured innovative procedures that were designed to increase consistency
among the estimates in BEA’s economic accounts. The quality of the estimates was also
improved by the use of annual commodity (product) data in a balanced input-output
framework. One of the key data sources for implementing the new methodology was the
1997 benchmark I-O use table that was available for the first time on NAICS basis. This
I-O use table was adjusted to incorporate the 2003 comprehensive revision of the
NIPAs.2
Preparing the estimates on a NAICS basis for the first time, however, also posed
challenges. The GDP-by-industry accounts use source data from a wide variety of
federal economic statistics programs and other sources. The estimates are prepared using
source data collected by other agencies and the data are adjusted by BEA to meet NIPA
and industry accounts definitions and conventions. For example, the initial estimates of
2 See Lawson, Bersani, Fahim-Nader, and Guo for information about the 1997 benchmark I-O accounts.
7
the gross operating surplus portion of nominal value added by industry are based largel
on tax return data from the IRS Statistics of Income program, compiled on a company
basis rather than an establishment basis. Estimates of wages and salaries by industry ar
largely based on data from BLS, as are the consumer price indexes and producer price
indexes used for deflation. Estimates of nominal gross output by industry are estim
using data from Census Bureau annual surveys, but also use data from regulatory
agencies and trade associations. While some of the required source data were available
on a NAICS basis, BEA needed to
y
e
ated
convert other source data from SIC to NAICS for the
itial set of integrated estimates.
years
ogy
ed
the sources of growth
the services sector and in high-tech goods-producing industries.
al
urces be
iques that extrapolate
cent estimates into the past based on historical relationships.
in
At the time the integrated estimates were released, GDP-by-industry estimates for
before 1998 were available only on the SIC basis and were not based on the new
integrated methodology. As a result, it was not possible for researchers to conduct
industry-level research and analysis for long time periods using consistent methodol
and classifications. This was especially troublesome given the degree of structural
change that took place during the 1980’s and 1990’s. Members of BEA’s Advisory
Committee and academic and non-academic researchers strongly urged BEA to develop a
consistent historical time-series of industry data on a NAICS basis. This was consider
important not only for the sake of reliable economic time series data, but also to take
advantage of the special features of NAICS that more clearly show
in
IV. Conversion of the GDP by Industry Accounts
Conversion of the GDP-by-industry accounts from SIC to NAICS for years before 1998
posed several major challenges for BEA. As described above, BEA uses a wide variety
of data sources, mostly from other agencies, to compile the industry estimates of nomin
and real value added, and it was not feasible to request that all of these data so
converted from SIC to NAICS on a historical basis. As a result, because the
methodology that was used for 1998 forward could not be used for years before 1998,
BEA conducted research into using indirect “backcasting” techn
re

8
In designing a strategy to overcome the source data limitations, BEA faced a variety of
issues, such as the time span covered, the number of data items to be provided, and the
level of industry detail. Trade-offs abounded among these issues, and their resolution
partly depended on the desired degree of accuracy in the converted series. In making
decisions, BEA relied on both its own research and suggestions from academic and
business users with a strong interest in industry time series. These suggestions in
providing data for as many years as possible, making maximum use of available
historical SIC-based data, focusing on the most important data items, and considering
aggregation as an acceptable means of dealing with both source data limitations and
reliability concerns for distant years. The backward extrapolation (i.e., backcasting)
methodology was ultimately designed to provide historical annual estimates that
consistent over time, that preserve the broad patterns observed in the previously
published SIC-based estimates, and that incorporate the lates
key
cluded
are
t results from BEA's input-
utput accounts and national income and product accounts.
r
e
this
t were involved in converting
oth current-dollar and real (inflation-adjusted) estimates.
o
In general, when historical source data classified on a new basis are not available,
statistical conversion procedures tend to rely heavily on concordances developed for a
single year that show the relationship between data items classified on both the old basis
and the new basis. Such single-year static concordances are reliable for a limited numbe
of years before the reference year, but they become increasingly unreliable over time as
relationships change among the industries. Concordances that capture changes over tim
in the relative importance of new industries yield more reliable results. The rest of
section describes the procedures that were used to develop dynamic time-varying
concordances and how these concordances were used to develop the historical NAICS-
based estimates. It also describes the special challenges tha
b
Other Agency Conversions
In converting the indices of industrial production for manufacturing from SIC to NAICS
back to 1972, the Federal Reserve Board (FRB) largely avoided the source data problem
9
described above by assigning NAICS industry codes to manufacturing establishments
the quinquennial economic censuses and then calculating SIC to NAICS conversion
factors that varied over time for detailed manufacturing industries (Bayard and K
2003). Separate conversion factors were calculated for shipments, value added,
inventories, capital expenditures, employment, and other key variables, and these factors
were used in conjunction with annual survey data for manufacturing industries to develop
NAICS-based industry time series (Corrado, 2003). This procedure was feasible due to
the availability of longitudinal plant-level product data for manufacturing and the large
number of one-to-one matches at detailed levels within the manufacturing sector. Exact
matching techniques were used for m
in
limek,
ore than 90 percent of manufacturing shipments in
ach of the economic census years.
rcent
ther
y
ic
ion
ablishment microdata for March
001 in the BLS Longitudinal Database (Morisi, 2003).3
e
Unfortunately, similar data for developing SIC to NAICS conversion factors were not
readily available for non-manufacturing industries, which accounted for about 80 pe
of private-sector GDP in 1997. Consequently, agencies that converted SIC data to
NAICS for these industries tended to rely on fixed conversion factors from 1997 or o
recent years. The Bureau of the Census converted its monthly and annual series for
wholesale trade and retail trade sales and inventories to NAICS starting with 1992 partl
by assigning NAICS industry codes to employer establishments in the 1992 econom
census (Shimberg, Detlefsen, and Davie, 2002). In addition, BLS reconstructed its
monthly payroll, employment, and related series from SIC to NAICS back to 1990 for all
detailed NAICS industries. For certain higher-level industry aggregates, the convers
went back to 1939. These conversions were primarily based on employment ratios
computed by assigning both NAICS and SIC codes to est
2
BEA Procedures
For BEA, the conversion of historical SIC data to NAICS relied heavily, by necessity, on
concordances that were developed from tabulations of aggregate data classified according 3 In October 2004 BLS completed a release of employment and earnings on a NAICS 2002 basis back to 1990 from its Quarterly Census of Employment and Wages (QCEW, formerly ES-202) program. These data were later used by BEA for its estimates of employment by NAICS industry.

10
to both SIC and NAICS. The methodology for converting the nominal (current-dollar)
SIC industry estimates to NAICS was basically the same for the entire period 1947-97,
but there were some important differences for the sub-periods 1987-1997 and 1947-1986
The conversion methodology was more extensive and included more variables for 198
1997 for two reasons. First, the SIC-based series available for conversion were more
complete and second, BEA decided that more detailed results could be provided for t
period without a significant loss of accuracy. This section describes the conversion
methodology for current-dollar estimates and for employment for 1987-97 in detail,
followed by briefer descriptions of first the current-dollar and emplo
.
7-
his
yment estimates for
947-86 and then the real (constant-price) estimates for all periods. 1
Current-dollar and Employment Estimates for 1987-97
The conversion methodology for 1987-97 for each of the industry current-dollar and
ploy
em ment estimates can be summarized by the following six-step procedure:
Step 1: Develop a 1997 benchmark concordance between SIC and NAICS
Step 2: Extrapolate the benchmark concordance annually back to 1987
Step 3: Develop an annual time series of SIC to NAICS conversion matrices
Step 4: Convert the published SIC estimates to NAICS
Step 5: Extrapolate the 1997 benchmark NAICS levels back to 1987
Step 6: Adjust the extrapolated estimates to NIPA control totals.
ach step is described in more detail below. E
Step 1: Develop a 1997 benchmark concordance between SIC and NAICS
A 1997 benchmark concordance between NAICS 97 and SIC 87 was developed fr
detailed 1997 benchmark I-O accounts, which include data for about 850 private
industries at approximately the six-digit NAICS level. Each detailed six-digit NAICS
industry code was mapped to both a detailed SIC code and a higher-level (aggregated)
SIC code that corresponds to the GDP-by-industry publication level on the SIC basis
(approximately 2-digit SIC). For each detailed NAICS industry, the benchmark I-O data
set included estimates of gross output, intermediate inputs, compensation of employees
taxes less subsidies, and gross operating surplus. Summing the last three compone
om the
,
nts
11
yields nominal value added. At a later stage, estimates of full-time and part-time
employment were added to the file. This concordance was based on an unpublished
version of the 1997 benchmark I-O use table that was adjusted to incorporate the results
the 2003 NIPA comprehensive revision.
hmark
iliary expenses, payroll, and
mployment according to the SIC industry served.
ustry
vate
-by-
nd the related industry
odes for the 1997 NAICS, the 1987 SIC, and the 1972 SIC.
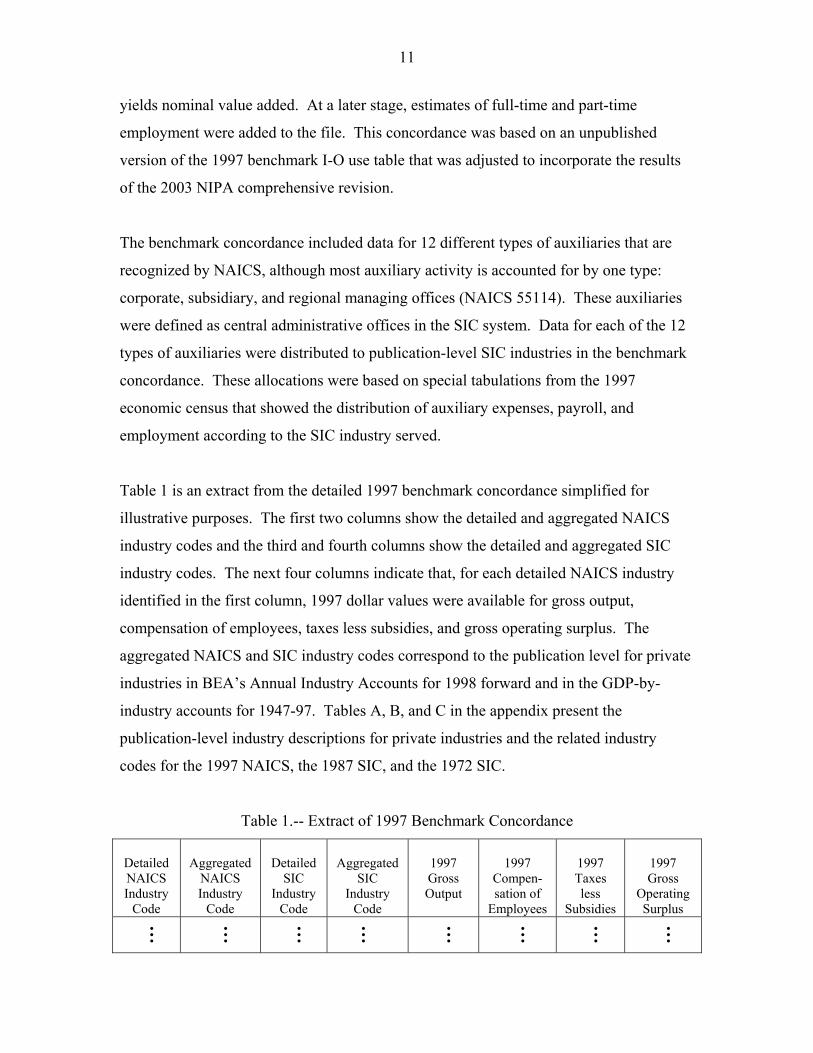
Table 1.-- Extract of 1997 Benchmark Concordance
N In
A N In
In
A
Gross Out
Em SuOp S s
of
The benchmark concordance included data for 12 different types of auxiliaries that are
recognized by NAICS, although most auxiliary activity is accounted for by one type:
corporate, subsidiary, and regional managing offices (NAICS 55114). These auxiliaries
were defined as central administrative offices in the SIC system. Data for each of the 12
types of auxiliaries were distributed to publication-level SIC industries in the benc
concordance. These allocations were based on special tabulations from the 1997
economic census that showed the distribution of aux
e
Table 1 is an extract from the detailed 1997 benchmark concordance simplified for
illustrative purposes. The first two columns show the detailed and aggregated NAICS
industry codes and the third and fourth columns show the detailed and aggregated SIC
industry codes. The next four columns indicate that, for each detailed NAICS ind
identified in the first column, 1997 dollar values were available for gross output,
compensation of employees, taxes less subsidies, and gross operating surplus. The
aggregated NAICS and SIC industry codes correspond to the publication level for pri
industries in BEA’s Annual Industry Accounts for 1998 forward and in the GDP
industry accounts for 1947-97. Tables A, B, and C in the appendix present the
publication-level industry descriptions for private industries a
c
Detailed
AICSydustr
Code
ggregated
AICSydustr
Code
Detailed
SIC ydustr
Code
ggregated
SIC yIndustr
Code
1997
put
1997
Compen-sat ion of
ployees
1997 Taxes less bsidies
1997 Gross eratingurplu
…
… …
…
…
…
…
…
12
1 0 111, 112 1191 0132 01-02 $ $ $ $
…
… …
…
…
…
…
…
1 0 11 5 1331 3-11 2411 24 $ $ $ $ …
… …
…
…
…
…
…
2 1 1111 211 1311 13 $ $ $ $
…
… … …
…
…
…
…
…
… … …
…
…
…
…
…
… …
…
…
…
…
…
713930 713 4493 44 $ $ $ $
721310 721 7021 70 $ $ $ $
7 0 2200 722 5812 52-59 $ $ $ $
…
… …
…
…
…
…
…
8 0 1293 81 7521 75 $ $ $ $
…
… … …
…
…
…
…
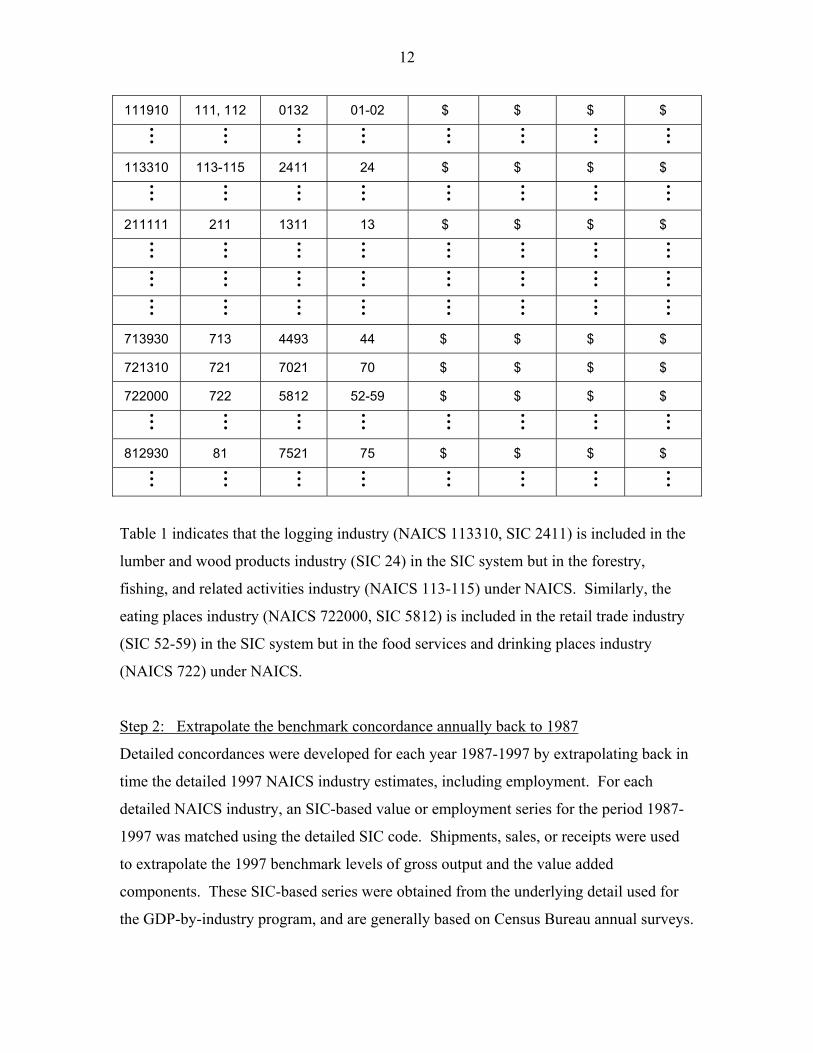
Table 1 indicates that the logging industry (NAICS 113310, SIC 2411) is included i
lumber and wood products industry (SIC 24) in the SIC system but in the forestry,
fishing, and related activities industry (NAICS 113-115) under NAICS. Similarly, the
eating places industry (NAICS 722000, SIC 5812) is included in the retail trade indu
(SIC 52-59) in the SIC system
n the
stry
but in the food services and drinking places industry
AICS 722) under NAICS. (N
Step 2: Extrapolate the benchmark concordance annually back to 1987
Detailed concordances were developed for each year 1987-1997 by extrapolating bac
time the detailed 1997 NAICS industry estimates, including employment. For each
detailed NAICS industry, an SIC-based value or employment series for the period 1987-
1997 was matched using the detailed SIC code. Shipments, sales, or receipts w
to extrapolate the 1997 benchmark levels of gross output and the value added
components. These SIC-based series were obtained from the underlying detail used for
k in
ere used
the GDP-by-industry program, and are generally based on Census Bureau annual surveys.
13
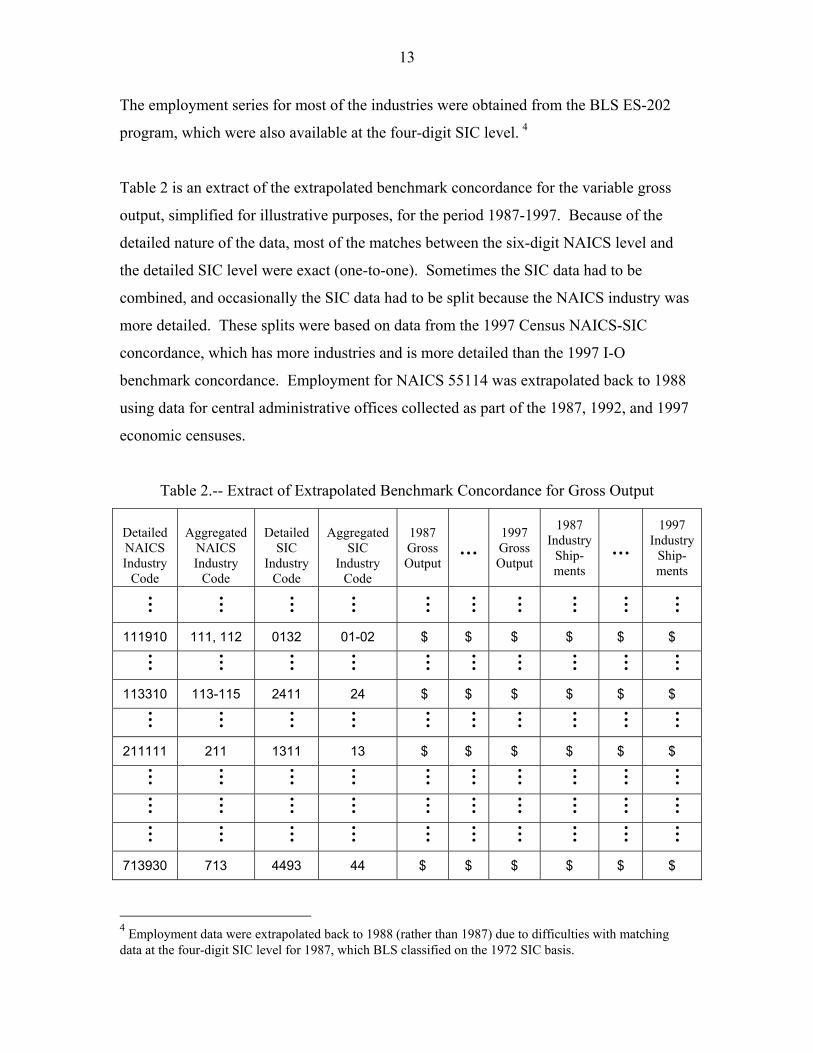
The employment series for most of the industries were obtained from the BLS ES-202
program, which were also available at the four-digit SIC level. 4
Table 2 is an extract of the extrapolated benchmark concordance for the variable gross
output, simplified for illustrative purposes, for the period 1987-1997. Because of the
detailed nature of the data, most of the matches between the six-digit NAICS level and
the detailed SIC level were exact (one-to-one). Sometimes the SIC data had to be
combined, and occasionally the SIC data had to be split because the NAICS industry was
more detailed. These splits were based on data from the 1997 Census NAICS-SIC
concordance, which has more industries and is more detailed than the 1997 I-O
benchmark concordance. Employment for NAICS 55114 was extrapolated back to 1988
using data for central administrative offices collected as part of the 1987, 1992, and 1997
economic censuses.
Table 2.-- Extract of Extrapolated Benchmark Concordance for Gross Output
Detailed NAICS Industry
Code
Aggregated
NAICS Industry
Code
Detailed
SIC Industry
Code
Aggregated
SIC Industry
Code
1987 Gross Output
… 1997 Gross Output
1987 Industry
Ship-ments
… 1997
Industry Ship-ments
…
… … … …
…
…
…
…
…
111910 111, 112 0132 01-02 $ $ $ $ $ $
…
… … …
…
…
…
…
…
…
113310 113-115 2411 24 $ $ $ $ $ $
…
… … …
…
…
…
…
…
…
211111 211 1311 13 $ $ $ $ $ $
…
… … …
…
…
…
…
…
…
…
… … …
…
…
…
…
…
…
…
… … …
…
…
…
…
…
…
713930 713 4493 44 $ $ $ $ $ $
4 Employment data were extrapolated back to 1988 (rather than 1987) due to difficulties with matching data at the four-digit SIC level for 1987, which BLS classified on the 1972 SIC basis.
14
721310 721 7021 70 $ $ $ $ $ $
722000 722 5812 52 $ $ $ $ $ $ …
… … …
…
…
…
…
…
…
812930 81 7521 75 $ $ $ $ $ $
…
… … …
…
…
…
…
…
…
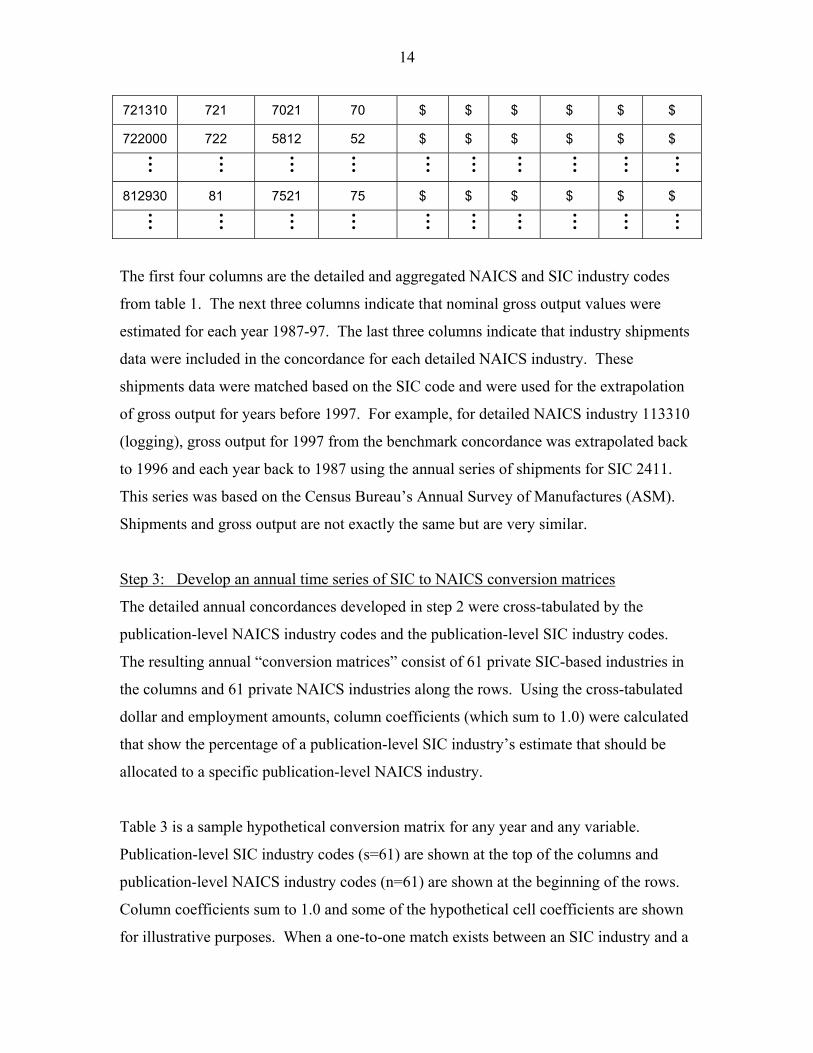
The first four columns are the detailed and aggregated NAICS and SIC industry codes
from table 1. The next three columns indicate that nominal gross output values were
estimated for each year 1987-97. The last three columns indicate that industry shipments
data were included in the concordance for each detailed NAICS industry. These
shipments data were matched based on the SIC code and were used for the extrapolation
of gross output for years before 1997. For example, for detailed NAICS industry 113310
(logging), gross output for 1997 from the benchmark concordance was extrapolated back
to 1996 and each year back to 1987 using the annual series of shipments for SIC 2411.
This series was based on the Census Bureau’s Annual Survey of Manufactures (ASM).
Shipments and gross output are not exactly the same but are very similar.
Step 3: Develop an annual time series of SIC to NAICS conversion matrices
The detailed annual concordances developed in step 2 were cross-tabulated by the
publication-level NAICS industry codes and the publication-level SIC industry codes.
The resulting annual “conversion matrices” consist of 61 private SIC-based industries in
the columns and 61 private NAICS industries along the rows. Using the cross-tabulated
dollar and employment amounts, column coefficients (which sum to 1.0) were calculated
that show the percentage of a publication-level SIC industry’s estimate that should be
allocated to a specific publication-level NAICS industry.
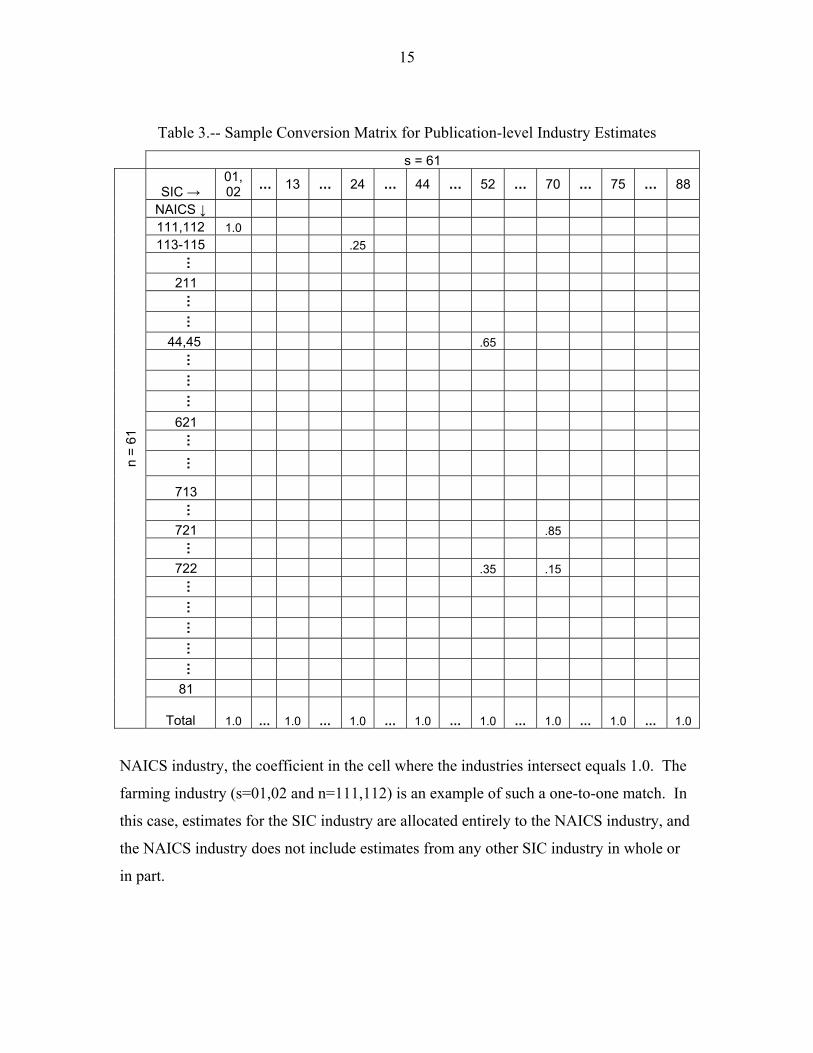
Table 3 is a sample hypothetical conversion matrix for any year and any variable.
Publication-level SIC industry codes (s=61) are shown at the top of the columns and
publication-level NAICS industry codes (n=61) are shown at the beginning of the rows.
Column coefficients sum to 1.0 and some of the hypothetical cell coefficients are shown
for illustrative purposes. When a one-to-one match exists between an SIC industry and a
15
Table 3.-- Sample Conversion Matrix for Publication-level Industry Estimates
s = 61
SIC → 01,02 … 13 … 24 … 44 … 52 … 70 … 75 … 88
NAICS ↓ 111,112 1.0 113-115 .25
…
211
…
…
44,45 .65
…
…
…
621
…
…
713
…
721 .85
…
722 .35 .15
…
…
…
…
…
81
n =
61
Total 1.0 … 1.0 … 1.0 … 1.0 … 1.0 … 1.0 … 1.0 … 1.0
NAICS industry, the coefficient in the cell where the industries intersect equals 1.0. The
farming industry (s=01,02 and n=111,112) is an example of such a one-to-one match. In
this case, estimates for the SIC industry are allocated entirely to the NAICS industry, and
the NAICS industry does not include estimates from any other SIC industry in whole or
in part.
16
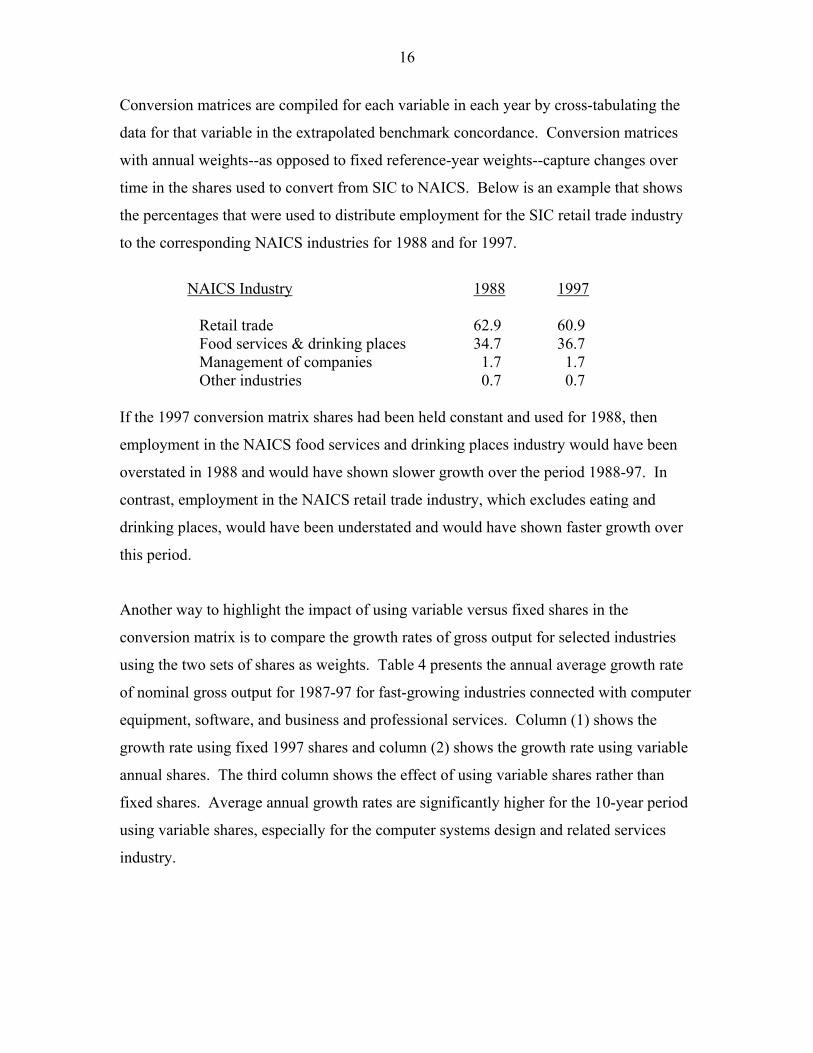
Conversion matrices are compiled for each variable in each year by cross-tabulating the
data for that variable in the extrapolated benchmark concordance. Conversion matrices
with annual weights--as opposed to fixed reference-year weights--capture changes over
time in the shares used to convert from SIC to NAICS. Below is an example that shows
the percentages that were used to distribute employment for the SIC retail trade industry
to the corresponding NAICS industries for 1988 and for 1997.
NAICS Industry 1988 1997
Retail trade 62.9 60.9 Food services & drinking places 34.7 36.7 Management of companies 1.7 1.7 Other industries 0.7 0.7
If the 1997 conversion matrix shares had been held constant and used for 1988, then
employment in the NAICS food services and drinking places industry would have been
overstated in 1988 and would have shown slower growth over the period 1988-97. In
contrast, employment in the NAICS retail trade industry, which excludes eating and
drinking places, would have been understated and would have shown faster growth over
this period.
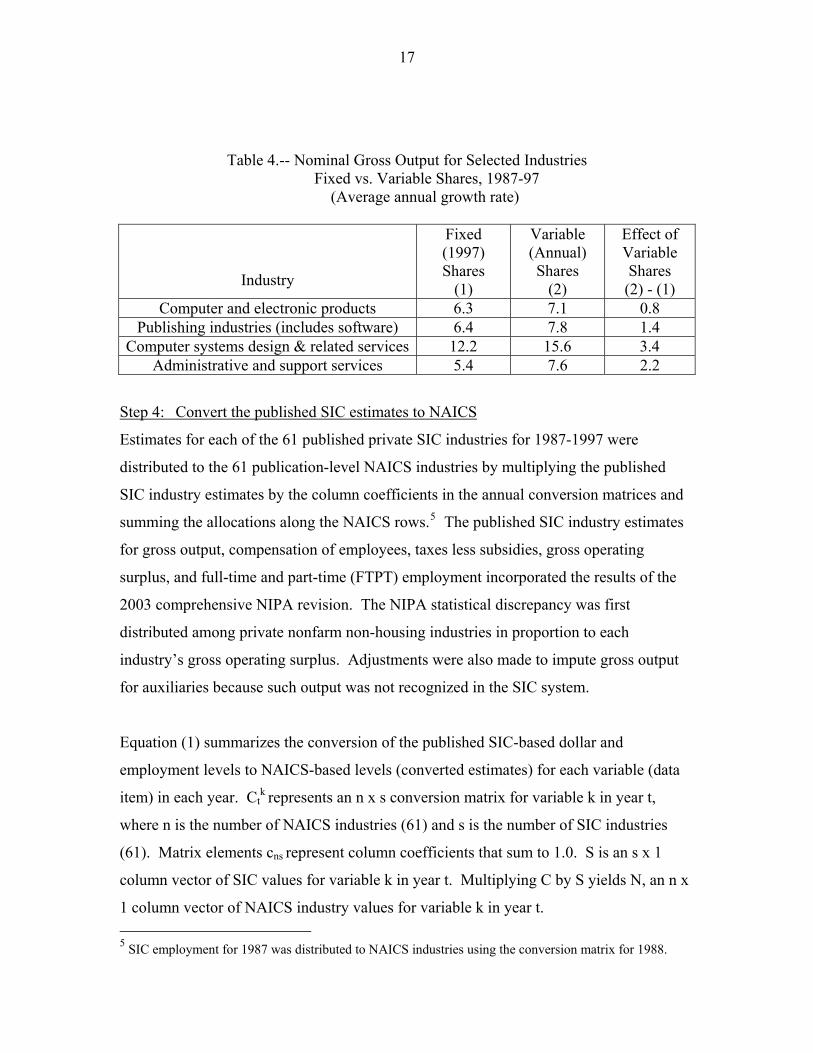
Another way to highlight the impact of using variable versus fixed shares in the
conversion matrix is to compare the growth rates of gross output for selected industries
using the two sets of shares as weights. Table 4 presents the annual average growth rate
of nominal gross output for 1987-97 for fast-growing industries connected with computer
equipment, software, and business and professional services. Column (1) shows the
growth rate using fixed 1997 shares and column (2) shows the growth rate using variable
annual shares. The third column shows the effect of using variable shares rather than
fixed shares. Average annual growth rates are significantly higher for the 10-year period
using variable shares, especially for the computer systems design and related services
industry.
17
Table 4.-- Nominal Gross Output for Selected Industries Fixed vs. Variable Shares, 1987-97
(Average annual growth rate)
Industry
Fixed (1997) Shares
(1)
Variable (Annual) Shares
(2)
Effect of Variable Shares (2) - (1)
Computer and electronic products 6.3 7.1 0.8 Publishing industries (includes software) 6.4 7.8 1.4
Computer systems design & related services 12.2 15.6 3.4 Administrative and support services 5.4 7.6 2.2
Step 4: Convert the published SIC estimates to NAICS
Estimates for each of the 61 published private SIC industries for 1987-1997 were
distributed to the 61 publication-level NAICS industries by multiplying the published
SIC industry estimates by the column coefficients in the annual conversion matrices and
summing the allocations along the NAICS rows.5 The published SIC industry estimates
for gross output, compensation of employees, taxes less subsidies, gross operating
surplus, and full-time and part-time (FTPT) employment incorporated the results of the
2003 comprehensive NIPA revision. The NIPA statistical discrepancy was first
distributed among private nonfarm non-housing industries in proportion to each
industry’s gross operating surplus. Adjustments were also made to impute gross output
for auxiliaries because such output was not recognized in the SIC system.
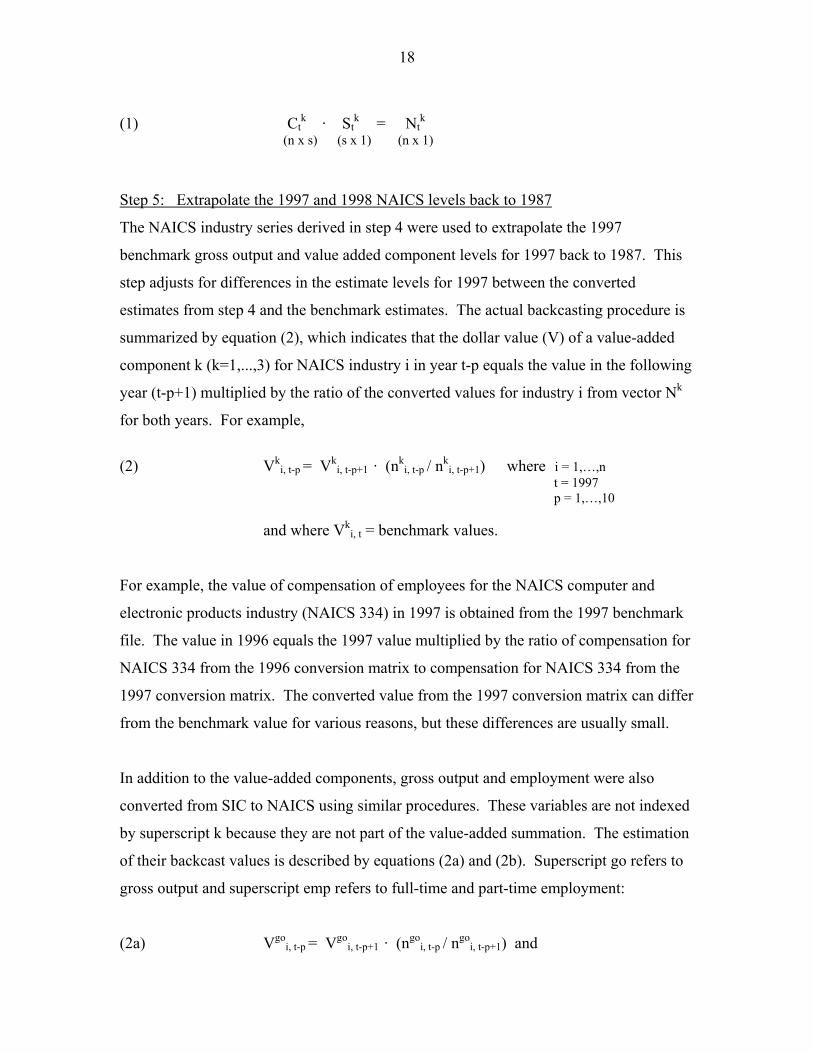
Equation (1) summarizes the conversion of the published SIC-based dollar and
employment levels to NAICS-based levels (converted estimates) for each variable (data
item) in each year. Ctk represents an n x s conversion matrix for variable k in year t,
where n is the number of NAICS industries (61) and s is the number of SIC industries
(61). Matrix elements cns represent column coefficients that sum to 1.0. S is an s x 1
column vector of SIC values for variable k in year t. Multiplying C by S yields N, an n x
1 column vector of NAICS industry values for variable k in year t. 5 SIC employment for 1987 was distributed to NAICS industries using the conversion matrix for 1988.
18
(1) Ct
k · Stk = Nt
k (n x s) (s x 1) (n x 1)
Step 5: Extrapolate the 1997 and 1998 NAICS levels back to 1987
The NAICS industry series derived in step 4 were used to extrapolate the 1997
benchmark gross output and value added component levels for 1997 back to 1987. This
step adjusts for differences in the estimate levels for 1997 between the converted
estimates from step 4 and the benchmark estimates. The actual backcasting procedure is
summarized by equation (2), which indicates that the dollar value (V) of a value-added
component k (k=1,...,3) for NAICS industry i in year t-p equals the value in the following
year (t-p+1) multiplied by the ratio of the converted values for industry i from vector Nk
for both years. For example,
(2) Vk
i, t-p = Vki, t-p+1 · (nk
i, t-p / nk
i, t-p+1) where i = 1,…,n t = 1997 p = 1,…,10
and where Vki, t = benchmark values.
For example, the value of compensation of employees for the NAICS computer and
electronic products industry (NAICS 334) in 1997 is obtained from the 1997 benchmark
file. The value in 1996 equals the 1997 value multiplied by the ratio of compensation for
NAICS 334 from the 1996 conversion matrix to compensation for NAICS 334 from the
1997 conversion matrix. The converted value from the 1997 conversion matrix can differ
from the benchmark value for various reasons, but these differences are usually small.
In addition to the value-added components, gross output and employment were also
converted from SIC to NAICS using similar procedures. These variables are not indexed
by superscript k because they are not part of the value-added summation. The estimation
of their backcast values is described by equations (2a) and (2b). Superscript go refers to
gross output and superscript emp refers to full-time and part-time employment:
(2a) Vgoi, t-p = Vgo
i, t-p+1 · (ngoi, t-p
/ ngoi, t-p+1) and
19
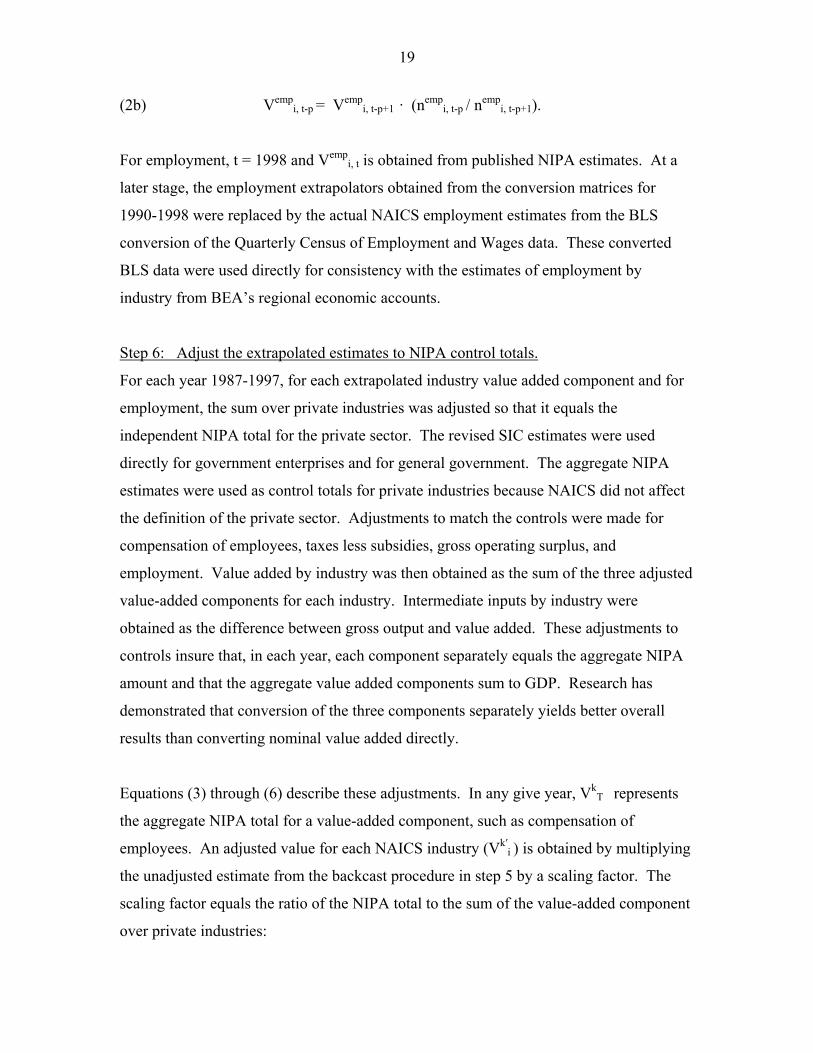
(2b) Vempi, t-p = Vemp
i, t-p+1 · (nempi, t-p
/ nempi, t-p+1).
For employment, t = 1998 and Vempi, t is obtained from published NIPA estimates. At a
later stage, the employment extrapolators obtained from the conversion matrices for
1990-1998 were replaced by the actual NAICS employment estimates from the BLS
conversion of the Quarterly Census of Employment and Wages data. These converted
BLS data were used directly for consistency with the estimates of employment by
industry from BEA’s regional economic accounts.
Step 6: Adjust the extrapolated estimates to NIPA control totals.
For each year 1987-1997, for each extrapolated industry value added component and for
employment, the sum over private industries was adjusted so that it equals the
independent NIPA total for the private sector. The revised SIC estimates were used
directly for government enterprises and for general government. The aggregate NIPA
estimates were used as control totals for private industries because NAICS did not affect
the definition of the private sector. Adjustments to match the controls were made for
compensation of employees, taxes less subsidies, gross operating surplus, and
employment. Value added by industry was then obtained as the sum of the three adjusted
value-added components for each industry. Intermediate inputs by industry were
obtained as the difference between gross output and value added. These adjustments to
controls insure that, in each year, each component separately equals the aggregate NIPA
amount and that the aggregate value added components sum to GDP. Research has
demonstrated that conversion of the three components separately yields better overall
results than converting nominal value added directly.
Equations (3) through (6) describe these adjustments. In any give year, VkT represents
the aggregate NIPA total for a value-added component, such as compensation of
employees. An adjusted value for each NAICS industry (Vk′i ) is obtained by multiplying
the unadjusted estimate from the backcast procedure in step 5 by a scaling factor. The
scaling factor equals the ratio of the NIPA total to the sum of the value-added component
over private industries:
20
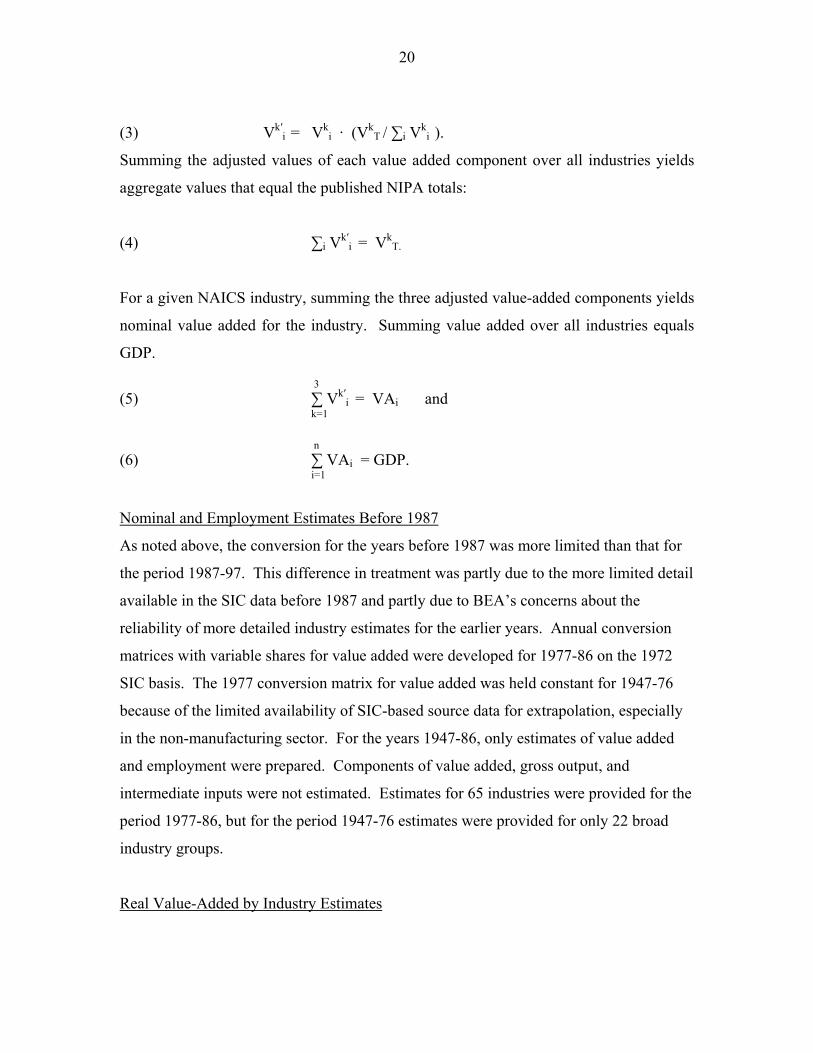
(3) Vk′i = Vk
i · (VkT / ∑i Vk
i ).
Summing the adjusted values of each value added component over all industries yields
aggregate values that equal the published NIPA totals:
(4) ∑i Vk′i = Vk
T.
For a given NAICS industry, summing the three adjusted value-added components yields
nominal value added for the industry. Summing value added over all industries equals
GDP.
3 (5) ∑ Vk′
i = VAi and k=1
n (6) ∑ VAi = GDP. i=1
Nominal and Employment Estimates Before 1987
As noted above, the conversion for the years before 1987 was more limited than that for
the period 1987-97. This difference in treatment was partly due to the more limited detail
available in the SIC data before 1987 and partly due to BEA’s concerns about the
reliability of more detailed industry estimates for the earlier years. Annual conversion
matrices with variable shares for value added were developed for 1977-86 on the 1972
SIC basis. The 1977 conversion matrix for value added was held constant for 1947-76
because of the limited availability of SIC-based source data for extrapolation, especially
in the non-manufacturing sector. For the years 1947-86, only estimates of value added
and employment were prepared. Components of value added, gross output, and
intermediate inputs were not estimated. Estimates for 65 industries were provided for the
period 1977-86, but for the period 1947-76 estimates were provided for only 22 broad
industry groups.
Real Value-Added by Industry Estimates
21
One of the most important uses of industry output measures, both gross output and value
added, is for time series analysis of economic growth and productivity change at the
industry level. These types of analyses require inflation-adjusted (real) estimates of
outputs and inputs by industry in order to identify the impact of changes in quantities or
real magnitudes. Price indexes are needed for deflation of both industry outputs and
inputs. The preferred method for calculating real value added by industry is the double-
deflation method, in which real value added is estimated as the difference between real
(deflated) gross output and real (deflated) intermediate inputs. BEA uses a Fisher index
number formula for this calculation.
Developing historical real value added by industry estimates on a NAICS basis was very
challenging because of the need to develop both industry and commodity price indexes
on a NAICS basis, and to determine the commodity (product) composition of
intermediate inputs for deflation. The latter required input-output use tables on a NAICS
basis before 1997, which were not available at the time. As a result of these source data
limitations, BEA took different approaches for different time periods. In all periods, the
price and quantity indexes for farms, government enterprises, and general government
were obtained directly from the revised SIC-based estimates, since NAICS did not affect
the definitions of these industries. The different approaches for the different time periods
are described below.
Real Estimates for 1987-97
Real estimates (chain-type quantity indexes) of gross output, intermediate inputs, and
value added were prepared for each of the 65 detailed industries and for related industry
groups and aggregates, including private industries and “all industries.” Real value-
added estimates were computed using the double-deflation method after first computing
Fisher price indexes for industry gross output and for intermediate input commodities.
These aggregate price indexes were calculated using the detailed SIC-based price index
series that were matched to the benchmark concordance. The price indexes were
generally available at the same level of detail as the shipments, sales, and receipts data
used to extrapolate the benchmark concordance (see table 2.) The unpublished NAICS-

22
based chain-type quantity indexes for 1997 from the June 2004 release were extrapolated
back to 1987 using the Fisher quantity relatives computed from the current-dollar values
and price indexes.
The double-deflation procedure used for these estimates is a close approximation of the
procedure used for the revised SIC-based estimates, and it is similar to the procedure
currently used for the annual integrated estimates. However, the level of commodity
detail for the deflation of intermediate inputs is less than in either of those other
methodologies. For the deflation of intermediate inputs for 1987-97, I-O use tables were
prepared that show the commodity composition of intermediate inputs--based on about
130 commodities--for each detailed published NAICS industry. The use table for 1997
was based on the published 1997 benchmark I-O accounts. Use tables were developed
for 1992 and for 1987 by converting the published I-O benchmark use tables for those
years from SIC to NAICS at the summary level of detail (about 130 industries and
commodities). Use tables for the other years were developed by linear interpolation
between benchmark years. Commodity price indexes were compiled for about 130
commodities from the price index detail in the benchmark concordance.
Real Estimates for 1947-86
Because of the limited availability of price indexes and input-output tables on a NAICS
basis before 1987, real value added estimates for 1977-86 were computed using a single-
deflation method as opposed to the more data intensive double-deflation method. Single-
deflation is an alternative deflation method recommended by international statistical
organizations when the data needed for the preferred double-deflation method are not
available. Real estimates (chain-type quantity indexes) of value added were prepared for
each of the industries and for related industry groups and aggregates, including private
industries and “all industries.”
Real value-added estimates were computed using a single-deflation method after first
converting SIC-based value-added price indexes to NAICS-based price indexes using the
same set of annual conversion matrices that were used to convert the current-dollar value
23
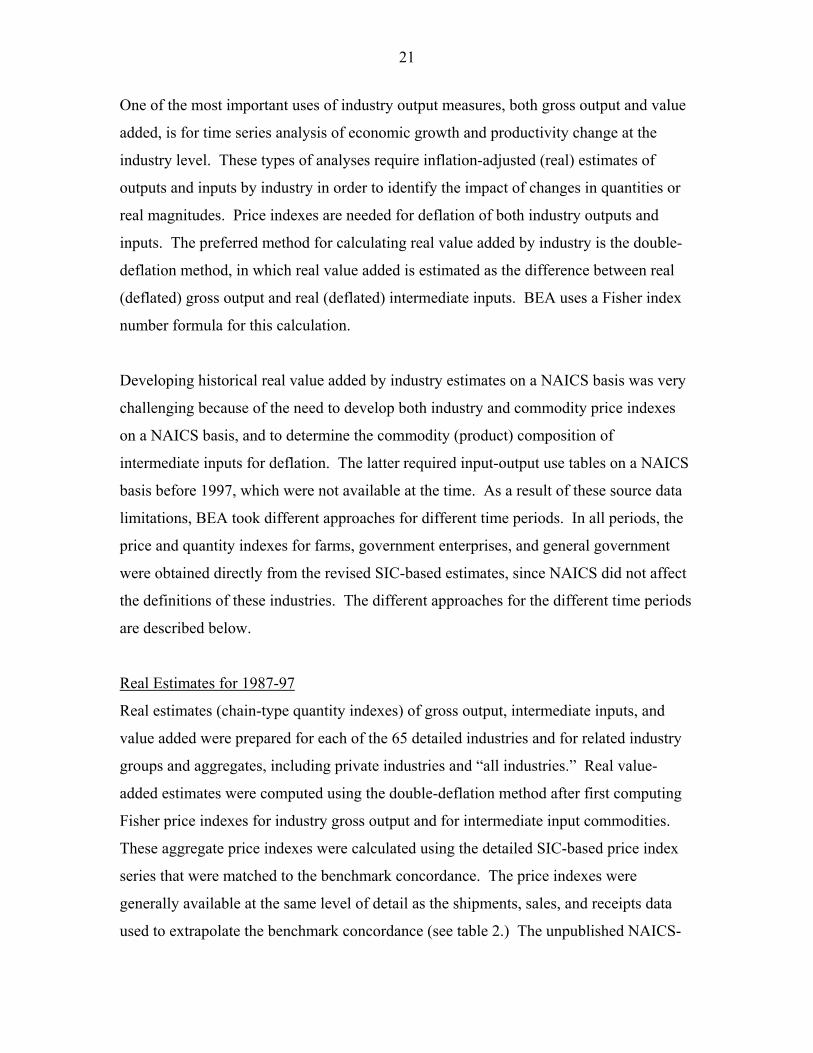
added estimates. This procedure computes the value-added price index relative for each
NAICS industry as a weighted average of the value-added price index relatives for each
of the SIC industries that contribute to the NAICS industry. The weights, which were
obtained from the annual conversion matrices described above, represent the share of a
NAICS industry’s current-dollar value added accounted for by a specific SIC industry
(row coefficients). The following equation describes how the weighted-average value-
added price index relative for period t-1 to t was computed for each NAICS private
nonfarm industry:
ss
Pt
Pt
ns
nPt
Pt
VA
VAw
VA
VA∑= −−
⎟⎟⎠
⎞⎜⎜⎝
⎛=
⎟⎟⎠
⎞⎜⎜⎝
⎛ 60
1 11
and 1,...60neach for / where60
1== ∑
=s
PQns
PQnsns VAVAw
VAPt represents an industry’s value added price index for period t
VAPQ represents an industry’s nominal value added
n represents a NAICS industry and s represents an SIC industry
ns represents a cell in the nominal value added conversion matrix.
The SIC-based value-added price indexes for 1977-87 are the revised indexes that were
released in June 2004 as part of the comprehensive revision of the annual industry
accounts. The SIC-based value-added price indexes for 1947-76 were calculated from
previously published SIC industry estimates that were last updated in July 1988, before
the introduction in 1991 of changes in methodology for real value-added estimates. The
published NAICS-based chain-type quantity indexes for 1987 were extrapolated
(chained) back to 1947 using the value-added quantity relatives computed from the
current-dollar values and price indexes.
Evaluating the results
The converted NAICS estimates were evaluated for reasonableness and consistency
primarily by comparison with other related estimates. Comparisons were made with the
revised SIC-based estimates at aggregate levels and with more detailed industry groups
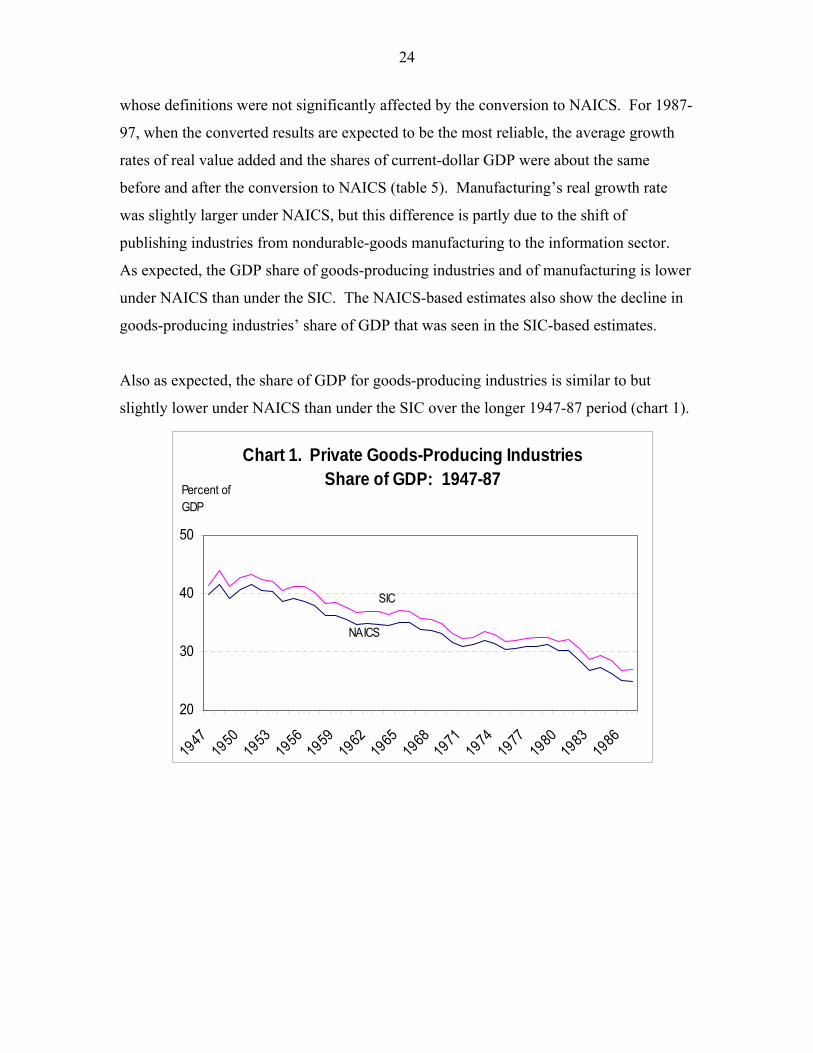
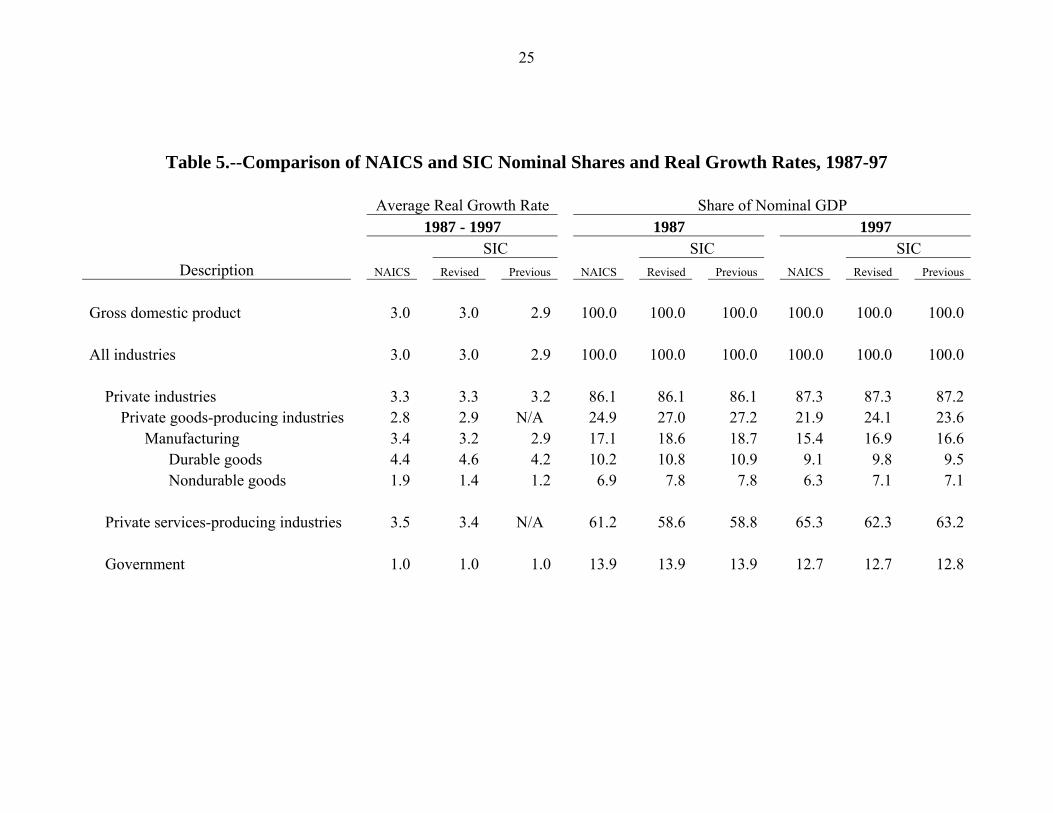
whose definitions were not significantly affected by the conversion to NAICS. For 1987-
97, when the converted results are expected to be the most reliable, the average growth
rates of real value added and the shares of current-dollar GDP were about the same
before and after the conversion to NAICS (table 5). Manufacturing’s real growth rate
was slightly larger under NAICS, but this difference is partly due to the shift of
publishing industries from nondurable-goods manufacturing to the information sector.
As expected, the GDP share of goods-producing industries and of manufacturing is lower
under NAICS than under the SIC. The NAICS-based estimates also show the decline in
goods-producing industries’ share of GDP that was seen in the SIC-based estimates.
Also as expected, the share of GDP for goods-producing industries is similar to but
slightly lower under NAICS than under the SIC over the longer 1947-87 period (chart 1).
Chart 1. Private Goods-Share of GD
20
30
40
50
1947
1950
1953
1956
1959
1962
1965
19
Producing Industries P: 1947-87
6819
7119
7419
7719
8019
8319
86
NAICS
SIC
Percent of GDP
24
25
Table 5.--Comparison of NAICS and SIC Nominal Shares and Real Growth Rates, 1987-97 Average Real Growth Rate Share of Nominal GDP 1987 - 1997 1987 1997 SIC SIC SIC
Description NAICS Revised Previous NAICS Revised Previous NAICS Revised Previous
Gross domestic product 3.0 3.0 2.9 100.0 100.0 100.0 100.0 100.0 100.0 All industries 3.0 3.0 2.9 100.0 100.0 100.0 100.0 100.0 100.0 Private industries 3.3 3.3 3.2 86.1 86.1 86.1 87.3 87.3 87.2 Private goods-producing industries 2.8 2.9 N/A 24.9 27.0 27.2 21.9 24.1 23.6 Manufacturing 3.4 3.2 2.9 17.1 18.6 18.7 15.4 16.9 16.6 Durable goods 4.4 4.6 4.2 10.2 10.8 10.9 9.1 9.8 9.5 Nondurable goods 1.9 1.4 1.2 6.9 7.8 7.8 6.3 7.1 7.1 Private services-producing industries 3.5 3.4 N/A 61.2 58.6 58.8 65.3 62.3 63.2 Government 1.0 1.0 1.0 13.9 13.9 13.9 12.7 12.7 12.8

26
The converse is true for private services-producing industries (chart 2). The NAICS-
based estimates also show the long-term decline in goods-producing industries’ share of
GDP that was seen in the SIC-based estimates. The conversion matrix shares that were
used to allocate SIC-based industry estimates to NAICS industries were held constant for
years before 1977. However, because allocations to more than one detailed NAICS
industry from a single SIC industry usually fell within the same higher-level NAICS
industry group, errors in the allocation matrix tended to cancel one another at the
published industry group level.
Chart 2. Private Services-Producing Industries
Share of GDP: 1947-87
20
30
40
50
60
70
1947
1950
1953
1956
1959
1962
1965
1968
1971
1974
1977
1980
1983
1986
Percent of GDP
SIC
NAICS
Real estimates before 1977. Because the previously published real estimates for years
before 1977 were based on fixed 1982 relative price weights, they are subject to
substitution bias for earlier years that are far from 1982. However, the Fisher aggregation
procedures that were used to prepare the quantity indexes for NAICS industry groups for
1947-76 reduced the impact of the substitution bias. For example, real value added
estimates for the manufacturing industry group for 1947-76 are not affected by
substitution bias to the same degree as the estimates for specific manufacturing
27
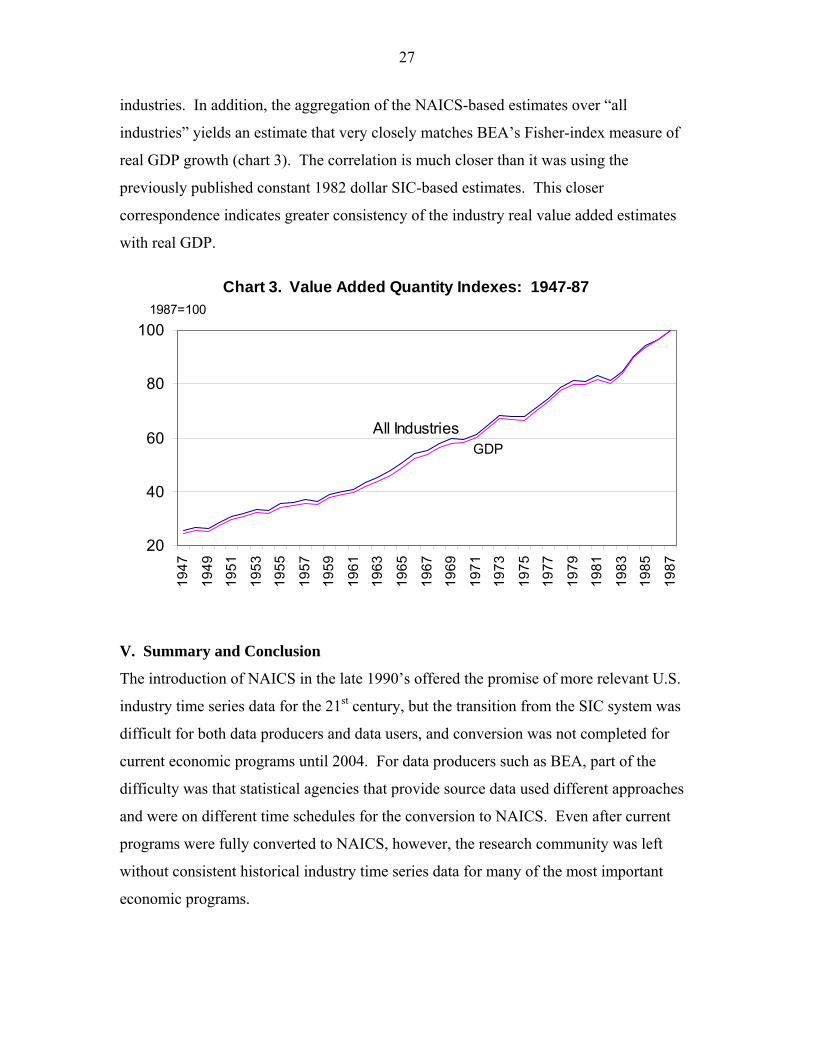
industries. In addition, the aggregation of the NAICS-based estimates over “all
industries” yields an estimate that very closely matches BEA’s Fisher-index measure of
real GDP growth (chart 3). The correlation is much closer than it was using the
previously published constant 1982 dollar SIC-based estimates. This closer
correspondence indicates greater consistency of the industry real value added estimates
with real GDP.
Chart 3. Value Added Quantity Indexes: 1947-87
20
40
60
80
100
1947
1949
1951
1953
1955
1957
1959
1961
1963
1965
1967
1969
1971
1973
1975
1977
1979
1981
1983
1985
1987
1987=100
GDPAll Industries
V. Summary and Conclusion
The introduction of NAICS in the late 1990’s offered the promise of more relevant U.S.
industry time series data for the 21st century, but the transition from the SIC system was
difficult for both data producers and data users, and conversion was not completed for
current economic programs until 2004. For data producers such as BEA, part of the
difficulty was that statistical agencies that provide source data used different approaches
and were on different time schedules for the conversion to NAICS. Even after current
programs were fully converted to NAICS, however, the research community was left
without consistent historical industry time series data for many of the most important
economic programs.

28
For most programs, NAICS could not be implemented on a historical basis due to the
absence of NAICS-based source data before 1997. This problem was especially difficult
for BEA’s GDP-by-industry accounts program because it uses data from a wide variety
of sources along with complex estimation procedures. BEA met the need for historical
industry time series data by developing backcasting procedures that took full advantage
of the existing SIC-based data, used time-varying concordances with variable shares as
far back as possible, and used aggregation as a means of dealing with limitations in the
methodology, especially for early years. Other U.S. statistical agencies faced similar
problems and addressed them in different ways.
Conversion to NAICS has raised new challenges for developing industry time series data,
especially for complex programs such as the industrial production index, GDP-by-
industry, and the BLS industry production accounts that are used for productivity
research, but it has also presented some opportunities for improving methodologies and
changing procedures to incorporate better source data. With the release of the historical
employment estimates in October 2006, BEA completed the conversion of its industry
series from the Standard Industrial Classification (SIC) system to NAICS.6 BLS has
since released manufacturing sector data for production accounts back to 1987.
Extending production accounts to the non-manufacturing sector and to years before 1987
requires joint work between BEA and BLS. BEA has initiated work to develop gross
output estimates back to 1972 that could be used to prepare integrated input-output use
tables. BLS plans to develop output measures for non-manufacturing industries on a
NAICS basis as part of the effort to extend production accounts, and will work closely
with BEA to insure consistency among the historical industry output measures.
6 BEA released estimates of net capital stock, depreciation, and investment by NAICS industry in April 2006. For more information, see http://bea.gov/national/FA2004/index.asp.

29
References
Bayard, Kimberly and Shawn Klimek, 2003, “Creating a Historical Bridge for Manufacturing between the Standard Industrial Classification System and the North American Industrial Classification System,” The Proceedings of the Annual Meeting of the American Statistical Association, August.
Corrado, Carol, 2003, “Industrial Production and Capacity Utilization: The 2002
Historical and Annual Revision.” Federal Reserve Bulletin. April. Corrado, Carol, Paul Lengermann, Eric J. Bartelsman, and J. Joseph Beaulieu, 2006,
“Modeling Aggregate Productivity at a Disaggregate Level: New results for U.S. sectors and industries,” Paper presented at the Conference on Research on Income and Wealth NBER Summer Institute, July 19.
Klimek, Shawn and David Merrell, 2000, “On Reclassifying Industries from Standard Industrial Classification System to the North American Industrial Classification System,” The Second International Conference on Establishment Surveys Proceedings, June. Kort, John R., 2001, “The North American Industry Classification System in BEA’s
Economic Accounts,” Survey of Current Business, May, pp.7-13. Lawson, Ann M., Brian C. Moyer, Sumiye Okubo, and Mark A. Planting, 2006,
“Integrating Industry and National Economic Accounts: First Steps and Future Improvements.” A New Architecture for the U.S. National Accounts, NBER Studies in Income and Wealth, edited by Dale W. Jorgenson, J. Steven Landefeld and William D. Nordhaus. University of Chicago Press.
Lawson, Ann M., Kurt S. Bersani, Mahnaz Fahim-Nader, and Jiemin Guo, 2002,
“Benchmark Input-Output Accounts of the United States, 1997,” Survey of Current Business, December, pp. 19-108.
Morisi, Teresa. 2003. “Recent Changes in the National Current Employment Statistics
Survey.” Monthly Labor Review. June. Moulton, Brent R., Yvon Pho, and Robert E. Yuskavage, 2003, “Major Changes in the
Presentation of the U.S. National Accounts,” Paper prepared for the OECD National Accounts Experts Meeting Session on National Accounts and Economic Statistics, September.
Moyer, Brian C., Mark A. Planting, Paul V. Kern, and Abigail M. Kish, 2004, “Improved
Annual Industry Accounts for 1998-2003: Integrated Annual Input-Output Accounts and Gross-Domestic-Product-by-Industry Accounts,” Survey of Current Business, January, pp. 21-57.

30
Nordhaus, William D., 2002, Productivity Growth and the New Economy," Brookings Papers on Economic Activity 2002(2): 211-265.
Shimberg, Michael, Ruth E. Detlefsen, and William C. Davie, Jr., 2002, “Methods Used
to Develop Retail and Wholesale Time Series Under the North American Industry Classification System.” Paper presented at the 2002 annual meeting of the American Statistical Association.
Smith, George M., Matthew J. Gruenberg, Tameka R. L. Harris, and Erich H. Strassner,
“Annual Industry Accounts: Revised Estimates. 2001-2003,” Survey of Current Business, January, pp 9-43.
Stiroh, Kevin J., 2002, “Information Technology and the U.S. Productivity Revival: What
Do the Industry Data Say?,” American Economic Review, 92(5), December 2002b, 1559-1576.
Stiroh, Kevin J., 2006, “The Industry Origins of the Second Surge of U.S. Productivity
Growth,” Federal Reserve Bank of New York, Mimeo, July 2006b. Triplett, Jack E. and Bosworth, Barry P. 2004. Productivity in the U.S Services Sector:
New Sources of Economic Growth. Brookings Institution Press: Washington, DC.
Yuskavage, Robert E. and Yvon H. Pho, 2004, “Gross Domestic Product by Industry for 1987-2000,” Survey of Current Business, November, pp. 33-53.
Yuskavage, Robert E. and Mahnaz Fahim-Nader, 2005, “Gross Domestic Product by
Industry for 1947-86,” Survey of Current Business, December, pp. 70-84.
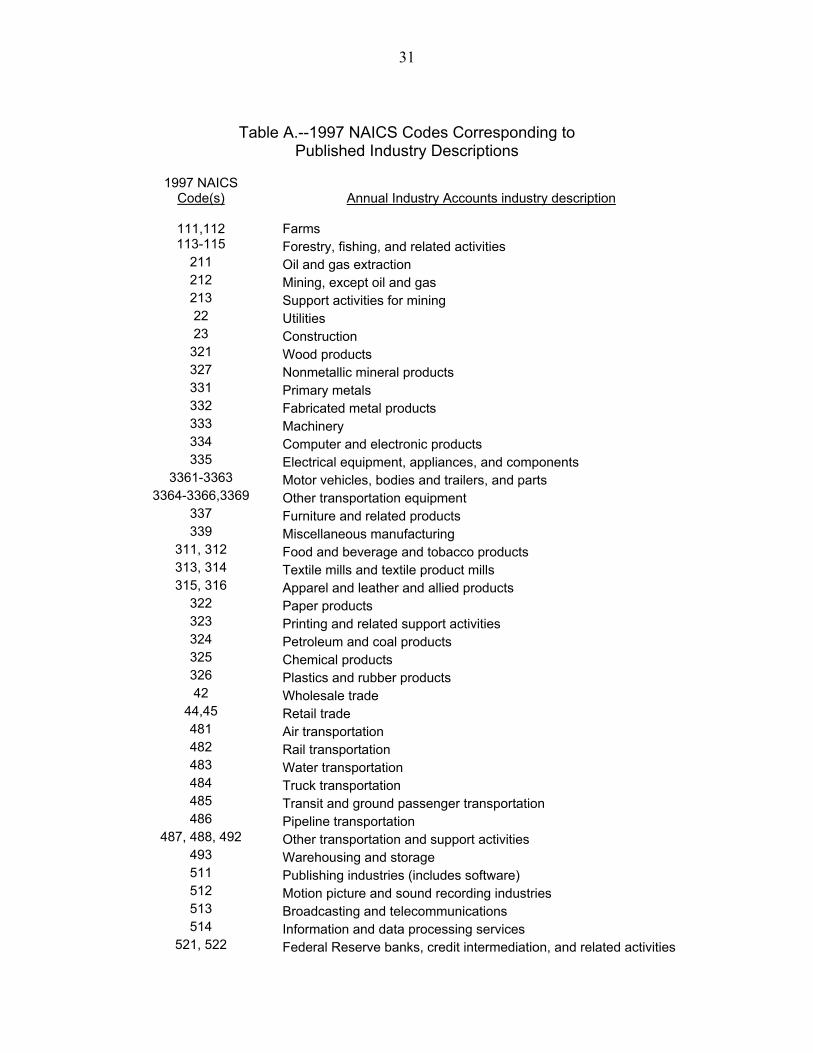
31
Table A.--1997 NAICS Codes Corresponding to Published Industry Descriptions
1997 NAICS
Code(s) Annual Industry Accounts industry description
111,112 Farms 113-115 Forestry, fishing, and related activities
211 Oil and gas extraction 212 Mining, except oil and gas 213 Support activities for mining 22 Utilities 23 Construction
321 Wood products 327 Nonmetallic mineral products 331 Primary metals 332 Fabricated metal products 333 Machinery 334 Computer and electronic products 335 Electrical equipment, appliances, and components
3361-3363 Motor vehicles, bodies and trailers, and parts 3364-3366,3369 Other transportation equipment
337 Furniture and related products 339 Miscellaneous manufacturing
311, 312 Food and beverage and tobacco products 313, 314 Textile mills and textile product mills 315, 316 Apparel and leather and allied products
322 Paper products 323 Printing and related support activities 324 Petroleum and coal products 325 Chemical products 326 Plastics and rubber products 42 Wholesale trade
44,45 Retail trade 481 Air transportation 482 Rail transportation 483 Water transportation 484 Truck transportation 485 Transit and ground passenger transportation 486 Pipeline transportation
487, 488, 492 Other transportation and support activities 493 Warehousing and storage 511 Publishing industries (includes software) 512 Motion picture and sound recording industries 513 Broadcasting and telecommunications 514 Information and data processing services
521, 522 Federal Reserve banks, credit intermediation, and related activities
32
Table A.--1997 NAICS Codes Corresponding to Published Industry Descriptions
1997 NAICS
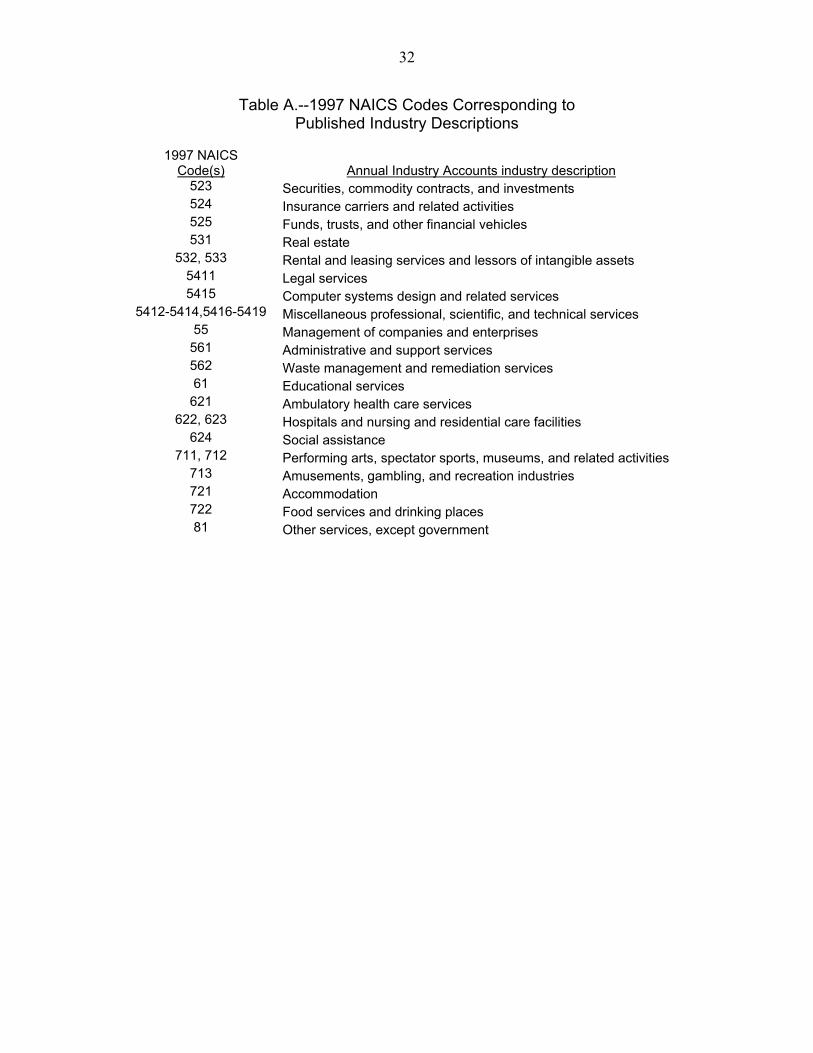
Code(s) Annual Industry Accounts industry description 523 Securities, commodity contracts, and investments 524 Insurance carriers and related activities 525 Funds, trusts, and other financial vehicles 531 Real estate
532, 533 Rental and leasing services and lessors of intangible assets 5411 Legal services 5415 Computer systems design and related services
5412-5414,5416-5419 Miscellaneous professional, scientific, and technical services 55 Management of companies and enterprises
561 Administrative and support services 562 Waste management and remediation services 61 Educational services
621 Ambulatory health care services 622, 623 Hospitals and nursing and residential care facilities
624 Social assistance 711, 712 Performing arts, spectator sports, museums, and related activities
713 Amusements, gambling, and recreation industries 721 Accommodation 722 Food services and drinking places 81 Other services, except government
33
Table B.--1987 SIC Codes Corresponding to
Published Industry Descriptions
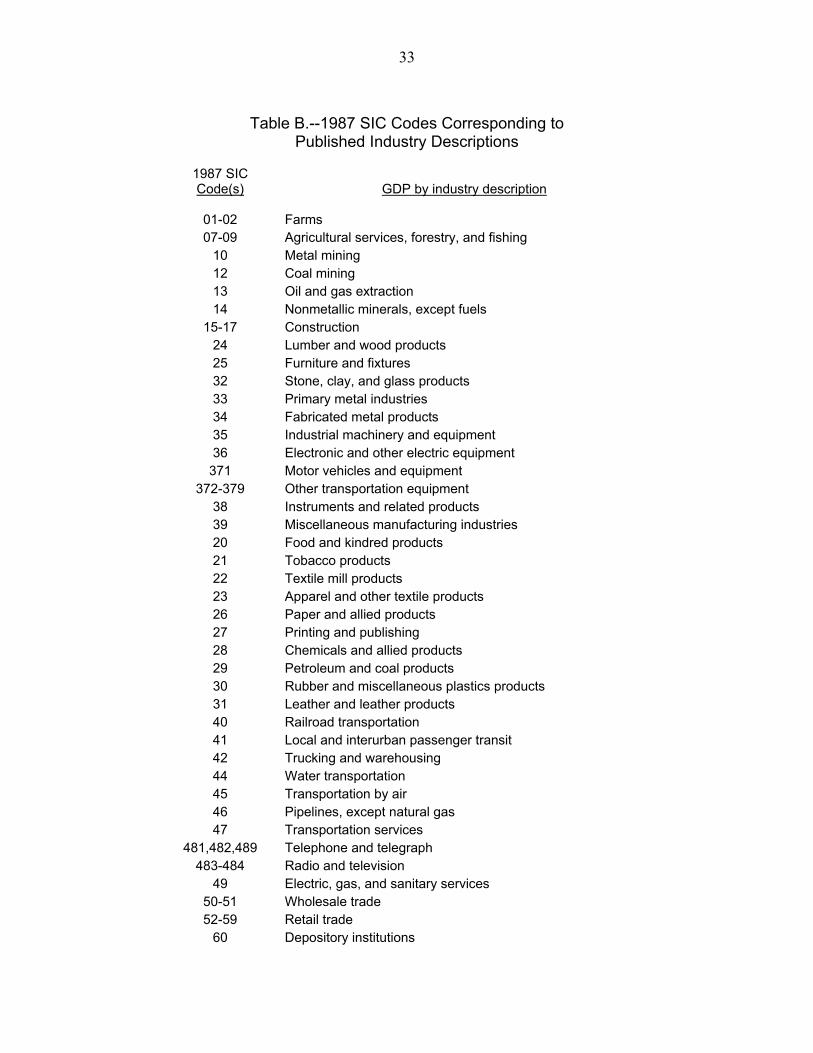
1987 SIC Code(s) GDP by industry description
01-02 Farms 07-09 Agricultural services, forestry, and fishing
10 Metal mining 12 Coal mining 13 Oil and gas extraction 14 Nonmetallic minerals, except fuels
15-17 Construction 24 Lumber and wood products 25 Furniture and fixtures 32 Stone, clay, and glass products 33 Primary metal industries 34 Fabricated metal products 35 Industrial machinery and equipment 36 Electronic and other electric equipment
371 Motor vehicles and equipment 372-379 Other transportation equipment
38 Instruments and related products 39 Miscellaneous manufacturing industries 20 Food and kindred products 21 Tobacco products 22 Textile mill products 23 Apparel and other textile products 26 Paper and allied products 27 Printing and publishing 28 Chemicals and allied products 29 Petroleum and coal products 30 Rubber and miscellaneous plastics products 31 Leather and leather products 40 Railroad transportation 41 Local and interurban passenger transit 42 Trucking and warehousing 44 Water transportation 45 Transportation by air 46 Pipelines, except natural gas 47 Transportation services
481,482,489 Telephone and telegraph 483-484 Radio and television
49 Electric, gas, and sanitary services 50-51 Wholesale trade 52-59 Retail trade
60 Depository institutions
34
Table B.--1987 SIC Codes Corresponding to Published Industry Descriptions
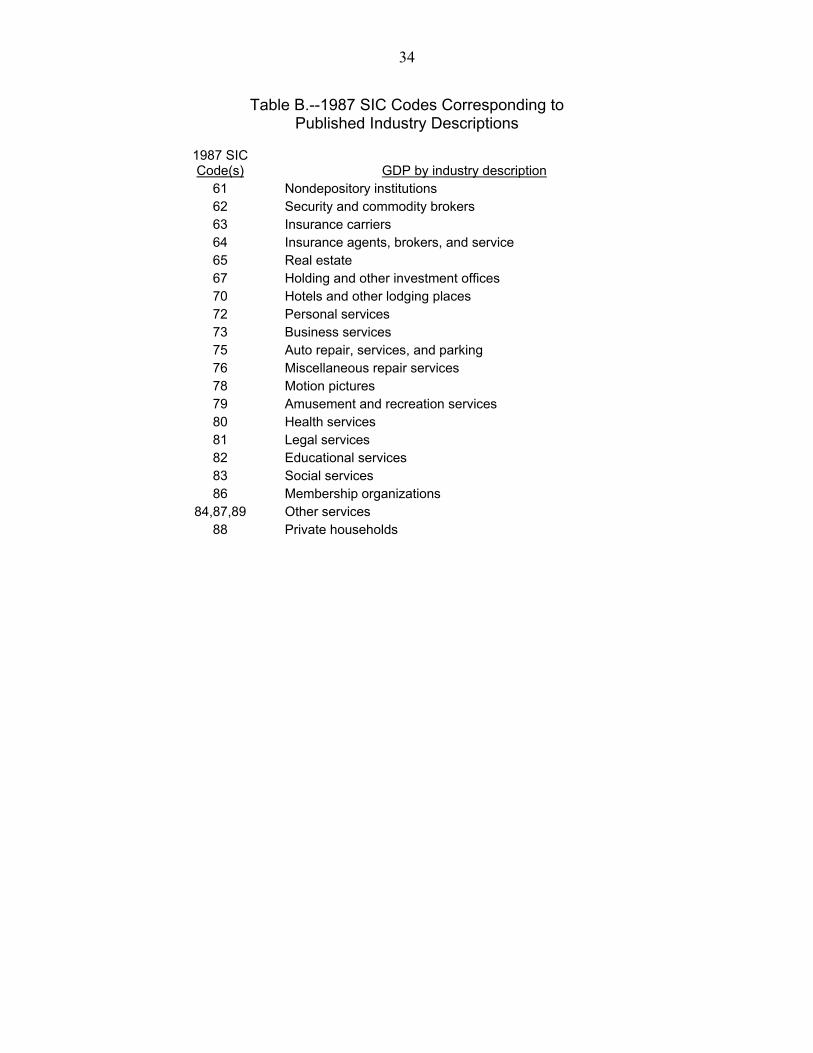
1987 SIC Code(s) GDP by industry description
61 Nondepository institutions 62 Security and commodity brokers 63 Insurance carriers 64 Insurance agents, brokers, and service 65 Real estate 67 Holding and other investment offices 70 Hotels and other lodging places 72 Personal services 73 Business services 75 Auto repair, services, and parking 76 Miscellaneous repair services 78 Motion pictures 79 Amusement and recreation services 80 Health services 81 Legal services 82 Educational services 83 Social services 86 Membership organizations
84,87,89 Other services 88 Private households
35
Table C.--1972 SIC Codes Corresponding to
Published Industry Descriptions
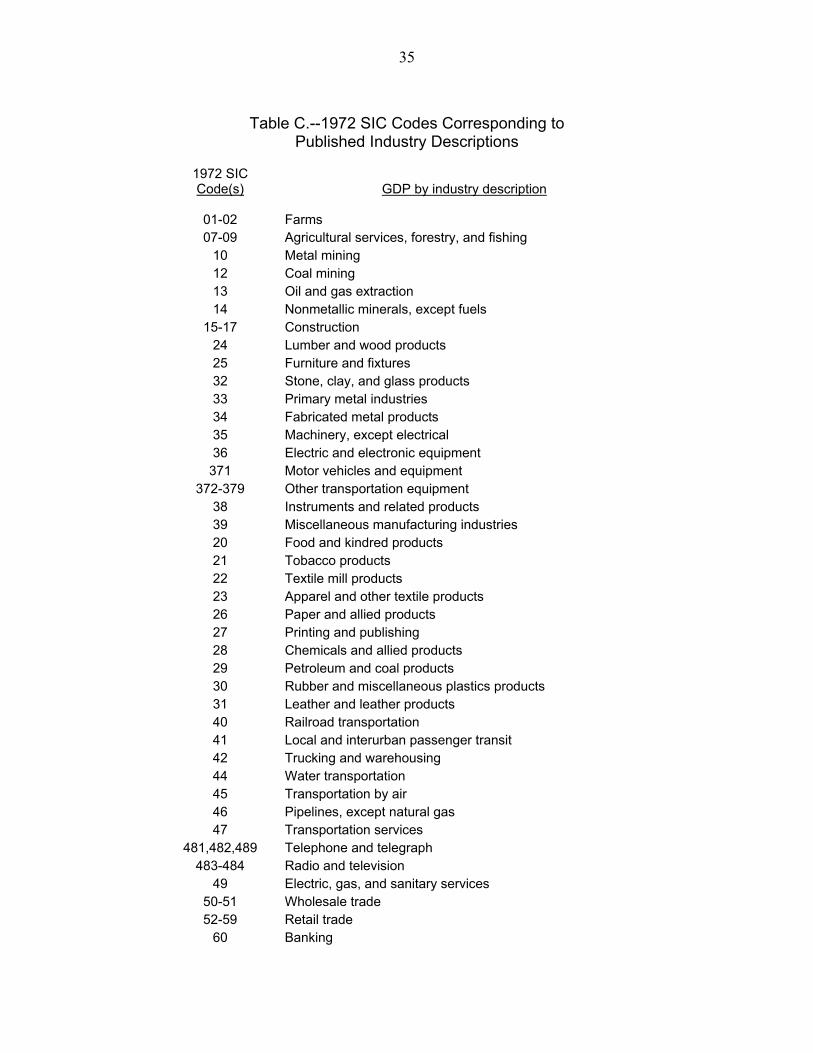
1972 SIC Code(s) GDP by industry description
01-02 Farms 07-09 Agricultural services, forestry, and fishing
10 Metal mining 12 Coal mining 13 Oil and gas extraction 14 Nonmetallic minerals, except fuels
15-17 Construction 24 Lumber and wood products 25 Furniture and fixtures 32 Stone, clay, and glass products 33 Primary metal industries 34 Fabricated metal products 35 Machinery, except electrical 36 Electric and electronic equipment
371 Motor vehicles and equipment 372-379 Other transportation equipment
38 Instruments and related products 39 Miscellaneous manufacturing industries 20 Food and kindred products 21 Tobacco products 22 Textile mill products 23 Apparel and other textile products 26 Paper and allied products 27 Printing and publishing 28 Chemicals and allied products 29 Petroleum and coal products 30 Rubber and miscellaneous plastics products 31 Leather and leather products 40 Railroad transportation 41 Local and interurban passenger transit 42 Trucking and warehousing 44 Water transportation 45 Transportation by air 46 Pipelines, except natural gas 47 Transportation services
481,482,489 Telephone and telegraph 483-484 Radio and television
49 Electric, gas, and sanitary services 50-51 Wholesale trade 52-59 Retail trade
60 Banking
36
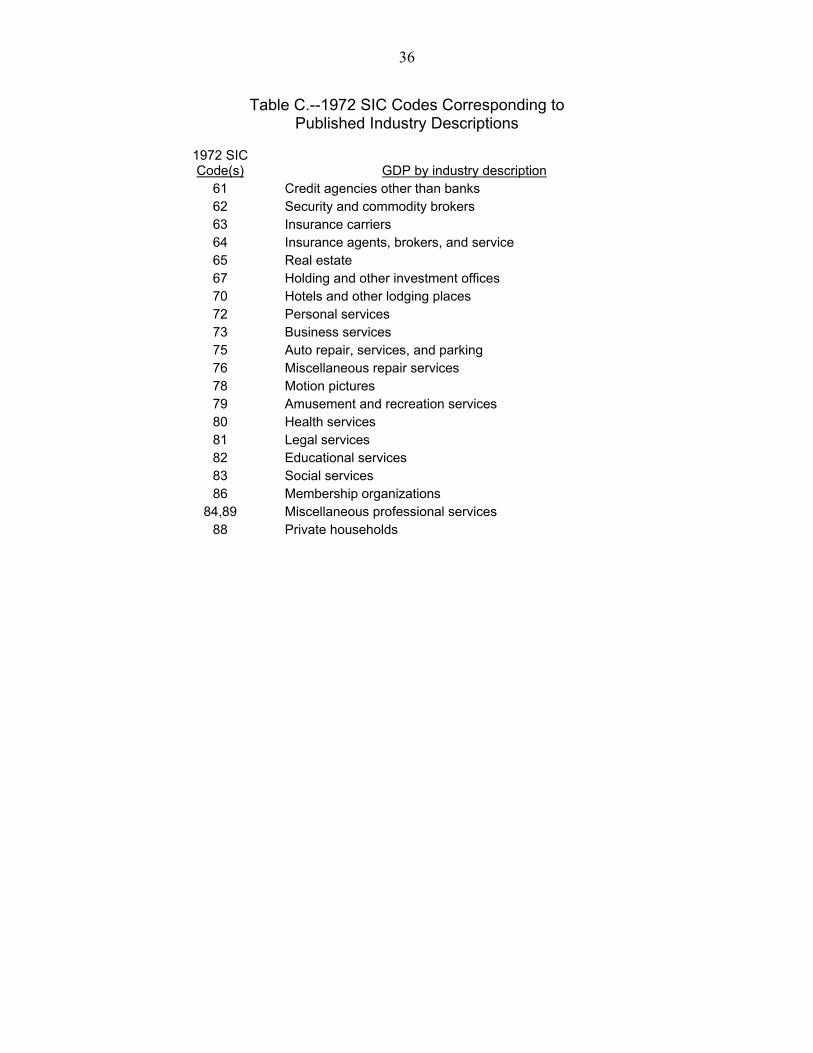
Table C.--1972 SIC Codes Corresponding to Published Industry Descriptions
1972 SIC Code(s) GDP by industry description
61 Credit agencies other than banks 62 Security and commodity brokers 63 Insurance carriers 64 Insurance agents, brokers, and service 65 Real estate 67 Holding and other investment offices 70 Hotels and other lodging places 72 Personal services 73 Business services 75 Auto repair, services, and parking 76 Miscellaneous repair services 78 Motion pictures 79 Amusement and recreation services 80 Health services 81 Legal services 82 Educational services 83 Social services 86 Membership organizations
84,89 Miscellaneous professional services 88 Private households


