

Copyright Warning & Restrictions
The copyright law of the United States (Title 17, United States Code) governs the making of photocopies or other
reproductions of copyrighted material.
Under certain conditions specified in the law, libraries and archives are authorized to furnish a photocopy or other
reproduction. One of these specified conditions is that the photocopy or reproduction is not to be “used for any
purpose other than private study, scholarship, or research.” If a, user makes a request for, or later uses, a photocopy or reproduction for purposes in excess of “fair use” that user
may be liable for copyright infringement,
This institution reserves the right to refuse to accept a copying order if, in its judgment, fulfillment of the order
would involve violation of copyright law.
Please Note: The author retains the copyright while the New Jersey Institute of Technology reserves the right to
distribute this thesis or dissertation
Printing note: If you do not wish to print this page, then select “Pages from: first page # to: last page #” on the print dialog screen

The Van Houten library has removed some of the personal information and all signatures from the approval page and biographical sketches of theses and dissertations in order to protect the identity of NJIT graduates and faculty.
ABSTRACT
This study investigates the preformance of a 1-inch
long 4-vane open impeller centrifugal pump under two phase .
flow conditions. The paddle wheel purr, as branded by its
manufacturer the Worthington Corporation, had a specific
speed of 3400 (based on gallons per minute, feet of water
and revolutions per minute) corresponding to a 7-inch im-
peller diameter. A l/8-inch perforated steel pipe carried
the compressed air to within four inches of the impeller eye
where the air was injected in to the water stream (See figures
18 and 20).
The three variable inputs were, water flow rate, pump
speed and air flow rate. The output parameters measured
were discharge, suction pressure, and torque. While
measuring the output parameters, various combinations of the input
variables were employed in order to find the maximum
air-water volumetric ratio at which water flow stopped and the
discharge head dropped to zero.
At the pump speeds and air flow rates ranging from -3
1500 RPM to 3500 RPM and from 1,72x10 cubic feet/second.
i

to 2.61-x10-3
cubic feet/second respectively, it was found
that increasing the water flow rate from zero capacity to
a certain limit resulted in an increase of the discharge
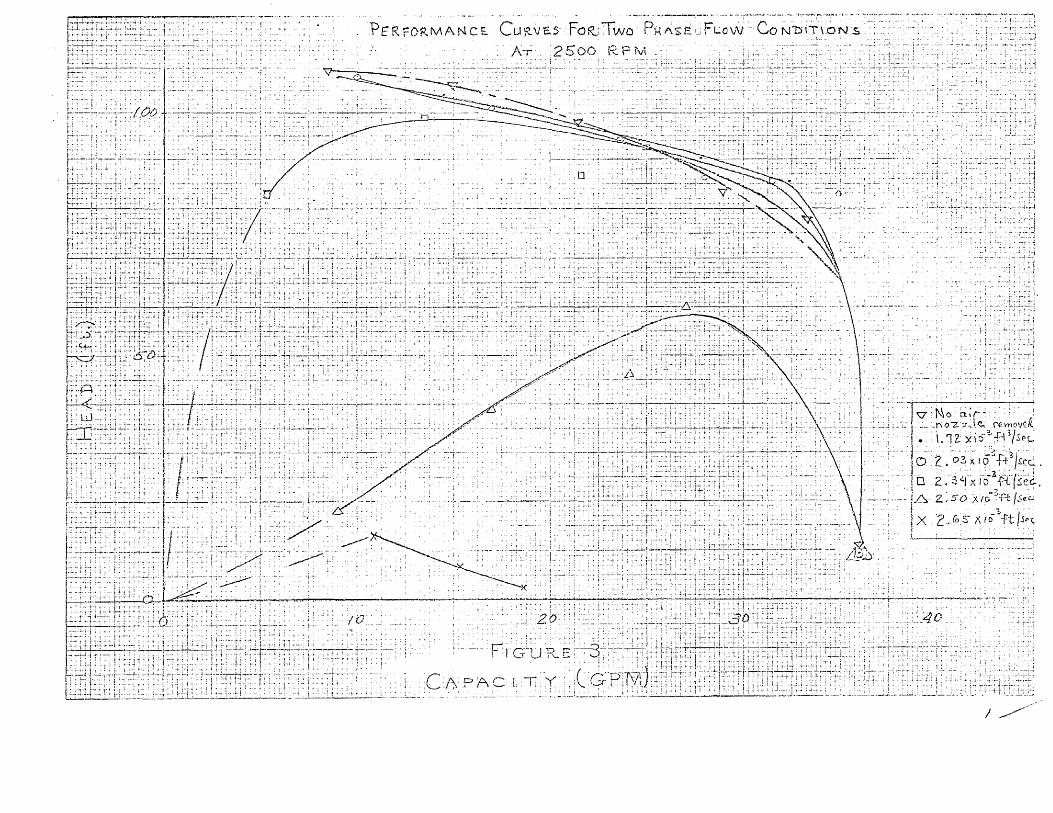
head (See figures 1 to 5). This limiting capacity varied
from 40 to 60 per cent of the pump's design capacity (35
GPM at 3550 FPM and 220 feet of water). A further increase
of the water flow rate beyond the limiting capacity resulted
in a quick drop of the discharge head. This characteristic
behavior of the head-capacity curve was particularly
no-ticeable at the higher air flow rates which ranged from
-3 1.72x10 cubic feet/second to 2.65x10 cubic cubic feet/second.
It was also observed that at a given pump speed, increasing
the volumetric air flow rate caused the head-capacity curve
to peak at a lower discharge pressure. Finally, increasing
the air content: caused a shift in the efficiency curves
such that peaked at a lower efficiency value as well as a
lower flow capacity.
ii

THE EFFECTS OF AIR-WATER TWO PHASE FLOW ON THE PREFORMANCE
OF A CENT RIFUGAL PUMP
BY
KARNING EKIZIAN
A THESIS
PRESENTED IN PARTIAL FULFILIMENT OF
THE REQUIREMENTS FOR THE DEGREE
MASTER OF SCIENCE IN MECHANICAL ENGINEERING
2NT
NEWARK COLLEGE OF ENGINEERING
This thesis is to he used only with due regard to the rights of the author. Bibliographical references may be noticed, but passages must not be cpied without permission of the College and without credit being given in subsequent written or published work.
o ark, New 1968

APPROVAL OF THESIS
THE EFFECTS OF AlR - WATER TWO PHASE FLOW ON THE
PERFORMANCE OF A CENTRIFUGAL PUMP
EY
KARNIG EKIZIAN
DEPARTMENT OF MECHANICAL ENGINEERING
NEWARK COLLEGE OF ENGINEERING
BY
FACULTY COMITTEE
APPROVED:
NEWARK, NEW JERSEY
JUNE, 1970

iv
PREFACE
This study was performed to determine the effect
of injecting a variable amount of compressed air into the
water stream prior to introduction into the impeller eye
of a 1-inch open impeller centrifugal pump. The effects of
air content and pump speed on the discharge head and pump
efficiency were tested. In addition, the optimal two-phase
flow parameters were determined and compared with the no-air
flow parameters..
Literature on the subject of two-phase flow is
extensive in regard to such flows in regard to such flows in
packed beds, ducts, and pipes. However, very little
experimental or theoretical research has been done on
two-phase flow in pumps. Most notable of these are Pumps and
Blowers- Two Phase Flow by A.J. Stepanoff(1)*,Air Handling Capability
of Centrifugal Pumps by W. Biheller (2) Hydrodynamics of Float -
ation Cells by N. Albiter, C. C. Harris, and. R.FF. Yap (3)
and A Practical Three-Dimensional Flow Visualization Approach
to the Complex Flow Characteristics in a Centrifufal Impeller
by M. P. Boyce (4)
•
*The numbers in parenthesis refer to the list of references given or page 77.

V
ACKNOWLEDGEMENTS
The author is indebted to Dr. r.J. Raco, Dr. M.
J. Levy, Professor R.M. Jacobs and Professor J.L. Polaner
of Newark College of Engineering for thei. helpful advice,
guidance and suggestions. He also wishes to thank the
Worthington Corporation for donating the pump, W. Schmie
deskamp and his staff of Newark College of Engineering
for their technical work on the apparatus, and R. Rabin
and Jon Simonian who read the manuscript a number of times.
TABLE OF CONTENTS
ABSTRACT
PREFACE iv
ACKNOWLEDGEMENTS
TABLE OF CONTENTS vi
LIST OF TABLES
LIST OF FIGURES
CHAPTER
INTRODUCTION 1
Statement of the Problem 1
Importance & limitations of Study 1
A Preview 3
List of Notation 5
REVIEW OF THE LITERATURE 7
PRELIMINARY WORK 11
IV, EXPERIMENTAL PROCEDURE 14
V DISCUSSION OF RESULTS 16
VI . SUMMARY AND RECOMMENDATIONS 27
Summary 27
Recommendations 2e
APPENDIX
Figures 31
vi

Tabulated Data 55
Calculations 63
Data 70
LIST OF REFERENCES 76

viii
LIST OF TABLES
Table Page
1. Calibration of Suction Pottermeter 55
Calibration of Orifice 56
Conversion of Pressure Differential Across
Orifice to ft3/sec of 1\ir 57
Tabulated Data at 3500 RPM 58
V. Tabulated Data at 3000 RPM 59
VI, Tabulated Data at 2500 RPM 60
VII, Tabulated Data at 2000 RPM 61
Tabulated Data at 3.500 RPM 62

LIST OF FIGURES
Figure Page
1. Performance Curves for Two Phase Flow Conditions at 3500 RPM 31
2 Performance Curves for Two Phase Flow Conditions at 3000 RPM 32
3. Performance Curves for Two Phase Flow Conditions at 2500 RPM 33
4. Performance Curves for Two Phase Flow Conditions at 2000 RPM 34
5. Performance Curves for Two Phase Flow Conditions at 1500 RPM 35
6, Efficiency Curves for Two Phase Flow Conditions at 3500 RPM 36
7. Efficiency Curves for Two Phase Flow Conditions at 3000 RPM 37
8. Efficiency Curves for Two Phase Flow Conditions at 2500 RPM 38
9, Efficiency Curves for Two Phase Plow Conditions at 2000 PPM 39
10. Efficiency Curves for Tyro Phase Flow Conditions at 1500 RPM 40
11, Suction Head-Capacity Curves for To Phase Flow Conditions at 3500 RPM 41
12. Suction Head-Capacity Curves for Two Phase Flow Conditions at 3000 PM 42
13. Suction Head-Capacity Curves for Two Phase Flow Conditions at 2500 RPM 43
ix

Figure Page
14. Suction Head-Capacity Curves for Two Phase Flow Conditions at 2000 RPM 44
15. Suction Head-Capacity Curves for Two Phase Flow Conditions at 1500 RPM 45
16. Calibration Curve for Turbine Meter 46
17. Calibration Curve for Orifice 47
17-A. A Qualitative Relationship Between the Radius of Ring of Air Bubbles Inside Casing and Flow Capacity 48
18. Symbolic Diagram of Apparatus, 49
19, Pump Casing and Impeller 50
20, The Air Injection System 51
21. The Orifice and the Air Flow Measuring Unit 52
22. An Illustration of the Hellical Stream- line with trapped air bubbles 53
23. Air Bubbles Surrounding the Impeller Eye 54

CHAPTER I
INTRODUCTION
Statement of the Problem. The purpose of this study
was to investigate the factors that limited the performance
of the 1-inch long, open impeller centrifugal pump which
was tested under air-water two phase flow conditions. Since
there is an appreciable loss of discharge head with increased
air flaw rate, the study was aimed at determining the
maxi-mum possible air flow rate at each speed without sacrificing
the developed head considerably.
This study attemps to define and explain unstable flow
conditions caused by the accumulation of air at the impeller
eye. In addition, discrapancies between this study end
existing literature on the "breaking" of the head-capacity
curve will be discussed. Finally, the effect of pump speed
on the amount of air introduced will be investigated.
Importance and Limitations of the Study There has been
a considerable amount of experimental and theoretical work
performed on two phase flow in packed beds, ducts, and pipes,
but very little research has been done on two phase flow
in centrifugal pumps. The existing studies do not investigate

the pump flow parameters, namely the pump speed and water
flow rate at which the air-handling capability of the pump
is optimized. Moreover, these studies do not treat the
pump speed as a variable parameter, whereas the effect of
various pump speeds on the performance of the pump was one
of the goals of this thesis.
Two phase flow in pumps has important industrial
uses, in transporting mixtures of petroleum oil and natural
gas. This case is one example where the separation of time
gaseous and liquid phases at slower velocities complicates
the estimation of the pipe frictional losses.
The results of this study were limited to the type
of pump used. Comparison of the results of this study with
those by Biheller1 of the Worthington Corporation indicated
that the design of the pump casing and the impeller vanes
were the crucial factors for improving the air handling
capability of the pump. This was evident in the maximum
air-water volumetric ratio attained by Biheller (12) as
compared to a ratio of 6.8% achieved in this present study.
W. Biheller, "Air Handling Capability of Centrifugal Pumps", Worthington Corporation Research Paper (Harrison, N.J., 1957)
2

Despite these limitations, this present study
proved the usefulness of furthering. the investigation of
two-phase flow in pumps. While this present study clarified
certain questions, it opened additional areas for further
study. Detailed recommendations relative to structural
changes in the apparatus (See figure 18) and a different
experimental procedure are made in Chapter VI under summary.
A Preview Chapters II, III, and IV discuss the
literary survey, the preliminary work on the apparatus, and
the experimental procedure respectively, Chapter V,
entitled "Discussion of Results", is given an extensive
treatment. This chapter begins with a discussion of the
factors that limit the performance of the centrifugal pump
under two-phase flow conditions. One of these factors, the
maximum possible air flow, is discussed in detail(See pages
17-20), and compared with Biheller's study. This is followed
by a description of the unstable flow condition and how it
is affected by the pump geometry (See page 20). A comparison
of the pump performance curves is made between this study and
Stepanoff's2. Following this, flow parameters are determined
A.J. Stepanoff, Pumps and Blowers-Two Phase Flow, (New York: John Wiley and Sons, 1966) p.262
3

which optimize the air handling capability of the pump.
Finally, chapter VI summarizes the findings of this present
study and also recommends areas for further research and
desired changes in the apparatus and the experimental
procedure.
4

5
LIST OF NOTATION

6

CHAPTER II
Review of the Literature
Many analytical studies have been undertaken in
two-phase flows. Most of these analyses are restricted
to two-phase flows in pipes, ducts and packed beds, whereas
very little research has been done on the air handling
capability of centrifugal pumps. The limited studies
available, analyse the means of improving the air handling
capability of centrifugal pumps using such parameters as
the geometry of the pump impeller and the casing, the suction
pressure, and vane geometry. None of the studies investigates
the air handling capability of centrifugal pumps under a
variable pump speed. Consequently the question arises
whether there is an optimal pump speed at which a maximum
amount of air can be discharged without affecting the
performance of the pump considerably.
The following is a brief summary of the existing
experimental and theoretical work on two-phase flow in
centrifugal pumps. Stepanoff1, in investigating two-phase
flow, concluded that "the ability of centrifugal pumps to
A J.Stepanoff, Pumps and Blowers--Two-Phase Flow John Wiley & Boas, Inc. New York, 1966, p.262
7
8
pump entrained gases is limited." He was able to attain
an air-water volumetric ratio of 14% with a head-capacity
curve that dropped with increasing air flow. In addition,
the efficiency curve peaked at a lower capacity as the
air-water volumetric ratio increased. He concluded that
"the most important element controlling the volume of
entrained gas is the suction pressure."2 Stepanoff also
stated that the breaking of the head-capacity curve, it is
estimated, occurs when the volume of air equals to that of
water.3 Finally, according to Stepanoff, the importance of
studying two-phase flow in centrifugal pumps is based upon
its industrial uses in addition to its scientific value. He
cited as an example the complications in estimating pipe
friction losses when a mixture of natural gas and oil is
flowing through pipe lines.
The Biheller study4 involved primarily the improvement
of air handling pump capability by using various impeller
and pump casing configurations. Among the various changes
tried were the impeller size, number of vanes, open or closed
Ibid., loc. cit. pp. 262 - 272 Ibid., p. 263 W. Biheller, "Air Handling
Capability of CentrifugalPumps, Worthington Corporation Research Paper (Harrison, N.J. 1957)

impeller, suction and eye diameter, lenght of vanes and
volute casing. An impeller with short, curved vanes enabled
the pump to discharge an air-water mixture containing 12%
air by volume. Moreover, there was close agreement between
Stepanoff and Biheller in regard to the general shape of the
pump performance curves. Biheller found that the short
curved vane configuration of the impeller minimized the inter-
ference between the vanes and the air bubbles, thus facili-
tating their discharge. Among his other recommendations to
improve the air handling characteristics of the pump were
"a more circular volute", and "a circular shaped spiraled
volute."
Arbiter, Harris end Yap5, in studying the effects of
aeration on the power reqirements and solid suspension
characteristics of floatation cells, briefly discussed two-
phase flow in small centrifugal pumps. They derived an equa-
tion where water flow rate is a function of the air flow rate
and certain pump design constants, Expressing their collation
with the nomenclature of this study yields
N, Arbiter, C.C. Harris, and R.F. Yap "Hydrodynamics and Floatation Cells" Henry Krumb School of Mines, Columbia University, New York, Jan 1968, P.S.

10
Here a and b are pump geometric constants, Wc is the minimum
rotational speed for liquid flow, axle, D3 is introduced for
dimensional balance. This equation was not the result of
any direct experimental investigation. It was based on
the mass conservation equation and another equation expres-
sing the total fluid as the sum Of the air and water flows.
Attempts to verify this equation by direct substitution of
the result of the present study were unsuccessful. Arbiter
et al did not verify this equation either, "no experiments
were performed with scaled pumping equipment, so that the
equation is not completely established"8.
8 Ibid. loc. cit.

CHAPTER III
Preliminary Work
The construction of the entire apparatus as shown
in Figure 18, can be divided into three phases: the erection
of the pipe network, the design and calibration of the
flow meters, and finally some modifications to improve the
performance of the total system.
Galvanized 14 inch steel pipe constituted the water
pipeline while the air line was of 1-inch galvanized steel
pipe. The water pipeline was an uncompressed, closed loop,
feeding water to the pump from a 500-gallon tank and
discharging it into the same reservoir (See figure 18).
Two flow meters were employed:a turbine meter,
manufactured by the Potter Aeronautical Co. and commercially
known as Pottermeter was used to measure the water flow
rate, and an orifice was used to measure the air flow rate
(See figure 21.). The turbine meter was calibrated by means
of a stop watch, a weighing tank, and an electronic counter.
Three groups of data were taken and a straight line calibra-
tion curve of electronic counts versus water flow rate in
11

in gallons per minute was obtained (See figure 16).
The ASME Power Test Code for flow meters measuring
compressible fluids was used for calibrating the orifice.
Certain geometric constants, e.g. inside diameter of pipe,
orifice throat diameter, and an air reservoir pressure of
25 Psig were used to obtain this calibration curve. The
calibration curve was derived from the calculations (See
page 62) giving a plot of pounds of air per hour versus
the pressure differential across the orifice where the
pressure differential was measured by a mercury manometer
(See figure 17).
During the first part of the experimentation,
modi-fications in the form of additions and eliminations of
certain components to the test apparatus (See figure 18)
were found to be necessary. Water accumulated in the mer-
cury manometer (See figure 21). This was attributed to
water flowing back into the air line up to the vicinity of
the orifice. Since the pressure taps across the orifice
protruded from the lower part of the pipe, the water that
accumulated flowed down through these taps and into the
mercury manometer. To remedy the situation, these taps
were made to protrude from the upper section of the air
12

13
line (See figure 21), and in addition, two traps were
assembled and placed one on each side of the manometer
(See figure 21). Thus the problem of water accumulation
was eliminated.
A second turbine meter, initially installed on the
discharge side of the pump some forty diameters away was
intended to measure the combined air-water flow rate. It
proved to be useless as it was inconsistent in measuring the
mixed air-water flow. The inconsistencies were caused by
air bubbles impacting the rotating blades of the meter.
Consequently, the turbine meter installed in the low-pressure
side of the pump was used to measure the water flow
(See figure 18).

CHAPTER IV
Experimental Procedure
The test plan consisted of operating the pump at
five different speeds: 1500, 2000, 2500, 3000, and 3500
RPM, the latter being the optimal speed of the pump at
no—air flow conditions. At each speed air was injected
into the suction pipe four inches before entering the im-
peller eye at the following volumetric flow rates: 1.4,
1.72, 2.18, and 2.65x103 ft3/sec. The injection was made
through a perforated 1/8-inch steel pipe with a conic piece
of brass attached to its end to minimize turbulence ( See
Figure 20).
The experimental procedure consisted of a routine
format. All possible combinations of the input variables
pump speed, air flow rate and water flow rate were employed
to determine their effect on the output parameters discharge
pressure, suction pressure and torque. As the experiment
progressed, the minimum possible air flow rate at a given
pump speed and air flow became important. As the water
flow rate was reduced further, the air-water volumetric
ratio increased (air flow was constant while water flow
14

decreased), thus air became the predominate phase and the
pump became air-bound (See Figures 1 to 5). This pheno-
menon is refered to as an unstable flow condition because
the pump could no longer discharge the two phase mixture.
The same phenomenon occured when the maximum possible air
flow rate (2.65x10⁻³ ft3/sec.) was exceeded. At this point
of the experiment the air flow was shut off, allowing the
pump to self-prime and new conditions were chosen. This
unstable flow condition is discussed in detail in Chapter V.
15

CHAPTER V
Discussion of Results
There has been a paucity of research done in two-phase
flow in centrifugal pumps. This chapter consolidates and
extends the existing research. Furthermore, it discusses
some limitations of the earlier investigations end clarifies
perviously unexplained points.
During the experimental stage of the present investi-
gation, it was noticed that two factors limited the perfor-
mance of the centrifugal pump when it vas tested under two
phase flow conditions. The first limiting factor was the
minimum value of the water flow rate just prior to unstable
flow conditions. These flow conditions were characterized
by a gradual and a continuous drop in the discharge pressure
and the water flow rate, even though neither the air flow
nor the water flow were varied. This unstable flow behavior
can also be explained by the Bernoulli ecuation applied
between inlet and outled of the pump:
* Subscripts 1 and 2 refer to flow conditions upstream and downstream respectively relative,to be impeller eye.
16

The sum of the velocity and potential heads, upstream and
downstream relative to the impeller eye, remained constant
during the experiment. Equation (ii) was reduced to
Here the density of the air-water mixture (ϒ) was decreasing
because the volume of air in the mixture was increasing
during the experiment. Thus because the density of the
mixture was decreasing the actual discharge pressure deve-
loped in pumping it also decreased in order to balance
equation (iii) until the pump became air-bound.
At this point, it is appropriate to discuss the reasons
for the increased volume of air in the air-water mixture
at the impeller eye. In this study, the long, mutually
perpendicular structure (See figure 19) of the impeller
vanes disturbed the helical flow pattern around the impeller
(See figure 22) and thus prevented soma of the injected air
from being discharged. The air was trapped between the
individual vanes, and the mixture was churned around inside
the casing of the pump. In order to observe this pheno-
menon, a stroboscope and a Hycam motion picture camera were
used separately. The stroboscope yielded a clearer view
of a larger area than was possible with the Hycam camera.
17

The motion picture camera was used by M. P. Boyce in his
study on three-dimensional flow visualization in a centri-
* fugal impeller (4) . Boyce injected a mixture of dibutyl
phthalate globules and kerosene into the water stream,
seeking to determine whether the globules would follow the
streamlines. In order to accomplish this Boyce used the
Fastax motion picture camera to photograph the globules as
they passed through the impeller. In both studies, that is,
Boyce 's and the present investigation, the pump casing was
replaced by a similarly machined plexiglass casing in order
to make photographing possible. However the absence of a
tripod was one reason why the results of the motion picture
photography of the present study were not in clear focus,
and thus it was decided to use the stroboscope for reasons
already mentioned. With the use of the stroboscope, it
was possible to view the mass of air trapped inside the
casing forming a ring of bubbles whose radius varied
from the hub to the outer tip of the impeller vanes (See
Figure 23 ). It was noticed during the experiment that
the radius of the ring of air bubbles varied directly with
* The number in parentheses indicates the reference given
on page fl.
18

19
the rate of water flow. A qualitative representation of
the relationship between the radius of the ring of air
bubbles and the water flow rate is shown in Figure 17-A.
This ring of bubbles was the main hinderance to the flow
of water, and it eventually resulted in the drop of the water
flow rate, the discharge head, and the suction head. The
blockage offered by the ring of air bubbles to the flow of
water was also a function of the rate of air accumulation in
the impeller eye. This accumulation was the result of
unstable flow conditions where the inflow of air into the
impeller eye exceeded its outflow. This was attributed to
the geometric factors mentioned above in addition to the
suction pressure at the impeller eye which affected the
volume of the air. Hence, a high negative (suction) pressure
resulted in a high volume of air.
Therefore, in summary, the nature of the flow in-
stability stimulated by the increasing volume of air at
the impeller eye was the consequence of two factors. First,
the impeller design prevented some of the air from leaving
the impeller eye. Secondly, the high suction pressure
caused air to occupy most of the volume at the impeller eye
until the pump became air-bound. Further operation of the

20
pump under these conditions proved harmful to the shaft
and the packing. This was due to the fact that the heat
generated by friction was being absorbed by the pump shaft
and the casing, while previously it was being dissipated by
water circulation.
The second limiting factor was the maximum value of
the air flow relative to the water flow rate at a constant
pump speed before the unstable conditions set in. These
unstable flow conditions were the result of the geometry
of the impeller, the insufficient vacuum for self-priming
due to the low density of air, and the incapability of the
pump to discharge all of the injected air. The impact of
these factors on the unstable flow conditions was discussed
previously in explaining the decreasing density of the air-
water mixture.
Because one of the objects of this thesis was to
investigate the air handling capability of the pump, the
second limiting factor, namely' the maximum possible air flow
will be considered in depth. Literature on. the topic of
air-water two-phase flow in centrifugal pumps is very limited.
of the .most relevent studies has been made by W. Biheller
of the Advance Products Division of Worthington Corporation

and by A.J. Stepanoff. The results of Biheller's work
(specifically those relative to the shape of the pump
performance curves, basically agree with the results of
the present study with a few exceptions. Both showed that
the discharge head dropped as the water flow was reduced
manually. This was in contrast to the no-air flow conditions
where the head increased continuously as the water flow was
reduced, In the present study as the water flow was reduced,
the drop of the discharge head started at about 40 to 60
per cent of the pump capacity for an air-water volumetric
ratio of 4.3 to 6.8 per cent (See figure 1-5). However,
the Biheller study showed this drop initiated at a very
low capacity, namely, about 20 per cent1 of the pump capacity
for an air-water volumetric ratio of 6 per cent,
Thus, there was a discrepency between Biheller's
work and this present study in regard to the pump capacity
at which a fixed amount of injected air resulted in the total
loss of the discharge head. This can be explained by the
fact that Biheller used an impeller with short, curved vanes,
His impeller was able to pump air-water mixtures at lower
1W Biheller, " Air Handling Capacity of Centrifugal Pumps" Worthington Corporation Research Paper, (Harrison, N.J., 1957), p.p.9

22
flow capacities than those achieved by the pump used in
the present study because its vane configuration facilitated
the discharge of air bubbles from the impeller eye. This
would also explain the higher proportion of air in the air-
water mixture achieved by Biheller as compared to the
proportion of .air attained in this present study.
Using the short, curved vane configuration, Biheller
achieved an air-water volumetric ratio of 12 per cent,
although this resulted in. a considerable drop of the dis-
charge head. On the other hand, the pump impeller in the
present study had four long and straight vanes extending out
radially (See figure 19), and the maximum air-water volumetric
ratio attained was 6.8 per cent at a water flow rate of 15
GPM and a pump speed of 2500 RPM. This value (6.8%) was
achieved just before the aforementioned unstable flow condi-
tions took place. Similar ratios for pump speeds of 3000
and 3500 RPM at water flow rates of about 20 GPM were found
to be 4.35 per cent and 4.9 per cent respectively.
Explaining the significance attributed to geometric
factors, Biheller noted that the air-water mixture in the
volute casing followed a hellical flow pattern.2 This left
Ibid. p.4

23
the air bubbles in the middle of the hellical stream
preventing their return to the center of the impeller (See
figure 23), and thus facilitating the discharge of these
bubbles from the impeller eye, However, the factor that
prevented this situation was the length of the impeller vanes
of the pump tested as compared with the shorter, curved
vanes of the impeller used by Biheller,
Another pertinent study of two-phase flow in centrifugal
pumps was made by A0 J. Stepanoff3. There was a close
parallel between Stepanoff's findings and the results of
this study except Stepanoff confined his investigation to
only one pump speed (900 RPM). Both studies agreed on the
shape of the head-capacity and the efficiency curves,
Stepanoff's results concerning the flow capacity corresponding
4 to the the breaking of the head-capacity curve" were also in
close agreement with Biheller's, However, Stenanoff made
no mention of the effect of the impeller vane geometry
on the head-capacity curve,
A.J. Stepanoff, Pumps and Blowers-Two-phase Flow. (New York: John Wiley and Sons, 1966), p.263
4 Ibid. loc. cit.

24
Stepanoff also emphasized the importance of the net
positive suction head (NPSH), in controlling the volume of
the air at the impeller eye On the other hand, he made no
mention of the accumulation of air at the impeller eye, a
point that this author attributed to the pump geometry.
Stepanoff's use of only one pump speed (900 RPM)
ignores the effect of pump speed on the air handling capa-
bility of the pump. Consequently pump speed, flow capacity
and air flow rate were varied in the present study in search
of the optimizing combination. Among the five different pump
speed, 2500 RPM seemed to be unique. Two features
distin-guished this speed from the rest. First, the head-capacity
curves showed no uniformity at this speed (See figure 3)
while the corresponding curves at the other speeds were
characterized by a clear symmetry around 20 GPM (See figure
1,2,4,5.) Secondly, at pump speeds of 3500 and 3000 RPM, the
appreciable loss of the discharge head upon reduction of the
water flow rate started at an air flow rate of 2.18x10⁻³ ft3/sec
(See figures 1 and 2) while the corresponding figure at 2000
and 1500 RPM was 1,72x10⁻³ ft3/sec (See figures 4 and 5).
5 Ibid. loc. cit.

25
However, at a pump speed of 2500 RPM, it was possible to
-3 increase the air flow rate up to 2.34x10⁻³ ft3/sec /sec (See
figure 3) without an appreciable deviation of the head-
capacity curve from its no-air behavior. Therefore, at
2500 RPM the pump was able to handle more air than at other
speeds without a considerable loss of its discharge head.
Also at this speed and air flow, the corresponding pump
efficiency was not considerably different from its value at
no air flow conditions. All of these observations led. the
author to believe that for this specific pump, optimal air
handling conditions occured at a pump speed. of 2500 RPM, a
water flow rate of 15 GPM, and an air flow rate of 2.74)(10
ft3/sec. The optimal flow conditions at no-air flow, accor-
ding to the experimental results as well as the manufacturer's
data, were at 3550 RPM and a water flow rate of 35 CPM. Thus,
the optimal values of the water flow arid the pump speed were
markedly reduced by the injection of air into the water stream.
The mentioned optimal two-phase flow parameters, namely
pump speed, capacity and air flow were obtained by trying
various pump speeds as previously discussed. However, speed
was not a variable in either Biheller's or Stepanoff's study
as they investigated two-phase flow at only one pump speed.
Thus it was impossible to make any conclusions from their

efficiency equation,
studies in regard to the effect of pump speed on the
optimal air handling capability of their pumps.
Finally, one observation was made relative to the
head-capacity and the efficiency curves. At the higher air
flow rates, the peaks of the head-capacity and the efficiency
curves coincided at the same pump flow capacity and speed.
The explanation for this is that at the pump flow capacity
when the air flow rate just exceeded the maximum amount that
the pump could handle, the discharge head and the water flow
rate decreased continuously for reasons discussed earlier
in this chapter (See page 18). With the aid of the pump
26
it is clearly seen that simultaneous drops in Q and H will
result in a similar drop of the efficiency.
The efficiency curves were clearly affected also by the
increase of air in the air-water mixture. This resulted in
a shift in the efficiency curves such that they peaked at a
lower efficiency value and at a lower flow capacity (a result
also achieved by Stepanoff)6. This behavior can also be
explained by the simultaneous drop in the discharge head and
the water flow rate. 262

CHAPTER VI
Summary and Recomendations
This study investigated the effects of two phase
flow on the performance of the centrifugal pump tested.
Some of the results compared favorably with existing litera-
ture while a comparison of other results was impossible due
to limited published work on the topic of two phase flow
in centrifugal pumps.
Two phase flow was found to affect the efficiency of
the centrifugal pump tested. Increasing the flow capacity under
no-air flow conditions resulted in a continuous drop of the
discharge head, hut upon introduction of an air flow greater
than 1.72 x 10⁻³ it /sec., the discharge head increased up to
a limit before it dropped to zero (See figures 1 to 5). It was
found that: increasing the air injection rate had an adverse
effect on the performance of the pup in terms of total
Two factors are noted in explaining the behavior of
the head-capacity curves: First, the geometry of the impeller
vanes and the casing and, secondly, the suction pressure at
the impeller eye. It was observed tht the length of the
27

28
the impeller vanes (See Figure 19) interfered with the
discharge of some of the air bubbles. These bubbles were
trapped between the vanes. The high suction pressure at
the impeller eye increased the volume of these bubbles
such that they formed a partial block to the incoming flow.
It was concluded that the mass of air inside the casing
increased with time until it completely blocked the flow.
Another finding of this study was the determination of
the values of the flow parameters, pump speed and flow capa-
city which resulted in optimal two-phase flow conditions.
It was concluded that with the introduction of air into the
water stream, the pump speed at which maximum air was dis-
charged without a considerable head loss was below its opti-
mal speed at no-air flow. Optimal two-phase flow conditions
were observed at a pump speed of 2500 RPM and a flow capacity
of 15 GPM. Optimal no-air flow conditions were observed at
3550 RPM and 35 GPM.
Recommendations: The remainder of this chapter is devoted
to the discussion of recommended areas for further study, and
and desired structural and procedural changes in the experi-
ment. While clarifying certain aspects of two-phase flow in

pimps, this study introduced new areas for further inves-
tigation. One of these areas involves the effects of varying
the pump speed at fixed air and water flow rates on the de-
veloped discharge head. This may shed some light on the
problem of phase separation at slower flow velocities as
well as the air accumulation inside the pump casing.
It is recommended that the experimental procedure of
this study be repeated using the following pump configura-
tions:
1.- A 7-inch impeller with curved vanes in conjunc-
tion with the existing plexiglass casing.
2.- A 5-inch impeller with curved vanes also with
the present casing.
3.- A 7-inch impeller with curved vanes with a wider
volute casing.
4.- A 5-inch impeller with curved vanes with a wider
volute casing.
It is also recommended that with each of these four
pump configurations an experimental procedure be followed
whereby the pump speed is varied at fixed air and water flow
rates, while the discharge and suction heads are measured.
29

From a structural viewpoint, the apparatus can be
considerably improved. First, a valve should be installed on
the suction side of the pump to stop the water from flow-
ing from the elevated reservoir to the pump during repairs.
Secondly, it is advisable to resort to an alternative source
of compressed air as oil (traceable to the compressor) was
detected in the reservoir. Of course this contamination
can be prevented by the use of filters and separators, how-
ever the alternate source of compressed air already mentioned
is conveniently located. Thirdly, the reservoir should be
permanently covered to keep solid particles out of the sys-
tem. Fourthly, in order to increase the suction pressure
it is reccomended that the water reservoir be placed a few
floor& above the laboratory. The final recommendation is
to improve the meanss of measurement and control of the air
flow. The existing orifice-manometer combination dces not
constitute an accurate air flow measuring system, because
of the excessive joints and fittings in its construction
(See figure 21). A method of improving this situation
would be to install a compact air flow meter and a needle
valve in the air line in order to obtain a finer control
of' the air flow rate.
30

PERFORMANCE CURVES FOR TWO PHASE FLOW CONDITIONS AT 3500 RPM

PERFORMANCE CURVES FOR TWO PHASE FLOW CONDITIONS
AT 3000 RPM
PERFORMANCE CURVES FOR TWO PHASE FLOW CONDITIONS AT 2500 RPM

PERFORMANCE CURVES TWO PHASE FLOW CONDITIONS AT 2000 RPM

PERFRMANCE CURVES FOR TWO PHASE FLOW CONDITIONS
AT 1500 RPM

EFFICIENCY CURVES FOR TWO PHASE FLOW CONDITIONS AT 3500 RPM

EFFICIENCY CURVE FOR TWO PHASE FLOW CONDITIONS
AT 3000 RPM

EFFICIENCY CUVES FOR TWO PHASE FLOW CONDITIONS AT 2500 RPM
EFFICIENCY CURVES FOR TWO PHASE FLOW CONDITIONS AT 2000 RPM

EFFICIENCY CURVES FOR TWO PHASE FLOW CONDITIONS AT 1500 RPM

SUCTION HEAD CAPACITY CURVES FOR TWO PHASE FLOW CONDITIONS AT 3500 RPM

SUCTION HEAD CAPACITY CURVES
FOR TWO PHASE FLOW CONDITIONS AT 3000 RPM

SUCTION HEAD-CAPACITY CURVES
FOR TWO PHASE FLOW CONDITIONS
AT 2500 RPM
SUCTION HEAD-CAPACITY CURVES
FOR TWO PHASE FLOW CONDITIONS
AT 2000 RPM

SUCTION HEAD-CAPACITY CURVES F
OR TWO PHASE FLOW CONDITIONS AT 1500 RPM


A SYMBOLIC DIAGRAM OF THE APPATUS

PUMP CASING & IMPELLER

THE AIR—INJECTON SYSTEM

THE ORIFICE & THE AIR FLOW MEASURING UNIT
An Illustration of the
Helical Streamline with traped air bubbles


CALIBRATION OF SUCTION POTTERMETER
Counts/Sec. GPM
56 5.03
69 5.59
87 7.30
91 8.40
123 10.83
146 12.97
160 13.7 2
179 15.37
191 17.20
192 17.90
196 18.45
224 20.25
227 20.75
244 22.25
247 22,7
265 24.0
267 24.9

CALIBRATION OF ORIFICE
Inches of Hg wh (Ibm of air/hr.)
0.0 0.00 0.5 0.73 1.0 1.00 1.5 1.25 2.0 1.45 2.5 1.63 3.0 1.78 3.5 1.91 4.0 2.06 4.5 2.18 5.0 2.30 6.0 2.52 7.0 2.72 8.0 2.91
9.0 3.09 10.0 3.26
12.0 3.56 15.0 3.99
20.0 4.61
25.0 5.15
30.0 5.63
35.0 6.09
40.0 6.47
56

THE CONVERSION OF THE PRESSURE DIFFEREINTIAL
ACROSS THE ORIFICE TO Ft3/SEC. OF AIR
P"Hg. Air Flow(1bm/hr)* Air Flowgt3/sec.)
0.2 0.45 1.4 x 10⁻³
0.3 0.55 1.72 x 10⁻³
0.4 0.65 2.03 x 10⁻³
0.5 0.70 2.18 x 10⁻³
0.6 0.75 2.34 x 10⁻³
0.65 0.80 2.50 x 10⁻³
0.70 0.85 2.65 x 10⁻³
0.80 0.90 2.81 x 10⁻³
* Obtained from Orifice calibration curve.

TABULATED DATA
3500 RPM
Flow
Capacity (GPM)
Discharge Pressure (ft.)
Suction Pressure (ft.)
Brake Horse
Power
Efficiency Air Flow (10 3 ft3/sec)
36 9.25 33.4 3.53 2.38 35 175 26.6 4.87 31.9 28.7 182 22.1 4.8 27.6 20.7 196 13 4.4. 23.3 13.7 203 6.24 4.07 17.3 8.0 208 2.83 3.8 11.1 3.0 208 1.13 3.53 4.48
36 9.25 33.4 3.47 2.43 1.4 33.5 178 26.1 5.14 29.3 29 184 22.7 5.0 27.1 23.8 192 16.4 4.8 24.1 19.4 196 11.3 4.67 20.6 14 203 6.8 4.2 17.1 V 7 208 2.27 3.67 10.0
37 9.25
30.6 3.33 2.6
1.72 36 162 .28.3 5.20 28.3 32.4 20.1 23.8 5.27 31.1 27 198 20.4 5.27 25.5 22 215 13.6 5.07 23.6 19 205 9.64 4.94 19.9 14 194 6.24 4.6 14.9 7.7 171 2.27 4.26 7.7
37 11.5 29.5 .3.53 3.04 2.18 36 74 27.8 4.6 14.7 31 129 23.8 5.2 19.5 26.6 162 20.4 5.07 21.5 20 189 11.3 4.94 18:4 12.3 129 4.53 3.87 10.3
7 65 1.13 2.13 5.4
24.4 9.25 17.0 2.33 2.45 2.65 18.2 23.1 11.3 2.13 5.0 14.7
16.2 5.64 1.33 4.52
- - - - -
58

59

60
TABULATED DATA
2500 RPM
GPM Pd(ft) Ps(ft) bhp EFF. Air. Flow (10-ft3/sec)
36 11.5 31.2 2.24 4.7 0 33.25 78.5 22.1 2.67 24.8 28.8 83.2 19.3 2.72 22.3 21.4 97.0 11.33 2.29 23.0 15 106.0 5.66 2.00 20.1 8.5 109.0 2.26 1.81 13.2
36 9.25 32.9 2.24 3.77 1.72 32.2 85.5 23.8 2.62 26.6 27.8 90.1 20.4 2.48 25.6 21.5 97.1 12.5 2.24 23.6 14.5 104.0 6.24 1.95 19.6 9.0 108.5 2.27 1.72 14.4
36 9.25 32.9 2.24 3.74 2.03 35 83.2 25.5 2.57 27.6 28 86.8 20.4 2.38 25.8 23.7 94.7 14.75 2.24 25.3 17 101.5 7.95 2.00 21.8
10 108.5 2.84 1.72 15.9
36 9.25 31.2 2.33 3.62 2.34 31.5 85.5 22.1 2.57 26.6 25.2 92.50 17.6 2.33 25.3 21.6 86.8 11.3 2.24 21.2
13.5 99.4 4.54 1.90 17.9
5.4 83.1 0 1.53 7.41
36 9.25 29.0 2.24 3.77 2.50
27 60.0 17.0 2.43 16.9 24.1 46.2 13.6 2.24 12.6
17 39.3 6.8 1.81 9.34 9.0 18.5 0.57 1 00 4.22 v
18.6 2.81 9.1 1.29 0.84 2.65
15.3 6.93 6.25 1.14 2.35 10.8 13.85 1.13 1.05 3.59

61
TABULATED DATA
2000 RPM
GPM PD(ft) Ps(ft) bhp EFF. Air flow (10-3 ft3/sec)
36 13.9 25 1.60 7.92 0' 35 23.1 22.6 1.64 12.5 29.7 37.0 19.8, 1.64 17.0 23.8 48.5 13.6 1.525 19.2
18.3 60.0 7.95 1.258 22.1 12 67.0 2.84 1.068 19.0 6 69.3 0. 0.954 11.0
36 11.5 28.1 1.64 6.4 1.4 30.7 46.2 22.0 1.45 24.7 26.2 50.1 18.1 1.37 24.3 21 60.0 11.9 1.29 24.7 15.4 64.7 5.7 1.18 21.4 9.6 67.0 2.3 1.07 15.2
31 11.5 21.6 1.485 6.1 1.72 27 20.8 17.6 1.41 10.1 24.3 25.4 14.5 1.37 11.4 20 32.4 9.1 1.18 13.9 14 25.4 3.4 0.80 11.25
27 9.25 18.1 1.295 4.9 2.03 23.3 13.9 13.6 1.22 6.7 20 13.9 7.95 .99 7.1 13.5 4.62 1.7 .76 2.1 7.2 2.31 0 .68 0.6
25.6 9.25 17.6 1.26 4.75 2.18 20.7 13.9 9.65 1.07 6.8 16.2 9.25 4.55 0.80 4.75 7.2 2.31 0 0.57 0.7
22.5 9.25 13.6 1.18 4.45 2.34 18 4.62 1.1 0.725 22

TABULATED DATA
imp RPM
GPM PD(ft) Ps (ft) bhp EFF. Air Flow (10-3 ft3
/sec)
28 9.25 17 0.944 6.93 0 20.5 23.10 10.2 0.886 13.5 16.2 31.20 6.24 0.657 19.5 13.5 34.70 3. 97 0.629 18.8 7.2 39.30 .57 0.549 13
11.5
1
.31 22 0.80 11.3 1.4 26 18.5 18.1 0.74 16.4 20.5 26.6 11.3 0.66 20.9 15.7 32.4 6.2 0.60 21.5 9.4 37.0 1.7 0.51 17.2 5.0 38.2 0 0.49 9.9
28 11.5 20.5 0.94 8.7 1.72 24.5 23.1 15.3 0.885 16.2 17.5 25.4 7.9 0.83 13.6 14.4 18.5 5.1 0.77. 6.8 12.2 16.2 3.4 0.74 6.8
7.7 13.9 1.1 0.66 4.1
25.6 9.25 17.6 0.86 6.95 2.18
20.7 17.3 10.8 1.77 11.8
17.7 25.4 7.4 0.685 16.6
11.7 13.9 2.8 0.54 7.60
6.4 6.9 1.1 0.49 23 V
22.7 6.9 13.0 0.77 5.2 2.65
19 10.4 9.1 0.685 7.3 16.2 13.9 6.2 0.63 9.1
9.2 5.78 1.7 046 2.9
17.2 4.62 7.9
0.66 3.04 2.81

61
CALCULATIONS
1. DETERMINATION OF VOLUMETRIC AIR FLOW RATE:
A Sample Calculation
Cage Pressure at Orifice 3 psig (Constant).
* This is the mass flow rate corresponding to a pressure — differential of 0.2 "Hg' obtained from the orifice calib-ration curve.

CALCULATIONS
2. DETERMINATION OF MAX. DISCHARGE & SUCTION PRESSURES:
( Based on Manufacturer's data )
3. DETERMINATION OF AIR FLOW RATE THRU 1"-PIPE BY MEANS OR AN ORIFICE:*
64
* POWER TEST CODE - FLOW MEASUREMENT p.57
The term K in equation (i) above is determined by the
Reynold's No which doesn't have a considerable bearing
upon it.
Therefore, the assumption is made:-

66

67
4. EQUATIONS USED TO CALCULATE PERFORMANCE PARAMETERS :

5.DETERMINATION OF MINIMUM No OF PICTURES
PER SECOND OF ROTATING IMPELLER:
Where N No. of impeller blades
For this configuration N = 4 blades
and w= 1500, 2000, 2500, 3000, 3550 rpm
Impeller RPM Mini mum PPS
1500 300
2000 400
2500 500
3000 600
3500 700
68

CHARACTERISTICS OF APPARATUS:
A. DYNAMOMETER
7.5 HP 250 Volts
800-- 4000 RPM (variable) 25 - 28 Amps
B.- RESERVOIR
Capacity 67.5 cu. ft = 500 gal.
C. - PIPING Nominal I.D. O.D.
Air Line 1" 1.049" 1.315"
Water " 1 1 1/4" 1.380" 1.660"
69
'70
DATA
RPM Water Flow
Air Flow "Hg"
Disch. Pressure
Psig
Suction Pressure
"Hg"
Force on Torque bar lb. Tach Strob Counts/sec L R
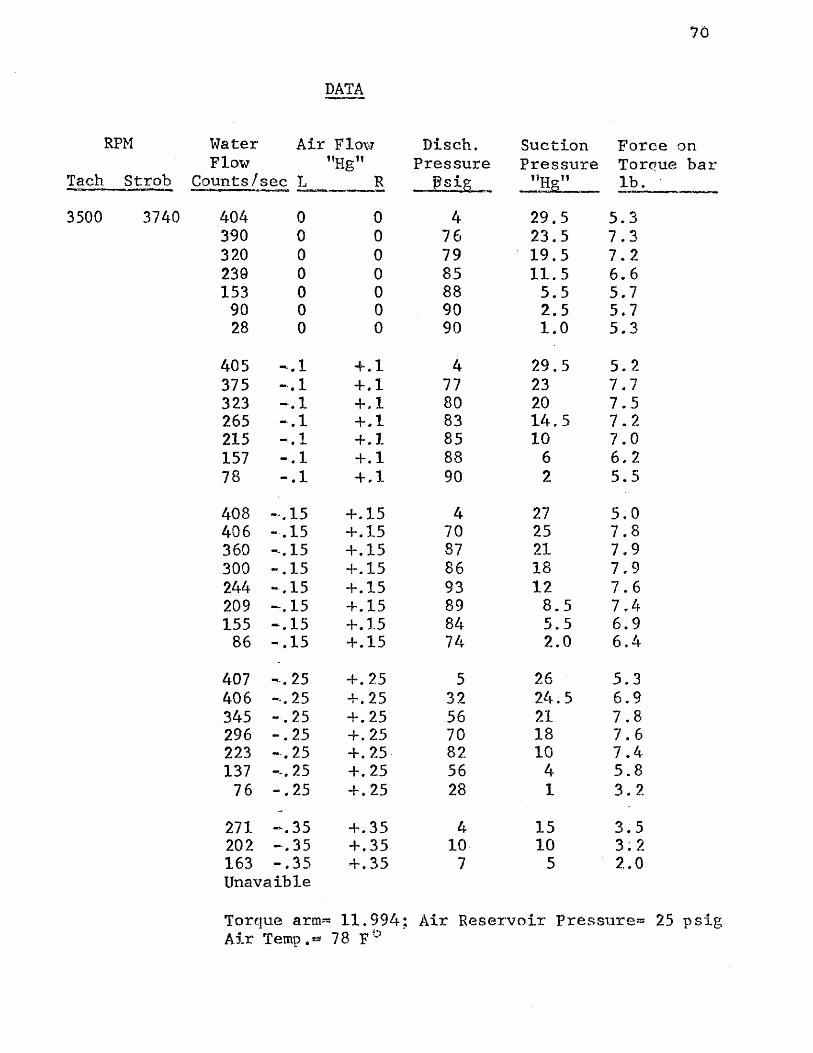
3500 3740 404 0 0 4 29.5 5.3 390 0 0 76 23.5 7.3 320 0 0 79 19.5 7.2 239 0 0 85 11.5 6.6 153 0 0 88 5.5 5.7 90 0 0 90 2.5 5.7 28 0 0 90 1.0 5.3
405 -.1 +.1 4 29.5 5.2 375 -.1 +.1 77 23 7.7 323 -.1 +.1 80 20 7.5 265 -.1 +.1 83 14.5 7.2 215 -.1 +.1 85 10 7.0 157 -.1 +.1 88 6 6.2 78 -.1 +.1 90 2 5.5
408 -.15 +.15 4 27 5.0 406 -.15 +.15 70 25 7.8 360 -.15 +.15 87 21 7.9 300 -.15 +.15 86 18 7.9 244 -.15 +.15 93 12 7.6 209 -.15 +.15 89 8.5 7,4 155 -.15 +.15 84 5.5 6.9 86 -.15 +.15 74 2.0 6.4
407 -.25 +.25 5 26 5.3 406 --.25 +.25 32 24.5 6.9 345 -.25 +.25 56 21 7.8 296 -.25 +.25 70 18 7.6 223 -.25 +.25 82 10 7.4 137 -.25 +.25 56 4 5.8 76 -.25 +.25 28 1 3.2
271 -.35 +.35 4 15 3.5 202 -.35 +.35 10 10 3.2 163 -.35 +.35 7 5 2.0 Unavaible
Torque arm= 11.994; Air Reservoir Pressure = 25 psig Air Temp.= 78 F°

71
DATA
RPM Water -Flow
Air Flow "Hg"
Disch. Pressure Psig
Suction Pressure
"Hg"
Force on Torque bar
lb. Tach Strob Counts /sec L R
3000 3170 404 0 0 4 29.5 5.0 362 0 0 57 22 6.1 308 0 0 59 19 5.9 241 0 0 63 12 5.7 204 0 0 65 9 5.3 150 0 0 66 5 .5.0 80 0 0 67 2 4.5
403 -.1 +.1 4 29.5 5.0 351 -.1 +.1 56 27 6.1 300 -.1 +.1 58 18 6.0 242 -.1 +.1 62 12 5.6 205 -.1 +.1 64 9 5.3 157 -.1 +.1 66 6 5.2 99 -.1 +.1 67 2.5 4.9
404 -.15 +.15 4 28.5 5.0 330 -.15 +.15 56 21 6.2 290 -.15 +.15 54 17 5.9 213 -.15 +.15 63 10 5,5 159 -.15 +.15 65 6 5.2 76 -.15 +.15 65 2 4.7
405 -.25 +.25 4 28.5 5.0 330 -.25 +.25 52 20 6.0 250 -.25 +.25 60 13 5.8 214 -.25 +.25 53 9 5.5 163 ..25 +.25 49 6 5.1 100 -.25 +.25 44 2.5 4.3 75 -.25 +.25 20 2 3.2
404 -.325 +.325 4 24.2 4.7 360 -.325 +.325 10 22 4.8 250 -.325 +.325 23 12 4.3 210 -.325 +.325 35 6.5 4.6 130 -.325 +.325 17 4 3.5 70 -.325 +.325 3 1 1.0
388 -.35 +.35 4 23.5 4.5 360 -.35 +.35 7 72.0 4.6 Torque Arm= 11.994 in; Air Reservoir Press.. 25 psig Air Temp= 78 F°
72
DATA
RPM Water Flow
Counts /sec
Air Flow "Hg"
Disch. Pressure
Psig
Suction Pressure
"Hg"__
Force on Torque bar lb
Tach Strob L R
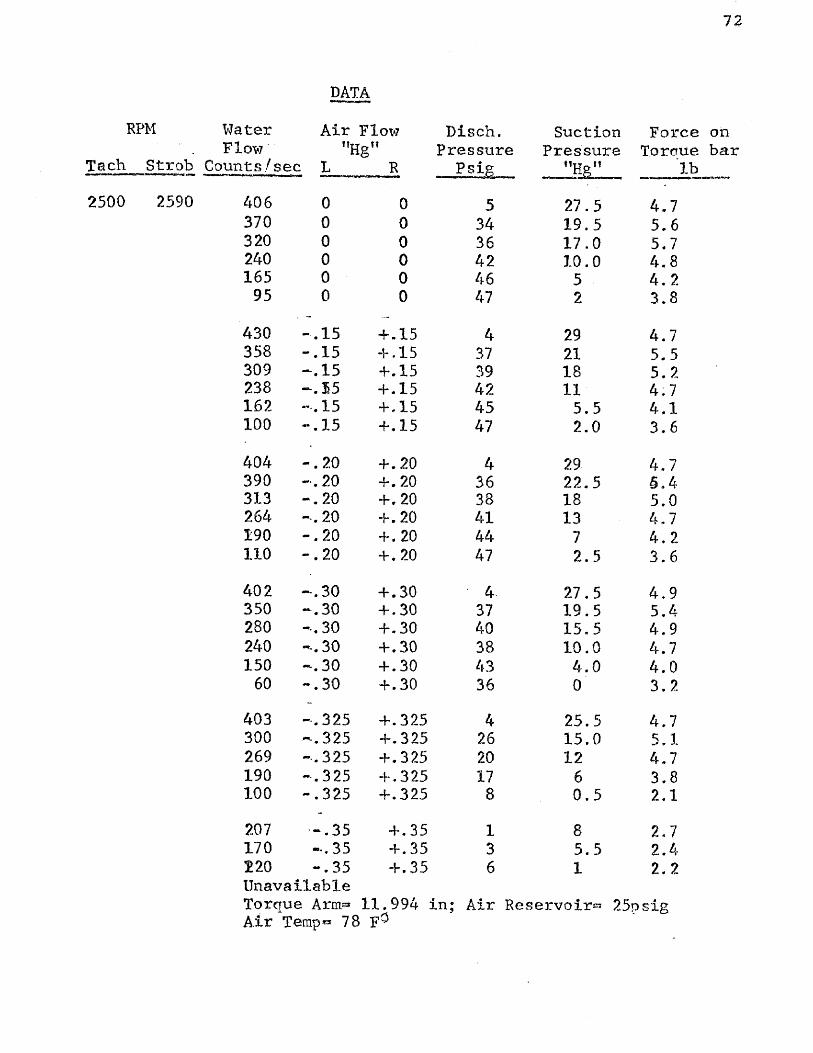
2500 2590 406 0 0 5 27.5 4.7 370 0 0 34 19.5 5.6 320 0 0 36 17.0 5.7 240 0 0 42 10.0 4.8 165 0 0 46 5 4.2 95 0 0 47 2 3.8
430 -.15 +.15 4 29 4.7 358 -.15 +.15 37 21 5.5 309 -.15 +.15 39 18 5.2 238 -.15 +.15 42 11 4;7 162 -.15 +.15 45 5.5 4.1 100 -.15 +.15 47 2.0 3.6
404 -.20 +.20 4 29. 4.7 390 -.20 +.20 36 22.5 6.4 313 -.20 +.20 38 18 5.0 264 -.20 +.20 41 13 4.7 190 -.20 +.20 44 7 4.2 110 -.20 +.20 47 2.5 3.6
402 -.30 +.30 4 27.5 4.9 350 -.30 +.30 37 19.5 5.4 280 -.30 +.30 40 15.5 4.9 240 -.30 +.30 38 10.0 4.7 150 -.30 +.30 43 4.0 4.0 60 -.30 +.30 36 0 3.2
403 -.325 +.325 4 25.5 4.7 300 -.325 +.325 26 15.0 5.1 269 -.325 +.325 20 12 4.7 190 -.325 +.325 17 6 3.8 100 -.325 +.325 8 0.5 2.1
207 -.35 +.35 1 8 2.7 170 --.35 +.35 3 5.5 2.4 120 -.35 +.35 6 1 2.2 Unavailable Torque Arm= 11.994 in; Air Reservoir= 25psig Air Temp= 78 F°

73
DATA
RPM Water Flow
Air Flow "Hg"
Disch. Pressure Psig
Suction Pressure
"Hg"
Force on . Torque bar
lb "leach Strob Counts/sec L R
2000 2050 404 0 0 6 22 4;2 388 0 0 10 20 4;3 325 0 0 16 17.5 4:3 265 0 0 21 12 4.0 204 0 0 26 7 3.3 133 0 0 29 2.5 2.8 67 0 0 30 0 2.5
400 -1 +.1 5.0 24.8 4.3 342 -.1 +.1 20.0 19.4 3.8 292 -.1 +.1 22.0 16.0 3.6 234 -.1 +.1 26 10.5 3.4 171 -.1 +.1 28 5.0 3.1 107 -.1 +.1 29 2.0 2.8
344 -.15 +.15 5 19 3.9 300 -.15 +.15 9 15.5 3.8 270 -.15 +.15 11 12.8 3.7 220 --.15 +.15 14 8.0 3.1 156 -.15 +.15 11 3.0 2.1 Unavailable 0 300 -.2 +.2 4 16 3.4 260 --.2 +.2 6 12 3.2 220 -.2 +.2 6 7 2.6 .150 -.2 +.2 2 1.5 2,0 80 -.2 +.2 1 0 1.8 Unavailable 285 --.25 +.25 4 15.5 3.3 230 -.25 +.25 6 8.5 2.8 180 -.25 +.25 4 4 2.1 80 -.25 +.25 1 0 1.5 Unavailable 250 -.30 +.30 4 12 3.1
200 -.30 +.30 2 1 1.9 Unavailable
Torcue Arm= 11.994 in ; Air Reservoir Press.= 25psig
Air Temp = 78 F°

74
DATA
RPM Water Flow
Air Flow "Hg"
Disch. Pressure
Psig
Suction Pressure
"Hg"
Force on Torque bar lb. Tach Stroh Counts /sec L R
1500 1500 310 0 0 4 15 3.3 226 0 0 10 9 3.1 180 0 0 13.5 5.5 2.3
150 0 0 15 3.5 2.2 80 0 0 17 0.5 1.9
342 -.1 +.1 5 19.4 2.8 290 -.l +.1 8 16.0 2.6 228 -..1 +.1 11.5 10.0 2.3 174 -.1 +.1 14.0 5.5 2.1 106 -.1 +.1 16.0 1.5 1.8
54 -.1 +.1 16.5 0 1.7
314 -.15 +.15 5 18.1 3.3 217 -.15 +.15 10 13.5 3.1
196 -.15 +.15 11 7.0 2.9 160 -.15 +.15 8 4.5 2.7 136 -.15 +15 7 3.0 2.6
86 -.15 +.15 6 1.0 2.3
285 -.25 +.25 4 15.5 3.0 230 -.25 +.25 7.5 9.5 2.7 197 -.25 +.25 11 6.5 2.4 130 -.25 +.25 6 2.5 1.9 71 -.25 +.25 3 1.0 1.7 Unavailable 252 -.35 +.35 3 11.5 2.7 210 -.35 +.35 4.5 8 2.4 180 -.35 +.35 6 5.5 2.2 103 -.35 +.35 2.5 1.5 1.6 Unavailable 192 -.4 +.4 2.0 7.0 2.3
Torque Arm= 11.994 in! Air Reservoir. Press= 25 prig Air Temp= 78 F°

75
CALIBRATION DATA. OF SUCTION POTTERMETER
RPM 'tack)
RPM (Strob)
Counts)/ / see.
Wt. of Water (Lb.)
Time int Sec)
800 823 69 50 64.2
1000 1012 87 50 49.2
1410 1400 123 50 33.15
1800 1770 160 50 26.17
2000 1980 179 50 23.32
2200 2170 196 50 19.46
2490 2448 227 50 17.28
2700 2643 244 70 22.6
2900 2830 265 70 20.86

LIST OF REFERENCES
(1) Stepanoff, A.J. Pumps and Blowers-Two Phase Flow. New York: John Wiley and Sons, 1966
(2) Arbiter, N., Harris, C.C., and Yap, R.F. "Hydrodyna-mics of Floatation Cells." Henry Krum School of Mines, Columbia University, New York, 1968
(3) Biheller, W. "Air Handling Capability of Centrifugal Pumps." Worthington Corporation Research Paper. Harrison, N.J. 1957
(4) Boyce, M.P. "A Practical Three-Dimensional Flow Visua-lization Approach to the Complex Flow Characteristics in a Centrifugal Impeller, " Curtiss-Wright Corporation, Wood-Ridge, N.J. 1966
76


