

Corporate Governance
and Innovation
Vicar S. Valencia∗
Department of Economics University of Melbourne
Phone: (613) 8344 5287 Fax: (613) 8344 6899
Email: [email protected]
∗ I thank my supervisors Bill Griffiths and Nisvan Erkal for their guidance and encouragement. I received
useful advice from Hielke Buddlemeyer, Michael Coelli, Robert Dixon, Paul Jensen, Elizabeth Webster,
and seminar participants at the Microeconometrics Seminar 2006, University of Melbourne and the 36th
Australian Conference of Economists 2007, University of Tasmania.
1
Preface
Thesis : Essays in Corporate Governance, Innovation, and R&D
Alliances
Supervisors : Prof. Bill Griffiths and Dr. Nisvan Erkal
This paper is the first of a series of essays organized under the rubric of innovation and
firm performance. The essays examine how corporate governance can be a determinant
of innovation and how R&D alliances influence the profitability and survival of newly
IPO-listed high-tech firms.
2

Abstract
A fundamental concern emerging from the corporate literature is the agency problem of
innovation. While shareholders regard innovation as a value-enhancing investment
strategy, the Chief Executive Officer (CEO) has an intrinsic reluctance to pursue
innovation projects. The thrust of this paper is to identify the mechanisms of corporate
governance which help attenuate this problem, thereby encouraging the CEO to have the
propensity to innovate. Using panel count data panel models and GMM estimation that
control for unobserved effects and endogeneity, I find that firms with a concentration of
minority shareholders are less likely to engage the CEO to innovate. The likelihood of
innovating appears to increase, however, in the presence of a large minority shareholder.
Also, contrary to prevailing beliefs, I do not find any association between innovation and
board independence. The same result holds for board size. On the other hand, innovation
increases when the CEO is not the Board Chairman. I use a sample of domestically-
owned Australian firms over the period 1994-2003.
Keywords: corporate governance, innovation, patent applications, count data
JEL Codes: G34, O32
3
1. Introduction
The central theme underlying corporate agency theory is the potential divergence of
interest between the stockholders and the chief executive officer or CEO. As the
company’s manager and chief strategist, the CEO has a wide latitude and discretion to
make decisions that alter corporate policies and strategic directions. Theory establishes
that these decisions do not necessarily coincide with the collective interest of the
stockholders. The literature documents evidence of managerial decisions at variance with
the pursuit of shareholder value maximization (Shleifer and Vishny, 1997). Empirical
manifestations include misappropriating funds through gratuitous perquisites and transfer
pricing by setting prices that exclusively benefit the CEO’s personal affairs.
A main concern is that the investment projects that the CEO chooses are not optimal in
the sense that they do not have the potential to generate positive net present value returns
in the long run; rather, these choices simply reflect a predisposition towards overly safe
projects that bolster managerial career and reputation. The CEO chooses suboptimal
projects in the interest of entrenching his position in the company and elevating his
prestige in the labor market, which implies that he will provide insufficient attention to
risky, but potentially value-enhancing projects. For instance, Jensen (1986) argues that
CEOs in the oil industry chose to pursue investments that allowed them to expand their
control and dominion, but nevertheless yielded inferior returns. Similarly, Poterba and
Summers (1995) report that CEOs in the United States have a myopic investment horizon
which dissuades them from making long-term, value enhancing investments.
The focus of this paper is the identification of mechanisms, collectively called as
corporate governance, which encourage the CEO to pursue innovation. Innovation is a
prime example of a value-enhancing investment decision. In its 2006 Senior Executive
Innovation Survey, the Boston Consulting Group reports that innovative companies
(which included Apple Computer, Google, and 3M) generated a median annualized
shareholder return of 14.3 percent over the period 1996-2005, which is 300 basis points
higher than that of the benchmark Standard and Poor’s (S&P) Global 1200 median. These
4
companies also generated a median annualized increase of 3.4 percentage points in their
profit margins, compared with 0.4 percent of the S&P benchmark companies. Innovation
is a major driver of company growth and profitability; however, it is also a risky venture.
While the financial rewards benefit stockholders, the intrinsic risk can adversely affect
the CEO’s career and reputation. The survey identifies the CEO as the person most
responsible for implementing innovation. Its development and sustainability depends on
the commitment and leadership of the CEO. Nonetheless, the survey also reveals a
perceived lack of commitment by the CEO, stemming in large part on a risk-averse
culture. The American Management Association (2006) highlights this overly
conservative attitude, noting the generalized absence of corporate structures that foster
innovation; only less than a third of US companies surveyed had structures formally in
place that indicate a commitment to innovation.
The research intent and main contribution of this paper is to provide empirical evidence
for corporate governance as a structure that encourages the CEO to innovate. Corporate
governance is a nexus of incentive schemes and monitoring devices designed to align the
interest of the CEO with that of the shareholders. While there is a multiplicity of studies
that analyze corporate agency problems, the empirical evidence that specifically focuses
on innovation and corporate governance is sparse and suffers from potential problems of
unobserved firm heterogeneity and endogeneity. These problems essentially invalidate
any characterization as to what corporate governance mechanisms can resolve the agency
problem of innovation. At the core of corporate governance is the effective monitoring of
the CEO’s activities. Identifying an efficient system of monitoring managerial behavior is
important because incentive schemes in the form of executive compensation cannot
solely mitigate the preference incongruity in innovation between the CEO and the
stockholders (Holmstrom, 1989). The corporate governance of innovation particularly
matters when ownership shares are widely dispersed, such as those observed in Australia,
the United Kingdom, and the United States. Unless the appropriate governance structures
are in place, the CEO can virtually make investment decisions unwarranted by
stockholders. In this paper, I test whether the facets of corporate governance such as
ownership structure, the composition of the board of directors, and CEO stockholdings
5
and CEO-Chair duality can characterize an effective structure of incentives and
supervision of the CEO’s innovation decisions.
My empirical specification employs panel models of count data. I use patent applications
to measure innovation. The data come from the IBIS-Melbourne Institute database where
I also collect other firm-level information such as research and development (R&D)
expenditures and the number of employees. I use a sample of 197 firms over the period
1994-2003. The data consist of domestically-owned Australian firms listed on the
Australian Stock Exchange. The sample is drawn from across all sectors, using the
classification scheme of the Global Industry Classification Standard. Industry groups
which do not reasonably engage in innovation in the sense that it lends itself to
measurement are excluded. These include the media, banking, insurance, and retailing,
among others. The corporate governance data are hand-collected from each firm’s
annual reports sourced from AspectHuntley’s DatAnalysis. These include information on
equity ownership, the number and independence of board members, and CEO
stockholdings, among others.
I initially estimate a Poisson model which does not control for unobserved firm effects.
However, the results suggest that there is substantial cross-sectional heterogeneity that
needs to be accounted for. This heterogeneity is also exhibited through overdispersion in
the sample data. A negative binomial specification appears to provide a better fit. I find
that firms with a concentration of minority shareholders are less likely to innovate. The
likelihood of innovating appears to increase, however, in the presence of a large minority
shareholder. This finding suggests that shareholder activism is best achieved through a
single large minority shareholder, rather than several minority shareholders. Controlling
for endogeneity, I do not find any association between innovation and board
independence. Contrary to prevailing beliefs which put an increasing reliance on the
benefits of independence, boards predominated by independent directors do not appear to
be any better able to induce the CEO to pursue innovation than those otherwise. The
same result holds for board size. In contrast, firms with less diverse boards are more
6

likely to innovate. The result also holds when the CEO is not Chairman of the Board and
the CEO has equity ownership.
The rest of the paper is outlined as follows. I review the literature in Section 2, providing
background theory and the associated empirical studies. In Section 3, I present a
conceptual framework which motivates the importance of corporate governance in
innovation. The hypotheses are explained in Section 4. I explain the construction of the
variables and the dataset in Section 5. The estimation techniques and results are discussed
in Section 6. The paper concludes in Section 7.
2. Review of Literature
The idea that the CEO will shun investments in innovation, if left on his own volition, is
a straightforward application of the principal agent problem in its moral hazard form.
Stockholders delegate control of the firm to the CEO with the contractual expectation that
managerial decisions will advocate shareholder interests. There is, however, no guarantee
that the CEO will fulfill his obligations because the pursuit of shareholder value
maximization does not necessarily complement the CEO’s inherent desire to enhance his
own utility. Maximization of utility involves the CEO mitigating risk exposures to his
career and reputation, which necessitates him to provide insufficient attention to
innovation or entirely abandon projects associated with it. His decision not to pursue
innovation is a hidden action that shareholders cannot fully observe and contravenes their
interest.
Ideally, the contract between the CEO and the stockholders should resolve this agency
problem. However, even with the most appropriate design and intent, a contract which
details the CEO’s fiduciary duties and the permissible boundaries of his actions is
ultimately second-best. Contracts involve substantial transactions costs which render
them incomplete or incomprehensive; no contract can account for all future states of the
world and the actions that the CEO may take. The divergence in interest and the inability
to create a perfect contract provide a rationale for corporate governance (Hart, 1995). It
7
creates a system that impels the CEO to choose strategies that boost shareholder value, in
general, and that an optimal strategy would involve the pursuit of innovation, in
particular. Corporate governance incorporates the provision of incentives in the form of
executive compensation (Murphy, 1999) and the supervision of managerial behavior
through the board of directors (Hermalin, 2005) and ownership structure (Becht, et.al.,
2003).
Managerial resistance to innovation is well recognized in theory. Holmstrom (1989) sums
up the basis for viewing innovation within an agency framework. Innovation is (i) risky,
(ii) unpredictable, (iii) long-term and multi-stage, (iv) labor-intensive, and (v)
idiosyncratic. A divergence of risk attitude and incentive between the stockholders and
the CEO will therefore lead to a divergence of interest. On the one hand, a generic
stockholder is risk neutral. He has a diversified portfolio of investments which effectively
immunizes him from the risks he bears. Accordingly, he would be interested in exploiting
risk-reward strategies associated with investments in innovation. These are inherently
risky and long-term, but carry expectations of wealth maximization. A generic CEO, on
the other hand, is risk averse. He has a firm-specific risk-reward behavior, contingent on
what benefits he can accumulate from his job now and in the near future. Accordingly,
concerns for job security and enhancement of career and reputation will dampen his
inclination to innovate.
The corporate governance of innovation revolves mainly on the reputational and career
concerns of the CEO. In essence, if the CEO innovates, he faces the prospect of risky
ventures whose commercial exploitations may well in fact go beyond his incumbency.
Innovation is costly and entails several stages of market testing to evaluate its
commercial viability. These include meeting quality standards, in the case of product
innovation and searching for the most efficient technique, in the case of process
innovation. Its implementation can be hindered by the lengthy process of applying for a
patent and the indeterminacy of being a granted a patent. Moreover, its subsequent
disclosure allows competitors the potential to imitate or re-engineer the innovation. In all,
innovation requires a high degree of tolerance for error and possibilities of commercial
8

failure. This creates an insecure job status for the CEO which he would most likely try to
avoid.
Holmstrom (1999) and Holmstrom and Ricart i Costa (1986) point out that the CEO’s
investment behavior is contingent on how the market evaluates his performance. The
CEO wants to be viewed as an effective decision maker, skilled in selecting projects and
nurturing them with success. Concerns for prestige and status will therefore make him
decide against undertaking innovation projects. In a model of learning, the CEO knows
that his ability is being inferred over time based on past performance. Although he cannot
manipulate project outcomes, he can mask potential signals of low ability by selecting
projects that suit him best. The choice of project is a hidden action by the CEO and so he
can refrain from choosing innovation. Hirshleifer and Thakor (1992) support the idea of
reputation building by the CEO. They postulate a model of managerial conservatism in
the CEO’s choice of investment. The CEO identifies the safe projects from the risky
ones, and the choice is private knowledge. The stockholders can only observe the success
or failure of the project. Although safe projects intrinsically yield lower financial returns,
these have a higher probability of success. Since the CEO’s reputation is built on project
outcomes, he will therefore prefer the safe projects. The model highlights the distortion in
investment policy arising from misaligned interests; the stockholders main interest is
financial gain, whereas the CEO’s main interest is the perceived value of his human
capital.
Zwiebel (1995) demonstrates that CEOs will particularly avoid innovation projects which
have the potential to become an industry standard, favoring instead those which are less
original and less complicated. Conventional projects are preferred because they have a
low probability of failure and the yardstick in which the CEO’s competence is assessed is
easier to understand. Therefore, evaluations of his reputation are more likely to be
comparable and positive. The model suggests a herd-like mentality by CEOs in that no
one wants to deviate from doing industry standards.
9

Along similar lines, Narayanan (1989) develops a model of managerial reputation which
explains the CEO’s myopic corporate behavior. In the interest of enhancing his career
quickly in order to earn higher wages, the CEO will choose short-term investment
projects over those which actually increase long-run shareholder wealth. The short-term
preference diminishes, however, with CEO experience. This happens because the market
continually updates its inferences about the CEO’s competence and a seasoned CEO has
already established a distinct reputation. The model also shows that corporate myopia is
inversely related to the CEO’s length of contract. Providing the CEO a long-term contract
gives him the incentive to value more highly the benefits from future cash flows than
those obtainable from short-term earnings. Such assertion complements Stein’s (1989)
version of myopic behavior. In his model, the CEO attempts to window-dress the firm’s
performance by focusing on activities which boost current earnings. The incentive arises
because high current earnings translate to high future earnings. In equilibrium, the market
detects the earnings manipulation and correctly revises the firm’s actual performance.
Nonetheless, the CEO persists in its attempt to fool the market.
Jensen (1986) documents evidence that CEOs elevate their status by building “empires.”
CEOs have a penchant for managing large projects to showcase their managerial flair,
rather than those that actually increase net present value returns in the long run. Also, by
running projects beyond their optimal size, the CEO can claim higher wages because he
has more resources under his control. In their survey of Fortune 100 companies, Poterba
and Summers (1995) report that CEOs have a short investment horizon, which is
suggestive of the theory of corporate myopia. CEOs set hurdle rates higher than the
required standard which implies the tendency to reject long term projects that potentially
increase shareholder wealth.
Using a longitudinal database of plant creations and destructions in the manufacturing
sector, Bertrand and Mullainathan (2003) suggest that CEOs may prefer to have the
“quiet life.” CEOs are not interested in building empires, in the sense of creating new
plants nor destroy existing ones, in the sense of shutting down old plants, with the net
effect that firm size is unchanged. This implies that CEOs do not have the inclination to
10
venture into new lines of business. They simply prefer to be a CEO with an
uncomplicated lifestyle.
Empirical evidence illuminating the relationship between corporate governance and
innovation is scanty. Using stepwise regression on a cross section of 94 Fortune 500
research-intensive firms, Hill and Snell (1988) find that concentrated ownership is
positively associated with innovation and see no support for the benefits of greater board
independence. They measure innovation in terms of R&D expenditures per employee.
Baysinger, Kosnik, and Turk (1991) obtain similar results. Their sample size is expanded
to 176 Fortune 500 firms spread across industries. They attribute the positive influence of
concentrated ownership on R&D expenditures to institutional investors. They also show
that innovation increases with greater insider board representation. Francis and Smith
(1995) show that the dispersion of equity shares does not incite companies to have the
propensity to innovate. In contrast, providing the CEO stock ownership rights leads to
higher innovation, a result that is also supported by Zahra (1996). Graves (1988),
however, contradicts the positive association between equity concentration and
innovation. Using data on 22 computer-manufacturing companies over the period 1976-
1985, he finds that a high concentration of institutional ownership suppresses R&D
spending. Contrary to expectations from the theoretical literature, Czarnitzki and Kraft
(2004) assert that manager-led firms have a higher propensity to innovate compared to
their owner-led counterparts. Their study uses probit and Tobit to estimate pooled data of
manufacturing firms over the period 1992-96.
3. Conceptual Motivation
I draw upon the structure of the agency model developed in Aggarwal and Samwick
(1999, 2003) to motivate the importance of corporate governance in innovation. The
model is meant to convey the idea that corporate governance can potentially be employed
to create an environment where the CEO is motivated and effectively supervised to
innovate.
11

Consider an agency problem where the stockholders appoint a CEO to pursue
investments in innovation. The payoff from innovating depends on the CEO’s dedication
or effort and a random component for which both the stockholders and the CEO have the
same prior distribution. This takes the form
21( , )2
I e em eε ε= − + (1)
where I is the payoff from innovation, e is managerial effort, and ε is a normally
distributed error term with mean zero and variance . The parameter m scales the
efficiency or intensity of effort.
2σ
The specification implies that innovation is not a deterministic function of effort alone.
The random component represents uncertainty in the outcome of the innovation projects
due, say, to technology shocks; it generates the differential attitude towards risk by the
CEO and the stockholders. Having the same prior distribution means that the CEO and
the stockholders have the same information set over all the possible states of nature
innovation takes. The stockholders offer the CEO a take-it-or-leave contract, and both
parties know that innovation not only carries the possibility of high reward (greater
wealth for the shareholders, prestige for the CEO) but also great risk (commercial failure,
CEO gets replaced). Both parties know the payoff from innovating. The CEO cannot hide
nor misrepresent information on projected earnings. However, stockholders cannot fully
observe the CEO’s choice of effort or level of dedication to innovate. This creates the
problem of hidden action. The stockholders must design an incentive scheme so that the
CEO puts forth the appropriate effort.
I assume that a representative stockholder has a well-diversified portfolio of investments
which makes for an attitude of risk neutrality. As such, stockholders have the collective
objective to maximize the expected value of the innovation projects, regardless of the risk
involved. The CEO, however, is risk averse. This stems from the assumption that his
income and utility are obtained from his job and status as a CEO. It is therefore to his
12

interest to secure his position by suppressing risky project ventures – in this case, those
involving innovation – and instead directing his effort on projects which generate
sufficient returns, reveal his productivity, and avoid failure. In other words, since his
career and reputation are tied solely on project returns, his behavioral preference would
be to choose safe investments with more certain outcomes.
As a useful benchmark, consider the ideal scenario where the CEO’s actions are fully
observable and that he actually prefers to innovate, such that he does not incur any
disutility from doing so. This will enable us to assess the degree of the agency problem.
Maximizing equation (1) with respect to effort yields
1e m= (2)
which implies that the CEO exerts the optimal effort to the extent dictated by his
efficiency to innovate. Therefore, it is optimal that the stockholders offer him a fixed
remuneration contract commensurate to the level of effort he provides.
However, given the maintained assumption that the CEO is risk averse and that his
choice of effort is not verifiable, the optimal contract cannot be contingent on effort. A
fixed wage is not viable because it does not provide the CEO the incentive to innovate.
Instead, the compensation scheme will have to depend on the payoff from innovating,
which is verifiable. The wage scheme is a linear incentive
Fw w Iα= + (3)
such that the CEO’s income is attributable not only to his fixed wage but also to
the returns generated by the innovation projects
w Fw
I . Since innovation depends on effort,
high returns on innovation signal a high propensity to innovate. The CEO’s propensity to
innovate is denoted by α .
13

In order to obtain closed-form results, we assume that the CEO has constant absolute risk
aversion represented by a negative exponential utility function
( )( , ) exp ( )u w e w c eη= − − +⎡ ⎤⎣ ⎦ (4)
His coefficient of absolute risk aversion is 0uu
η′′
= − >′
. His cost of innovation is
linearly increasing in effort ( )c e eλ= , where 0<λ . The reason for this disutility is two-
fold. First, the more he innovates, the more he exposes himself to the possibilities of
failure and revelation of managerial incompetence. Second, there is the opportunity lost
in enhancing his reputation. It means his effort is directed towards innovation, instead of
safe projects.
The CEO’s problem is to maximize his utility expressed by the program
21 2Fe
Max E u w em e eα ε⎧ ⎫
λ⎡ ⎤⎛ ⎞+ − + +⎨ ⎜ ⎟ ⎬⎢ ⎥⎝ ⎠⎣ ⎦⎩ ⎭ (5)
The following results are useful
2 2
2 2 2
1 12 2
12
F F
F
E w em e e w em e e
Var w em e e
α ε λ α λ
α ε λ α σ
⎡ ⎤⎛ ⎞ ⎛+ − + + = + − +⎜ ⎟ ⎜⎢ ⎥⎝ ⎠ ⎝⎣ ⎦
⎡ ⎤⎛ ⎞+ − + + =⎜ ⎟⎢ ⎥⎝ ⎠⎣ ⎦
⎞⎟⎠
(6)
Using the fact that [ ] 21( )2x xE u x u u ησ⎛ ⎞= −⎜ ⎟
⎝ ⎠ for 2~ ( , )x xx N u σ , then the CEO’s problem
can be rewritten as
14

21 1 2 2Fe
Max E w em e e 2 2α λ ηα σ⎡ ⎛ ⎞+ − + −⎜ ⎟⎢ ⎝ ⎠⎣ ⎦
⎤⎥ (7)
where 2 212
ηα σ is the cost of risk aversion. The expression in brackets represents the
CEO’s certainty equivalent, the minimum amount of riskless compensation that gives
him the same level of utility as under the risky contract. Taking the first order condition
and solving for effort yields
2e m λα
= + (8)
Compared with the benchmark case, there is suboptimal effort in that . The CEO
chooses to innovate less because he incurs disutility
1 e e> 2
0<λ from doing so. Of interest is
α , the CEO’s propensity to innovate. Since 22 0e λ
α α∂
= − >∂
, this pay-to-innovate
parameter can mitigate the suboptimality. The CEO exerts greater effort to innovate, the
higher is α .
The stockholders face the problem of offering a contract to the CEO that maximizes the
investment returns from innovating net of compensation costs. They do so by solving the
following program
21 ( ) (2 F )Max E I w em e w I
αα− = − − + (9)
( )
2
s.t. (IRC)
(ICC)
FE u w I e u
e m
α λ
λα
+ + ≥⎡ ⎤⎣ ⎦
= +
The stockholders must satisfy two constraints. First is the participation or individual
rationality constraint (IRC). The CEO has a reservation utility u which denotes an
outside opportunity that he can benefit from by working somewhere else. Therefore, the
15

stockholders must offer him a contract that provides no less than this utility. Second is the
incentive compatibility constraint (ICC). Given the compensation scheme, the CEO will
maximize his utility by selecting the optimal effort . Recognizing this, stockholders
need to ensure that the contract they offer is compatible with the CEO’s maximization
problem.
2e
Because the stockholders can always adjust the CEO’s compensation without affecting
the incentive compatibility constraint, the participation constraint binds and can be
rewritten as
2 212Fw I eα λ ηα σ u+ + − = (10)
Substituting equation (10) and the incentive compatibility constraint into the objective
function simplifies the problem into
2 21 1 ( )2 2
Max E I w m m m uα
λ λλ ηα α
⎡ ⎤⎛ ⎞ ⎛ ⎞− = + + − + − +⎜ ⎟ ⎜ ⎟⎢ ⎥⎝ ⎠ ⎝ ⎠⎣ ⎦α σ (11)
The first order condition yields
( 2 2 2 43
1 0λ λ α ησ αα )− − = (12)
The incentive solution is bounded between 0 and 1. The solution reflects a tradeoff
between risk sharing and the effort to innovate. Optimal risk sharing implies
*α
0α = , but
the CEO will not be inclined to innovate. Optimal innovation implies 1α = , but the CEO
will bear all risk.
16
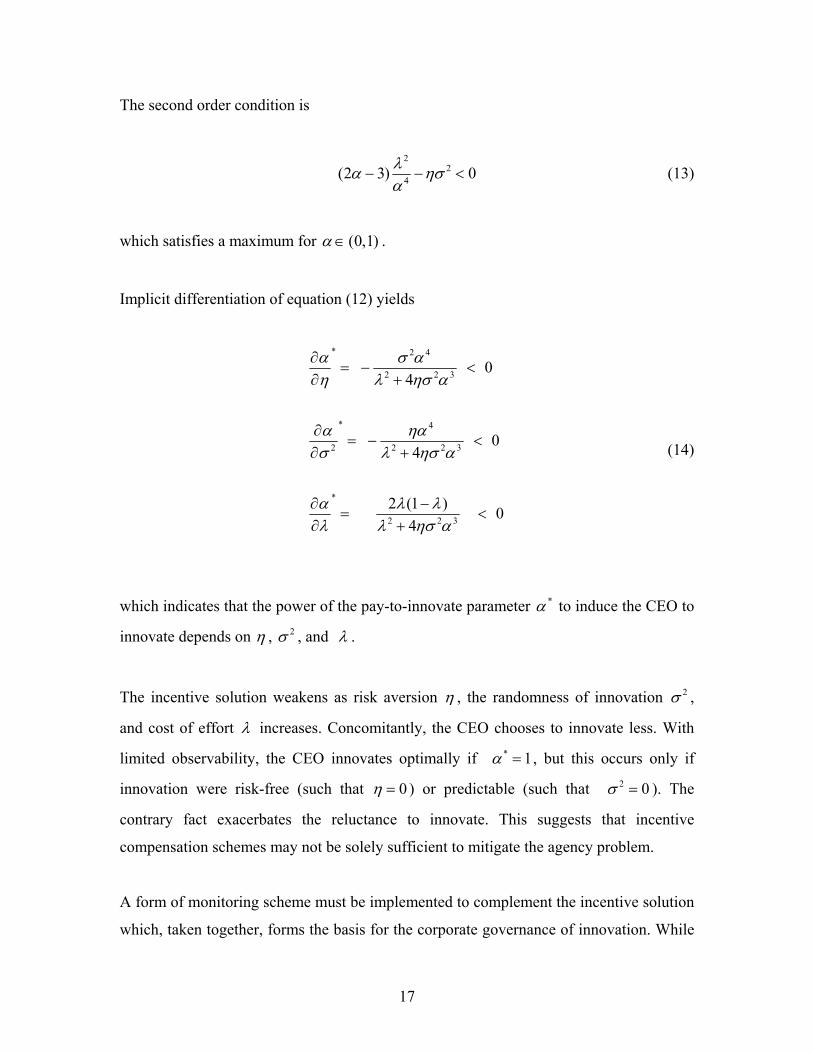
The second order condition is
2
24(2 3) 0λα ησ
α− − < (13)
which satisfies a maximum for (0,1)α ∈ .
Implicit differentiation of equation (12) yields
* 2 4
2 2 3
* 4
2 2 2 3
*
2 2 3
04
04
2 (1 ) 04
α σ αη λ ησ α
α ηασ λ ησ α
α λ λλ λ ησ α
∂= − <
∂ +
∂= − <
∂ +
∂ −= <
∂ +
(14)
which indicates that the power of the pay-to-innovate parameter to induce the CEO to
innovate depends on
*α
η , 2σ , and λ .
The incentive solution weakens as risk aversion η , the randomness of innovation 2σ ,
and cost of effort λ increases. Concomitantly, the CEO chooses to innovate less. With
limited observability, the CEO innovates optimally if * 1α = , but this occurs only if
innovation were risk-free (such that 0η = ) or predictable (such that ). The
contrary fact exacerbates the reluctance to innovate. This suggests that incentive
compensation schemes may not be solely sufficient to mitigate the agency problem.
2 0σ =
A form of monitoring scheme must be implemented to complement the incentive solution
which, taken together, forms the basis for the corporate governance of innovation. While
17

the idea of incentives – getting paid to innovate – encourages the CEO, monitoring
ensures that the CEO does just that. As echoed by Hermalin and Weisbach (2003),
corporate governance mitigates the incentive problem that “wanting to be seen as doing
the right thing and doing the right thing are not always the same.” Monitoring managerial
behavior may involve obtaining more information over the CEO’s decisions and
activities, eliminating marginal tasks to induce focus, and tolerating mistakes, in
recognition of the fact that innovation is an unconventional investment (Holmstrom,
1989). Corporate governance encourages the CEO and makes him accountable for his
actions. I identify in this paper the mechanisms of corporate governance that are
associated with this behavior.
4. Hypotheses
Corporate governance helps mitigate the agency problem of innovation essentially in two
ways: (i) incentivizing the CEO through an appropriate compensation scheme and (ii)
monitoring his performance. The key goal is to identify the governance mechanisms that
foster innovation. To systematize the analysis, I group these mechanisms into three
themes: (i) ownership structure, (ii) board of directors, and (iii) CEO stockholdings and
duality.
4.1 Ownership Structure
Ownership structure pertains to the dispersion or concentration of equity shares and the
resultant incentive and ability of the stockholder to monitor the CEO. A distinct feature
of market-oriented economies such as Australia, the United Kingdom, and the United
States is the widespread dispersion of equity shares. In this situation, each shareholder
owns a small fraction of outstanding stock. In its 2004 survey of corporate governance
among member countries, the Organisation for Economic Cooperation and Development
(OECD) reports that the largest voting block in the US and UK has a median holding of
10%. In my Australian data, the largest stockholder has a median holding of 18%.
Dispersion conveys the economic merit of risk diversification and liquidity. However,
18

when shares are widely dispersed, collective shareholder action becomes a problem.
Although shareholders have the collective interest to enforce innovation as a value-
maximizing strategy, the collective action to evaluate the CEO’s performance is
ultimately an individual decision that benefits everyone. Monitoring the CEO is a public
good that is likely to lead to a free-rider problem. Monitoring is costly because a
stockholder expends his own time, money, and effort to understand corporate affairs and
voice his concerns at his own cost. With a small ownership in the company, he has little
or no incentive to supervise managerial behavior. Widespread dispersion creates a
situation wherein each stockholder rationally thinks and hopes that somebody else will
monitor the CEO, which results in understated or practically zero supervision. The CEO,
in effect, become unaccountable to the stockholders and is not effectively controlled.
A governance mechanism that potentially remedies the free-rider problem is concentrated
ownership. A large shareholder has the motivation to acquire information, verify
performance, and enforce value-based innovation strategies. His significant ownership
rights imbue him voice and power in the decision-making process. Shleifer and Vishny
(1986) motivate the importance of equity concentration in a model in which firm value
increases in the presence of a large shareholder. Claessens, et. al. (2002) provide
evidence that firm performance is enhanced when shares are concentrated under
reasonable threshold levels. Moreover, firms governed by large shareholders are better
able to design a compensation scheme that reflects CEO performance. The CEO is less
able to set his own pay and extract rents (Core, 1999; Bertrand and Mullainathan, 2001).
Value-based management is therefore reinforced when stockholders can exert adequate
control and supervision. The hypothesis is:
Hypothesis 1: Concentrated ownership or the presence of a large shareholder encourages
the CEO to have the propensity to innovate.
19
4.2 Board of Directors
Another corporate mechanism that stockholders can use to govern the innovation
behavior of the CEO is the board of directors. The board of directors acts as a middle
man between shareholders and the CEO. Since the directors are elected by stockholders,
they are supposed to represent their rights and interests. It is through the board where
managerial decisions are evaluated and strategic shifts specified. The board, in short,
establishes the rules of the game advocated by shareholders that guide CEO behavior.
An element crucial to the board’s effectiveness in supervising the CEO is its
independence. A typical board consists of insiders and outsiders. An insider is a director-
executive who is a current or former employee of the company. An outsider is a non-
executive director who is not working for the company. Apart from his directorship, an
outsider practically does not have any financial ties and vested interests in the company.
An outsider is viewed as an epitome of the virtues of independence: disinterested and
probing. On this basis, outsiders are also called as independent directors and insiders as
non-independent directors. The expectation is that a board predominated by or composed
entirely of outsiders would have no preferential treatment towards managerial interests.
They are not working for management and so the CEO cannot influence their judgment.
However, one could also argue that outsider representation poses no significant
advantage. Outsiders are essentially what they are – outsiders. Because they derive no
marketable financial gain except perhaps prestige, not only can they be disinterested in
the affairs of the business, but can be uninterested as well.
Corporate best practice guidelines in Australia, the United Kingdom, and the United
States espouse the benefits of board independence, recommending that majority of board
seats should be held by independent directors as much as possible (OECD, 2004). The
Australian Council of Super Investors (2004) report that independent directors constitute
majority of the board seats in the top 100 publicly-listed Australian firms in 2003. Klein
(1998) show a similar predominance for US firms listed in the S&P 500 for 1992-1993,
with almost 60% of board seats considered as independent.
20

Hermalin (2005) presents a theory of board supervision and its impact on managerial
behavior. The board monitors the CEO to evaluate his effectiveness in advocating
shareholder interest. In this model, monitoring corresponds to the board’s independence;
in equilibrium, the greater the intensity of monitoring, the stronger is the incentive for the
CEO to do well. The empirical evidence linking board independence and firm
performance is, however, mixed. Hermalin and Weisbach (1991) cast doubt on the
association, suggesting that insiders and outsiders are equally likely to provide good or
bad supervision. Klein (1998) and Bhagat and Black (2001) also report the absence of
any systematic relationship; firms with a greater proportion of independent directors do
not exhibit higher valuation than others. Nonetheless, Weisbach (1988) finds that
independent directors are more likely to remove the CEO following poor performance,
suggesting the idea that board independence can improve firm value through CEO
replacement.
Apart from independence, I also examine the relevance of board size and diversity. As in
any other group, the number and diversity of board members can have an effect on
overall cohesion and group dynamics. Board size may matter because directors must
collaborate with each other when evaluating the CEO. While a large board intuitively
implies more monitoring directors, it also poses two potential problems. First, it can
become bureaucratic, which impairs the coordination and implementation of decisions.
Second, it creates an internal free-rider problem in that some directors might tacitly prefer
to dodge responsibility, delegating it to the board as a whole. These imply that the quality
and intensity of monitoring may weaken when boards become large. In contrast, a board
of few directors might be able to examine issues more carefully, make more informative
decisions, and better supervise the CEO. Jensen (1993) typifies this idea, advocating
small boards of no more than eight directors to improve performance.
Yermack (1996) and Eisenberg, et. al. (1998) document an improvement in firm value
when boards are small. Aggarwal and Nanda (2004) also support this finding, taking the
view that a board with several directors imposes multiple tasks on the CEO which
weakens his focus. Beiner, et. al. (2004), on the other hand, report no relationship
21

between board size and performance, a result suggestive of Hermalin and Weisbach’s
(2003) equilibrium interpretation that firms determine their optimal number of directors.
I also test whether a diverse board instigates the CEO to innovate. A mix of directors
with different backgrounds, for example, in terms of academic or industry expertise,
opens up a variety of individual perspectives and experiences which possibly promote
creativity and responsiveness to new ideas. In addition, the quality and intensity of CEO
supervision may be enhanced because performance issues are viewed more broadly and
problems are confronted with alternative solutions. In contrast, a grouping of people with
common values, attitudes, and beliefs can become quite resistant to change and lead to
stagnation of ideas and blunt receptiveness to creativity.
Carter, et.al. (2002) examine diversity in terms of the gender and ethnicity of board
members, finding a positive association between firm value and diversity. Adams and
Ferreira (2004) also find that gender diversity appears to enhance the effectiveness of the
board insofar as the directors become more involved in board meetings. Ancona and
Caldwell (1992), on the other hand, caution against an unwavering reliance on diversity,
noting that while group heterogeneity encourages creativity, it can also hamper the
implementation process because of greater dissonance among members.
Hypothesis 2: Boards which are small, diverse, and independent are better able to
monitor the CEO to innovate.
4.3 CEO Stockholdings and Duality
A distinct board characteristic exhibited by some firms is CEO duality, wherein the CEO
is also Chairman of the Board. This creates a potential problem in that it invalidates the
premise of the board supervising the CEO. The CEO is being monitored by a board
presided over by the very same person being monitored. While the Chairman supposedly
protects the interests of the stockholders, the CEO embodies his own vested interests. A
duality in function leads one to question the impartiality of actions or decisions made by
22

the board. Such is the case observed by Jensen (1993) who argues that any potential
divergence of views between the board and CEO-Chairman almost always gets tilted in
favor of a dual CEO. A separation of roles reinforces the board’s integrity, which leads to
better supervision and firm performance.
The empirical evidence on duality is mixed. While Rechner and Dalton (1991) support
the separation of roles, Brickley, et.al. (1997) view duality as advantageous. Combining
the role of the CEO and Chairman into one facilitates the transfer of information between
the CEO-Chairman and the rest of the directors.
The corporate governance of innovation use monitoring schemes to reinforce the CEO’s
interest in value-maximization. In conjunction with supervision, a straightforward aspect
of governance is to incentivize the CEO by tying his compensation with the firm’s
performance. I test whether the CEO will take a value-based approach to innovation if
part of his compensation is equity-based. Providing the CEO equity rights might help
attenuate the agency costs of innovation because he assumes co-ownership of the firm.
On this basis, the CEO is then inclined to innovate, viewing it as an appropriate strategy
to increase not only the shareholders’ wealth but his own as well.
Jensen and Murphy (1990) estimate the CEO’s share of value creation, finding that CEOs
in the United States receive about $3.25 for every $1,000 increase in shareholder wealth.
Although the pay-performance sensitivity appears to be low, Haubrich (1994) contends
that the incentive mechanism need not be expensive and is not necessarily inconsistent
with a CEO who is sufficiently risk averse. Holmstrom and Kaplan (2003) report an
increasing trend in the use of equity-based compensation in US companies, which
resulted in a more than ten-fold increase in the pay-performance sensitivity over the
period 1980-1999. The trend is exhibited worldwide, but more modest compared to US
levels (Murphy, 1999; Becht, et. al. 2003). In Australia, equity incentives accounted for
about a quarter of total compensation received by CEOs in the top 100 firms in 2003, a
four-fold increase from previous 1980s levels (Australian Council of Super Investors,
2004).
23

The evidence linking firm performance and equity compensation is mixed, with Mehran
(1995) and Hall and Liebman (1998) reporting a positive association. The incentive
solution is particularly strong when the CEO initially has low ownership (Ofek and
Yermack, 2000). In contrast, Loderer and Martin (1997) and Himmelberg, et.al (1999)
report no systematic association.
Hypothesis 3: Innovation is increasing in CEO equity compensation. A separation of
CEO-Chairman roles makes for better control of managerial tasks conducive to
innovation.
5. Variables and Data Description
5.1 Innovation
I use patent applications as my measure of innovation. Patent applications provide a
direct representation of the outcome of the innovation process. Also, patent applications
more closely reflect the actual timing of innovation (Hall, et.al., 2001). I use the variable
Patent applications to designate the number of patents applied for by a firm at a given
year.
5.2 Corporate Governance Variables
5.2.1 Ownership Structure
I characterize a firm’s ownership structure by measuring the (i) concentration of equity
shares and the (ii) stockholder’s incentive and ability to monitor the CEO.
I use the Herfindahl Equity Index to measure equity concentration. Given data on all N
equity holdings, then the Herfindahl index can be computed straightforwardly as NH
24

2
2
1
1Ni
Ni N
SHT N
Nσ=
⎛ ⎞= = +⎜ ⎟
⎝ ⎠∑ (15)
where equity holding of stockholder i, iS =1
N
N ii
T=
= S∑ , and 2
2
1
1 1Ni
i N
SN T N
σ=
⎛ ⎞= −⎜ ⎟
⎝ ⎠∑
The index ranges from a value of 1N
, in which firms have symmetric shares, to 1,
which indicates maximum concentration. A value close to zero indicates that ownership
is widely dispersed. Because equity shares are squared before summing them up, the
index achieves convergence quickly and stockholders with large holdings are weighted
more heavily.
However, I can only get data on outstanding common equity shares for the top 20
stockholders and the sum of all N holdings. A potential problem exists in that the N-20
shares need to be accounted for and ignoring them would likely produce biased estimates
of the Herfindahl index. I circumvent this problem by adjusting the computation for the
index using the method prescribed by Cubbin and Leech (1983).
My data is an ordered sequence
(16) 1 2 20... ... NS S S S≥ ≥ ≥ ≥ ≥
If all N holdings are available, then I can rewrite equation (15) as
( )220
220 20
1
1iN
i N
SH CT NH −
=
⎛ ⎞= + −⎜ ⎟
⎝ ⎠∑ (17)
where 20
201
i
i N
SCT=
⎛= ⎜
⎝ ⎠∑ ⎞
⎟ and 2
2021 20
Ni
Ni N
SHT−
= −
⎛ ⎞= ⎜ ⎟
⎝ ⎠∑
25
The absence of data on the remaining N-20 shares requires calculating a lower and upper
bound to estimate , and hence obtain an estimate for . 20NH − NH
20NH − reaches its upper bound if 20NT − , the sum of the remaining shares, is concentrated
or held by as few stockholders as possible. To obtain this, we let and assume
are negligible such that
21 20S S=
22 23, ,..., NS S S 21 20 20NS S T −= = . Therefore, and 20 1NH − =
2 2020(1 )
N
SCT
− = . An upper bound on is thus NH
220
20
1
iUpper Bound
i N N
S SHT T=
⎛ ⎞= +⎜ ⎟
⎝ ⎠∑ (18)
20NH − reaches its lower bound if the 20NT − shares are widely dispersed or held by as
many stockholders as possible. In the limit, 20 0NH − = . A lower bound on is thus NH
220
1
iLower Bound
i N
SHT=
⎛ ⎞= ⎜ ⎟
⎝ ⎠∑ (19)
I then take the average of the lower and upper bounds to obtain an approximation of the
Herfindahl equity index on the whole distribution. For ease of interpretation of the
empirical results, I multiply the index by 100 to express it as a percent.
Apart from equity concentration, I verify whether the presence of a large shareholder can
help mitigate the agency problem of innovation. I do this in two ways. First, I use the
percentage of outstanding equity shares held by the largest stockholder. This is the
conventional, straightforward way of measuring the effect of an active stockholder.
Second, I use the Banzaf power index. A large shareholder is usually defined in terms of
a stockholder owning an arbitrary, fixed percentage of shares which gives him voting
rights to control the CEO’s behavior. However, a fixed criterion does not incorporate
variations in equity holdings. While a substantial shareholding is required for a highly
26
concentrated ownership, a smaller proportion may just as well be sufficient for control
when shares are widely dispersed. I use this insight in gauging the power or the ability
and incentive of the largest shareholder to supervise the CEO. I use the Banzhaf index to
measure the ability of the largest shareholder to influence the voting outcome. The power
index explicitly takes into account the idea that stockholders strategically form coalitions
in order to pass a motion. They do so because as is typical in most publicly traded
companies with widely dispersed ownership, no particular shareholder has enough voting
stock to win in a simple majority. Moreover, as Leech (2002) argues a coalition may still
be necessary even when shares are highly concentrated. For example, a company with
three shareholders in which two each has 49% of outstanding shares and the third with
2% will still need to have at least two stockholders supporting each other in order to pass
a motion.
The Banzahf power index is given by
1
ii N
ii
Banzahf β
β=
=
∑ (20)
where iβ counts the number of times that stockholder i is able to win a motion in a
simple majority rule by forming a coalition with others and N is the total number of
possible winning coalitions. As constructed, [0, 1]iBanzahf ∈ . Shareholder power
increases the closer is the index to 1.
As an example, consider the case of the company with three stockholders with
shareholdings , , and 1 49%s = 2 49%s = 3 2%s = . There are 4N = possible winning
coalitions in a simple majority rule in which shareholders decide whether to accept or
reject the CEO’s proposal. These are , , , and . In these
coalitions, stockholder is a critical voter in that he is needed three times to pass a
1 2{ , }s s 1 3{ , }s s 2 3{ , }s s 1 2 3{ , , }s s s
1s
27
decision in tandem with either or . The same reasoning applies to and .
Therefore, each stockholder has the same Banzhaf index of 33%.
2s 3s 2s 3s
My use of the Banzahf index substantiates the important point that shareholder power is
not necessarily based on the percentage of shares owned. In this example, the stockholder
with only 2% of the shares has, in fact, the same power as those with 49%. This implies
that stockholders need to take into account the strategic, and not the absolute, advantage
of their ownership rights, and there is evidence to suggest that stockholders do so (Maug
and Rydqvist, 2004).
Because I only have data on the 20 largest shareholders, I compute for the index by
assuming an oceanic setup of voting, following Leech (2002). This means that there are
only a few large shareholders and the rest are infinitesimally small. This assumption fits
my data quite well in that the shareholdings are widely diffused. The same procedure for
calculating the index is used and the idea of making the unknown holdings negligible
appears innocuous. I use a program made available online by Leech (2002),
http://www.warwick.ac.uk/~ecaae/, which automates the calculation of the power index.
This eases the burden of manually computing for the index, as the procedure can get very
cumbersome. I use the variable Banzhaf to designate the Banzhaf index of the largest
shareholder, expressed in percent.
5.2.2 Board of Directors
I use the variable Board independence to estimate the hypothesized relationship between
board independence and innovation. Board independence is measured by the proportion
of directors that are independent. I follow Becht, et.al. (2003, p. 31) to verify
independence. A director is independent if he is “not employed by the corporation, is not
engaged in business with the corporation, and is not a family member.” Also, I do not
consider as independent a director who holds substantial shares in the company, which is
at least 5% as defined in Australia’s Corporations Act of 2001. To explain how the
number of directors can affect the CEO’s innovation decision, I create the variable
28
(log) Board Size, which is the number of directors, in logs. As will be detailed in section
6 (Empirical Framework and Analysis of Results), the use of logs provides an elasticity
interpretation of the variables. I use the variable Board diversity, which is an entropy-
based diversity index to capture functional diversity on the board. I classify each director
into three categories, which represent the director’s distinct industry expertise and
academic background. These are business, science, and the arts. I use Teachman’s (1980)
index to measure diversity
3
1
(ln )ii
iBoard diversity p p=
= ∑ (21)
where ip is the proportion of directors classified into a particular category i. The index
ranges from 0 to approximately 1. The greater the distribution of directors across
categories, the higher is the index.
5.2.3 CEO Stockholdings and Duality
To test the hypothesis that a separation of CEO-Chairman roles is associated with a
higher propensity to innovate, I define the variable , if the CEO is
not the Chairman of the Board. The idea of incentivizing the CEO to innovate through the
provision of equity ownership is represented by the variable (log) CEO Stockholdings,
which is the fraction of outstanding equity held by the CEO, in logs.
/{ } 1CEO Chairman =
5.3 Control Variables
I consider the effect of competition on innovation using the industry Lerner index. I do
this by calculating the index at the firm level and averaging them out to obtain an
estimate at the industry level, following Aghion, et.al., (2002). The approximation at the
firm level is
29

- c = it itit
it
EBITDA financial tFirm Lerner Indexsales
os (22)
where EBITDA is earnings before interest, taxes, and depreciation of firm i at time t. The
financial cost of capital is obtained by multiplying the cost of capital with the capital
stock. I assume a fixed cost of capital of 8.5%, which is the same value used by Aghion,
et.al. (2002) in their study of competition in the UK market. The institutional similarity
between Australia and the UK provides me reasonable basis to use the same value, in the
absence of a readily available value for Australia. Capital stock is calculated using the
perpetual inventory system, using the framework of Salinger and Summers (1984). This
is meant to transform the book value of capital into its replacement value. In essence, the
perpetual inventory system works by iteratively adding this year’s capital expenditures to
previous year’s capital stock, to obtain current capital stock, adjusted for inflation and
depreciation. I use the book value of capital stock in 1994 as my starting value.
The perpetual inventory system is given by
11
(1 )tit it it
t
pK K I dp−
−
⎡ ⎤⎛ ⎞= + −⎢ ⎥⎜ ⎟
⎝ ⎠⎣ ⎦ (23)
where is gross property, plant, and equipment for firm i at time , itK t tp is the deflator
for gross fixed capital formation, itI is capital expenditures, and is the depreciation
rate. I use depreciation rates of 4% and 8%. Values for capital stock, however, do not
appear to be sensitive to different rates of depreciation.
d
The Lerner index at the industry level is
1 = 1 jt ii jjt
tIndustry Lerner Index Firm Lerner IndexN ∈
− ∑ (24)
30

I obtain this by taking the average of firm-level Lerner indices associated with industry j
at time t, using all the N firms listed on the Australian Stock Exchange, and subtracting it
from 1 to get a more direct interpretation of the index. The index ranges from 0, which
characterizes a monopoly, to 1, which is perfect competition. I refer to the variable
Lerner Index to indicate its industry-level estimate. I multiply this index by 100 to
express it in percent form.
I include CEO tenure, which is the number of years that a CEO has served in his position,
as a control for the CEO’s experience. This accounts for the idea that a seasoned or well-
experienced CEO may be more receptive to strategic risk management decisions. Simsek
(2007) reports that well-experienced CEO’s show a greater inclination to engage
management to pursue strategic investment projects. His past experience and
accumulated knowledge may therefore enable him to better gauge the benefits involved
with innovation and contain the associated risks. The idea that large firms innovate more
is captured by the variable (log) Employees, which is the (log) number of employees a
firm has. I use the variable (log) R&D/employees to account for the positive patent-R&D
relationship posited by Hausman, et.al. (1984) and Hall and Ziedonis (2001). I obtain this
variable by dividing a firm’s R&D spending by its employment size and taking the value
in logs, so as not to confound its effect with firm size. Stein (2003) documents the idea
that firms with more cash and less debt invest more. I examine this proposition in the
case of investments in innovation using the variables Cash flow/Assets = 100⋅(cash flow
before interest expense/total assets) and Debt/Assets = 100⋅(total liabilities/total assets).
5.4 Data
I use a panel of 197 firms drawn from the IBIS World database, provided by the
Melbourne Institute of Applied Economic and Social Research. It covers the period 1994-
2003, giving a total of 1,970 observations. The IBIS dataset supplies information on
patent applications, R&D expenditures, and number of employees for both domestic and
multinational firms. From this, I draw a sample of locally-owned Australian companies
listed on the Australian Stock Exchange. Publicly-listed firms are likely to exhibit the
31

agency problem of innovation. The firms are mostly large in that 77% have at least 200
employees. The Australian Bureau of Statistics (2003-2004) classifies firms as large if
they have at least 200 employees. Corporate governance data on equity shares, board size
and composition, and CEO profile are assembled from company annual reports,
downloaded from Aspect Huntley Annual Reports Online. Company financial data are
sourced online from Aspect Huntley FinAnalysis. These include EBITDA, cash flow,
assets, debt, investments, and property, plant and equipment. These are then matched
with the IBIS dataset. All nominal variables are deflated using implicit GDP price
deflators, culled from the Australian Bureau of Statistics Australian System of National
Accounts, 5204.0, 1999-00 and 2003-04. I specifically use the deflator for private gross
fixed capital formation to calculate capital stock at replacement value.
The classification scheme of the Global Industrial Classification Standard is used to
group the firms into 16 industries (Table 1). Almost 60% of the firms come from the
Materials (31%), Capital Goods (16%), and Food, Beverage, and Tobacco Industries
(12%). Figure 1 shows the frequency distribution of patent applications. The distribution
is skewed towards a few small values, with 76% of observations recording zero patent
applications. This high proportion of zeroes is commonly observed in the literature. On
average, firms apply for one patent per year (Table 2). The highest number recorded is 97
patent applications in the Healthcare Equipment & Services Industry. Figure 2 shows that
over the period 1994-2003, firms in the Consumer Services Industry accounted for more
than 40% of the total number of patent applications, followed by those in the
Pharmaceutical & Biotechnology (18%) and Household & Personal Products (7%)
32
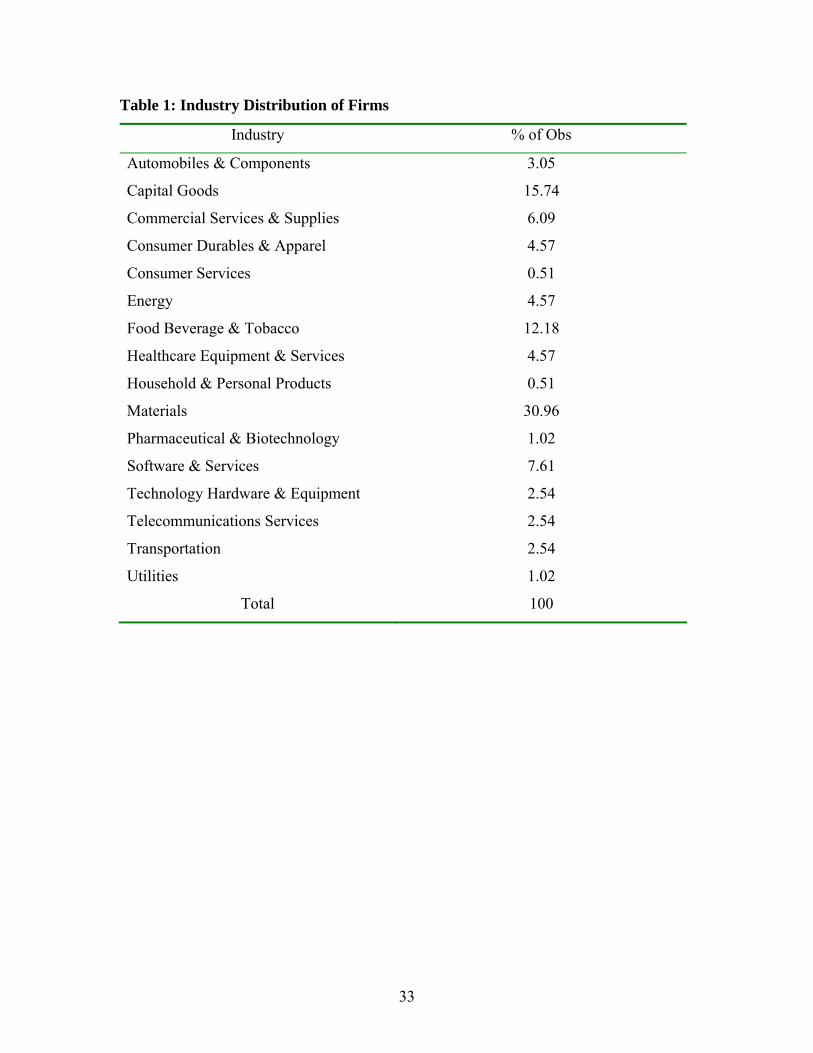
Table 1: Industry Distribution of Firms
Industry % of Obs
Automobiles & Components 3.05
Capital Goods 15.74
Commercial Services & Supplies 6.09
Consumer Durables & Apparel 4.57
Consumer Services 0.51
Energy 4.57
Food Beverage & Tobacco 12.18
Healthcare Equipment & Services 4.57
Household & Personal Products 0.51
Materials 30.96
Pharmaceutical & Biotechnology 1.02
Software & Services 7.61
Technology Hardware & Equipment 2.54
Telecommunications Services 2.54
Transportation 2.54
Utilities 1.02
Total 100
33
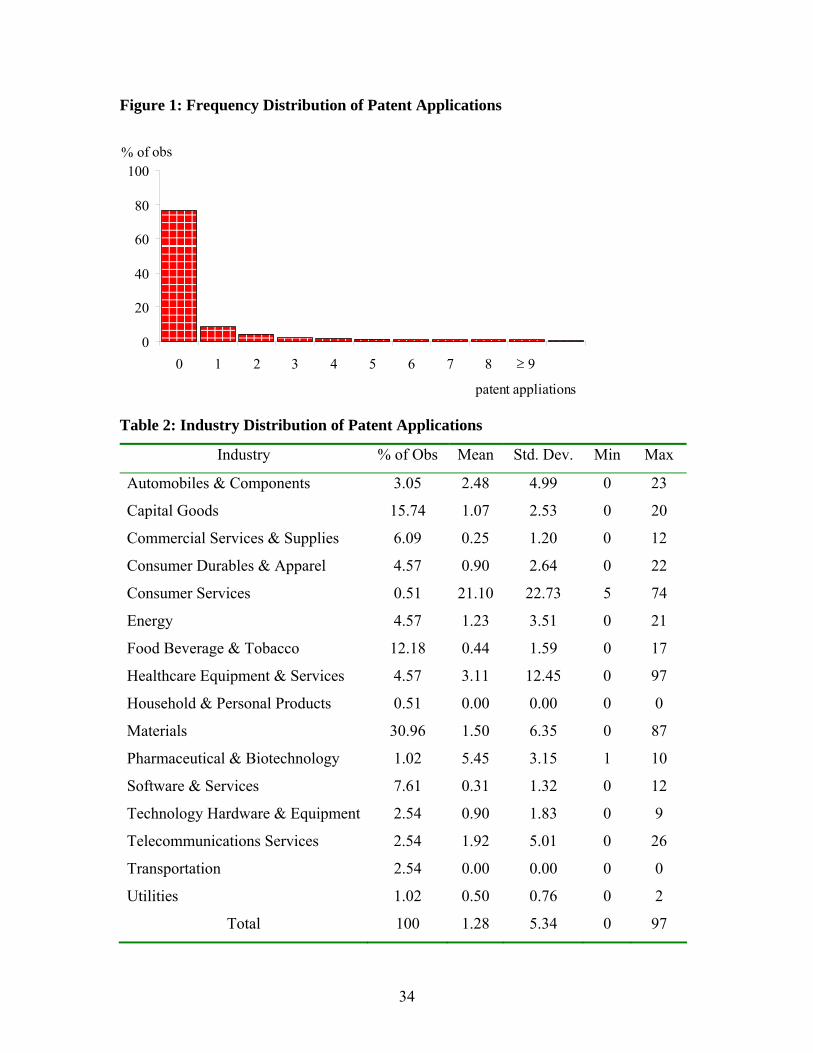
Figure 1: Frequency Distribution of Patent Applications
0
20
40
60
80
100
0 1 2 3 4 5 6 7 8 9 10
patent appliations
% of obs
≥ 9
Table 2: Industry Distribution of Patent Applications
Industry % of Obs Mean Std. Dev. Min Max
Automobiles & Components 3.05 2.48 4.99 0 23
Capital Goods 15.74 1.07 2.53 0 20
Commercial Services & Supplies 6.09 0.25 1.20 0 12
Consumer Durables & Apparel 4.57 0.90 2.64 0 22
Consumer Services 0.51 21.10 22.73 5 74
Energy 4.57 1.23 3.51 0 21
Food Beverage & Tobacco 12.18 0.44 1.59 0 17
Healthcare Equipment & Services 4.57 3.11 12.45 0 97
Household & Personal Products 0.51 0.00 0.00 0 0
Materials 30.96 1.50 6.35 0 87
Pharmaceutical & Biotechnology 1.02 5.45 3.15 1 10
Software & Services 7.61 0.31 1.32 0 12
Technology Hardware & Equipment 2.54 0.90 1.83 0 9
Telecommunications Services 2.54 1.92 5.01 0 26
Transportation 2.54 0.00 0.00 0 0
Utilities 1.02 0.50 0.76 0 2
Total 100 1.28 5.34 0 97
34
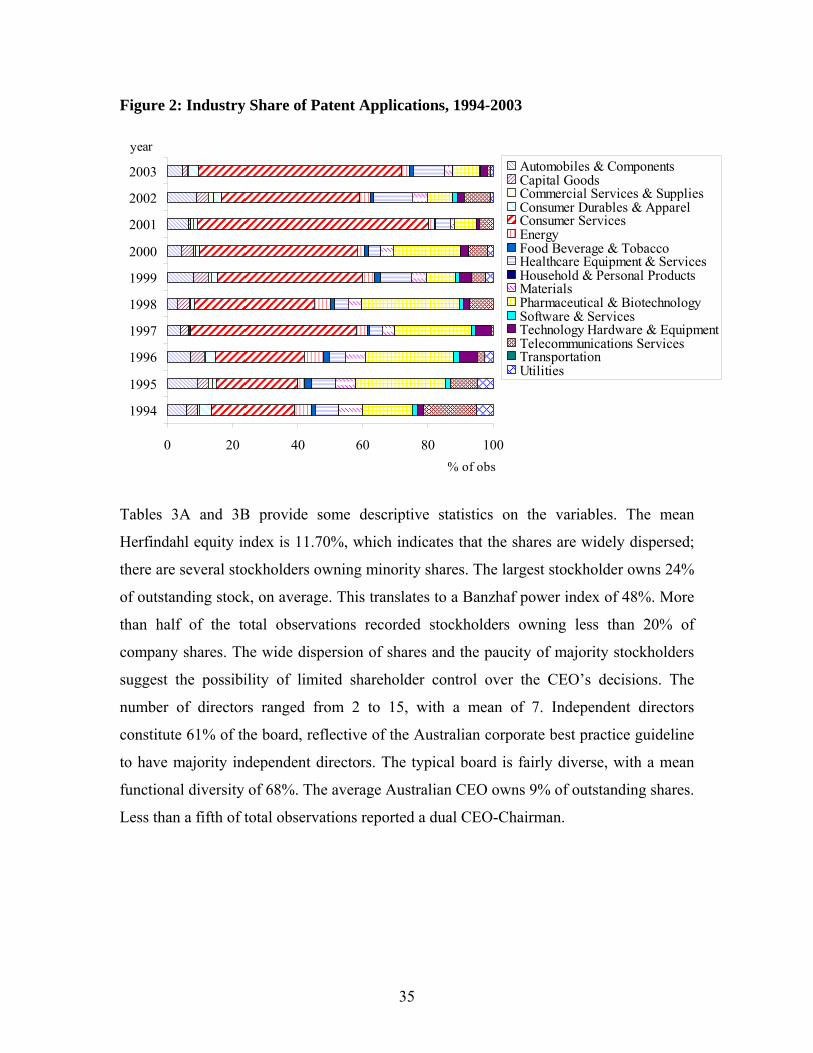
Figure 2: Industry Share of Patent Applications, 1994-2003
0 20 40 60 80 100
1994
1995
1996
1997
1998
1999
2000
2001
2002
2003
year
% of obs
Automobiles & ComponentsCapital GoodsCommercial Services & SuppliesConsumer Durables & ApparelConsumer ServicesEnergyFood Beverage & TobaccoHealthcare Equipment & ServicesHousehold & Personal ProductsMaterialsPharmaceutical & BiotechnologySoftware & ServicesTechnology Hardware & EquipmentTelecommunications ServicesTransportationUtilities
Tables 3A and 3B provide some descriptive statistics on the variables. The mean
Herfindahl equity index is 11.70%, which indicates that the shares are widely dispersed;
there are several stockholders owning minority shares. The largest stockholder owns 24%
of outstanding stock, on average. This translates to a Banzhaf power index of 48%. More
than half of the total observations recorded stockholders owning less than 20% of
company shares. The wide dispersion of shares and the paucity of majority stockholders
suggest the possibility of limited shareholder control over the CEO’s decisions. The
number of directors ranged from 2 to 15, with a mean of 7. Independent directors
constitute 61% of the board, reflective of the Australian corporate best practice guideline
to have majority independent directors. The typical board is fairly diverse, with a mean
functional diversity of 68%. The average Australian CEO owns 9% of outstanding shares.
Less than a fifth of total observations reported a dual CEO-Chairman.
35

Table 3A: Descriptive Statistics
Variable Mean Std. Dev. Min Max
Patent Applications 1 5.34 0 97
Ownership Structure
Herfindahl Equity Index 11.70 13.53 0.19 78.96
Banzhaf 48.23 33.65 9.17 100
Shares of Largest Stockholder 24.23 18.36 0.79 88.77
Board of Directors
Board Independence 60.52 20.10 0 100
Board Size 7 2.13 2 15
Board Diversity 68.31 29.61 0.23 109.86
CEO Stockholdings & Duality
CEO/{Chairman} 1 0.35 0 1
CEO Stockholdings 8.85 15.66 0.001 69.95
Controls
CEO Tenure 6 5.09 1 33
Employees 2,807 7,723.21 13 88,995
R&D Expenditures (in millions) 6.03 17.00 0.003 246.00
Lerner Index 97.80 1.59 85 100
Debt/Assets 22.29 15.73 0.02 93.08
Cash flow/Assets 1.68 10.91 -93.48 84.70
36

Table 3B: Descriptive Statistics Variable % of Obs
Herfindahl Equity Index
0.2-5% 43.81
6-19 36.25
20-69 18.28
70-79 0.25
Shares of the Largest Stockholder
1-20% 60.37
21-50 27.24
51-60 4.98
61-89 6.18
Banzhaf
9-19% 18.00
20-39 41.13
40-69 10.30
70-100 29.46
Board Independence
0-20% 3.80
22-40 15.47
43-57 23.90
60-100 56.79
Board Size
2-4 14.87
5-7 57.36
8-10 23.55
11-15 4.22
Board Diversity
0.2-4% 9.18
33-59 27.58
60-76 21.77
80-110 41.41
CEO/{Chairman}
1 85.23
0 14.77
CEO Stockholdings
0-0.48% 49.57
1-29 40.31
30-57 6.41
60-70 2.94
37
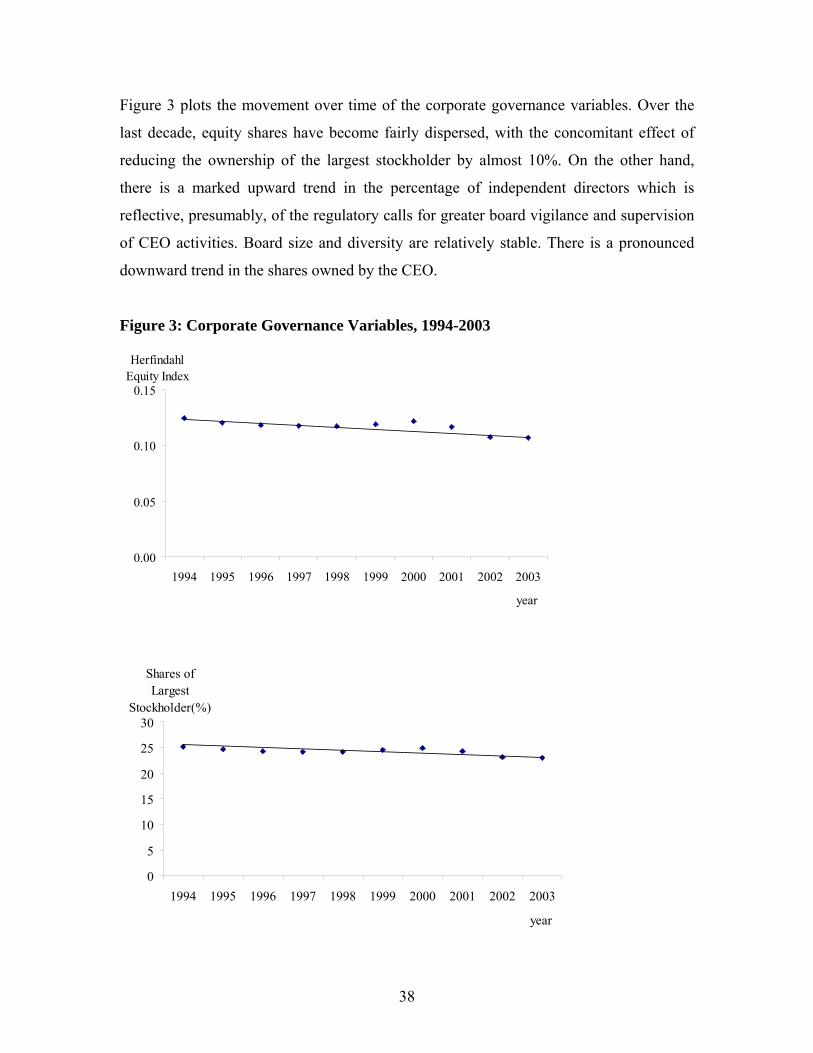
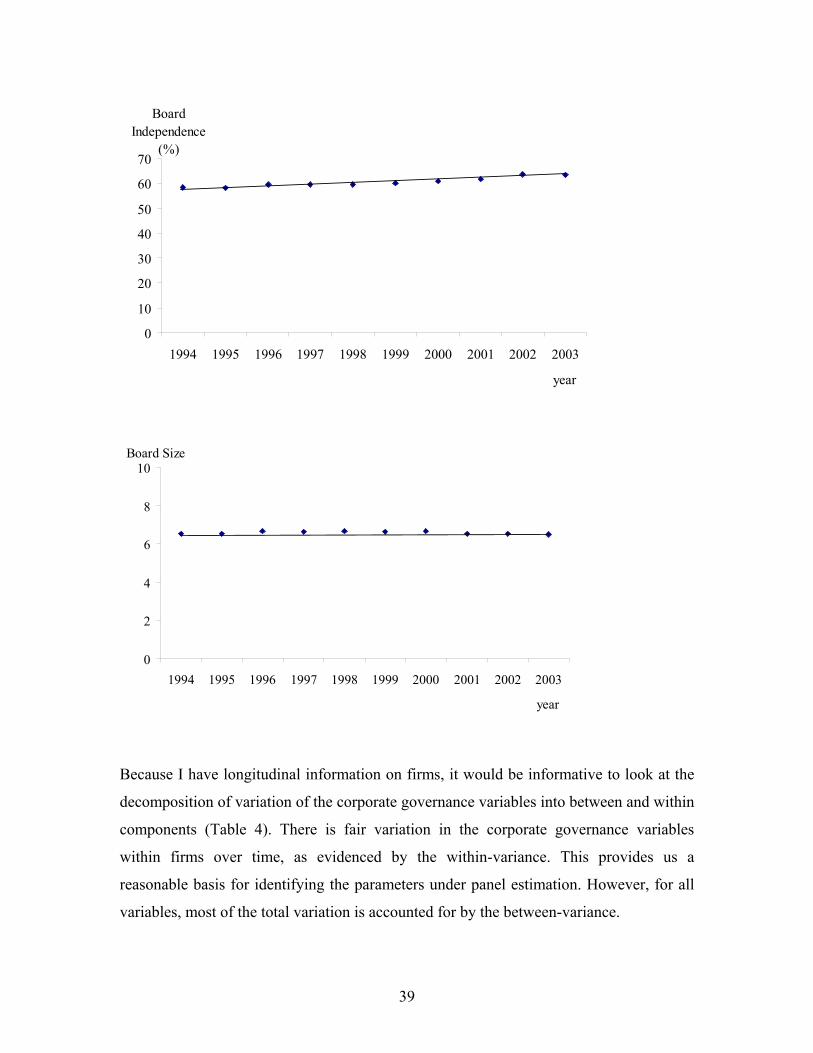
Figure 3 plots the movement over time of the corporate governance variables. Over the
last decade, equity shares have become fairly dispersed, with the concomitant effect of
reducing the ownership of the largest stockholder by almost 10%. On the other hand,
there is a marked upward trend in the percentage of independent directors which is
reflective, presumably, of the regulatory calls for greater board vigilance and supervision
of CEO activities. Board size and diversity are relatively stable. There is a pronounced
downward trend in the shares owned by the CEO.
Figure 3: Corporate Governance Variables, 1994-2003
0.00
0.05
0.10
0.15
1994 1995 1996 1997 1998 1999 2000 2001 2002 2003
year
Herfindahl Equity Index
0
5
10
15
20
25
30
1994 1995 1996 1997 1998 1999 2000 2001 2002 2003
year
Shares of Largest
Stockholder(%)
38
0
10
20
30
40
50
60
70
1994 1995 1996 1997 1998 1999 2000 2001 2002 2003
year
Board Independence
(%)
0
2
4
6
8
10
1994 1995 1996 1997 1998 1999 2000 2001 2002 2003
year
Board Size
Because I have longitudinal information on firms, it would be informative to look at the
decomposition of variation of the corporate governance variables into between and within
components (Table 4). There is fair variation in the corporate governance variables
within firms over time, as evidenced by the within-variance. This provides us a
reasonable basis for identifying the parameters under panel estimation. However, for all
variables, most of the total variation is accounted for by the between-variance.
39

Table 4: Decomposition of Variation
Variable Total Between Within
Herfindahl Equity Index 183.19 153.54 30.35
Banzhaf 1,132.57 866.85 269.68
Shares of Largest Stockholder 337.26 280.46 58.09
Board Independence 404.19 310.37 95.24
(log) Board Size 0.10 0.08 0.03
Board Diversity 877.04 666.66 213.42
CEO/{Chairman} 0.13 0.09 0.03
CEO Stockholdings 245.31 198.64 40.25
6. Empirical Framework and Analysis of Results
6.1 The Poisson Regression Model
The economic thrust of this paper is to identify the mechanisms of corporate governance
that can potentially alleviate the agency problem of innovation, thereby encouraging the
CEO to have the propensity to innovate. Empirically, this involves analyzing the
propensity to innovate, which is measured by the number of patent applications, in terms
of ownership structure, the profile of the board of directors, and CEO stockholdings and
duality, which constitute my thematic set of corporate governance variables.
A fundamental characteristic of the propensity to innovate is that it is an event count. As
a response variable, it is a count of the number of times that a firm, as directed by the
CEO, innovates by applying for a patent. This carries two implications in the analysis.
First, the patent applications are inherently discrete and nonnegative. Second, as the
summary statistics indicate, there is a predominance of zero patent counts. I therefore use
an econometric framework that accommodates these features.
I begin with a setup that explicitly models the probability distribution of the patent
applications at nonnegative integer values. A natural assumption would be to consider
40

that the number of patents y applied for by firm i at year t is Poisson distributed with
density
( | )!
( 1,..., ; 1,..., )
it ityit
it itit
ef yy
i N t T
λ λλ−
=
= = (25)
The parameter 0itλ > represents the rate of occurrence or the expected number of patent
applications. To frame this into a regression model, I parameterize itλ as a conditional
mean function of the corporate governance variables such that
( | ) exp( )it it it itE y x xλ β′= = (26)
The intent is to determine changes in the conditional expectation of ity that can be
causally linked to changes in the corporate governance variables itx , given the vector of
β parameters that I estimate. Because , the exponential form ensures the
nonnegativity of the mean function for all possible values of the explanatory variables.
0ity ≥
Characterizing the patent applications as Poisson-distributed imposes the condition that
the conditional variance and mean are the same. That is,
( | ) ( | )it it it itE y x Var y x= (27)
This equidispersion necessarily implies that the Poisson regression model is
heteroskedastic.
Parameter estimation is carried out by via maximum likelihood. Given equations (25) and
(26), the log-likelihood function is
41
(28) 1 1
ln ( exp( ) ln !)N T
it it it iti t
L x y xβ β= =
′ ′= − + +∑∑ y
Differentiating equation (28) yields the first-order conditions
1 1
1 ( exp( ))N T
it it iti t
x y xN
β= =
′−∑∑ (29)
for which the parameter estimates are calculated iteratively. Convergence is assured
because the log-likelihood is globally concave.
Assuming that the Poisson mean-variance equality holds, the estimator is consistent and
asymptotically efficient. When this assumption is incorrect, the standard errors are
concomitantly incorrect, and statistical inference becomes invalid. The Poisson estimator
however is still consistent, provided that the conditional mean is correctly specified. The
patent applications need not necessarily be Poisson distributed as long as the functional
form of the conditional mean and the covariates are those of the data generating process.
This implies that the Poisson model is robust to distributional misspecification (Cameron
and Trivedi, 1998). However, the standard errors need to be adjusted in accordance with
the correct variance structure. This approach is the Poisson quasi-maximum likelihood
estimation; we maintain the consistency of the estimators and draw inference from an
appropriately adjusted covariance matrix. The considerable number of zero patent
applications in the sample data is symptomatic of overdispersion, which means that the
variance exceeds the mean. Taken together, the zero counts and overdispersion are
suggestive of the heterogeneity among firms.
As a starting point for assessing the sensitivity of parameter estimates, I estimated a
Poisson regression that simply pools the data together, not taking into account the
longitudinal information contained in the observations. The estimates are reported in
Table 5. I ran regressions under various variable specifications. Estimates are reported
with the default maximum likelihood standard errors in parentheses and the robust
42
standard errors in brackets. The default standard errors assume equidispersion; the robust
standard errors allow for possible variance misspecification. Rather than impose a
parametric form for the variance function that may be possibly misspecified, I use a
robust covariance matrix estimator that yields standard errors that are generally valid for
all variance specifications. By definition, the parameter estimates are equivalent to those
obtained from the Poisson quasi-maximum likelihood.
43
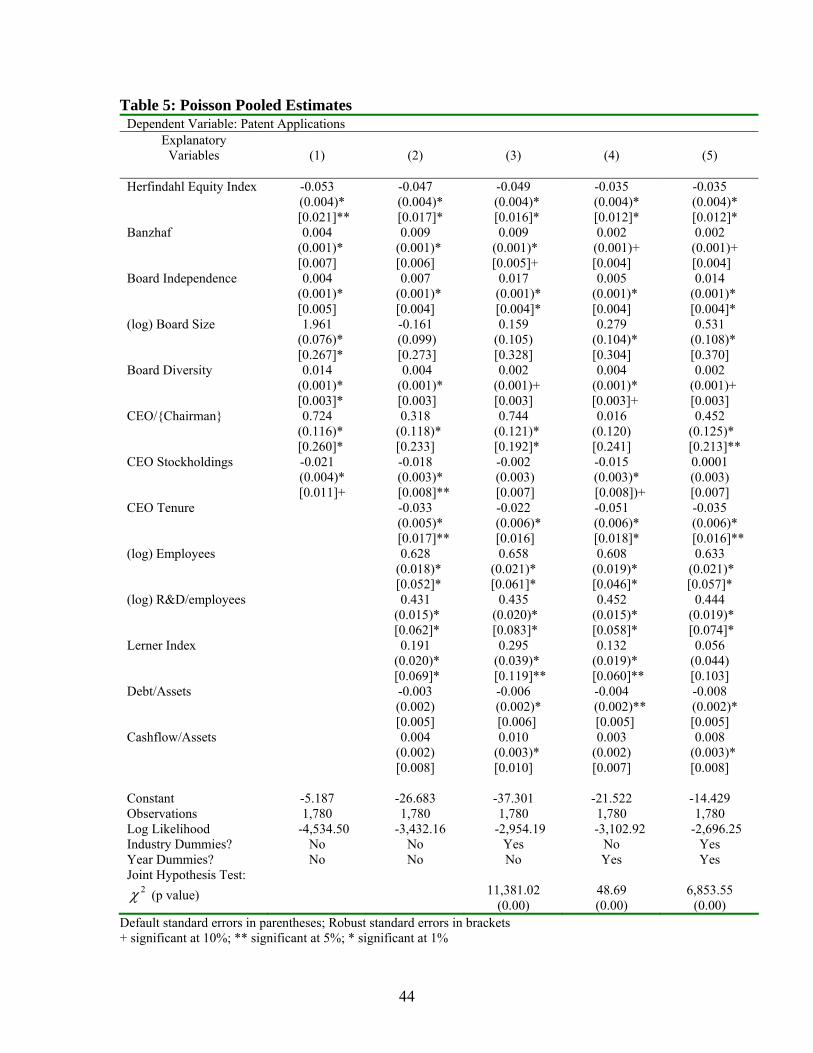
Table 5: Poisson Pooled Estimates Dependent Variable: Patent Applications
Explanatory Variables
(1)
(2)
(3)
(4)
(5)
Herfindahl Equity Index -0.053 -0.047 -0.049 -0.035 -0.035 (0.004)* (0.004)* (0.004)* (0.004)* (0.004)* [0.021]** [0.017]* [0.016]* [0.012]* [0.012]* Banzhaf 0.004 0.009 0.009 0.002 0.002 (0.001)* (0.001)* (0.001)* (0.001)+ (0.001)+ [0.007] [0.006] [0.005]+ [0.004] [0.004] Board Independence 0.004 0.007 0.017 0.005 0.014 (0.001)* (0.001)* (0.001)* (0.001)* (0.001)* [0.005] [0.004] [0.004]* [0.004] [0.004]* (log) Board Size 1.961 -0.161 0.159 0.279 0.531 (0.076)* (0.099) (0.105) (0.104)* (0.108)* [0.267]* [0.273] [0.328] [0.304] [0.370] Board Diversity 0.014 0.004 0.002 0.004 0.002 (0.001)* (0.001)* (0.001)+ (0.001)* (0.001)+ [0.003]* [0.003] [0.003] [0.003]+ [0.003] CEO/{Chairman} 0.724 0.318 0.744 0.016 0.452 (0.116)* (0.118)* (0.121)* (0.120) (0.125)* [0.260]* [0.233] [0.192]* [0.241] [0.213]** CEO Stockholdings -0.021 -0.018 -0.002 -0.015 0.0001 (0.004)* (0.003)* (0.003) (0.003)* (0.003) [0.011]+ [0.008]** [0.007] [0.008])+ [0.007] CEO Tenure -0.033 -0.022 -0.051 -0.035 (0.005)* (0.006)* (0.006)* (0.006)* [0.017]** [0.016] [0.018]* [0.016]** (log) Employees 0.628 0.658 0.608 0.633 (0.018)* (0.021)* (0.019)* (0.021)* [0.052]* [0.061]* [0.046]* [0.057]* (log) R&D/employees 0.431 0.435 0.452 0.444 (0.015)* (0.020)* (0.015)* (0.019)* [0.062]* [0.083]* [0.058]* [0.074]* Lerner Index 0.191 0.295 0.132 0.056 (0.020)* (0.039)* (0.019)* (0.044) [0.069]* [0.119]** [0.060]** [0.103] Debt/Assets -0.003 -0.006 -0.004 -0.008 (0.002) (0.002)* (0.002)** (0.002)* [0.005] [0.006] [0.005] [0.005] Cashflow/Assets 0.004 0.010 0.003 0.008 (0.002) (0.003)* (0.002) (0.003)* [0.008] [0.010] [0.007] [0.008] Constant -5.187 -26.683 -37.301 -21.522 -14.429 Observations 1,780 1,780 1,780 1,780 1,780 Log Likelihood -4,534.50 -3,432.16 -2,954.19 -3,102.92 -2,696.25 Industry Dummies? No No Yes No Yes Year Dummies? No No No Yes Yes Joint Hypothesis Test:
2χ (p value) 11,381.02 (0.00)
48.69 (0.00)
6,853.55 (0.00)
Default standard errors in parentheses; Robust standard errors in brackets + significant at 10%; ** significant at 5%; * significant at 1%
44
The first column of estimates reports base results from running a regression of the
corporate governance variables only. Assuming correct specification of the conditional
mean and equidispersion, the estimate for ownership structure show support for
hypothesis 1, to the extent that a large shareholder, as denoted by the Banzhaf index, who
has the ability and incentive to influence corporate management, can supervise the CEO
to innovate. The negative sign of the Herfindahl index suggests that ownership
concentration, or the supervision of a few large shareholders, negates the CEO’s keenness
to innovate. The estimate is statistically significantly different from zero at the 1% level.
At face value, this complements broad-brush presumptions about organizational
dynamics and delegation. A CEO who receives instructions singularly from a monitoring
large shareholder is better able to process the information, carry out the assigned task,
and avoid the dissonance associated with having several shareholder-supervisors.
The estimate for board diversity supports the second hypothesis that functional diversity
among directors enhances the board’s effectiveness in supervising the CEO. The
coefficient for board independence also confirms the hypothesis emphasizing the
importance of independent directors. Moreover, large boards appear to be better able to
monitor the CEO to innovate. The estimates for the third hypothesis on CEO
stockholdings and duality substantiate the idea of separating the functional roles of the
CEO and the Chairman of the Board, but discount the incentive effect of providing the
CEO equity ownership. The parameter for CEO stockholdings is negative and statistically
significant. Results do not qualitatively change when robust standard errors are used,
except for the parameters on the Banzhaf index and board independence which lose
significance.
Column 2 adds estimates from the control variables. Basing inference from robust
standard errors, the inclusion of these variables deemphasized the importance of a large
shareholder and an independent, small, and diverse board. The control covariates, on the
other hand, report that large, R&D-spending firms operating in a competitive
environment are more likely to innovate and apply for a patent. The negative and
45
statistically significant estimate for CEO tenure seems to suggest that CEOs prefer to
bypass innovation projects the more experienced they become.
The final three regressions in the table add industry dummies (column 3) to allow for
differences in the industry in which the firm operates, year dummies (column 4) to
account for aggregate time effects, and both industry and year dummies (column 5).
Estimates for the industry and time effects are suppressed for brevity. The last row in the
table reports joint hypotheses tests of the overall significance of the dummy variables.
The p-values are practically zero, rejecting the null that the model does not need to take
into account industry and time effects. Focusing on the estimates from column 5, the
CEO’s propensity to innovate remains to be negatively affected by a concentration of
equity shares and surprisingly unaffected by the presence of a large monitoring
shareholder. Using the percentage of shares held by the largest stockholder instead of the
Banzhaf index yielded the same results. The parameter estimate is 0.018, which is
significant at the 1% level, using the default standard error of 0.007. It loses statistical
significance with a robust standard error of 0.016. These results invalidate hypothesis 1.
In support of hypothesis 2, an independent board appears positively influential. Board
size and diversity are not statistically significant. Providing the CEO company ownership
does not incentivize him to innovate (as the estimate is negative and insignificant), but
excluding him from the role as Board Chairman reinforces the third hypothesis that a dual
CEO is not conducive to innovation.
6.2 Fixed Effects and Random Effects Poisson Estimation
The conclusion that a large shareholder serves no monitoring role in the CEO’s pursuit of
innovation and that the provision of equity rights does not encourage the CEO to do so as
well seems disconcerting, but the results may be misleading due to possible unobserved
firm heterogeneity. The pooled Poisson estimator essentially attributes all changes in the
conditional mean to the observed explanatory variables. However, there may be
firm-specific differences which are inherently unobservable or difficult to measure but
nevertheless play an important role in inciting the CEO to innovate. These include the
46
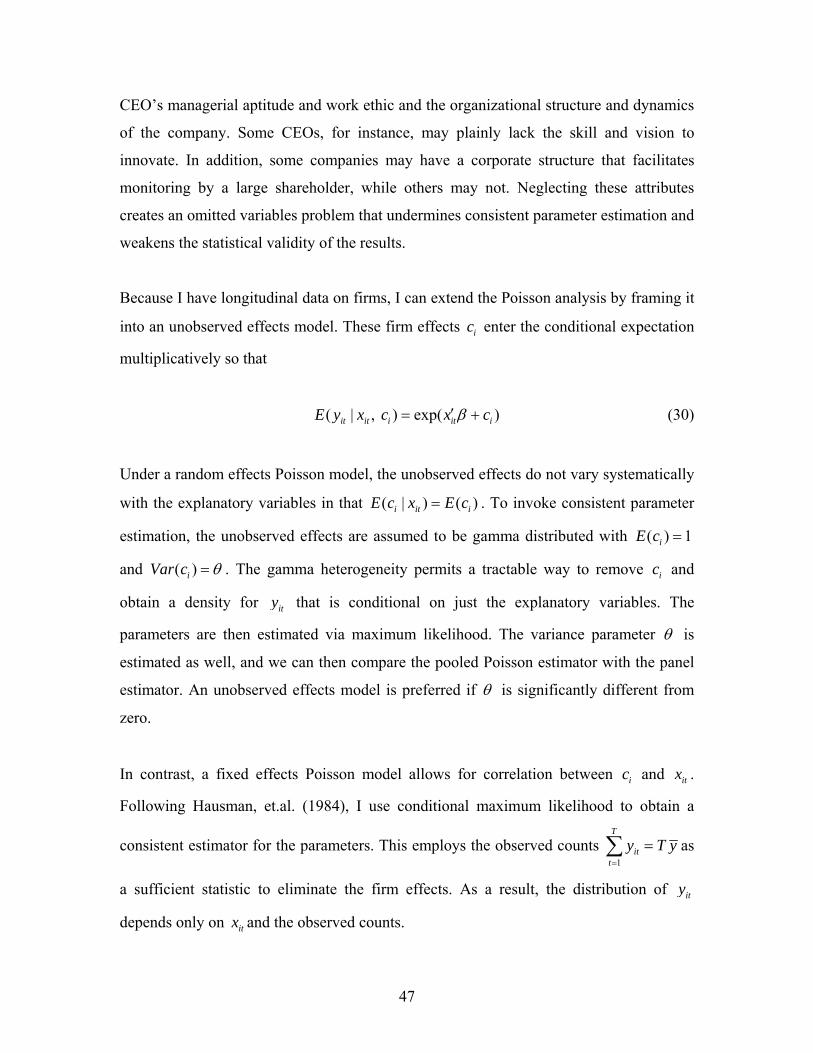
CEO’s managerial aptitude and work ethic and the organizational structure and dynamics
of the company. Some CEOs, for instance, may plainly lack the skill and vision to
innovate. In addition, some companies may have a corporate structure that facilitates
monitoring by a large shareholder, while others may not. Neglecting these attributes
creates an omitted variables problem that undermines consistent parameter estimation and
weakens the statistical validity of the results.
Because I have longitudinal data on firms, I can extend the Poisson analysis by framing it
into an unobserved effects model. These firm effects enter the conditional expectation
multiplicatively so that
ic
( | , ) exp( )it it i it iE y x c x cβ′= + (30)
Under a random effects Poisson model, the unobserved effects do not vary systematically
with the explanatory variables in that ( | ) ( )i it iE c x E c= . To invoke consistent parameter
estimation, the unobserved effects are assumed to be gamma distributed with ( ) 1iE c =
and ( )iVar c θ= . The gamma heterogeneity permits a tractable way to remove and
obtain a density for
ic
ity that is conditional on just the explanatory variables. The
parameters are then estimated via maximum likelihood. The variance parameter θ is
estimated as well, and we can then compare the pooled Poisson estimator with the panel
estimator. An unobserved effects model is preferred if θ is significantly different from
zero.
In contrast, a fixed effects Poisson model allows for correlation between and ic itx .
Following Hausman, et.al. (1984), I use conditional maximum likelihood to obtain a
consistent estimator for the parameters. This employs the observed counts 1
T
itt
y T y=
=∑ as
a sufficient statistic to eliminate the firm effects. As a result, the distribution of ity
depends only on itx and the observed counts.
47
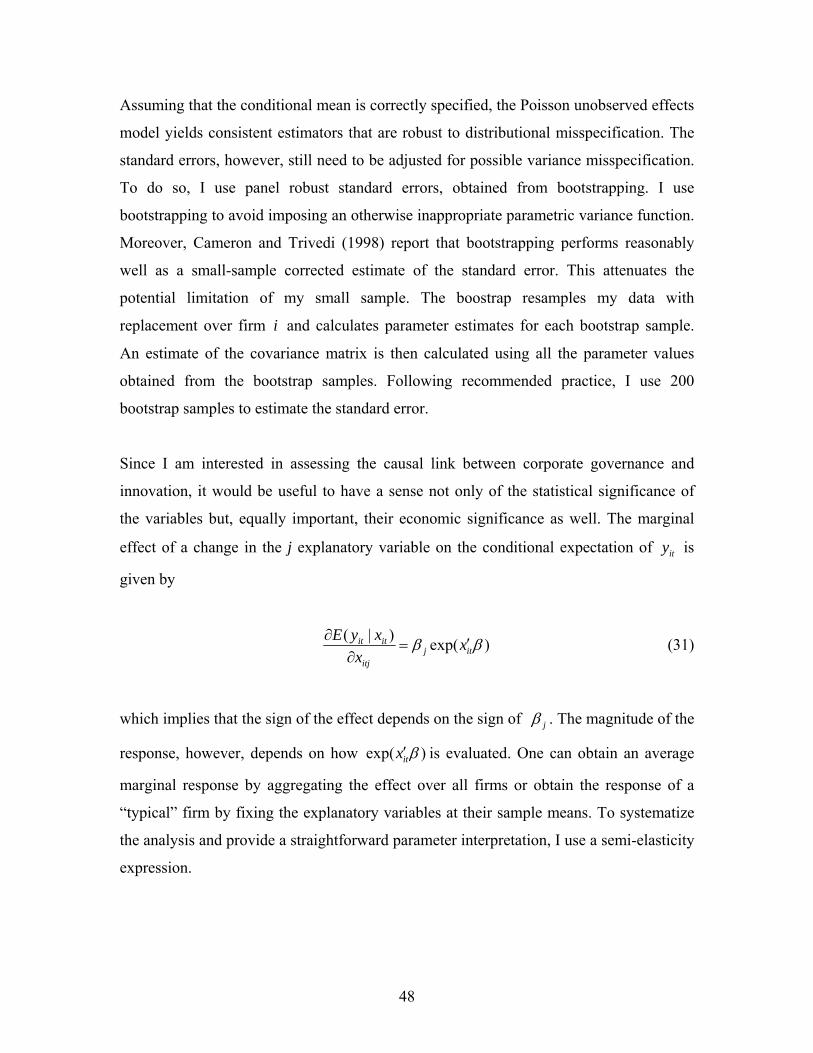
Assuming that the conditional mean is correctly specified, the Poisson unobserved effects
model yields consistent estimators that are robust to distributional misspecification. The
standard errors, however, still need to be adjusted for possible variance misspecification.
To do so, I use panel robust standard errors, obtained from bootstrapping. I use
bootstrapping to avoid imposing an otherwise inappropriate parametric variance function.
Moreover, Cameron and Trivedi (1998) report that bootstrapping performs reasonably
well as a small-sample corrected estimate of the standard error. This attenuates the
potential limitation of my small sample. The boostrap resamples my data with
replacement over firm i and calculates parameter estimates for each bootstrap sample.
An estimate of the covariance matrix is then calculated using all the parameter values
obtained from the bootstrap samples. Following recommended practice, I use 200
bootstrap samples to estimate the standard error.
Since I am interested in assessing the causal link between corporate governance and
innovation, it would be useful to have a sense not only of the statistical significance of
the variables but, equally important, their economic significance as well. The marginal
effect of a change in the j explanatory variable on the conditional expectation of ity is
given by
( | ) exp( )it itj it
itj
E y x xx
β β∂ ′=∂
(31)
which implies that the sign of the effect depends on the sign of jβ . The magnitude of the
response, however, depends on how exp( )itx β′ is evaluated. One can obtain an average
marginal response by aggregating the effect over all firms or obtain the response of a
“typical” firm by fixing the explanatory variables at their sample means. To systematize
the analysis and provide a straightforward parameter interpretation, I use a semi-elasticity
expression.
48
Equation (31) can be rewritten as
( | ) 1 ln[ ( | )].( | )
it it it itj
itj it it itj
E y x E y xx E y x x
β ∂ ∂= =
∂ ∂ (32)
so that 100 jβ gives the percentage change in ity if the j explanatory variable changes by
one unit. The response becomes an elasticity if the covariate appears in logs. For a
dummy variable, the response is interpreted as a factor change. For a 0 to 1 change in the
j dummy variable and holding the other variables *itx constant, then
*
*( | 1, ) exp( )( | 0, )
it it itj
it it it
E y x xE y x x
β==
= (33)
which means that the expected number of patent applications changes by a factor of
exp( )jβ when the dummy variable changes from 0 to 1.
Estimates for both the random effects and fixed effects models are summarized in
Table 6. To compare the precision of estimates, I report the default maximum likelihood
standard errors in parentheses and the robust standard errors in brackets. However, my
conclusions are based on the robust standard errors. The first column of estimates reports
a random effects regression of the corporate governance variables only, while the second
column includes the control variables. I also report a test for the presence of firm-specific
effects using the variance component. In a likelihood ratio test comparing the pooled
Poisson and random effects estimator, (column 1) and
(column 2); for both estimates, the significance level of the test is practically zero,
rejecting the null that
21 5,463.33χ = 2
1 3,403.57χ =
θ is zero. This implies that a panel estimator is appropriate.
49

Table 6: Fixed Effects and Random Effects Poisson Estimates Dependent Variable: Patent Applications
Random Effects Fixed Effects Explanatory
Variables
(1)
(2)
(3)
(4)
Herfindahl Equity Index -0.046 -0.046 -0.046 -0.049 (0.007)* (0.007)* (0.007)* (0.007)* [0.022]** [0.017]* [0.025]+ [0.021]** Banzhaf 0.015 0.016 0.015 0.016 (0.002)* (0.002)* (0.002)* (0.002)* [0.005]* [0.004]* [0.005]* [0.005]* Board Independence 0.011 0.012 0.011 0.013 (0.002)* (0.002)* (0.002)* (0.002)* [0.006]+ [0.005]** [0.007] [0.007]+ (log) Board Size 0.135 -0.028 0.068 0.018 (0.173) (0.179) (0.179) (0.184) [0.709] [0.580] [0.731] [0.606] Board Diversity -0.004 -0.008 -0.005 -0.009 (0.002)** (0.002)* (0.002)** (0.002)* [0.012] [0.010] [0.011] [0.010] CEO/{Chairman} 0.642 0.829 0.632 0.899 (0.183)* (0.187)* (0.187)* (0.199)* [0.353]+ [0.327]** [0.328]+ [0.359]** CEO Stockholdings -0.007 -0.005 -0.004 -0.007 (0.007) (0.006) (0.007) (0.008) [0.012] [0.013] [0.013] [0.014] CEO Tenure 0.024 0.027 (0.008)* (0.008)* [0.018] [0.019] (log) Employees 0.345 0.264 (0.054)* (0.057)* [0.239] [0.312] (log) R&D/employees 0.234 0.222 (0.033)* (0.035)* [0.102]** [0.113]** Lerner Index 0.311 0.308 (0.039)* (0.040)* [0.109]* [0.125]** Debt/Assets -0.003 -0.004 (0.003) (0.003) [0.007] [0.008] Cashflow/Assets 0.006 0.006 (0.003)** (0.003)** [0.007] [0.006] Constant -1.193 -35.852 Observations 1,780 1,780 837 837 Log Likelihood -1,802.84 -1,730.37 -1,323.25 -1,264.94
: 0oH θ = ; 2χ (p value) 5,463.33 (0.00) 3,403.57 (0.00)
Default standard errors in parentheses; Robust standard errors in brackets + significant at 10%; ** significant at 5%; * significant at 1%
50
When inference is based on the default standard errors, the corporate governance
variables in the first column of estimates are all statistically significant, except for board
size and CEO stockholdings. When robust standard errors are used, the coefficient for
board size remained insignificant, as well as for CEO stockholdings. Board diversity also
became insignificant. The inclusion of the control covariates in the second column
reinforces the result that ownership concentration negatively affects the CEO’s
propensity to innovate. A percentage point increase in equity concentration reduces the
expected number of patent applications by 5%. On the other hand, contrary to previous
estimates, the estimate for the Banzhaf index now provides support for the hypothesis
that a large, minority shareholder can monitor the CEO to innovate. While the size and
diversity of the board do not appear to be influential factors, the positive and statistically
significant coefficient of board independence seems encouraging, as a matter of corporate
policy. We expect the CEO to increase his propensity to innovate by 1.2% for a
percentage point increase in the number of independent directors. Notable also is the
CEO/{Chairman} variable which is positive and significant. The estimate suggests that
the CEO’s propensity to innovate increases by a factor of when the
CEO is not the Chairman of the Board. This is equivalent to saying that the number of
patent applications is [
exp(0.829) 2.29=
exp(0.829) 1] 100 129%− ⋅ = higher compared to a dual CEO.
Compared with the previous result from the pooled estimates, the sign for CEO
stockholdings remains negative and insignificant, suggesting that the equity incentive
does not appear as a motivating factor for the CEO to innovate.
The fixed effects estimates are given in columns (3), which reports estimates for the
corporate variables only and (4), which adds the control covariates. The results are
qualitatively similar to the random effects model. A fixed effects estimation did not
substantially alter the magnitude of the estimates, implying that the result is not sensitive
to how the unobserved effects are treated. When the percentage share of the largest
stockholder is used in lieu of the Banzhaf index, the result remained the same. The
estimate of 0.094 (under random effects) and 0.089 (under fixed effects) show that a
percentage point increase in equity ownership by the largest stockholder increases patent
applications by about 9%. Comparing the precision of estimates, the use of the robust
51
standard errors suggests that there is a considerable downward bias in the default
standard errors, which can lead to erroneous inference. On average, the robust standard
errors are about three times larger than their default counterparts. This holds for both the
fixed effects and random effects models.
While both models generally report the same economic result, they are statistically
different in their treatment of unobserved heterogeneity. The fixed effects model allows
for the arbitrary correlation between and ic itx , whereas the random effects model
imposes mean independence of . This distinction carries the implication that the fixed
effects estimator is consistent when there is indeed a correlation, and that the random
effects estimator is inconsistent and therefore misleading. I use Hausman’s test to
discriminate between the two models. Under the null of zero correlation between and
ic
ic
itx , the random effects model is consistent. A statistically significant difference between
the two estimators is an indication that the null is incorrect, and that the fixed effects
estimator is consistent. Comparing the estimates in columns (2) and (4), the Hausman test
statistic is with p-value 0.00. This rejects the null at the 1% level, implying
that the results from the fixed effects estimator are more appropriate to use.
79.58H =
6.3 Fixed Effects and Random Effects Negative Binomial Estimation
I also consider the negative binomial model as an alternative way to characterize the
distribution of the patent applications. This explicitly takes into account overdispersion in
the sample data, as manifested by the high proportion of zeros. It relaxes the restrictive
Poisson assumption of equidispersion by imposing an overdispersion parameter in the
variance. Following Hausman, et.al. (1984), the patent applications have a negative
binomial density, with mean i it
i
c λφ
and variance 1i it i
i i
c λ cφ φ
⎛ ⎞⎛+⎜ ⎟⎜
⎝ ⎠⎝
⎞⎟⎠
. The overdispersion
parameter is denoted by iφ .
52
Under random effects estimation, the variance component 1
1 i
i
cφ
−⎛ ⎞
+⎜ ⎟⎝ ⎠
is assumed to be beta
distributed, as a tractable way to consistently estimate the parameters via maximum
likelihood. In similar spirit to the fixed effects Poisson model, the fixed effects negative
binomial model is estimated via conditional maximum likelihood, using the observed
sum of patent applications as sufficient statistic.
The negative binomial estimates are presented in Table 7. The associated standard errors
allow for overdispersion. Column 1 reports estimates for the corporate governance
variable under a random effects specification. The Herfindahl equity index is the only
variable that registered statistical significance, being significant at the 10% level. There is
a considerable change when the control covariates are added in column 2. The estimates
are now essentially in accord with the previous Poisson panel result. The Banzhaf index
becomes significant. In addition, enhancing the independence of the board and separating
the CEO and Board Chairman roles remain as instruments of corporate governance that
foster innovation. While increasing the size and diversity of the board appears to negate
the CEO’s inclination to innovate, the estimates are not statistically conclusive. The
statistical and economic significance of the variables carry over when a fixed effects
negative model is used (columns 3 and 4). Explicitly accounting for overdispersion using
the negative binomial model reduces the magnitude of the parameter estimates. The
Poisson panel estimates are about twice as large as their negative binomial counterparts.
53
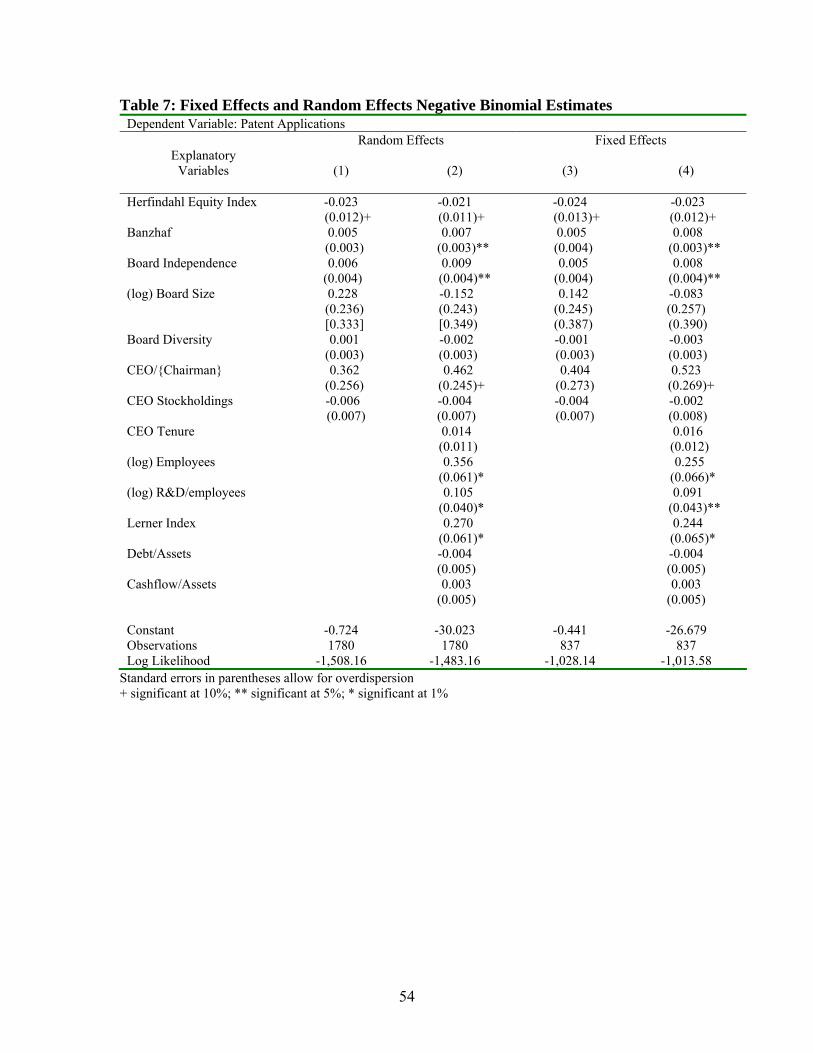
Table 7: Fixed Effects and Random Effects Negative Binomial Estimates Dependent Variable: Patent Applications
Random Effects Fixed Effects Explanatory
Variables
(1)
(2)
(3)
(4)
Herfindahl Equity Index -0.023 -0.021 -0.024 -0.023 (0.012)+ (0.011)+ (0.013)+ (0.012)+ Banzhaf 0.005 0.007 0.005 0.008 (0.003) (0.003)** (0.004) (0.003)** Board Independence 0.006 0.009 0.005 0.008 (0.004) (0.004)** (0.004) (0.004)** (log) Board Size 0.228 -0.152 0.142 -0.083 (0.236) (0.243) (0.245) (0.257) [0.333] [0.349) (0.387) (0.390) Board Diversity 0.001 -0.002 -0.001 -0.003 (0.003) (0.003) (0.003) (0.003) CEO/{Chairman} 0.362 0.462 0.404 0.523 (0.256) (0.245)+ (0.273) (0.269)+ CEO Stockholdings -0.006 -0.004 -0.004 -0.002 (0.007) (0.007) (0.007) (0.008) CEO Tenure 0.014 0.016 (0.011) (0.012) (log) Employees 0.356 0.255 (0.061)* (0.066)* (log) R&D/employees 0.105 0.091 (0.040)* (0.043)** Lerner Index 0.270 0.244 (0.061)* (0.065)* Debt/Assets -0.004 -0.004 (0.005) (0.005) Cashflow/Assets 0.003 0.003 (0.005) (0.005) Constant -0.724 -30.023 -0.441 -26.679 Observations 1780 1780 837 837 Log Likelihood -1,508.16 -1,483.16 -1,028.14 -1,013.58
Standard errors in parentheses allow for overdispersion + significant at 10%; ** significant at 5%; * significant at 1%
54
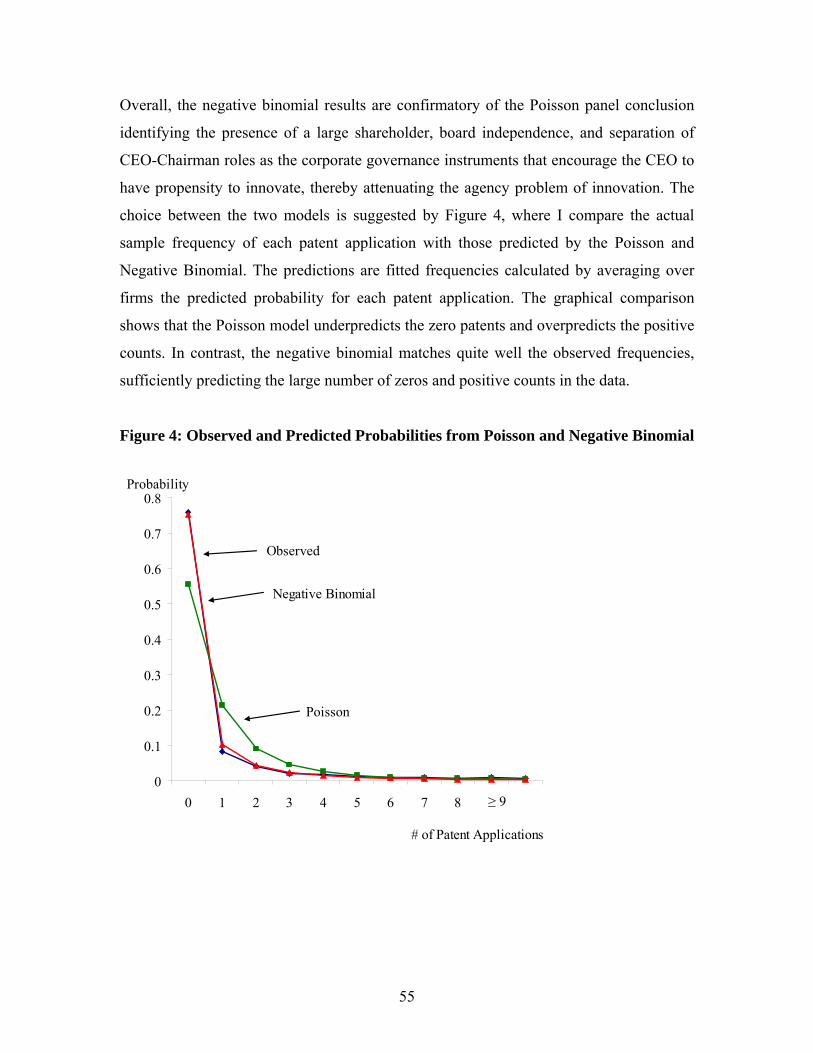
Overall, the negative binomial results are confirmatory of the Poisson panel conclusion
identifying the presence of a large shareholder, board independence, and separation of
CEO-Chairman roles as the corporate governance instruments that encourage the CEO to
have propensity to innovate, thereby attenuating the agency problem of innovation. The
choice between the two models is suggested by Figure 4, where I compare the actual
sample frequency of each patent application with those predicted by the Poisson and
Negative Binomial. The predictions are fitted frequencies calculated by averaging over
firms the predicted probability for each patent application. The graphical comparison
shows that the Poisson model underpredicts the zero patents and overpredicts the positive
counts. In contrast, the negative binomial matches quite well the observed frequencies,
sufficiently predicting the large number of zeros and positive counts in the data.
Figure 4: Observed and Predicted Probabilities from Poisson and Negative Binomial
0
0.1
0.2
0.3
0.4
0.5
0.6
0.7
0.8
0 1 2 3 4 5 6 7 8 9 10
# of Patent Applications
Probability
≥ 9
Poisson
Negative Binomial
Observed
55

6.4 Endogenous Regressors
A crucial element needed in consistent parameter estimation is the strict exogeneity of the
explanatory variables. In the previous section, the unobserved effects model
exp( )it it i ity x c eβ′= + + (34)
was estimated under the assumption that the explanatory variables itx and the
idiosyncratic, time-varying error were uncorrelated. Consistent fixed effects and
random effects estimation of equation (34) relied on the strict exogeneity assumption that
once the unobserved firm heterogeneity is controlled for, there should be no
correlation between and
ite
ic
ise itx ( , 1,..., )s t T= such that the following condition holds
( | ) 0 ,it itE e x s t= ∀ (35)
Conditional on the firm effect, the errors are uncorrelated with the past, present, and
future values of the explanatory variables.
However, the strict exogeneity assumption may not reasonably hold in the postulated
corporate governance-innovation relationship in that the corporate governance variables
may be potentially endogenous. If this is the case, endogeneity causes the parameters to
be inconsistently estimated, and changes in the CEO’s innovation propensity that we
attribute to corporate governance may simply be an association rather than a causal
determinant.
Strict exogeneity imposes the condition that the corporate governance variables do not
react to what has happened in the past. This seems untenable. For instance, board
independence may be an endogenous choice. Hermalin and Weisbach (1988) posit that
more independent directors are appointed following poor firm performance. Demsetz and
Villalonga (2001), on the other hand, contend that ownership structure is endogenous, an
56
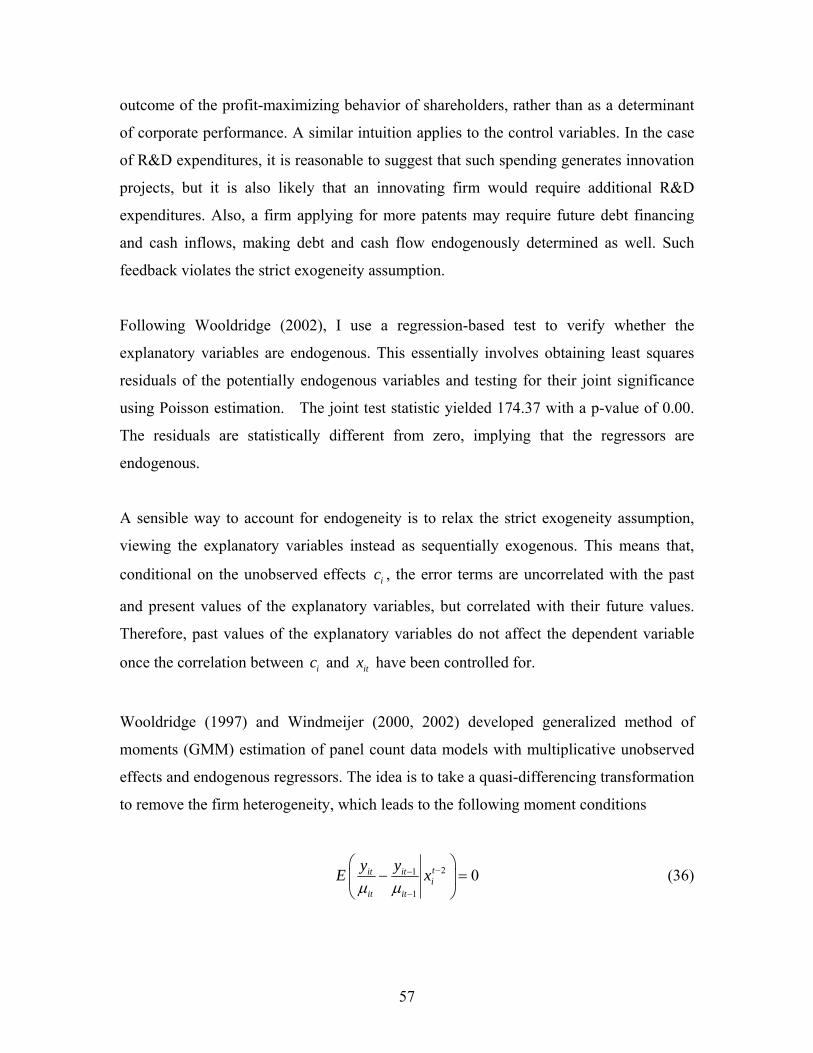
outcome of the profit-maximizing behavior of shareholders, rather than as a determinant
of corporate performance. A similar intuition applies to the control variables. In the case
of R&D expenditures, it is reasonable to suggest that such spending generates innovation
projects, but it is also likely that an innovating firm would require additional R&D
expenditures. Also, a firm applying for more patents may require future debt financing
and cash inflows, making debt and cash flow endogenously determined as well. Such
feedback violates the strict exogeneity assumption.
Following Wooldridge (2002), I use a regression-based test to verify whether the
explanatory variables are endogenous. This essentially involves obtaining least squares
residuals of the potentially endogenous variables and testing for their joint significance
using Poisson estimation. The joint test statistic yielded 174.37 with a p-value of 0.00.
The residuals are statistically different from zero, implying that the regressors are
endogenous.
A sensible way to account for endogeneity is to relax the strict exogeneity assumption,
viewing the explanatory variables instead as sequentially exogenous. This means that,
conditional on the unobserved effects , the error terms are uncorrelated with the past
and present values of the explanatory variables, but correlated with their future values.
Therefore, past values of the explanatory variables do not affect the dependent variable
once the correlation between and
ic
ic itx have been controlled for.
Wooldridge (1997) and Windmeijer (2000, 2002) developed generalized method of
moments (GMM) estimation of panel count data models with multiplicative unobserved
effects and endogenous regressors. The idea is to take a quasi-differencing transformation
to remove the firm heterogeneity, which leads to the following moment conditions
21
1
0tit iti
it it
y yE xμ μ
−−
−
⎛ ⎞− =⎜
⎝ ⎠⎟ (36)
57
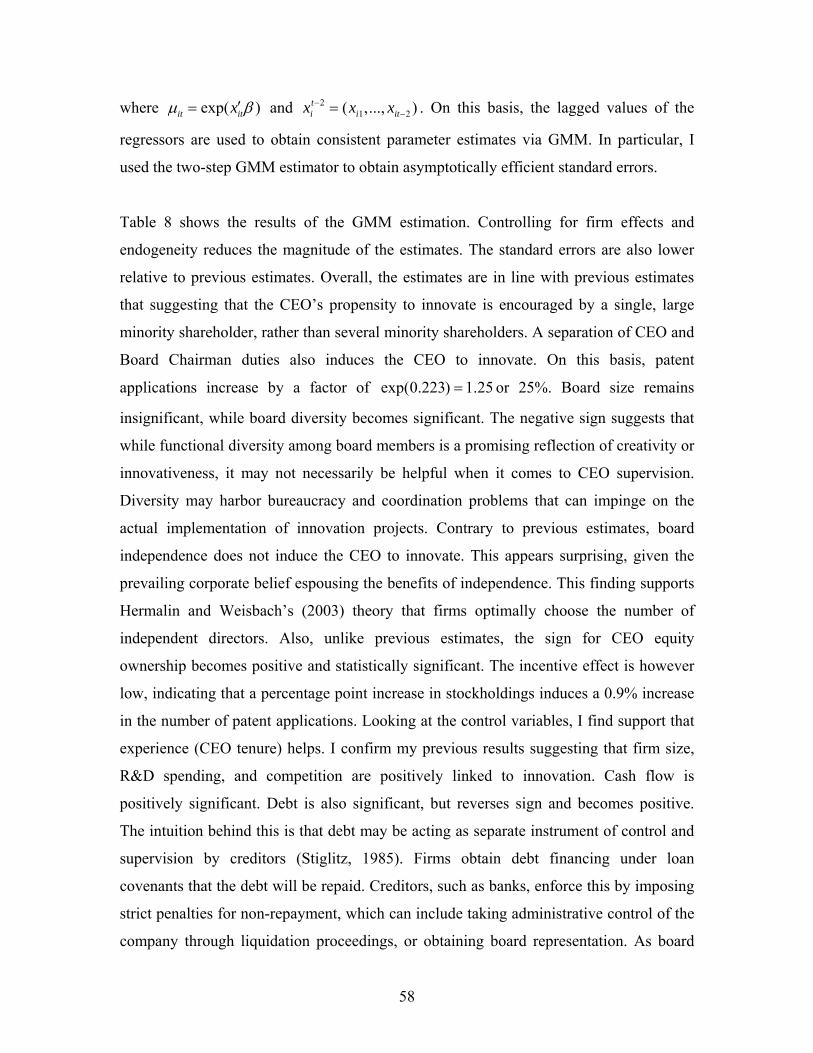
where exp( )it itxμ β′= and . On this basis, the lagged values of the
regressors are used to obtain consistent parameter estimates via GMM. In particular, I
used the two-step GMM estimator to obtain asymptotically efficient standard errors.
21( ,..., )t
i i itx x x−−= 2
Table 8 shows the results of the GMM estimation. Controlling for firm effects and
endogeneity reduces the magnitude of the estimates. The standard errors are also lower
relative to previous estimates. Overall, the estimates are in line with previous estimates
that suggesting that the CEO’s propensity to innovate is encouraged by a single, large
minority shareholder, rather than several minority shareholders. A separation of CEO and
Board Chairman duties also induces the CEO to innovate. On this basis, patent
applications increase by a factor of exp(0.223) 1.25= or 25%. Board size remains
insignificant, while board diversity becomes significant. The negative sign suggests that
while functional diversity among board members is a promising reflection of creativity or
innovativeness, it may not necessarily be helpful when it comes to CEO supervision.
Diversity may harbor bureaucracy and coordination problems that can impinge on the
actual implementation of innovation projects. Contrary to previous estimates, board
independence does not induce the CEO to innovate. This appears surprising, given the
prevailing corporate belief espousing the benefits of independence. This finding supports
Hermalin and Weisbach’s (2003) theory that firms optimally choose the number of
independent directors. Also, unlike previous estimates, the sign for CEO equity
ownership becomes positive and statistically significant. The incentive effect is however
low, indicating that a percentage point increase in stockholdings induces a 0.9% increase
in the number of patent applications. Looking at the control variables, I find support that
experience (CEO tenure) helps. I confirm my previous results suggesting that firm size,
R&D spending, and competition are positively linked to innovation. Cash flow is
positively significant. Debt is also significant, but reverses sign and becomes positive.
The intuition behind this is that debt may be acting as separate instrument of control and
supervision by creditors (Stiglitz, 1985). Firms obtain debt financing under loan
covenants that the debt will be repaid. Creditors, such as banks, enforce this by imposing
strict penalties for non-repayment, which can include taking administrative control of the
company through liquidation proceedings, or obtaining board representation. As board
58
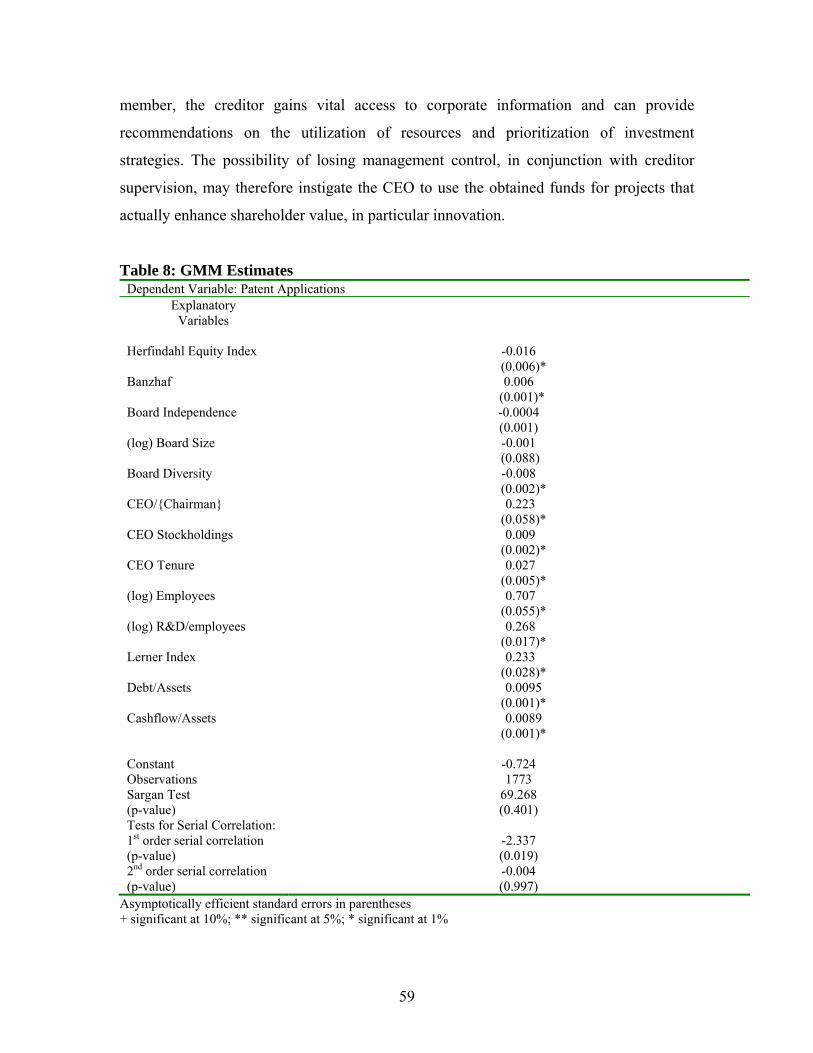
member, the creditor gains vital access to corporate information and can provide
recommendations on the utilization of resources and prioritization of investment
strategies. The possibility of losing management control, in conjunction with creditor
supervision, may therefore instigate the CEO to use the obtained funds for projects that
actually enhance shareholder value, in particular innovation.
Table 8: GMM Estimates Dependent Variable: Patent Applications
Explanatory Variables
Herfindahl Equity Index -0.016 (0.006)* Banzhaf 0.006 (0.001)* Board Independence -0.0004 (0.001) (log) Board Size -0.001 (0.088) Board Diversity -0.008 (0.002)* CEO/{Chairman} 0.223 (0.058)* CEO Stockholdings 0.009 (0.002)* CEO Tenure 0.027 (0.005)* (log) Employees 0.707 (0.055)* (log) R&D/employees 0.268 (0.017)* Lerner Index 0.233 (0.028)* Debt/Assets 0.0095 (0.001)* Cashflow/Assets 0.0089 (0.001)* Constant -0.724 Observations 1773 Sargan Test (p-value)
69.268 (0.401)
Tests for Serial Correlation: 1st order serial correlation (p-value)
-2.337 (0.019)
2nd order serial correlation (p-value)
-0.004 (0.997)
Asymptotically efficient standard errors in parentheses + significant at 10%; ** significant at 5%; * significant at 1%
59

The GMM estimates are consistent and asymptotically efficient provided that the model
is correctly specified. This requires that (i) the lagged values of the regressors are valid
instruments and (ii) there is no second-order serial correlation. The first criterion is
evaluated using the Sargan test for overidentifying restrictions. The test statistic is 69.268
with p-value 0.401, which means that we cannot reject the null hypothesis of instrument
validity. The second criterion implies that the model is incorrectly specified if serial
correlation is persistent, as the error terms are picking up possibly omitted variables and
dynamics not in the model. Under the null of no serial correlation, the tests for serial
correlation indicate the presence of first-order serial correlation (p-value of 0.019) and
the absence of second-order serial correlation (p-value of 0.997). Taken together, the
results indicate that the GMM estimates provide us reasonably valid inferences.
7 Conclusion
The goal of this paper is to identify the mechanisms of corporate governance that
encourage the CEO to innovate. There is an agency problem in innovation in that while
shareholders view innovation as a value-enhancing investment strategy, the CEO regards
it as a risky venture that can potentially tarnish his career and reputation. The
contribution of this paper is to empirically establish the importance of corporate
governance in innovation. I examine ownership structure, the profile of the board of
directors, and CEO stockholdings and duality as potential mechanisms. I use panel count
data models and GMM estimation that control for unobserved firm effects and the
potential endogeneity of the corporate governance variables. These techniques are
applied on a sample of 197 domestically-owned and publicly-listed Australian firms over
the period 1994-2003.
I find that shareholder supervision of the CEO’s innovation propensity is best achieved
through a single, large minority stockholder, rather than several minority stockholders.
Controlling for endogeneity, I do not find any association between innovation and the
virtues linked with board independence and board size. A diverse board, on the other
hand, appears to negate the CEO’s inclination to innovate. As a mater of corporate
60

policy, the provision of CEO equity ownership and the separation of CEO and Board
Chairman duties can instigate the CEO to innovate.
A future goal of this research is to include foreign-owned firms and compare their
governance structure with those of their domestic counterparts. A related research would
be to establish the kind of innovation CEOs are inclined to pursue. Would they be more
persuaded to do process, cost-reducing innovation or would they prefer product, market-
expanding innovation?
References
Adams, R., and Ferreira, D. (2004). "Gender Diversity in the Boardroom. " ECGI
Working Paper Series in Finance 57.
Aggarwal, R., and Samwick, A. (1999). "Empire Builders and Shirkers: Investment,
Firm Performance, and Managerial Incentives." NBER Working Paper 7335.
Aghion, P., Bloom, N., Blundell, R., Griffith, R., and Howitt, P. (2002). "Competition
and Innovation: An Inverted U Relationship." Harvard Working Paper,
September.
American Management Association. The Quest for Innovation: A Global Study in Innovation Management 2006-2016.
Ancona, D., and Caldwell, D. (1992). "Demography and Design: Predictors of New
Product Team Performance." Organization Science, 3, 321-341.
Australian Bureau of Statistics (2003-2004) Australian Industry 8155.0
Australian Bureau of Statistics (1990-2000, 2003-2004) Australian System of National
Accounts 5204.0
Australian Council of Super Investors. (2004) Board Composition and Non-Executive
Director Pay in the Top 100 Companies 2003.
61

Baysinger, B. D., Kosnik, R. D., and Turk, T. A. (1991). "Effects of Board and
Ownership Structure on Corporate R&D Strategy." Academy of Management
Journal, 34(1), 205-214.
Becht, M. Bolton, P. and Roell, A. (2003). "Corporate governance and control," in Handbook of the Economics of Finance, in G.M. Constantinides, M. Harris, and R. M. Stulz, eds. Elsevier: North Holland, 1-109 Beiner, S., Drobetz, W., Schmid, F., and Zimmerman, H. (2004). "Is Board Size an Independent Corporate Governance Mechanism?" Kyklos 57, 327-56.
Bertrand, M. and Mullainathan, S. (2001). "Are CEOs Rewarded For Luck? The Ones Without Principals Are," Quarterly Journal of Economics, 116(3), 901-932. Bertrand, M., and Mullainathan, S. (2003). "Enjoying the Quiet Life? Corporate
Governance and Managerial Preferences." Journal of Political Economy,
111, 1043-1075.
Bhagat, S., and Black, B. (2001). "The Non-Correlation Between Board Independence
and Long Term Firm Performance." Journal of Corporation Law, 27, 231-274.
Brian J. H. and Liebman, J.B. (1998). "Are CEOs Really Paid Like Bureaucrats?" Quarterly Journal of Economics, 113(3), 653-691. Brickley, J.A., Coles, J.L. and Jarrell, G. (1997). "Leadership Structure: Separating the CEO and Chairman of the Board. " Journal of Corporate Finance, 3(3), 189-220. Boston Consulting Group (2006). Innovation.
Cameron, A.C. and Trivedi, P.K. (1998). Regression Analysis of Count Data, New York: Cambridge University Press. Carter, D. A., Simkins, B. J., and Simpson, W.G. (2002) "Corporate Governance, Board Diversity, and Firm Performance" Oklahoma State University Working Paper. Claessens, S., Djankov, S., Fan, J.P.H., and Lang, L.H.P. (2002). “Disentangling the
Incentive and Entrepreneurial Effects of Large Shareholdings,” Journal of
Finance, 57, 2741-2771.
62

Core, J., Holthausen, R. and Larcker, D. (1999). "Corporate Governance, Chief
Executive Officer Compensation, and Firm Performance." Journal of
Financial Economics, 51, 371-406.
Cubbin, J., and Leech, D. (1983). "The Effect of Shareholding Dispersion on the
Degree of Control in British Companies: Theory and Measurement." The
Economic Journal, 93(370), 351-369.
Czarnitzki, D., and Kraft, K. (2004). "Management Control and Innovative Activity."
Review of Industrial Organization, 24, 1-24.
Eisenberg, T., Sundgren, S. and Wells, M. (1998). "Larger Board Size and Decreasing Firm Value in Small Firms." Journal of Financial Economics 48, 35-54.
Graves, S. B. (1988). "Institutional Ownership and Corporate R&D in the Computer Industry." Academy of Management Journal, 31(2), 417-428. Hall, B. H., Jaffe A.B. and Trajtenberg M. (2001). "The NBER Patent Citation Data File: Lessons, Insights and Methodological Tools," NBER Working Papers 8498. Hall, B.H. and Ziedonis, R.H. (2001). "The Patent Paradox Revisited: An Empirical Study of Patenting in the US Semiconductor Industry, 1979-95, " Rand Journal of Economics, 32(1), 101-128,
Hart, O. (1995). "Corporate Governance: Some Theory and Implications." The
Economic Journal, 105(430), 678-689.
Haubrich, J. (1994). "Risk Aversion, Performance Pay and the Principal-Agent Problem." Journal of Political Economy 102, 258-276.
Hausman, J., Hall, B. H., and Griliches, Z. (1984). "Econometric Models for Count
Data with an Application to the Patents-R & D Relationship." Econometrica:
Journal of the Econometric Society, 52(4), 909-938.
Hermalin, B. (2005). "Trends in Corporate Governance." Journal of Finance, 60(5), 2351-2384.
63

Hermalin, B. and Weisbach, M. (1991). "The Effects of Board Composition and
Direct Incentives on Firm Performance." Financial Management, 20(4), 101-
112.
Hermalin, B. and Weisbach, M. (1998). "Endogenously Chosen Boards of Directors
and their Monitoring of the CEO." American Economic Review, 88, 96-118.
Hermalin, B. and Weisbach, M. (2003). "Boards of Directors as an Endogenously
Determined Institution." Economic Policy Review, 9(1) 7-26.
Hill, C. W. L. and Snell, S. A. (1988). "External Control, Corporate Strategy, and
Firm Performance in Research- Intensive Industries." Strategic Management
Journal, 9(6), 577-590.
Himmelberg, C.P., Hubbard, R. G., and Palia, D. (1999). "Understanding the Determinants of Managerial Ownership and the Link Between Ownership and Performance," Journal of Financial Economics, 53(3), 353-384.
Hirshleifer, D. and Thakor, A. (1992). "Managerial Conservatism, Project Choice,
and Debt." Review of Financial Studies, 5, 437-470.
Holmstrom, B. (1989). "Agency Costs and Innovation." Journal of Economic Behavior
& Organization, 12(3), 305-327.
Holmstrom, B. (1999). "Managerial Incentive Problems: A Dynamic Perspective."
Review of Economic Studies, 66(1), Special Issue: Contracts, 169-182.
Holmstrom, B., and Costa, R. I. (1986). "Managerial Incentives and Capital
Management." Quarterly Journal of Economics, 101, 835-860.
Holmstrom, B. and Kaplan, S. N. (2003). "The State of U.S. Corporate Governance: What's Right and What's Wrong?" ECGI Working Paper Series in Finance 23.
64
Jensen, M.C. (1986). "Agency Costs of Free Cash Flow, Corporate Finance, and Takeovers. " American Economic Review, 76, 323-329. Jensen, M. C. (1993). "The Modern Industrial Revolution, Exit, and the Failure of Internal Control Systems," Journal of Finance, 48(3), 831-80. Jensen, M. C. and Murphy, K.J. (1990). "Performance Pay and Top-Management Incentives," Journal of Political Economy, 98(2), 225-64.
Klein, A. (1998). "Firm Performance and Board Committee Structure." Journal of Law and Economics, 20, 493–502.
Leech, D. (2002). "Computation of Power Indices," The Warwick Economics Research
Paper Series (TWERPS) 644, University of Warwick, Department of Economics.
Leech, D. (2005). "Computer Algorithms for Voting Power Analysis."
http://www.warwick.ac.uk/~ecaae/, accessed September-October 2005.
Loderer, C. and Martin, K. (1997) "Executive Ownership and Performance: Tracking Faint Traces,” Journal of Financial Economics, 45(2), 223-256.
Maug, E. and Rydqvist, K. (2004). "Do Shareholders Vote Strategically? Evidence on
the Advisory Role of Annual General Meetings." Working Paper 2004.
Mehran, H. (1995). "Executive Compensation Structure, Ownership, and Firm Performance." Journal of Financial Economics, 38, 163-184.
Murphy, K. J. (1999). “Executive Compensation.” in Handbook of Labor Economics. Orley Ashenfelter and David Card, eds. Amsterdam: North Holland, 2485-2563 Narayanan, M. P. (1985). "Managerial Incentives for Short-Term Results." Journal of
Finance, 40(5), 1469-1484.
OECD (2004). Corporate Governance: A Survey of OECD Countries Ofek, E. and Yermack, D. (2000). "Taking Stock: Equity-Based Compensation and the Evolution of Managerial Ownership." Journal of Finance 55(3), 1367-1384.
65
Poterba J.M. and Sumers, L. (1995). "A CEO Survey of U.S. Companies' Time Horizons and Hurdle Rates." Sloan Management Review 37 (Fall). Rechner, P.L. and Dalton, D.R. (1991). "CEO Duality and Organizational Performance: A Longitudinal Analysis. " Strategic Management Journal, 12 (2), 155–160.
Salinger, M.A. and Summers, LH. (1984). "Tax Reform and Corporate Investment: A Microeconometric Simulation Study." NBER Working Paper No. W0757.
Shleifer, A., and Vishny, R. (1997). "A Survey of Corporate Governance." Journal of
Finance, 52, 737-783.
Simsek, Z. (2007). "CEO tenure and organizational performance: an intervening model" Strategic Management Journal. 28(6), 653-662.
Teachman, J.D. (1980). "Analysis of population diversity", Sociological Methods of Research, 8, 341-62.
Weisbach, M. (1988). "Outside Directors and CEO Turnover." Journal of Financial Economics 20, 431-60.
Windmeijer, F. (2000). “Moment Conditions for Fixed Effects Count Data Models
with Endogenous Regressors.” Economic Letters, 68, 21-24.
Windmeijer, F. (20002). “Expend, A Gauss programme for non-linear GMM
Estimation of Exponential Models with Endogenous Regressors for Cross
sections and Panel Data.” CEMMAP Working Paper CWP14/02. The Instiute for
Fiscal Studies.
Wooldridge, J.M. (1997). “Multiplicative Panel Data Models without the Strict
Exogeneity Assumption.” Econometric Theory, 13, 667-678.
Yermack, D. (1996). "Higher Market Valuation Of Companies With A Small Board Of Directors," Journal of Financial Economics, 40(2), 185-211.
66

Zahra, S. A. (1996). "Governance, Ownership, and Corporate Entrepreneurship: The
Moderating Impact of Industry Technological Opportunities." Academy of
Management Journal, 39, 1713-1735.
Zwiebel, J. (1995). "Corporate Conservatism and Relative Compensation." Journal of
Political Economy, 103(1), 1-25.
67


