
IOSR Journal of Mechanical and Civil Engineering (IOSR-JMCE)
e-ISSN: 2278-1684,p-ISSN: 2320-334X, Volume 14, Issue 2 Ver. III (Mar. - Apr. 2017), PP 27-44
www.iosrjournals.org
DOI: 10.9790/1684-1402032744 www.iosrjournals.org 27 | Page
Correlation between Actual Compressive Strength of Concrete
and Strength Estimated From Core
[1] Dr. Suresh. G. Patil,
[2] Shivakumar
1Professor and Head of the Department, P.D.A College of Engineering, Kalaburagi-585102
2M.Tech student, P.D.A College of Engineering, Kalaburagi
Abstract: The estimation of mechanical properties and strength of concrete can be carried out by several
methods; destructive and non destructive. In this study crushing strength of concrete cubes is the usual
destructive test to determine the compressive strength of concrete. The rebound hammer test, ultrasonic pulse
velocity and core test are the non destructive tests to determine compressive strength of concrete and to obtain
correlation between them. In this work using M-20 grade of concrete twelve numbers of concrete cubes of size
(150mmx150mmx150mm) were cast using the water cement ratio 0.55. The five numbers of slabs of size
500mmx500mm with 120mm thickness were made by same water cement ratio. An experimental study was
conducted to determine the correlation between actual compressive strength of concrete cubes and strength
estimated from cores having different H/D ratio (1.5, 1.75 and 2.0) and diameter of 50mm. totally thirty
numbers of cores were extracted from the concrete slabs, fifteen numbers of cores were extracted from concrete
portion (without reinforcement) and other fifteen numbers of cores were extracted with reinforcement. The
results indicate that the cores with reinforcement of H/D ratio 1.5, 1.75 and 2.0 indicate greater compressive
strength as compared to cores free from reinforcement for the same H/D ratio and core compressive strength
increases with increase in the H/D ratio. The very good correlation coefficient (0.979) is obtained.
I. Introduction It is often necessary to test concrete structures after the concrete has hardened to determine whether the
structure is suitable for its designed use. Ideally, such testing should be done without damaging the concrete.
The test available for testing concrete range from completely non-destructive tests, where there is no damage to
the concrete, through those where the concrete surface is slightly damaged to partially destructive tests, such as
core tests and pull-out and pull-off tests, where the surface has to be repaired after the test. Coring is usually the
method ultimately chosen to determine in-situ compressive strength of concrete. In concrete structures with a lot
of reinforcement bars, it may be impossible to obtain a core specimen from which compressive strength may be
taken since reinforcing steel may be so prevalent in the concrete. The size of core taken in diameter should be
minimum three times of maximum size aggregate than used in the structure. In structures using larger
aggregates, it may be practical to take cores larger in diameter, but costs increase rapidly and the large core
usually cannot be taken deeper. Coring may prove expensive and holes have to be back filled, but the resulting
data are usually accepted as the best evidence of the condition of concrete in place.
Sanita Rubene, obtained the relationship between compressive strength of concrete cubes and rebound
number of the concrete cubes using rebound hammer test. They prepared 20 cubes in the field of size
100x100x100 mm. The concrete cubes are cured for 28 days. Then the concrete cubes are tested in laboratory
and were also tested with a Schmidt rebound hammer using two different impact directions on each testing
points such as horizontal impact and vertical impact. A series of 10 rebounds were carried out for each test.
Significantly the test results obtained by the Schmidt rebound hammer showed that higher than the results
obtained by testing of concrete cubes[1]
. P. Turgut obtained the relationship between concrete strength and
UPSV by using data obtained from many cores taken from different reinforced concrete structures having
different ages and unknown ratios of concrete mixtures. Also a co-relation is developed between the concrete
strength structures and concrete strength obtained by UPSV[2]
. Domagai Damja Novie, et al obtained the co-
relation of mechanical characteristics of concrete measured by experimental testing of concrete specimens
drilled from reinforced concrete columns which were a part of a dock for small ships and were under water for
approximately 20 years. Applied experimental methods in order to assess the state and the quality of concrete
are a combination of destructive and non-destructive methods. The UPV test was carried out on drilled
specimens in laboratory. Destructive methods are determination of concrete compressive strength and modulus
of elasticity on drilled specimens by compression test[3]
.
Raffale Pucinotti, reported the influence of steel bars present in concrete on the propagation velocity of
the ultrasonic waves. A series of experimental investigations have been conducted on simple concrete
300x300x500 mm specimen and 300x300x500 mm reinforced concrete specimens unlike each other for the
longitudinal and transverse spaces of reinforcement. It is observed that transverse steel reinforcements (stirrups
Correlation between Actual Compressive Strength of Concrete and Strength Estimated From Core
DOI: 10.9790/1684-1402032744 www.iosrjournals.org 28 | Page
of 8 mm dia), slightly modifying the course of the ultra-sonic waves, but not modify significantly its velocity[4]
.
M.A. Saleem, in their research work evaluated five storied frame structure whose construction was stopped
seven years ago. For evaluation purpose load test and core test were performed on four floors from basement to
first floor. Test results indicated that the structure had adequate strength for future use even though the structure
for unprotected for several years. It is also reviewed from the results that combination of test instead of
performing one type of test, provide more suitable results to confidentially except or reject the structure[5]
.
A. Zacoeb, et al in their project work they estimated a compressive strength of existing concrete
structures by core test of diameter 100mm. The test results are obtained by using uniaxial compressive strength
test as per JIS A1170. They conducted point load test to get an alternative solutions. The point load test is
performed by taking drilled core specimens from ready mixed concrete with maximum coarse aggregate size
20mm in architectural structures and 40mm in Civil Engineering structures with concrete grade of 16 to 50
MPa, the cores of diameter of 100mm and 125mm with h/d ratio 2.0 is tested by using uniaxial compressive
strength test and the core diameter of 35mm and 50mm with h/d ratio 1.5 and 2.0 are tested by using point load
test [6]
. M.Yaqub, et al in their research work described the comparison of core strength and cube compressive
strength of hardened concrete in existing structures. They extracted the cores from the hardened concrete of
twelve years old building with two different core diameters and two different sizes of concrete cubes. The
obtained compressive strength results were comparing and they found that the smaller size cores and cubes
show greater strength as compared to larger size cores and concrete cubes[7]
.
Ramesh Kumar G.B, in their work the NDT tests were performed on concrete structures. The
structures are in extreme danger state before reaching their life span, because of the fact that the materials in the
structure are exposed to severe environmental conditions. For that structure the repairing and rehabilitation is
necessary. Before the danger zones in the structure are identified by visual appearance, proper investigations on
strength of the structure. For this purpose various tests were performed such as Rebound hammer, carbonation
test, ultrasonic pulse velocity, Rebar Locator test and Impact Echo test. From these test results the structures
have adequate strength for future use [8]
. Dr. V. Karthikeyan, et al in their paper analyzed the deficiencies in the
construction of a multi storied RC frame structure. For analyses of strength of concrete elements of columns and
slabs the Non-destructive tests were conducted. The core samples are extracted from the RC columns and slabs.
The concrete core samples were then subjected to compressive strength test in compressive testing machine.
Then the obtained cube strength results are compared with Is 456:2000. The codal provision shows that the slabs
in ground, first and second floor in the concrete structure are had minimum strength of concrete grade M20. The
RC columns in the ground, first and second floor are less than minimum concrete grade M20. From the obtained
results it is necessary to prefer for suitable rehabilitation techniques to strengthen the RC columns in the
concrete structure [9]
. Bohdan stawiski, in their work assumed that the floor slabs or beam strength is same in all
directions. By considering the load-bearing capacities of structural elements and techniques used in concrete
structures the concrete is isotropic. The research work shows that strength of concrete in slabs along direction of
concreting had a qualitative effect and also quantitative effects. The results show that the compressive strength
of concrete in horizontal direction varies with thickness of slab [10]
.
Kumavat H.R, et al in their paper case study evaluated the concrete quality of building age was 8 years.
The various types of NDT tests were performed such as ultrasonic pulse velocity, half-cell potential, carbonation
depth, rebar locator, cover meter and core sampling. The structures are failed due to temperature variations,
physical causes and chemical attack due to environment. Then the Structure is investigated by visual
observation and conducting NDT tests and field test, and they focused on standard testing procedure of NDT for
accuracy of the result [11]
.
Jedidi Malek, et al in their work to estimate a mechanical properties of concrete the destructive and
Non-destructive tests were performed. In this report the crushing of samples is the destructive test and rebound
hammer test and ultrasonic pulse velocities tests are non-destructive tests on prepared cylindrical specimens of
size 16cm x 32cm with varying the water/ cement ratio and the cement dosage. Then the compressive strength
of concrete is determined at different ages (7, 14 and 28 days) the modulus of elasticity determined by pulse
velocity test method. Finally they obtained results showed that the difference between the resistance values of
destructive and non-destructive methods decreases with increasing age of concrete. The dynamic modulus of
elasticity increases with the curing of concrete until the age of three months [12]
.
Dr. Isam H, et al obtained unified relationship between the results of in-situ hardened concrete and the
results of cube crushing strength of concrete by using statistical methods carried on concrete cubes with
different mixing ratio and different curing conditions and finding core relation curves to predict the strength of
concrete much better. They have concluded that, there is a strong co-relation between compressive strength and
rebound number, ultra-sonic pulse velocity (UPV) obtained from concrete cubes which indicated a good co-
relation coefficient. Using the above co-relation curve in-situ strength of concrete for any structural member can
be determined by knowing rebound number and UPV of that structural member [13]
.
Correlation between Actual Compressive Strength of Concrete and Strength Estimated From Core
DOI: 10.9790/1684-1402032744 www.iosrjournals.org 29 | Page
1.1 Objectives of the project
1) Co-relation between actual compressive strength of concrete cubes and strength estimated from the cores free
from reinforcement.
2) Co-relation between actual compressive strength of concrete cubes and strength estimated from the cores with
reinforcement.
3) Co-relation between actual compressive strength of concrete cubes and strength estimated from cores having
different h/d ratio without reinforcement.
4) Co-relation between actual compressive strength of concrete cubes and strength estimated from cores having
different h/d ratio with reinforcement.
5) Co-relation between strength estimated from rebound hammer randomly and strength estimated from the
cores free from reinforcement.
6) Co-relation between strength estimated from rebound hammer randomly and strength estimated from the
cores with reinforcement.
II. Materials Used 2.1 Cement
Portland Pozzolonic cement (ultratech brand) conforming to IS 1489-1991 was used. The physical properties of
cement used are shown in table1.
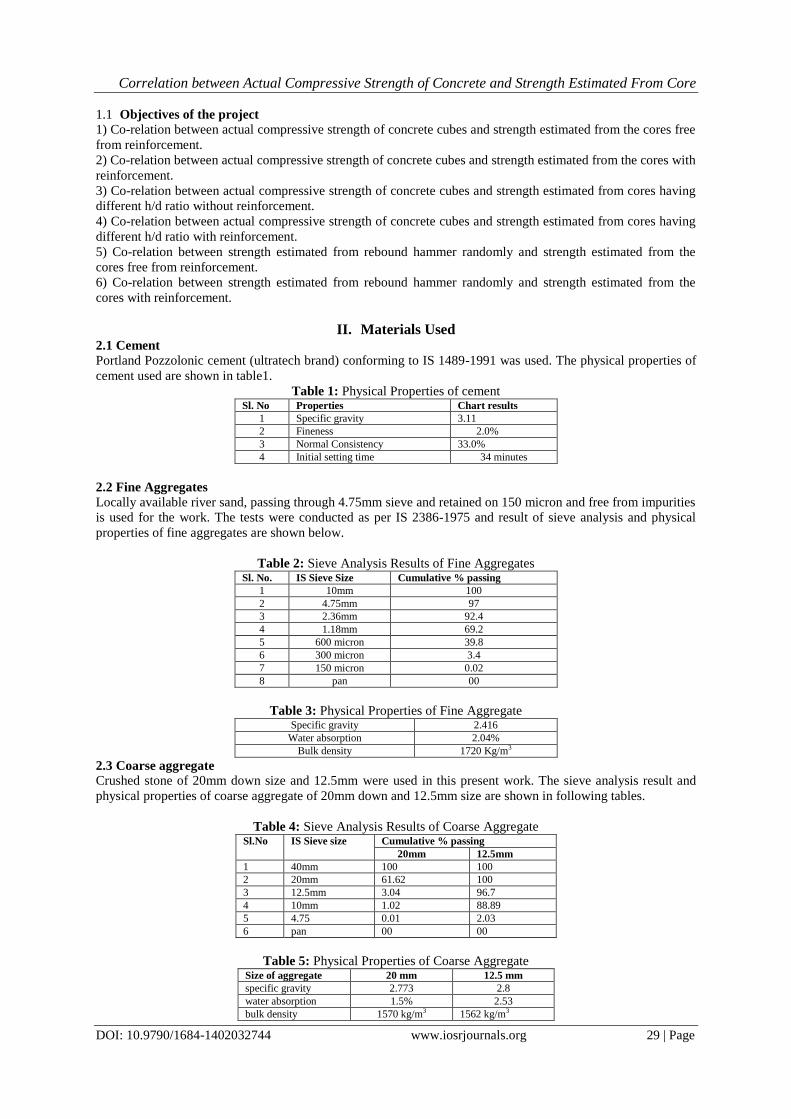
Table 1: Physical Properties of cement Sl. No Properties Chart results
1 Specific gravity 3.11
2 Fineness 2.0%
3 Normal Consistency 33.0%
4 Initial setting time 34 minutes
2.2 Fine Aggregates
Locally available river sand, passing through 4.75mm sieve and retained on 150 micron and free from impurities
is used for the work. The tests were conducted as per IS 2386-1975 and result of sieve analysis and physical
properties of fine aggregates are shown below.
Table 2: Sieve Analysis Results of Fine Aggregates Sl. No. IS Sieve Size Cumulative % passing
1 10mm 100
2 4.75mm 97
3 2.36mm 92.4
4 1.18mm 69.2
5 600 micron 39.8
6 300 micron 3.4
7 150 micron 0.02
8 pan 00
Table 3: Physical Properties of Fine Aggregate Specific gravity 2.416
Water absorption 2.04%
Bulk density 1720 Kg/m3
2.3 Coarse aggregate
Crushed stone of 20mm down size and 12.5mm were used in this present work. The sieve analysis result and
physical properties of coarse aggregate of 20mm down and 12.5mm size are shown in following tables.
Table 4: Sieve Analysis Results of Coarse Aggregate Sl.No IS Sieve size Cumulative % passing
20mm 12.5mm
1 40mm 100 100
2 20mm 61.62 100
3 12.5mm 3.04 96.7
4 10mm 1.02 88.89
5 4.75 0.01 2.03
6 pan 00 00
Table 5: Physical Properties of Coarse Aggregate Size of aggregate 20 mm 12.5 mm
specific gravity 2.773 2.8
water absorption 1.5% 2.53
bulk density 1570 kg/m3 1562 kg/m3
Correlation between Actual Compressive Strength of Concrete and Strength Estimated From Core
DOI: 10.9790/1684-1402032744 www.iosrjournals.org 30 | Page
2.4 Mix Design
Using the physical properties of cement, fine aggregate and coarse aggregate concrete mix was designed for M-
20 grade concrete. The concrete mix is designed as per IS 10262:2009 for the M-20 Grade of concrete for two
different water-cement ratios such as 0.55 and 0.53.The mix proportions are presented in following table [14]
.
Table 6: Mix proportions Water-cement ratio Cement
(Kg/m3)
Fine aggregate
(Kg/m3)
Coarse aggregate
(Kg/m3)
0.53 361.47 678.78 1150.83
0.55 348.32 689.42 1149.79
2.5 Trial mixes
The concrete cubes of size 150mmx150mmx150mm, totally ten concrete cubes were cast for
determination of compressive strength. Five cubes were prepared for water-cement ratio 0.53 and five cubes for
water-cement ratio 0.55. The concrete cubes were cured for 7 days in water pond. The cubes were tested in a
compression testing machine, load at which the cube specimen ultimately fails is noted. The compressive
strength is calculated by dividing the load by area of specimen. The obtained test results are represented in the
following table[15]
.
Table 7: Results of trial mix W/C =0.53 W/C =0.55
Specim
en No.
Load
(Kg)
Compressive strength
(N/mm2)
Load
(Kg)
Compressive
strength (N/mm2)
1 56000 24.416 49000 21.364
2 57000 24.852 50000 21.80
3 56000 24.416 50000 21.80
4 55000 23.98 49000 21.364
5 56000 24.416 49000 21.364
From the above table it is observed that W/C =0.55 resulted in satisfactory compressive strength for M-20 grade
of concrete at the age of 7 days. Therefore W/C =0.55 is finalized for further casting work.
Table 8: Mix proportions of W/C 0.55 Water-
cement
ratio
Cement
(Kg/m3)
Fine
aggregate
(Kg/m3)
Coarse
aggregate
(Kg/m3)
Average compressive
strength
(N/mm2)
0.55 348.32 689.42 1149.79 21.53
2.6 Casting
2.6.1 Destructive Test:
2.6.1.1 Cubes: The twelve numbers of cubes of size 150mmx150mmx150mm were cast. Six numbers of cubes
are used for the cube compression test and other six numbers of cubes are used for the rebound hammer testing.
2.6.1.2 Non Destructive Test:
2.6.1.2.1 Slabs: The slabs are designed as per codal provision IS456:2000. The five numbers of slabs were cast
of size 500mmx500mm with 120mm thickness is provided [15]
.
Table 9: Details of Slab Dimensions Particu
lars
Dimension
(mm)
Clear
cover(mm)
Reinforcement details remark
Slab 500x500x1
20
25 #10@150 c/c (main)#8@150c/c
(distribution)
Two way slab
2.7 Curing:
The cast concrete cubes and slab elements demoulded after 24 hours and kept in water tank for 28 days curing.
After that the specimens were tested in a laboratory.
III. Testing 3.1 DESTRUCTIVE TEST
3.1.1 Cube compression test:
The cube specimens are used for determining characteristic compressive strength. The cubes are tested
in a compression testing machine of capacity 2000KN. The load is applied in such a way that, the two opposite
side of the cubes are compressed (top and bottom surface). The load at which cube specimen ultimately fails is
noted. The compressive strength is calculated by dividing the load by area of specimen and determination of
compressive strength were performed as per IS:516-1959. Totally five numbers of concrete cubes are tested.
The calculated compressive strength of concrete cubes are represented in following table.
Correlation between Actual Compressive Strength of Concrete and Strength Estimated From Core
DOI: 10.9790/1684-1402032744 www.iosrjournals.org 31 | Page
Table 10: Results of Cube Compression Test Sl. No Cube
Number
Load
(Kg)
Compressive strength
(N/mm2)
1 C-1 72000 31.40
2 C-2 75000 32.71
3 C-3 73000 31.84
4 C-4 74000 32.27
5 C-5 73000 31.84
3.2 NON DESTRUCTIVE TEST
3.2.1 Schmidt Rebound Hammer Test
3.2.2 Principle:
The principle of this method is rebound of an elastic mass depends on the hardness of the surface
against which mass Strikes. The plunger of hammer is pressed strongly and steadily against the concrete surface
at right angles to its surface until the spring loaded mass is triggered from the locked position. The distance
travelled by the mass as a percentage is derived as rebound number. A low rebound number will indicate that
the surface of the concrete is soft and the concrete weak. A high rebound number will indicate that the concrete
is hard and strong.
3.2.1.1 Concrete cubes:
Testing of concrete cubes using rebound hammer is such that the cubes were placed and loaded in the
UTM at 40KN and with this holded axial load rebound hammer readings are taken for the five concrete cubes
with horizontal orientation of hammer. The obtained rebound numbers and equivalent cube compressive
strength of concrete cubes obtained from strength conversion chart are represented in the following table.
Table 11: Rebound Hammer Results of Concrete Cubes Sl.
No.
Cube
Number
Rebound
number
Equivalent cube Compressive strength
(N/mm2)
1 C-1 27 20.4
2 C-2 29.2 24
3 C-3 29 23.6
4 C-4 27.8 21.5
5 C-5 29 23.5
3.2.1.2 Slab:
For each cast structural slab elements markings were made at free from reinforcement (only concrete
portion), and along main reinforcement. The rebound numbers were taken randomly from the three numbers of
slabs and totally twelve readings are taken at different places in the slab elements with vertical orientation of
rebound hammer. Average rebound numbers and equivalent cube compressive strength are presented in table
12.
Table 12: Rebound Hammer Results of Slabs Sl. No. Slab
Number
Rebound
number
Equivalent cube
Compressive strength
(N/mm2)
1 S-1 35 39
2 S-2 36 41
3 S-3 32.5 34.5
4 S-4 34.5 38
5 S-5 33 35
3.2.2) Core testing:
3.2.2.1 Principle: In this method concrete cores of size ranging from 20 mm to 150 mm in diameter and 50 mm to 500
mm long are drilled out by diamond cutters. The recommended diameters are 100 to 150 mm, but if the drill
depth is insufficient as in the case of slabs, then smaller diameter may be used but not less than three times
nominal aggregate size. The core diameter to length ratio shall be normally between 1.0 to 2.0. At least three
cores shall be tested for acceptable accuracy. The cores were take in the location free from reinforcement and
along the reinforcement at each location fifteen numbers of cores were taken[13]
.
3.2.2.2 Selection of core size:
We are taking cores from the cast slab of thickness 120mm. therefore in the present case it is decided to take
cores of diameter 50mm. the height to diameter ratio were varied from 1.5, 1.75 and 2.0. For each H/D ratio five
cores were taken. Therefore, result is average of five numbers.
Correlation between Actual Compressive Strength of Concrete and Strength Estimated From Core
DOI: 10.9790/1684-1402032744 www.iosrjournals.org 32 | Page
4.2.2.3 Core drilling:
The cores were cut by means of a rotary cutting tool with diamond bits size 50mm. The core cutting
equipment is heavy and it is firmly supported and braced against the concrete surface to prevent relative
movement which will result in a distorted or broken core, a continuous water supply is provided to lubricate the
core cutter. By applying the uniform pressure in a vertical direction, totally thirty numbers of cores were
extracted from the marked concrete slabs. In that fifteen numbers of cores are extracted from only in concrete
portion (without reinforcement) and other fifteen numbers of cores are extracted with reinforcement.
3.2.2.4 Visual inspection:
The drilled cores from the slab elements were observed, the aggregates are equally distributed and there is no
cracks and damage caused to the drilled cores.
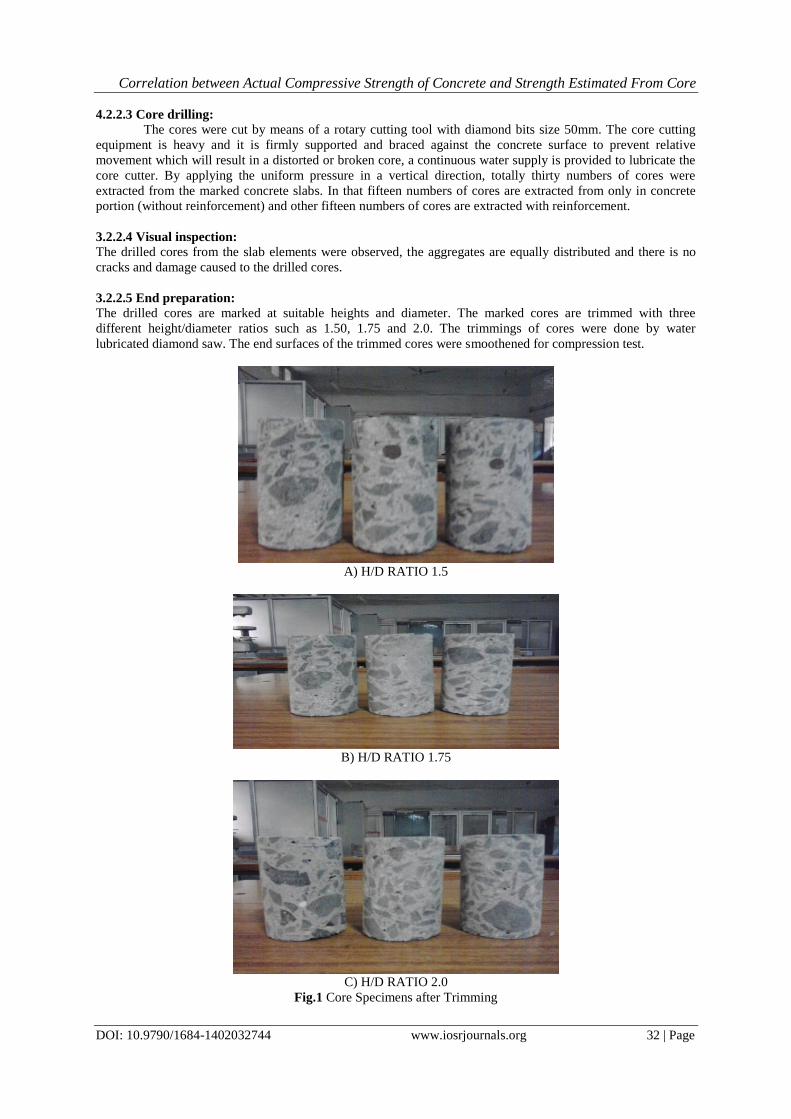
3.2.2.5 End preparation:
The drilled cores are marked at suitable heights and diameter. The marked cores are trimmed with three
different height/diameter ratios such as 1.50, 1.75 and 2.0. The trimmings of cores were done by water
lubricated diamond saw. The end surfaces of the trimmed cores were smoothened for compression test.
A) H/D RATIO 1.5
B) H/D RATIO 1.75
C) H/D RATIO 2.0
Fig.1 Core Specimens after Trimming
Correlation between Actual Compressive Strength of Concrete and Strength Estimated From Core
DOI: 10.9790/1684-1402032744 www.iosrjournals.org 33 | Page
3.2.2.6 Density Determination: The density and excess voidage is determined for the trimmed cores of H/D ratio 1.50, 1.75 and 2.0 The density
and excess voidage were determined by using following formula.
Da = Wt-Dc(Vt-Vu)-Ws/ (Vu-Vs)
Where, Vu=volume of trimmed core
Dc=density of capping materials
Wt=Weight of soaked / surface dry capped core in air and water.
Vt=Volume of soaked / surface dry capped core
Table 13: Density of Cores Sl.No H/D ratio Density (Kg/m3)
1 1.50 2518.81
2 1.75 2495.65
3 2.0 2496.29
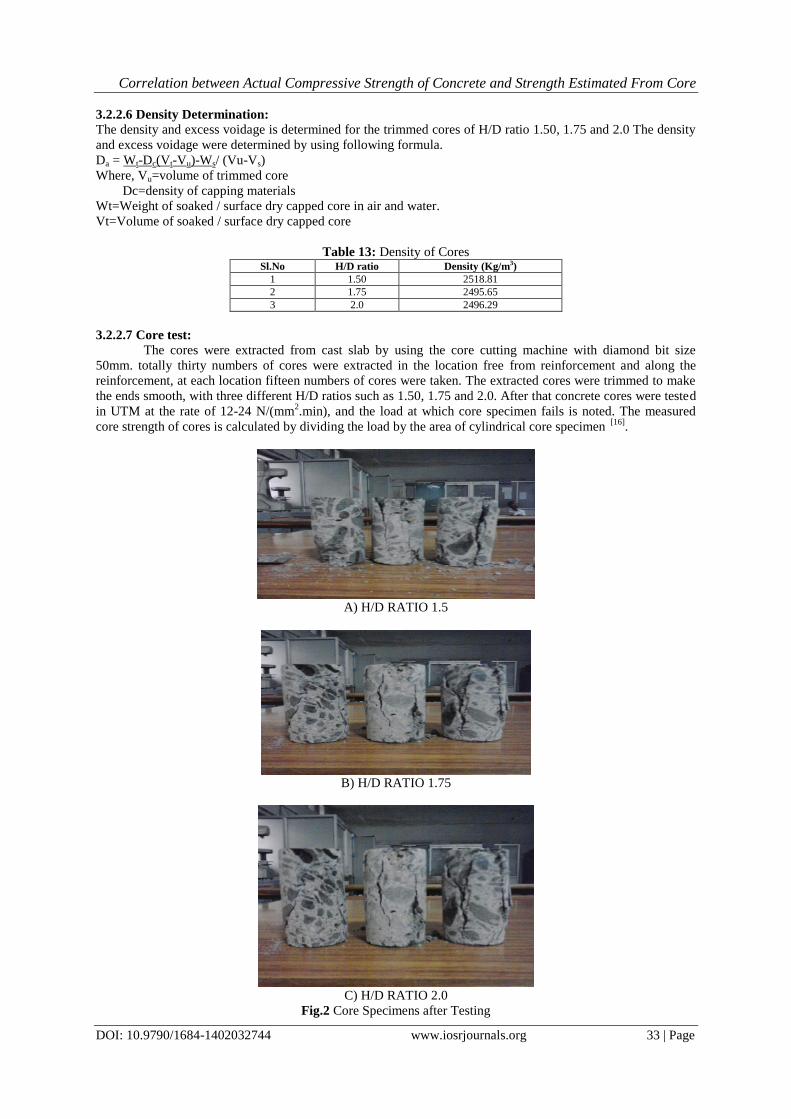
3.2.2.7 Core test:
The cores were extracted from cast slab by using the core cutting machine with diamond bit size
50mm. totally thirty numbers of cores were extracted in the location free from reinforcement and along the
reinforcement, at each location fifteen numbers of cores were taken. The extracted cores were trimmed to make
the ends smooth, with three different H/D ratios such as 1.50, 1.75 and 2.0. After that concrete cores were tested
in UTM at the rate of 12-24 N/(mm2.min), and the load at which core specimen fails is noted. The measured
core strength of cores is calculated by dividing the load by the area of cylindrical core specimen [16]
.
A) H/D RATIO 1.5
B) H/D RATIO 1.75
C) H/D RATIO 2.0
Fig.2 Core Specimens after Testing
Correlation between Actual Compressive Strength of Concrete and Strength Estimated From Core
DOI: 10.9790/1684-1402032744 www.iosrjournals.org 34 | Page
IIII. Results And Discussion The obtained measured core compressive strength results of cores with H/D ratio 1.5, 1.75 and 2.0 are
represented in the following tables.
4.1 Measured Core Compressive Strength Results
4.1.1 Cores Free From Reinforcement
Table 14 : Measured Core Compressive Strength Results Of Differenet H/D Ratio Sl.no. H/D =1.50 H/D=1.75 H/D=2.0
Failure
load (ton)
Measured core
compressive
strength (N/mm2)
Failure
load (ton)
Measured core
compressive
strength (N/mm2)
Failure load
(ton)
Measured core
compressive strength
(N/mm2)
1 2.80 18.07 3.75 24.21 3.00 19.36
2 2.85 18.40 3.00 19.36 3.25 20.98
3 2.80 18.07 3.35 20.98 3.25 20.98
4 2.90 18.72 3.10 20.01 3.30 21.30
5 2.83 18.27 3.20 21.30 3.20 20.66
4.1.2 Cores with Reinforcement
Table 15 : Measured Core Compressive Strength Results Of Differenet H/D Ratio Sl.no. H/D =1.50 H/D=1.75 H/D=2.0
Failure load
(ton)
Measured core
compressive
strength (N/mm2)
Failure load
(ton)
Measured core
compressive
strength (N/mm2)
Failure load
(ton)
Measured core
compressive strength
(N/mm2)
1 3.20 20.66 4.40 28.40 5.50 35.50
2 3.25 20.98 4.00 25.82 5.00 32.28
3 3.30 21.30 4.50 29.05 5.25 33.89
4 3.30 21.30 4.20 27.11 5.20 33.57
5 3.28 21.17 4.45 28.73 5.30 34.21
4.2 Corrections For Measured Core Compressive Strength
The corrections are applied to the measured core compresive strength. Corrections due to excess voidage and
effect fof H/D ratio are to be applied.
4.2.1 Correction Due To Excess Voidage
Table 16: Excess Voidage Correction Factors Sl.
No.
(H/D)
ratio
Estimated excess
voidage (%)
Excess voidage
correction factors
1 1.50 1.177 1.09
2 1.75 1.14 1.08
3 2.0 1.115 1.065
The excess voidage correction factors are represented in the above table. By applying these correction factors
the corrected core compressive strength was obtained and represented in the folowing tables.
4.2.1.1 Cores Free From Reinforcement
Table 17: Corrected Core Compressive Strength with H/D Ratio 1.50, 1.75 and 2.0 (N/mm2)
Sl.no. H/D=1.50 H/D=1.75 H/D=2.0
1 19.69 26.41 20.61
2 20.05 20.90 22.34
3 19.69 22.65 22.34
4 20.40 21.61 22.68
5 19.91 23.00 22.00
4.2.1.2 Cores With Reinforcement
Table 18: Corrected Core Compressive Strength with H/D Ratio 1.50, 1.75 and 2.0 (N/mm2)
Sl.no. H/D=1.50 H/D=1.75 H/D=2.0
1 22.51 30.67 37.81
2 22.86 27.88 34.37
3 23.21 31.37 36.09
4 23.21 29.27 35.75
5 23.07 31.02 36.43
Correlation between Actual Compressive Strength of Concrete and Strength Estimated From Core
DOI: 10.9790/1684-1402032744 www.iosrjournals.org 35 | Page
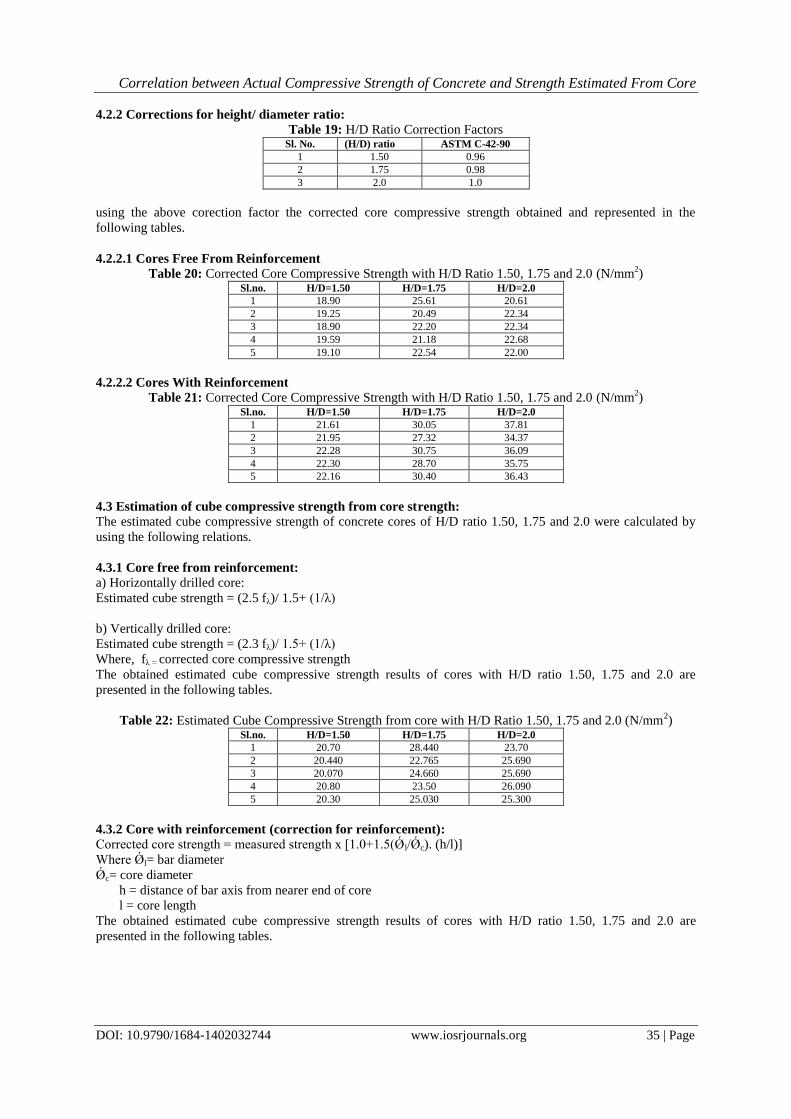
4.2.2 Corrections for height/ diameter ratio:
Table 19: H/D Ratio Correction Factors Sl. No. (H/D) ratio ASTM C-42-90
1 1.50 0.96
2 1.75 0.98
3 2.0 1.0
using the above corection factor the corrected core compressive strength obtained and represented in the
following tables.
4.2.2.1 Cores Free From Reinforcement
Table 20: Corrected Core Compressive Strength with H/D Ratio 1.50, 1.75 and 2.0 (N/mm2)
Sl.no. H/D=1.50 H/D=1.75 H/D=2.0
1 18.90 25.61 20.61
2 19.25 20.49 22.34
3 18.90 22.20 22.34
4 19.59 21.18 22.68
5 19.10 22.54 22.00
4.2.2.2 Cores With Reinforcement
Table 21: Corrected Core Compressive Strength with H/D Ratio 1.50, 1.75 and 2.0 (N/mm2)
Sl.no. H/D=1.50 H/D=1.75 H/D=2.0
1 21.61 30.05 37.81
2 21.95 27.32 34.37
3 22.28 30.75 36.09
4 22.30 28.70 35.75
5 22.16 30.40 36.43
4.3 Estimation of cube compressive strength from core strength:
The estimated cube compressive strength of concrete cores of H/D ratio 1.50, 1.75 and 2.0 were calculated by
using the following relations.
4.3.1 Core free from reinforcement:
a) Horizontally drilled core:
Estimated cube strength = (2.5 fλ)/ 1.5+ (1/λ)
b) Vertically drilled core:
Estimated cube strength = (2.3 fλ)/ 1.5+ (1/λ)
Where, fλ = corrected core compressive strength
The obtained estimated cube compressive strength results of cores with H/D ratio 1.50, 1.75 and 2.0 are
presented in the following tables.
Table 22: Estimated Cube Compressive Strength from core with H/D Ratio 1.50, 1.75 and 2.0 (N/mm2)
Sl.no. H/D=1.50 H/D=1.75 H/D=2.0
1 20.70 28.440 23.70
2 20.440 22.765 25.690
3 20.070 24.660 25.690
4 20.80 23.50 26.090
5 20.30 25.030 25.300
4.3.2 Core with reinforcement (correction for reinforcement):
Corrected core strength = measured strength x [1.0+1.5(Ǿl/Ǿc). (h/l)]
Where Ǿl= bar diameter
Ǿc= core diameter
h = distance of bar axis from nearer end of core
l = core length
The obtained estimated cube compressive strength results of cores with H/D ratio 1.50, 1.75 and 2.0 are
presented in the following tables.
Correlation between Actual Compressive Strength of Concrete and Strength Estimated From Core
DOI: 10.9790/1684-1402032744 www.iosrjournals.org 36 | Page
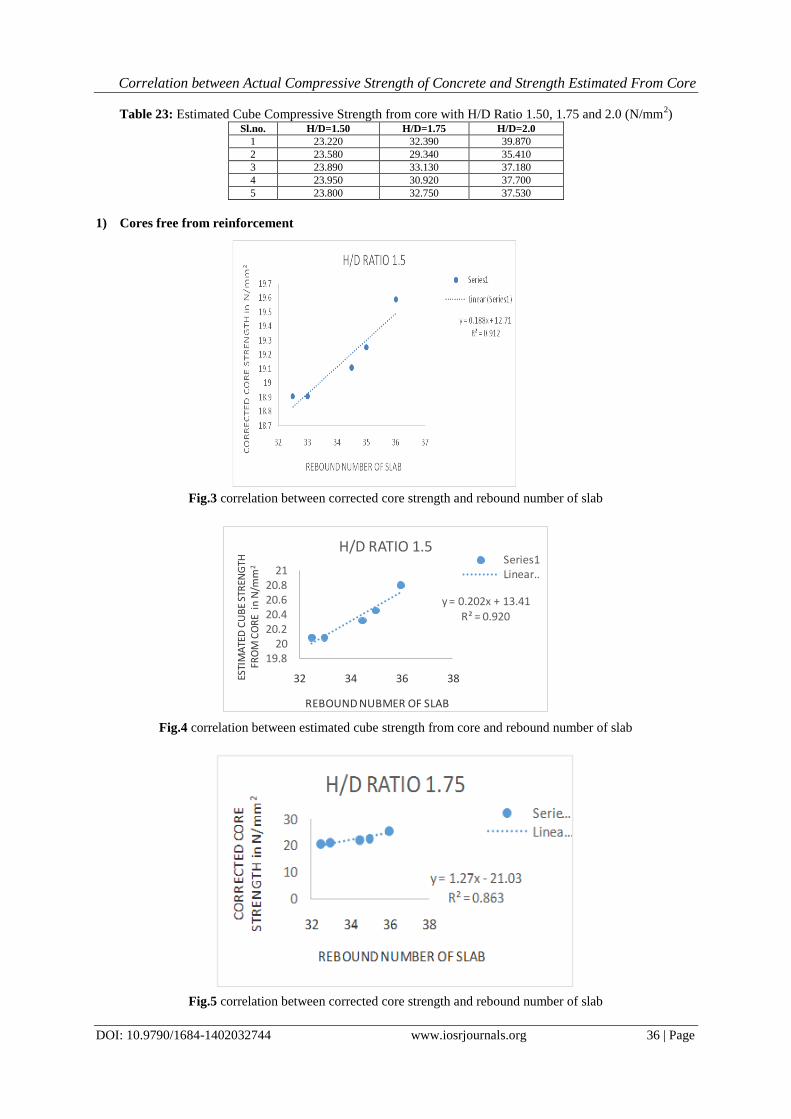
Table 23: Estimated Cube Compressive Strength from core with H/D Ratio 1.50, 1.75 and 2.0 (N/mm2)
Sl.no. H/D=1.50 H/D=1.75 H/D=2.0
1 23.220 32.390 39.870
2 23.580 29.340 35.410
3 23.890 33.130 37.180
4 23.950 30.920 37.700
5 23.800 32.750 37.530
1) Cores free from reinforcement
Fig.3 correlation between corrected core strength and rebound number of slab
Fig.4 correlation between estimated cube strength from core and rebound number of slab
Fig.5 correlation between corrected core strength and rebound number of slab
y = 0.202x + 13.41
R² = 0.920
19.820
20.220.420.620.8
21
32 34 36 38ESTI
MA
TED
CU
BE
STR
ENG
TH
FRO
M C
OR
E i
n N
/mm
2
REBOUND NUBMER OF SLAB
H/D RATIO 1.5Series1Linear …
Correlation between Actual Compressive Strength of Concrete and Strength Estimated From Core
DOI: 10.9790/1684-1402032744 www.iosrjournals.org 37 | Page
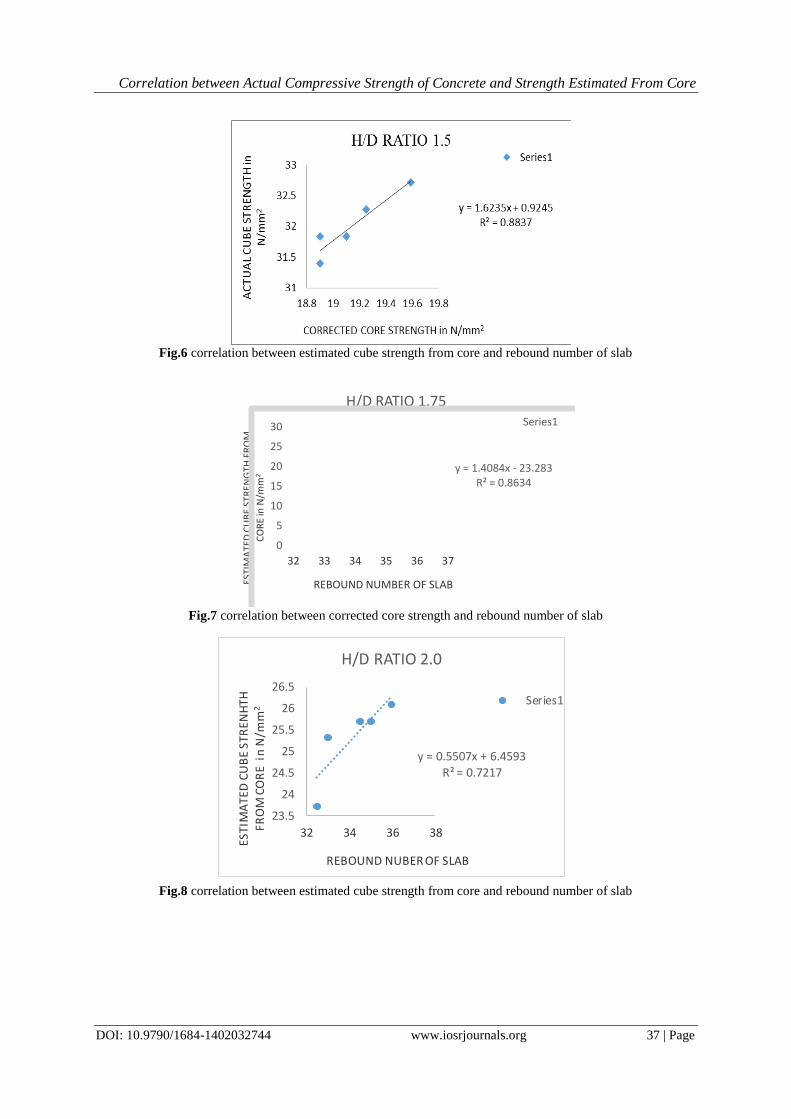
Fig.6 correlation between estimated cube strength from core and rebound number of slab
y = 1.4084x - 23.283R² = 0.8634
0
5
10
15
20
25
30
32 33 34 35 36 37
ESTI
MA
TED
CU
BE
STR
ENG
TH F
RO
M
CO
RE
in N
/mm
2
REBOUND NUMBER OF SLAB
H/D RATIO 1.75Series1
Fig.7 correlation between corrected core strength and rebound number of slab
Fig.8 correlation between estimated cube strength from core and rebound number of slab
y = 0.5507x + 6.4593
R² = 0.7217
23.5
24
24.5
25
25.5
26
26.5
32 34 36 38
ESTI
MA
TED
CU
BE
STR
ENH
TH
FR
OM
CO
RE
in
N/m
m2
REBOUND NUBER OF SLAB
H/D RATIO 2.0
Series1
Correlation between Actual Compressive Strength of Concrete and Strength Estimated From Core
DOI: 10.9790/1684-1402032744 www.iosrjournals.org 38 | Page
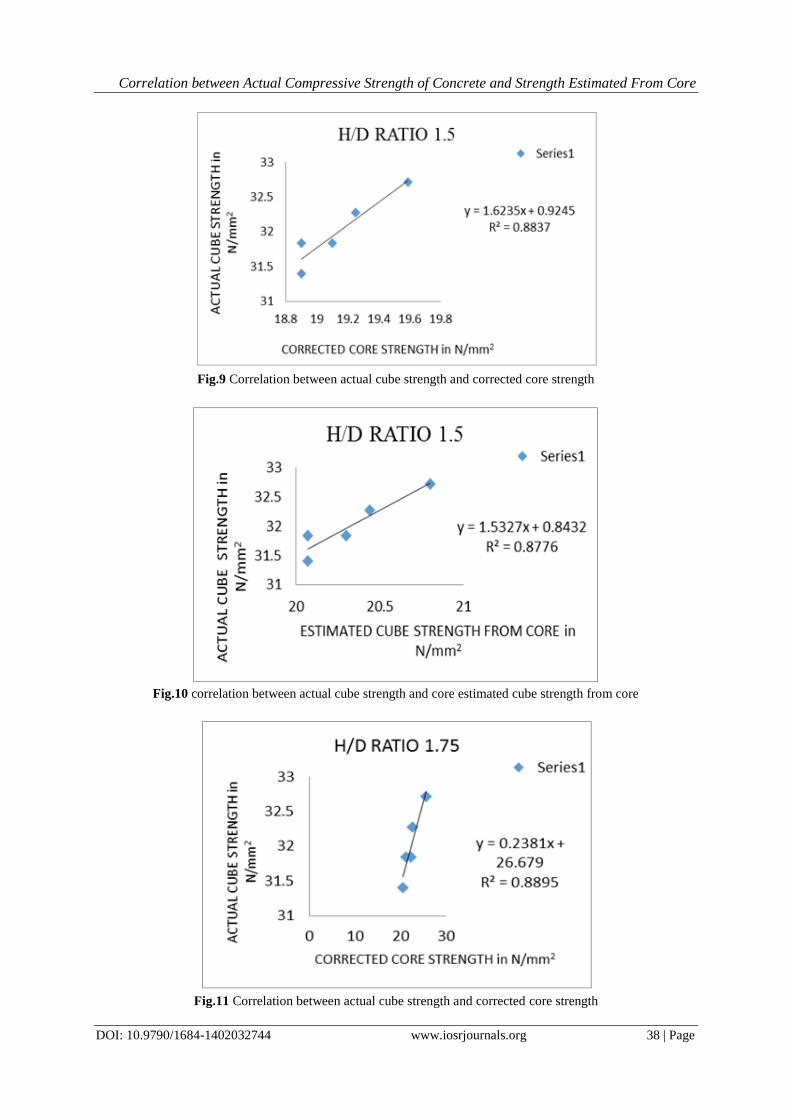
Fig.9 Correlation between actual cube strength and corrected core strength
Fig.10 correlation between actual cube strength and core estimated cube strength from core
Fig.11 Correlation between actual cube strength and corrected core strength
Correlation between Actual Compressive Strength of Concrete and Strength Estimated From Core
DOI: 10.9790/1684-1402032744 www.iosrjournals.org 39 | Page
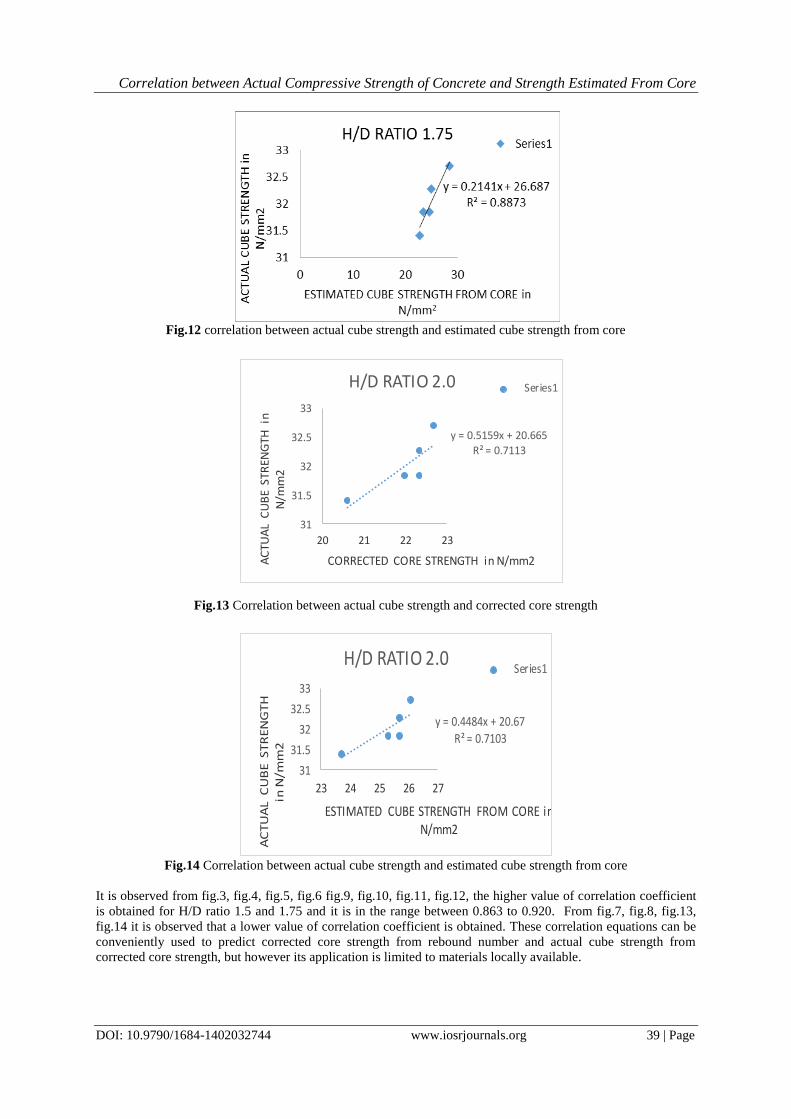
Fig.12 correlation between actual cube strength and estimated cube strength from core
Fig.13 Correlation between actual cube strength and corrected core strength
Fig.14 Correlation between actual cube strength and estimated cube strength from core
It is observed from fig.3, fig.4, fig.5, fig.6 fig.9, fig.10, fig.11, fig.12, the higher value of correlation coefficient
is obtained for H/D ratio 1.5 and 1.75 and it is in the range between 0.863 to 0.920. From fig.7, fig.8, fig.13,
fig.14 it is observed that a lower value of correlation coefficient is obtained. These correlation equations can be
conveniently used to predict corrected core strength from rebound number and actual cube strength from
corrected core strength, but however its application is limited to materials locally available.
y = 0.5159x + 20.665
R² = 0.7113
31
31.5
32
32.5
33
20 21 22 23
AC
TUA
L C
UB
E ST
REN
GTH
in
N
/mm
2
CORRECTED CORE STRENGTH in N/mm2
H/D RATIO 2.0 Series1
y = 0.4484x + 20.67
R² = 0.7103
31
31.5
32
32.5
33
23 24 25 26 27
AC
TU
AL
CU
BE
ST
RE
NG
TH
in
N/m
m2
ESTIMATED CUBE STRENGTH FROM CORE in N/mm2
H/D RATIO 2.0Series1
Correlation between Actual Compressive Strength of Concrete and Strength Estimated From Core
DOI: 10.9790/1684-1402032744 www.iosrjournals.org 40 | Page
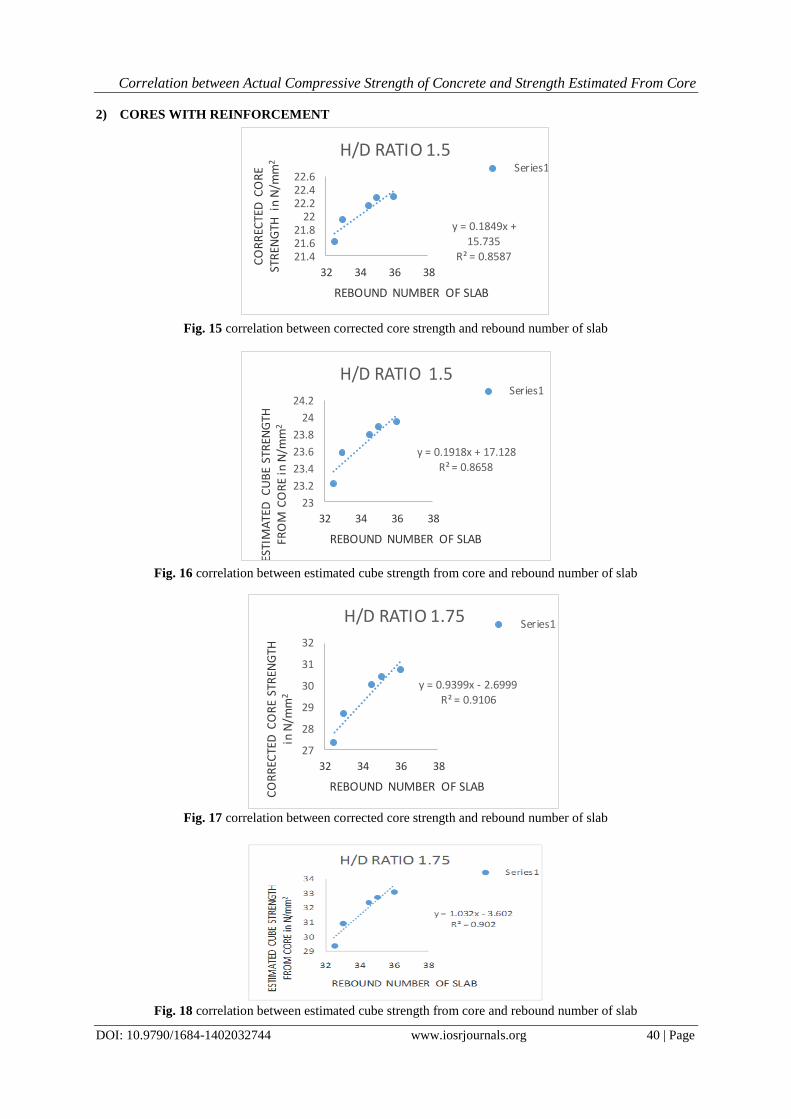
2) CORES WITH REINFORCEMENT
Fig. 15 correlation between corrected core strength and rebound number of slab
Fig. 16 correlation between estimated cube strength from core and rebound number of slab
Fig. 17 correlation between corrected core strength and rebound number of slab
Fig. 18 correlation between estimated cube strength from core and rebound number of slab
y = 0.1849x +
15.735
R² = 0.858721.421.621.8
2222.222.422.6
32 34 36 38C
OR
REC
TED
CO
RE
STR
ENG
TH i
n N
/mm
2
REBOUND NUMBER OF SLAB
H/D RATIO 1.5 Series1
y = 0.1918x + 17.128R² = 0.8658
23
23.2
23.4
23.6
23.8
24
24.2
32 34 36 38
ESTI
MA
TED
CU
BE
STR
ENG
TH
FRO
M C
OR
E in
N/m
m2
REBOUND NUMBER OF SLAB
H/D RATIO 1.5Series1
y = 0.9399x - 2.6999R² = 0.9106
27
28
29
30
31
32
32 34 36 38
CO
RR
ECTE
D C
OR
E ST
REN
GTH
in
N/m
m2
REBOUND NUMBER OF SLAB
H/D RATIO 1.75 Series1
Correlation between Actual Compressive Strength of Concrete and Strength Estimated From Core
DOI: 10.9790/1684-1402032744 www.iosrjournals.org 41 | Page
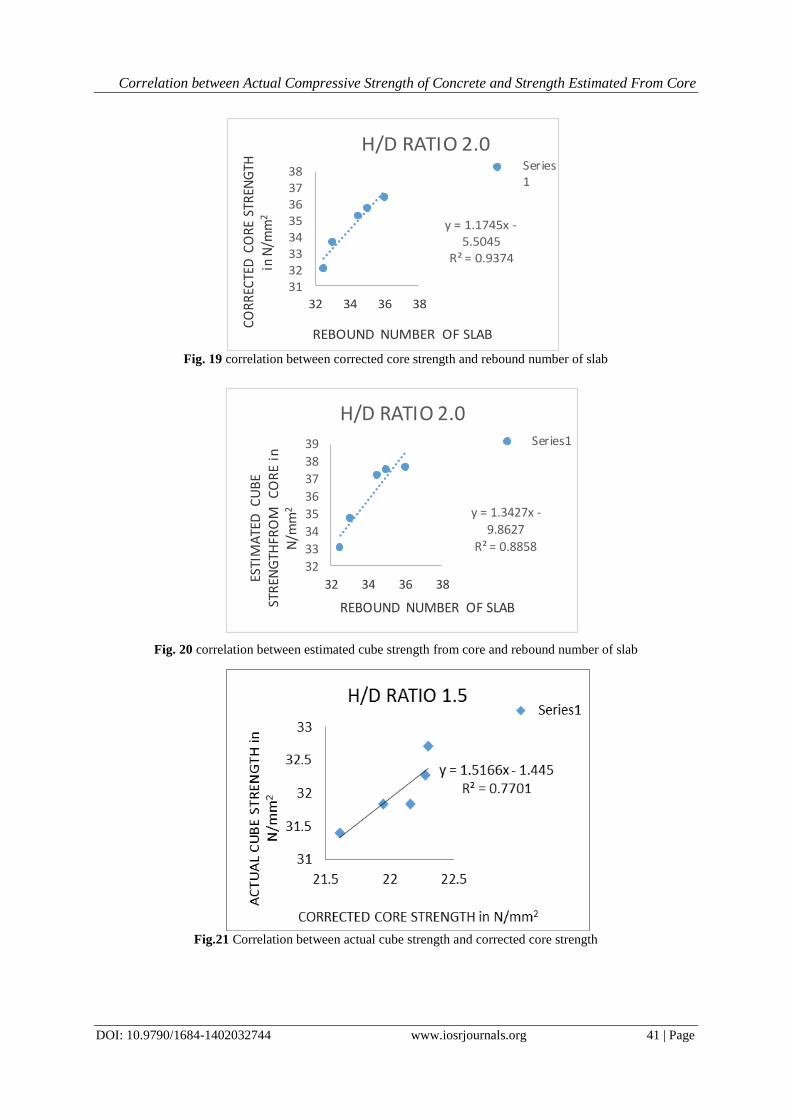
Fig. 19 correlation between corrected core strength and rebound number of slab
Fig. 20 correlation between estimated cube strength from core and rebound number of slab
Fig.21 Correlation between actual cube strength and corrected core strength
y = 1.1745x -
5.5045
R² = 0.9374
3132333435363738
32 34 36 38
CO
RR
ECTE
D C
OR
E ST
REN
GTH
in
N/m
m2
REBOUND NUMBER OF SLAB
H/D RATIO 2.0 Series1
y = 1.3427x -
9.8627
R² = 0.8858
32
33
34
35
36
37
38
39
32 34 36 38ESTI
MA
TED
CU
BE
STR
ENG
THFR
OM
C
OR
E in
N
/mm
2
REBOUND NUMBER OF SLAB
H/D RATIO 2.0Series1
Correlation between Actual Compressive Strength of Concrete and Strength Estimated From Core
DOI: 10.9790/1684-1402032744 www.iosrjournals.org 42 | Page
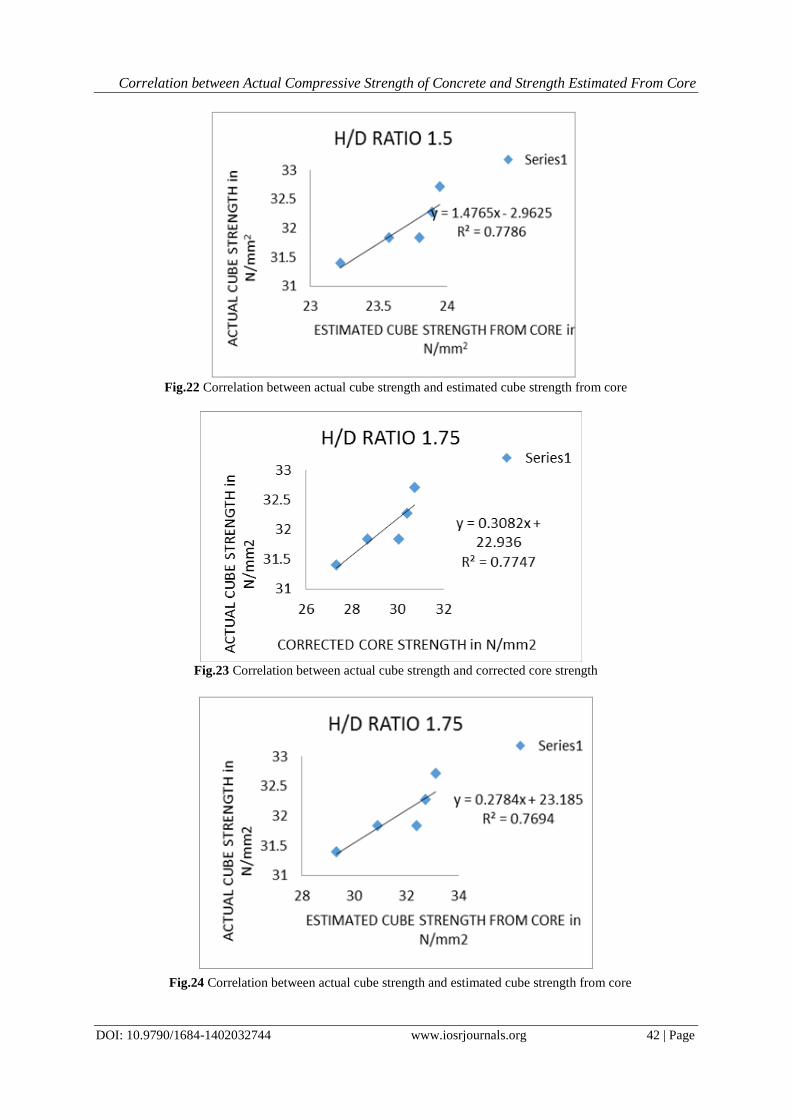
Fig.22 Correlation between actual cube strength and estimated cube strength from core
Fig.23 Correlation between actual cube strength and corrected core strength
Fig.24 Correlation between actual cube strength and estimated cube strength from core
Correlation between Actual Compressive Strength of Concrete and Strength Estimated From Core
DOI: 10.9790/1684-1402032744 www.iosrjournals.org 43 | Page
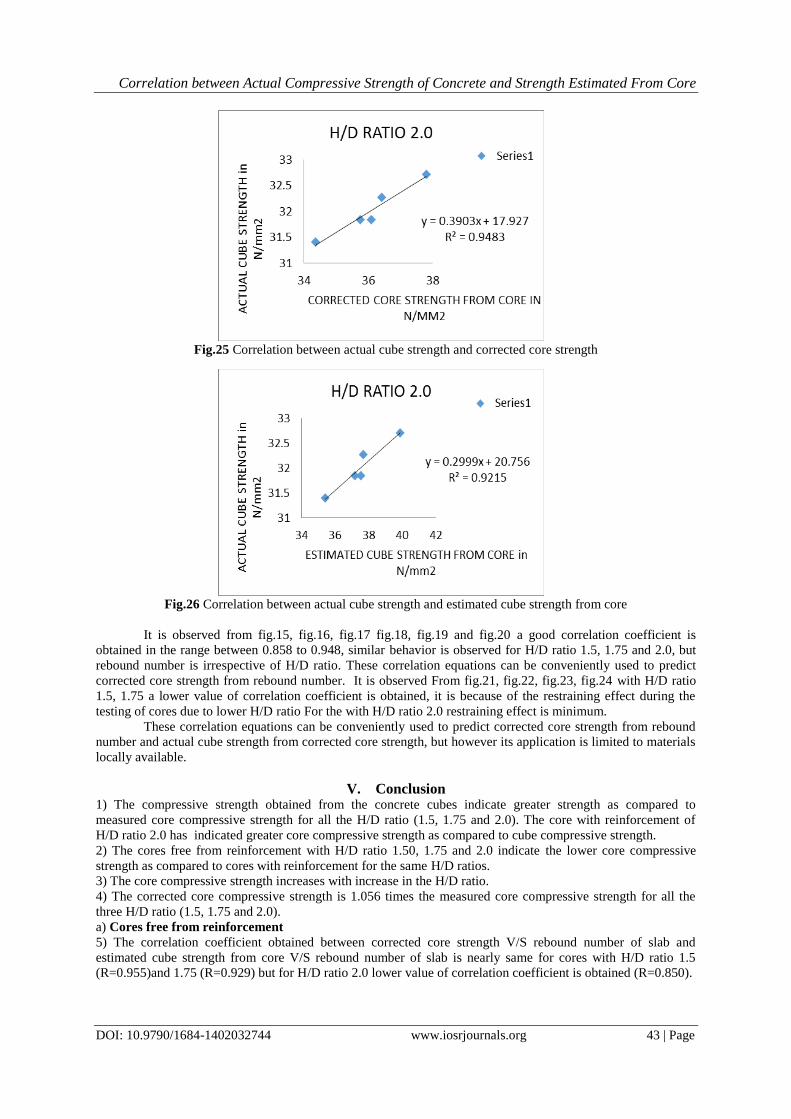
Fig.25 Correlation between actual cube strength and corrected core strength
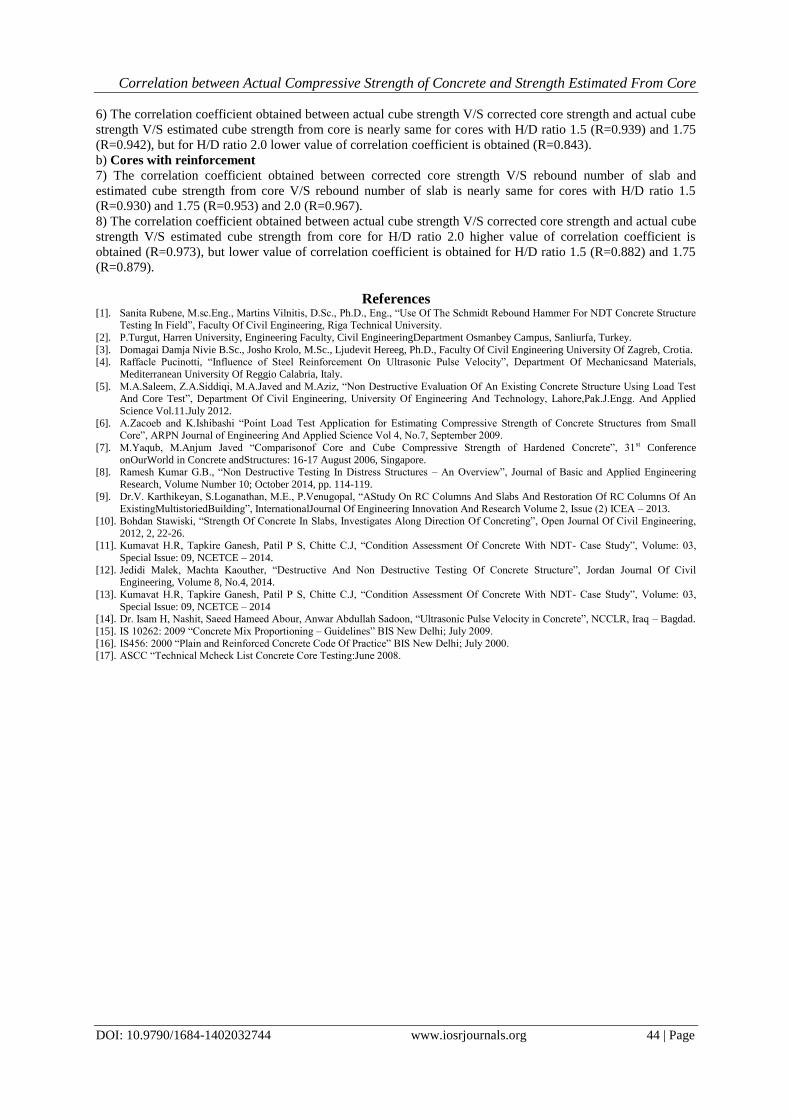
Fig.26 Correlation between actual cube strength and estimated cube strength from core
It is observed from fig.15, fig.16, fig.17 fig.18, fig.19 and fig.20 a good correlation coefficient is
obtained in the range between 0.858 to 0.948, similar behavior is observed for H/D ratio 1.5, 1.75 and 2.0, but
rebound number is irrespective of H/D ratio. These correlation equations can be conveniently used to predict
corrected core strength from rebound number. It is observed From fig.21, fig.22, fig.23, fig.24 with H/D ratio
1.5, 1.75 a lower value of correlation coefficient is obtained, it is because of the restraining effect during the
testing of cores due to lower H/D ratio For the with H/D ratio 2.0 restraining effect is minimum.
These correlation equations can be conveniently used to predict corrected core strength from rebound
number and actual cube strength from corrected core strength, but however its application is limited to materials
locally available.
V. Conclusion 1) The compressive strength obtained from the concrete cubes indicate greater strength as compared to
measured core compressive strength for all the H/D ratio (1.5, 1.75 and 2.0). The core with reinforcement of
H/D ratio 2.0 has indicated greater core compressive strength as compared to cube compressive strength.
2) The cores free from reinforcement with H/D ratio 1.50, 1.75 and 2.0 indicate the lower core compressive
strength as compared to cores with reinforcement for the same H/D ratios.
3) The core compressive strength increases with increase in the H/D ratio.
4) The corrected core compressive strength is 1.056 times the measured core compressive strength for all the
three H/D ratio (1.5, 1.75 and 2.0).
a) Cores free from reinforcement
5) The correlation coefficient obtained between corrected core strength V/S rebound number of slab and
estimated cube strength from core V/S rebound number of slab is nearly same for cores with H/D ratio 1.5
(R=0.955)and 1.75 (R=0.929) but for H/D ratio 2.0 lower value of correlation coefficient is obtained (R=0.850).
Correlation between Actual Compressive Strength of Concrete and Strength Estimated From Core
DOI: 10.9790/1684-1402032744 www.iosrjournals.org 44 | Page
6) The correlation coefficient obtained between actual cube strength V/S corrected core strength and actual cube
strength V/S estimated cube strength from core is nearly same for cores with H/D ratio 1.5 (R=0.939) and 1.75
(R=0.942), but for H/D ratio 2.0 lower value of correlation coefficient is obtained (R=0.843).
b) Cores with reinforcement
7) The correlation coefficient obtained between corrected core strength V/S rebound number of slab and
estimated cube strength from core V/S rebound number of slab is nearly same for cores with H/D ratio 1.5
(R=0.930) and 1.75 (R=0.953) and 2.0 (R=0.967).
8) The correlation coefficient obtained between actual cube strength V/S corrected core strength and actual cube
strength V/S estimated cube strength from core for H/D ratio 2.0 higher value of correlation coefficient is
obtained (R=0.973), but lower value of correlation coefficient is obtained for H/D ratio 1.5 (R=0.882) and 1.75
(R=0.879).
References [1]. Sanita Rubene, M.sc.Eng., Martins Vilnitis, D.Sc., Ph.D., Eng., “Use Of The Schmidt Rebound Hammer For NDT Concrete Structure
Testing In Field”, Faculty Of Civil Engineering, Riga Technical University.
[2]. P.Turgut, Harren University, Engineering Faculty, Civil EngineeringDepartment Osmanbey Campus, Sanliurfa, Turkey.
[3]. Domagai Damja Nivie B.Sc., Josho Krolo, M.Sc., Ljudevit Hereeg, Ph.D., Faculty Of Civil Engineering University Of Zagreb, Crotia. [4]. Raffacle Pucinotti, “Influence of Steel Reinforcement On Ultrasonic Pulse Velocity”, Department Of Mechanicsand Materials,
Mediterranean University Of Reggio Calabria, Italy.
[5]. M.A.Saleem, Z.A.Siddiqi, M.A.Javed and M.Aziz, “Non Destructive Evaluation Of An Existing Concrete Structure Using Load Test And Core Test”, Department Of Civil Engineering, University Of Engineering And Technology, Lahore,Pak.J.Engg. And Applied
Science Vol.11.July 2012.
[6]. A.Zacoeb and K.Ishibashi “Point Load Test Application for Estimating Compressive Strength of Concrete Structures from Small Core”, ARPN Journal of Engineering And Applied Science Vol 4, No.7, September 2009.
[7]. M.Yaqub, M.Anjum Javed “Comparisonof Core and Cube Compressive Strength of Hardened Concrete”, 31st Conference
onOurWorld in Concrete andStructures: 16-17 August 2006, Singapore. [8]. Ramesh Kumar G.B., “Non Destructive Testing In Distress Structures – An Overview”, Journal of Basic and Applied Engineering
Research, Volume Number 10; October 2014, pp. 114-119.
[9]. Dr.V. Karthikeyan, S.Loganathan, M.E., P.Venugopal, “AStudy On RC Columns And Slabs And Restoration Of RC Columns Of An ExistingMultistoriedBuilding”, InternationalJournal Of Engineering Innovation And Research Volume 2, Issue (2) ICEA – 2013.
[10]. Bohdan Stawiski, “Strength Of Concrete In Slabs, Investigates Along Direction Of Concreting”, Open Journal Of Civil Engineering,
2012, 2, 22-26. [11]. Kumavat H.R, Tapkire Ganesh, Patil P S, Chitte C.J, “Condition Assessment Of Concrete With NDT- Case Study”, Volume: 03,
Special Issue: 09, NCETCE – 2014.
[12]. Jedidi Malek, Machta Kaouther, “Destructive And Non Destructive Testing Of Concrete Structure”, Jordan Journal Of Civil
Engineering, Volume 8, No.4, 2014.
[13]. Kumavat H.R, Tapkire Ganesh, Patil P S, Chitte C.J, “Condition Assessment Of Concrete With NDT- Case Study”, Volume: 03,
Special Issue: 09, NCETCE – 2014 [14]. Dr. Isam H, Nashit, Saeed Hameed Abour, Anwar Abdullah Sadoon, “Ultrasonic Pulse Velocity in Concrete”, NCCLR, Iraq – Bagdad.
[15]. IS 10262: 2009 “Concrete Mix Proportioning – Guidelines” BIS New Delhi; July 2009.
[16]. IS456: 2000 “Plain and Reinforced Concrete Code Of Practice” BIS New Delhi; July 2000. [17]. ASCC “Technical Mcheck List Concrete Core Testing:June 2008.


