

1 L. H. X. Daphne et al. / Journal of Water Sustainability 3 (2011) 55–64
* Corresponding to:[email protected]
Correlation between Turbidity and Total Suspended Solids in
Singapore Rivers
Low Hui Xiang Daphne, Handojo Djati Utomo*, Lim Zhi Hao Kenneth
Division of Civil Engineering, School of Architecture and the Built Environment, Singapore Polytechnic, 500
Dover Road, Singapore 139651
ABSTRACT
Sediments in the rivers, expressed as suspended solids, are depending on the discharge. In recent years, Singapore
has several numbers of construction projects. The construction activities may result an increase of river water
pollution, especially sediment concentration, in some Singapore rivers near construction sites. As part of control
strategy, silts and sediments can be discharged in stormwater drainage system with the maximum allowable limit of
50 mg/L of total suspended solids. Continuous direct measurement of total suspended solids can be conducted
during river water sampling in various river streams. However the method is very time consuming due to a large
number of water samples needed for the analysis. A random study was conducted from January 2010 to July 2011
in several river streams in Singapore. In this study each of total suspended solids measurement was paired with
relatively fast turbidity measurement at a preliminary defined location of 50- 100 m away from any construction
sites. The correlation between TSS and turbidity was established to offer more efficiency in predicting total
suspended solids concentration in a river. A positive relationship between total suspended solids concentration and
turbidity level suggested that the measurement of turbidity is possibly the most economic option for estimating total
suspended solids concentration in a river.
Keywords: Constructions; River; Total Suspended Solids; Turbidity
1. INTRODUCTION
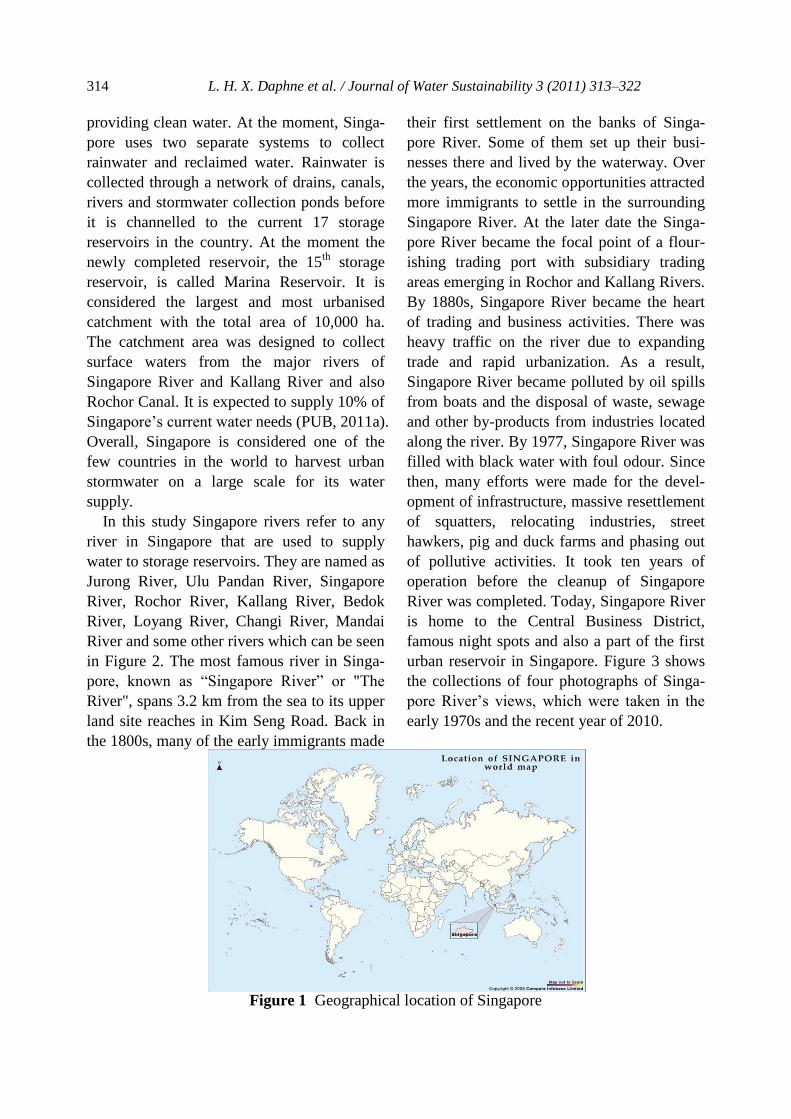
Singapore is geographically located between
latitudes N 1⁰ 09’ and N 1⁰ 29’ and longitudes
E 103⁰ 36’ and E 104⁰ 25’ with the total area
of 694 km2. Figure 1 shows the geographical
location of Singapore. Being located near the
equator, Singapore experiences tropical
climate with relatively stable temperature
throughout the year. The average temperatures
throughout the year are approximately be-
tween 24.7 to 31.1°C (NEA, 2007). Due to its
maritime exposure, Singapore climate is also
characterised by high humidity and abundant
rainfall. The mean annual humidity is 84.2%
and may reach 100% frequently during
periods of rain (NEA, 2007). Although rain
falls throughout the year, the wettest months
are usually starting from November to January
and the driest periods of the year are from
May to September.
1.1 Description of Singapore Rivers and
Singapore River with Its Background
History
Singapore is an island country with no natural
aquifers and lakes. Providing sustainable
water supply to meet daily’s water demand is
a need for the country. Stormwater harvesting
through local catchment of storage reservoirs
is considered one of the important methods in
Journal of Water Sustainability, Volume 1, Issue 3, December 2011, 313–322
© University of Technology Sydney & Xi’an University of Architecture and Technology
314 L. H. X. Daphne et al. / Journal of Water Sustainability 3 (2011) 313–322
providing clean water. At the moment, Singa-
pore uses two separate systems to collect
rainwater and reclaimed water. Rainwater is
collected through a network of drains, canals,
rivers and stormwater collection ponds before
it is channelled to the current 17 storage
reservoirs in the country. At the moment the
newly completed reservoir, the 15th
storage
reservoir, is called Marina Reservoir. It is
considered the largest and most urbanised
catchment with the total area of 10,000 ha.
The catchment area was designed to collect
surface waters from the major rivers of
Singapore River and Kallang River and also
Rochor Canal. It is expected to supply 10% of
Singapore’s current water needs (PUB, 2011a).
Overall, Singapore is considered one of the
few countries in the world to harvest urban
stormwater on a large scale for its water
supply.
In this study Singapore rivers refer to any
river in Singapore that are used to supply
water to storage reservoirs. They are named as
Jurong River, Ulu Pandan River, Singapore
River, Rochor River, Kallang River, Bedok
River, Loyang River, Changi River, Mandai
River and some other rivers which can be seen
in Figure 2. The most famous river in Singa-
pore, known as “Singapore River” or "The
River", spans 3.2 km from the sea to its upper
land site reaches in Kim Seng Road. Back in
the 1800s, many of the early immigrants made
their first settlement on the banks of Singa-
pore River. Some of them set up their busi-
nesses there and lived by the waterway. Over
the years, the economic opportunities attracted
more immigrants to settle in the surrounding
Singapore River. At the later date the Singa-
pore River became the focal point of a flour-
ishing trading port with subsidiary trading
areas emerging in Rochor and Kallang Rivers.
By 1880s, Singapore River became the heart
of trading and business activities. There was
heavy traffic on the river due to expanding
trade and rapid urbanization. As a result,
Singapore River became polluted by oil spills
from boats and the disposal of waste, sewage
and other by-products from industries located
along the river. By 1977, Singapore River was
filled with black water with foul odour. Since
then, many efforts were made for the devel-
opment of infrastructure, massive resettlement
of squatters, relocating industries, street
hawkers, pig and duck farms and phasing out
of pollutive activities. It took ten years of
operation before the cleanup of Singapore
River was completed. Today, Singapore River
is home to the Central Business District,
famous night spots and also a part of the first
urban reservoir in Singapore. Figure 3 shows
the collections of four photographs of Singa-
pore River’s views, which were taken in the
early 1970s and the recent year of 2010.
Figure 1 Geographical location of Singapore

L. H. X. Daphne et al. / Journal of Water Sustainability 3 (2011) 313–322 315
Figure 2 Location of river water sampling points around Singapore as dotted in the map
Figure 3 Photographs of Singapore River’s views which were taken in early 1970s (2 upper
photographs) and recent year of 2010 (2 bottom photographs)

316 L. H. X. Daphne et al. / Journal of Water Sustainability 3 (2011) 313–322
1.2 Water Demand And River Clean Up In
Singapore
Providing clean water to the populace has
always been a key issue for the government of
Singapore. Currently, Singapore supplies
water through the 4 national taps, with sources
from imported water, local catchment, desali-
nated water and reclaimed water, known as
NEWater. Since the early 1960s, Singapore
has been importing water from neighbouring
state of Johor, Malaysia based on two long
term agreements. With one contract already
expired in 2011 and the other will be expiring
in 2061, Singapore aims to become a water
self- sufficient country by increasing the water
security through continuous researches and
investments in water treatment infrastructures
and technologies. Achieving water self-
sufficiency cannot solely depend on water
supply management and an efficient water
demand management must also be run concur-
rently. The Public Utilities Board (PUB), a
statutory board under the Ministry of the
Environment and Water Resources, had hence
adopted a two-pronged approach to effective-
ly manage Singapore’s water demand through
the implementation of water conservation
measures and the management of effective
water networks.
In most countries, rivers have always been
an important source of water, food and energy.
However, due to continuous urbanization near
water sources, rivers faced increasing degra-
dation in water quality. One particular area of
urbanization would be construction works.
Construction works usually involve replace-
ment of top soils with impervious surfaces
which may disturb existing ground cover.
Much bare surfaces are being exposed causing
an increase in the amount of sediments dis-
charge especially during rain. Sediments
introduced in rivers can cause environmental
pollution and browning the rivers. This would
lead to the decrease in water quality, which is
generally reflected by an increase of particu-
late matter in river streams (Mulliss et al.,
1996; Webb and Walling, 1992). As a result,
many countries have begun to take notice of
this environmental hazard.
Back in 1977, Singapore started a ten years
of action plan to clean up two major rivers of
Singapore River and Kallang River. The plan
included the development of infrastructure
such as housing, industrial workshops and
backyard trades, re- sitting of street hawkers
to food centres and phasing out of pollutive
activities.
1.3 Meeting The Growing Construction
Industry And The Objective Of Riv-
er Study
In recent years, Singapore’s construction
demand had increased by 14% year-on-year
from $22.5 billion in 2009 to $25.7 billion in
2010 (BCA, 2011). In the year of 2011,
Singapore’s construction demand is projected
to reach between $22 billion and $28 billion,
with public sector projects covering about
55% of the overall construction demand (MTI,
2011). With more property developments such
as Gardens by the Bay being planned near
waterways, maintaining the quality of our
water could be a challenging issue.
Under the current regulation, Sewerage and
Drainage (Surface Water Drainage) Regula-
tion 4(1), Public Utilities Board (PUB, 2011b)
has set a maximum allowable limit of 50
mg/L of Total Suspended Solids (TSS) to be
discharged into the storm water drainage
system to tackle the issue on sediment dis-
charge. As an action, continuous water sam-
pling from storm water drainage to determine
the concentration of TSS is critical.
TSS concentration can be measured directly
or indirectly. Direct measurement in determin-
ing the concentration of TSS is commonly
L. H. X. Daphne et al. / Journal of Water Sustainability 3 (2011) 313–322 317
conducted by fast filtering a water sample.
The filtered water were then dried and
weighed following the two common standard
methods, namely the American Public Health
Association (1998) and American Society for
Testing and Materials (2000). However, both
of the APHA and ASTM standard methods
are time consuming and require large suspen-
sion volume, especially when the suspended
solids concentration is low (Sadar, 1998;
Ginting and Mamo, 2006). A common indi-
rect measurement of determining the concen-
tration of TSS would be the nephelometric
turbidity method. Turbidity is a commonly
used parameter to determine water quality and
is used to quantify water clarity. Turbidity can
be easily measured using turbidimeter and the
turbidity reading is simple and fast. The
nephelometric turbidity method of determin-
ing TSS concentration is based on the theory
that light scattering increases with the concen-
tration of particles (Sadar, 1998). Thus,
turbidity level has the potential to estimate the
concentration of TSS. However, turbidity is
also dependent on other factors such as the
size, shape, (Clifford et al. 1995; Gippel, 1988)
and colour (Malcolm, 1985) and reflectivity
of the particles (Bhargava and Mariam, 1991).
Hence, the correlation between turbidity and
TSS is unique in each location or situation at a
different time because equal concentrations of
TSS do not scatter the same amount of light
(Pavanelli and Pagliarani, 2002).
The objective of this study is to give a bet-
ter understanding on the general characteris-
tics of river water for young generations in
Singapore. This study would be concurrently
link to PUB’s ABC (Active, Beautiful, and
Clean) Water Programme in the current water
campaign (PUB, 2011a). While measuring
several TSS concentration and turbidity levels
in the same collection points of river streams,
the project was also studying whether the
correlation between TSS concentration and
turbidity level for the river streams can be
established. In a good and solid correlation
between the two water parameters, TSS
concentration and turbidity level, a TSS
concentration of a river water sample could be
easily estimated using its turbidity measure-
ment within a short time period.
2. MATERIALS AND METHODS
2.1 River Water Sampling
Fourteen river streams in Singapore were
randomly selected from January 2010 to July
2011. Figure 2 illustrates the random locations
of the river water collection. These sites were
specifically selected for sampling due to
ongoing construction activities along the river
streams. Points of river water collection are at
proximity of 50 to 100 metres downstream
from the construction sites’ discharge points.
Two sets of river water samples, “before and
after rain”, were drawn from each location at
mid-depth of flow using clean plastic water
bottles. Rain water samples “before rain”
mean river waters which were randomly
collected any time in any day during a dry
season. River water samples “after rain” mean
river waters which were randomly collected
after one rainy day throughout the year, at
approximately the same spotted location when
collecting the river water samples before rain.
A total of forty eight river water samples had
been collected for further laboratory test in
one or two days after river water collection.
2.2 TSS And Turbidity Measurement Of
River Water Samples
Turbidity was measured using Eutech TN-100
portable turbidimeter. The turbidity unit were
reported in Nephelometric Turbidity Units
(NTU), which is a measurement of the intensi-
ty of light being scattered when light is
transmitted through a water sample. All the
bottles containing river water samples were

318 L. H. X. Daphne et al. / Journal of Water Sustainability 3 (2011) 313–322
manually shaken thoroughly for a couple of
seconds to ensure uniform mixing. The river
water samples were poured in a vial glass and
immediately measured the turbidity level
using the calibrated turbidimeter. The proce-
dure was repeated for all the river water
samples.
The TSS concentration was determined
using a filtration method. Porcelain crucible
was oven dried at 103ºC to remove all the
water vapours. The mass of the porcelain
crucible plus a glass fibre filter with pore size
of 0.6 µm were weighed using 4 digits analyt-
ical balance. Series of the collected river
water sample of 25 mL were filtered through
the porcelain crucible with a glass fibre filter
with pore size of 0.6 µm using Gelman
Sciences vacuum filter pump. The filter tank
was washed thoroughly with deionised water
to ensure that the entire river water sample
was washed through the glass fibre filter. The
fibre filter of 0.6 µm was then dried in a
crucible in an oven at 103ºC for 60 minutes to
remove all the moisture. The dried filtrate in
porcelain crucibles was immediately placed in
a desiccator for 60 minutes to avoid water
vapours absorption from its surrounding
environment. The dried filtrate and crucible
were reweighed using 4 digits analytical
balance to measure the weight of the suspend-
ed solids. The TSS concentration was calcu-
lated by taking the difference between the
total mass of dried porcelain crucible, a fibre
filter and its filtrate and the empty dried
porcelain crucible and its fibre filter over the
volume of river water samples of 25 mL.
3. RESULTS AND DISCUSSION
The TSS concentration and turbidity level
were measured at the same collection point of
river showing a large variance for the two
parameters. The lowest and the highest TSS
measurements were measured approximately
at 0.6 and 3,752 mg/L respectively. The
lowest and the highest turbidity levels were
recorded approximately at 1.95 and 249.67
NTU respectively.
As an example, at Tampines River, the TSS
concentration of 0.6 mg/L and turbidity level
of 30.2 NTU during a dry season but the
figures were reduced down to 0.2 mg/L and
11.06 NTU respectively after a rainy day.
This might be occurred due to fast flushing of
stormwater in a short canalised river after
raining in reasonably new residential devel-
opment area. Whereas in an old river, such as
Kallang River, the TSS and turbidity figures
would be much higher due to the different
characteristics of the river streams and the
original used of a river.
The full data sets were plotted in Figure 4(a)
and analysed. As the TSS increases the
turbidity uncertainty also increases. Out of the
48 data sets, the result shows higher con-
sistency at an approximate maximum TSS
concentration of 50 mg/L as shown in Figure
4(b). However, this finding did not mean the
construction works were adhering to the 50
mg/L of TSS of the stated PUB discharge
limit. Rather, those were the measures of the
TSS levels in the river streams after dilution
by the river water. As aforementioned, the
selected data were then plotted in Figure 4(b).
Correlation between TSS concentration (in y-
axis) and turbidity level (in x-axis) of river
streams was established after applying a linear
regression model.
In general, the graph in Figure 4(a, b) show
that an increase in TSS concentrations affect-
ing in an increase in turbidity levels. Suspend-
ed solids have the ability to obstruct the
transmittance of light in a water sample, when
TSS concentration increases; light scattering
intensifies (Sadar, 1998). APHA defines
turbidity as the optical property of the water
sample that causes light to be scattered and
absorbed rather than being transmitted in
straight lines. The optical property expressed
as turbidity is affected by the interaction

L. H. X. Daphne et al. / Journal of Water Sustainability 3 (2011) 313–322 319
between light and suspended particles in water.
Therefore, turbidity could provide a good
estimate of the concentration of TSS in a
water sample even though turbidity is not a
direct measure of suspended particles in water.
Past studies had been conducted and consist-
ently showing a strong correlation between
TSS and turbidity (Gippel, 1995). For exam-
ple, in a research conducted by the University
of Washington, 13 river streams had been
sampled in the Puget Lowlands in Washington
State to determine the feasibility of using
turbidity to estimate TSS concentrations.
Regression analysis performed on turbidity
and TSS data, natural- log transformed,
resulted in a strong positive correlation with a
R2 of 0.96 (Packman et al., 1999).
There may be a case of obtaining a zero
value of turbidity number that paired up with
a certain TSS concentration from a river water
sample. At low TSS concentration this might
be due to a fine sand- size fraction in the river
samples which was quickly settles below the
zone monitored by turbidimeter (Holliday et
al., 2003). The fine sand- faction was trapped
together with other suspended solids during
filtration using 0.6 µm glass fibre filter when
measuring the TSS concentration.
Overall the plotted data in Figure 4(b)
shows a good positive correlation between
TSS concentration and turbidity level, with a
correlation coefficient of R2 of 0.7992. Hence,
measuring turbidity level in river water
samples has shown a potential cost- saving
option to estimate TSS concentration at an
approximate TSS concentration of 50 mg/L.
However, using turbidity measurement to
serve as a surrogate for TSS measurement was
not recommended. The main possible reason
was, in water sample containing suspended
solids, the light transmittance is depending on
the abovementioned factors such as surface
texture, size, shape (Clifford et al. 1995;
Gippel, 1988), colour (Malcolm, 1985) and
reflectivity of the particles (Bhargava and
Mariam, 1991).
0
50
100
150
200
250
300
350
400
450
0 50 100 150 200 250 300
TS
S (
mg/L
)
Turbidity (NTU)
y = 0.7992xR² = 0.809
0
10
20
30
40
50
60
70
80
90
0 20 40 60 80 100 120
TS
S (
mg/L
)
Turbidity (NTU)
(a) (b)
Figure 4 Correlation between Total Suspended Solids (TSS in mg/L) and Turbidity level (NTU)
from: (a- left) 48 river water samples and (b- right) selected river water samples at
lower TSS concentration range, which were collected from various river streams in
Singapore between Jan 2010 to July 2011.

320 L. H. X. Daphne et al. / Journal of Water Sustainability 3 (2011) 313–322
y = 1.7966x - 6.244
R² = 0.7073
0
100
200
300
400
500
600
700
800
0 50 100 150 200 250 300 350
TS
S c
on
cen
trat
ion
"af
ter
rain
" (m
g/L
)
TSS concentration "before rain" (mg/L) Figure 5 The correlation of TSS concentration in the event of “before rain” and “after rain” in
Singapore river streams
The occurrence of rain was expected to
change the river characteristics based on the
TSS and turbidity measurements in river
streams. Figure 5 shows the TSS concentra-
tions “before rain” and “after rain” in the river
streams. At a limited R2 = 0.7073 and an
approximate ratio of TSS concentration
“before rain” and “after rain” 1:1.8 , the result
might suggest that a raining event may even-
tually add more sediments in the river due to
some erosion of river sites that carried some
sediments from the upstream and increase the
TSS concentration in the downstream. In the
previous study it was reported that rainfall
could cause soil erosion upstream, bringing
loads of suspended solids into the rivers
(Bakar et al., 2007). The increased discharge
or flow rate caused by the storm would also
keep lighter materials in suspension than in a
stable flow in the river during a dry period.
The result was hardly confirmed with the
recorded turbidity data using the same river
water samples due to the poor relationship
between pairs of turbidity levels “before rain”
and “after rain”. The possible reasons could
be explained by several limitations when the
study was carried out. Firstly, the sample
timing was not consistent. Lag time from the
start of rainfall to the time of collection of our
water samples were not fixed. Limited data
collection from each river stream compared to
the large number of river streams available in
Singapore could result a lack of data accuracy.
In addition, large variance of river size,
rainfall intensity and unknown upstream site
characteristics might result the large variance
of TSS and turbidity measurement too.
CONCLUSIONS
The data collected from 14 river-streams
around Singapore shows a fairly good correla-
tion (R2 = 0.8) between Turbidity levels and
TSS concentrations at a maximum TSS
concentration of 50 mg/L. Although the
process of turbidity measurement is simpler
and faster than the process of TSS measure-
ment, more information is required to achieve
more uniform result. The occurrence of rain
may change the river characteristics based on
the TSS. It showed that the TSS records “after
rain” fairly increase approximately 1.8 times

L. H. X. Daphne et al. / Journal of Water Sustainability 3 (2011) 313–322 321
higher than TSS records “before rain” at the
river streams. Smaller scope of area of study,
more data collections and controlled time of
collection and analysis are required to better
establish the correlation between TSS and
turbidity in river streams. In case, a good
correlation between turbidity level and TSS
can be established, the relationship can
change spatially and temporarily due to
variations in sediment composition in river
streams. Overall the results suggest that the
measurement of turbidity levels have the
potential to replace the measurement of TSS
concentrations if the area of study is strictly
controlled.
ACKNOWLEDGEMENT
The authors would like to acknowledge
Singapore Polytechnic, School of Architecture
and The Built Environment for the school
funding for students and staff (Vote Number
01-23101-50-000 and Vote Number: 24101-
50). The authors would like to thank all the
student colleagues who were studying Water
Supply module in different cohorts of 2009-
2010, 2010- 2011 and 2011- 2012 for their
helps in collecting river water samples around
Singapore and carrying out the TSS measure-
ment and turbidity measurement.
REFERENCES
American Society for Testing and Materials
(ASTM). (2000). Standard test methods
for determining sediment concentration
values in water samples. D3977-97. Vol.
11.02. Water (II). ASTM, West Con-
shohocken, PA.
Bakar, S., Ismail, W.R., and Rahaman, Z.A.
(2007). Relationship in two small catch-
ments in Perlis, Malaysia. Malaysian
Journal of Civil Engineering, 19(2): 156-
169
Bhargava, D.S. and Mariam, D.W. (1991).
Light penetration depth, turbidity and re-
flectance related relationship and models,
Journal of Photogrametry and Remote
Sensing 46(4): 217- 230.
Building and Construction Authority (BCA)
(2011). Available at http://www.news.
gov.sg/public/sgpc/en/media_releases/age
ncies/bca/press_release/P-20110112-
1.html.
Clifford, N.J., Richards, K.S., Brown, R.A.
and Lane, S.N. (1995). Laboratory and
Field Assessment of an Infrared Turbidity
Probe and Its Response to Particle Size
and Variation in Suspended Sediment
Concentration. Hydrological Sciences.
40(6): 771-791.
Ginting, D., & Mamo, M. (2006). Measuring
runoff-suspended solids using an im-
proved turbidometer method. Journal of
Environmental Quality, 35(3), 815.
Gippel, C.J. (1988). The Effect of Water
Colour, Particle Size and Particle Com-
position on Stream Water Turbidity
Measurements. Department of Geography
and Oceanography, University College,
Australian Defense Force Academy.
Working Paper 1988/3.
Holliday, C.P., Rasmussen, T.C. and Miller,
W.P. (2003). Establishing the relation-
ship between turbidity and total suspend-
ed sediment concentration, Proceeding of
the 2003 Georgia Water Resources Con-
ference, 23- 24 April 2003, at The Uni-
versity of Georgia, Georgia.
Malcolm, R.L. (1985). Geochemistry of
Stream Fulvic and Humic Substances. In:
Humic Substances in Soil, Sediment, and
Water. Ed: Aiken, G.R., et.al. John Wiley
and Sons, Inc., NY. 181-209.
Ministry of Trade & Industry (MTI) (2011).
Economic Survey of Singapore 2010.
Singapore: Ministry of Trade & Industry.
NEA (National Environment Agency). (2007).
Guide To Singapore’s Weather.

322 L. H. X. Daphne et al. / Journal of Water Sustainability 3 (2011) 313–322
Singapore: National Environment Agency,
Meteorological Services.
Packman, J.J.; Comings, K.J., and Booth, D.B.
(1999). Using turbidity to determine total
suspended solids in urbanizing streams in
the Puget Lowlands: in Confronting Un-
certainty: Managing Change in Water Re-
sources and the Environment, Canadian
Water Resources Association annual
meeting, Vancouver, BC, 27–29 October
1999, p. 158–165.
Pavanelli, D. and A. Pagliarani. (2002).
Monitoring water flow, turbidity and sus-
pended sediment load, from an Apennine
catchment basin, Italy. Biosystems Engi-
neering. 83(4), 463-468.
PUB, Public Utilities Board of Singapore.
(2011a). Available at http://www.pub.
gov.sg/LongTermWaterPlans/wfalls.html.
PUB. Public Utilities Board of Singapore.
(2011b) Singapore. Sewerage and Drain-
age (Surface Water Drainage) Regula-
tions 2001 (c.4, r.1).
Sadar, MJ. (1998). Turbidity science. Tech-
nical Information SeriesBooklet no. 11.
Available at http://www.hach.com/fmmi
mghach?/CODE:L7061549|1 (Accessed 9
April 2011). Hach, Loveland, CO.


