

Cost Benefit Analysis of FoodWaste Processing in Massachusetts
The Harvard community has made thisarticle openly available. Please share howthis access benefits you. Your story matters
Citable link http://nrs.harvard.edu/urn-3:HUL.InstRepos:37945110
Terms of Use This article was downloaded from Harvard University’s DASHrepository, and is made available under the terms and conditionsapplicable to Other Posted Material, as set forth at http://nrs.harvard.edu/urn-3:HUL.InstRepos:dash.current.terms-of-use#LAA

A Cost-Benefit Analysis of Food Waste Processing in Massachusetts
Nicole Carol Kocher
A Thesis in the Field of Sustainability and Environmental Management
for the Degree of Master of Liberal Arts in Extension Studies
Harvard University
May 2018

Copyright 2018 Nicole Carol Kocher

Abstract
This thesis aims to compare food waste processing technologies to understand
which have higher socio-economic benefits. Each year, approximately 1.3 billion tons of
food produced for human consumption is wasted globally which puts stress on the
environment and undermines efforts to combat world hunger (van Otterdijk & Alexandre,
2011). As food waste diversion systems are being developed across the world, strong
food waste management planning should be evaluated to reduce its negative impacts and
optimize its benefits. In order to suggest sustainable ways of developing a food waste
management infrastructure, this study will compare the socio-economic costs and
benefits for leading commercial food waste processing technologies in Massachusetts.
Data were collected by surveying 10 of 30 windrow aerobic composting (AC)
facilities and four of five on-farm anaerobic digestion (AD) facilities. The data used
were collected through interviews, added from comparable studies to close gaps, and
calculated cost and benefit variables. By discounting these variables over a lifespan of 15
years, the net present value (NPV) was derived for each food waste processing
methodology. The analysis yielded a NPV of $10 per short ton of food waste for
windrow AC and -$12 for on-farm AD. A sensitivity analysis highlighted that the
driving factors for the NPVs are transportation, diesel price, and the tipping fees
(facility’s waste acceptance fee). AD is furthermore sensitive to electricity prices and the
cost of construction and equipment while the price of compost is a determining factor for
the feasibility of AC. Differences in tipping fees and distance to food waste generating

sources best explain the differences in the NPV between AC and AD in Massachusetts.
Since both variables are not necessarily linked to either food waste treatment
methodology, the gap in NPV is significantly closed. With variables like the
marketability of digestate and differences in opinions to the cost of carbon, it cannot be
inferred from the CBA results that one is in fact superior to the other. Because of the
difference in costs and benefits, as well as opportunities and limitations, the continued
support for the development of both technologies is best advised for optimizing food
waste diversion efforts.

v
Acknowledgements
I wish to express my appreciation and gratitude to the people who have
contributed to this project and remained supportive through the process. I am very
grateful for the patient and thoughtful guidance of my thesis director, Professor Gary
Adamkiewicz. Dr. Adamkiewicz’s professional insights and expertise guided the
development of my own critical thinking about the subject and strengthened my analysis.
I also would like to thank my research advisor, Professor Mark Leighton, who equipped
me with skills needed for this endeavor through his critical analysis and thesis writing
courses, as well as provided advice throughout the research process.
I am deeply grateful to my thesis buddy Juergen Zeitlberger for so willingly
offering his guidance and encouragement throughout the research and writing process.
His economic expertise was guidance for the approach I took to the cost-benefit analysis.
I would also like to thank other members of my thesis cohort, Irina Sidorenko and Nicole
Bahlmann, for the support and encouragement they provided me. Irina, along with
Jonathan Adams, Ellen Callaway, Marcus Hazelwood and Mara Altman are locals who
share a common interest in reducing solid waste in Massachusetts, to whom I am grateful
for their enthusiasm which drove and nurtured my personal interest and curiosity around
the subject and the potentials of a circular economy of food systems.
Thanks to John Fischer (MassDEP) for helping me gain a deep understanding of
food waste collection and processing in Massachusetts, which was key to the
development of my thesis proposal. Thanks also to Geoff Kuter for offering his industry

vi
expert review and input on my methodologies. I also thank Diane Corbin for
meticulously and expertly reviewing my thesis for grammatical errors.
There are too many to mention here, but I want to thank the Massachusetts’ AC
and AD operation managers and farmers, waste management managers, and food waste
program managers for granting me access to their data, as well as providing me with their
personal perspectives, advice and enthusiasm for this topic. In the developing industry of
food waste processing, the high participation rate to this study shows the honorable
commitment those involved have to its sustainable development.
Finally, I want to express my continued gratitude to my parents, family and
friends who have remained coaches and mentors throughout my years of study and
during the process of researching and writing this thesis. Their belief in my abilities
fortified my commitment to completing this project.

vii
Table of Contents
Acknowledgements ............................................................................................................. v
List of Tables ..................................................................................................................... ix
List of Figures ..................................................................................................................... x
I. Introduction ............................................................................................................. 1
Research Significance and Objectives .................................................................... 2
Background ............................................................................................................. 3
Approaches to Food Waste Management ................................................... 4
Case Study: Food Waste Processing in Massachusetts............................... 5
An Introduction to Food Waste............................................................................... 8
Food Waste Processing via AC and AD ..................................................... 9
Cost-Benefit Analysis ........................................................................................... 12
Cost-Benefit Analyses of Aerobic Composting ........................................ 13
Cost-Benefit Analyses of Anaerobic Digestion ........................................ 14
Climate and Energy Benefits .................................................................... 15
Research Questions, Hypotheses and Specific Aims ............................................ 18
Specific Aims ............................................................................................ 18
II. Methods................................................................................................................. 19
Data Handling ....................................................................................................... 19
Establishing Comparability between Datasets .......................................... 21
CBA Variables .......................................................................................... 22

viii
AC equipment and equipment maintenance costs ........................ 27
AD construction, capital, and operating costs .............................. 28
Land .............................................................................................. 29
Transportation ............................................................................... 29
Cost of employment ...................................................................... 30
Benefits of employment to society ............................................... 31
Tipping fee .................................................................................... 31
AC compost .................................................................................. 32
AD biogas and the production of electricity and heat ................... 32
AD digestate.................................................................................. 33
Peat and fertilizer savings in energy ............................................. 33
Climate benefits ............................................................................ 34
CBA & Sensitivity Analysis ................................................................................. 35
III. Results ................................................................................................................... 36
Cost-Benefit Analysis ........................................................................................... 36
Sensitivity Analysis .............................................................................................. 38
IV. Discussion ............................................................................................................. 41
Interpretation of Cost-Benefit Analysis ................................................................ 41
Interpretation of Sensitivity Analysis ................................................................... 45
Data Collection, Research Limitations and Caveats ............................................. 46
Additional Considerations Warranting Discussion ............................................... 49
Conclusions ....................................................................................................................... 50
References ......................................................................................................................... 52

ix
List of Tables
Table 1 General harmonization results for climate and energy impacts .......................... 16
Table 2 Ranking from harmonization and qualitative assessments of food waste
treatments. .......................................................................................................... 17
Table 3 Question catalogue for Massachusetts food waste processors surveys. ............. 21
Table 4 Overview costs and benefits ............................................................................... 23
Table 5 Social Cost of CO2, 2010-2050........................................................................... 34
Table 6 CBA results of aerobic composting .................................................................... 37
Table 7 CBA results of anaerobic digestion .................................................................... 37

x
List of Figures
Figure 1 U.S. states currently banning organics from landfill ........................................... 5
Figure 2 Food waste generation in Massachusetts per source ........................................... 6
Figure 3 Food waste generators in Massachusetts ............................................................. 7
Figure 4 Sites allowed to accept diverted food waste in Massachusetts............................ 7
Figure 5 Aerobic composting inputs and outputs .............................................................. 9
Figure 6 Anaerobic digestion inputs and outputs ............................................................ 10
Figure 7 Sensitivity analysis ranking ............................................................................... 39
Figure 8 Sensitivity analysis values across NPV ranges ................................................. 40
1
Chapter I
Introduction
Approximately one-third of all food produced for human consumption is wasted
globally (van Otterdijk & Alexandre, 2011). This is equivalent to about 1.3 billion tons
of food waste per year. Food that goes into landfills creates unnecessary greenhouse gas
emissions, both from its production and landfilling. It wastes the resources of its
production, and loses the economic value of the food produced for both the farmer and
the consumer.
Industrialized countries waste about 95-115 kg per consumer per year, which is
significantly more than in developing countries (van Otterdijk & Alexandre, 2011). With
the industrialization of developing countries, this issue is a global problem that will only
worsen with time. Food loss is an important issue in the world today in the efforts to
combat hunger, raise income and improve food security in the world’s poorest countries.
Ideally food waste is consumed within the food chain, but in places where this is not
feasible, strong food waste diversion planning should be understood in order to reduce
the environmental impacts and develop a sustainable infrastructure.
As more private and public entities are taking action to divert food waste from
their waste streams, an opportunity presents itself to develop this sector efficiently,
effectively, economically and sustainably. A thorough investigation into the costs and
benefits of different methodologies and infrastructures related to food waste diversion is
the first step in understanding how best to do this.
2
Research Significance and Objectives
The state of Massachusetts is a frontrunner when it comes to policies aimed at
reducing the burden of waste disposal. In 2014, it was the first state in the U.S. to ban
commercial food waste from landfilling. Any business or institution that disposes of one
ton or more of food waste per week must divert the food waste from disposal to either
composting, conversion, recycling or reuse (MassDEP, 2016). These types of early
regulatory pressure can be highly beneficial since it increases the potential to capture
more of the benefits, and to reduce costs and environmental impacts. In addition it has
the potential to nurture efficient infrastructure development that will effectively
sustainably reduce those long-term impacts. Yet, we need additional scientific analysis to
capture the full socio-economic potential of such policies; however, research on this
topic, especially that which compares the costs and benefits of the different food waste
processing methodologies, is still limited. As such, waste management developers lack
guidance and are left to their own devices.
My thesis aims to close this knowledge gap. I intend on conducting a
comparative study of two different food waste processing technologies that are
widespread in the State of Massachusetts.
My objectives are:
To compare the two primarily used food waste processing technologies in
Massachusetts to understand which has a higher socio-economic benefit
To perform a cost-benefit analysis for food waste processing technologies
that incorporates GHG accounting
3
To provide key decision makers with a methodology for the economic
assessment and selection of different food waste processing systems
Background
After a decade of prolonged decline in the number of malnourished people, world
hunger is on the rise again (FAO, IFAD, UNICEF, WFP & WHO, 2017). At the same
time, however, one-third of food produced is wasted, meaning that one-third of resources
are unnecessarily misused and degraded. In addition, the excess food production has a
substantial carbon footprint estimated around 3.3 Gtonnes of CO2 equivalence. In light
of an expanding world population, worsening effects from climate change, increased food
production and stronger competition for land use, such a practice portends a ton of
potential for conflict (FAO, 2015).
The best way to reduce food waste after avoidance is to donate or resell it, but
opportunities for consumption have limitations. The most effective way to mitigate the
effects of food produced but not eaten is to recycle it through composting and to use the
compost to bring nutrients back into the soil (FAO, 2015). In order to do that, the
developing food waste processing sector is already adapting techniques, most notably
aerobic composting (AC) and anaerobic digestion (AD). These techniques also introduce
opportunities to accommodate the processing of other organic waste streams like manure,
yard waste and wastewater sludge. A shared commonality is that both AC and AD allow
the turning of organic material, such as food waste, into a soil enrichment amendment
(FAO, 2015). Waste is thereby diverted from landfill, groundwater contamination is
mitigated, and air pollution and greenhouse gas emissions are reduced (Adhikari,
4
Barrington, Martinez, & King, 2008). Despite their similarities, they use different
approaches with a unique set of advantages and disadvantages.
Approaches to Food Waste Management
Food waste diversion can happen in many different ways. Initiating the collection
and processing of food waste can happen from the bottom up, through initiatives from
individual households or within organizations. They can also happen in top down
measures, like a legislative ban on its disposal. Major advances in food waste bans have
developed in recent years. In 2016, France was the first country in the world to ban
supermarkets from throwing away or destroying unsold food, forcing them instead to
donate it to charities and food banks (Chrisafis, 2016). Major efforts have also happened
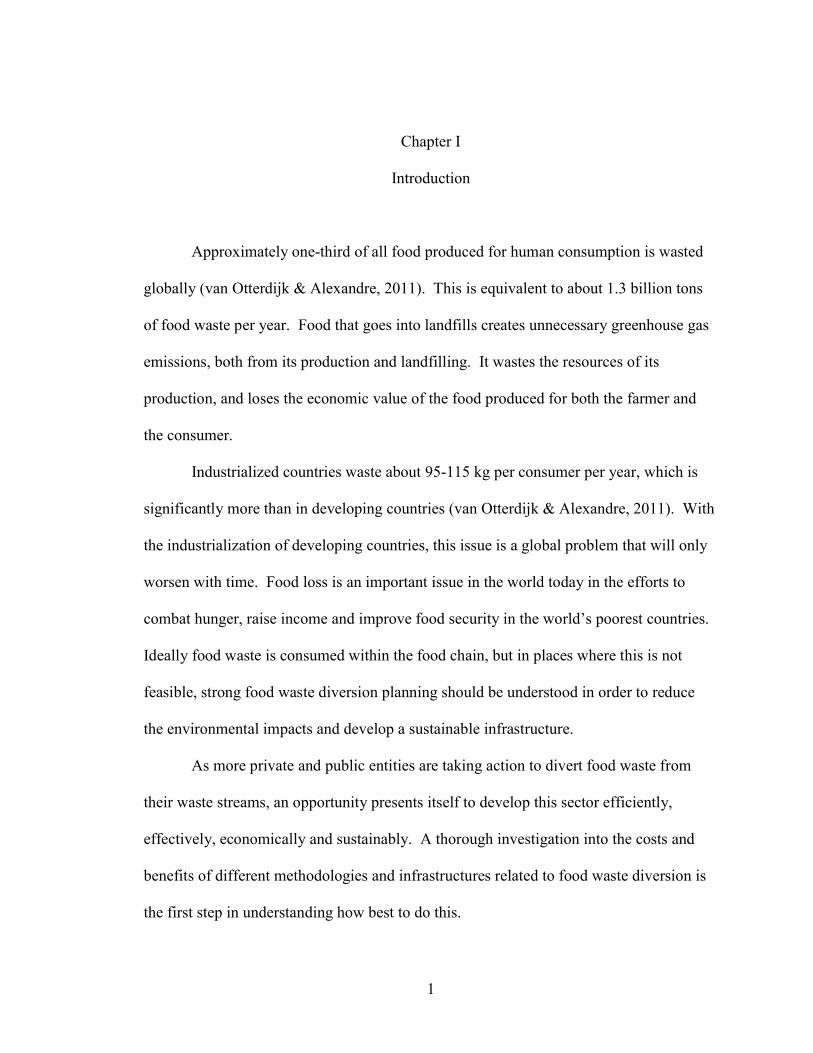
in the United States. Recently, five states in the U.S. have implemented state-level waste
bans, prohibiting certain entities from disposing of organics. Some states and localities
have implemented mandatory organic waste recycling laws, requiring certain producers
of organic waste to recycle the organics through specific methods, like composting.
Connecticut, Massachusetts, Rhode Island and Vermont structured their laws as organic
waste bans, while California instituted a waste recycling law requiring commercial
generators of organic wastes to either compost or conduct anaerobic digestion. Each state
has structural similarities, but differ in important details. These in turn have significant
impacts on the reach of these laws, and thus the amount of food waste diverted from
landfills. Areas of differences include types of generators covered, quantity thresholds,
and exemptions. By 2020, Vermont’s law will cover anyone who generates any amount
of food waste, while other states’ bans only include commercial producers. The amount

5
of food waste that qualifies a generator to be covered by the ban varies, with
Massachusetts having the most aggressive restriction of one ton or more of food waste
per week. Massachusetts is also the most aggressive in exemptions, as it is the only state
that does not provide any. Other states allow some exemptions, like the proximity of a
compost facility (Broad Lieb, Rice, & Mahoney, 2016).
Figure 1. U.S. states currently banning organics from landfill (Bailey, 2017).
Case Study: Food Waste Processing in Massachusetts
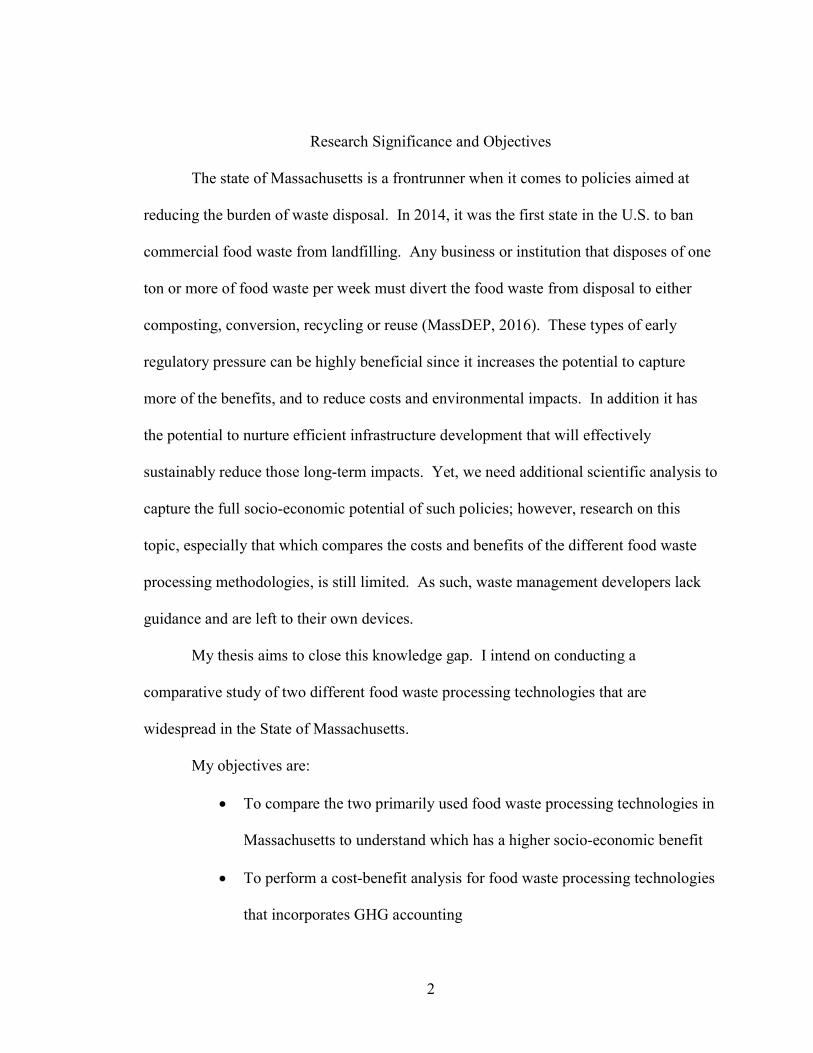
Food waste makes up roughly 25 percent of the total waste stream after recycling
in Massachusetts. This is equivalent to one million tons per year according to the
Massachusetts Department of Environmental Protection (MassDEP). The main food
waste generators are food and beverage producers followed by restaurants and
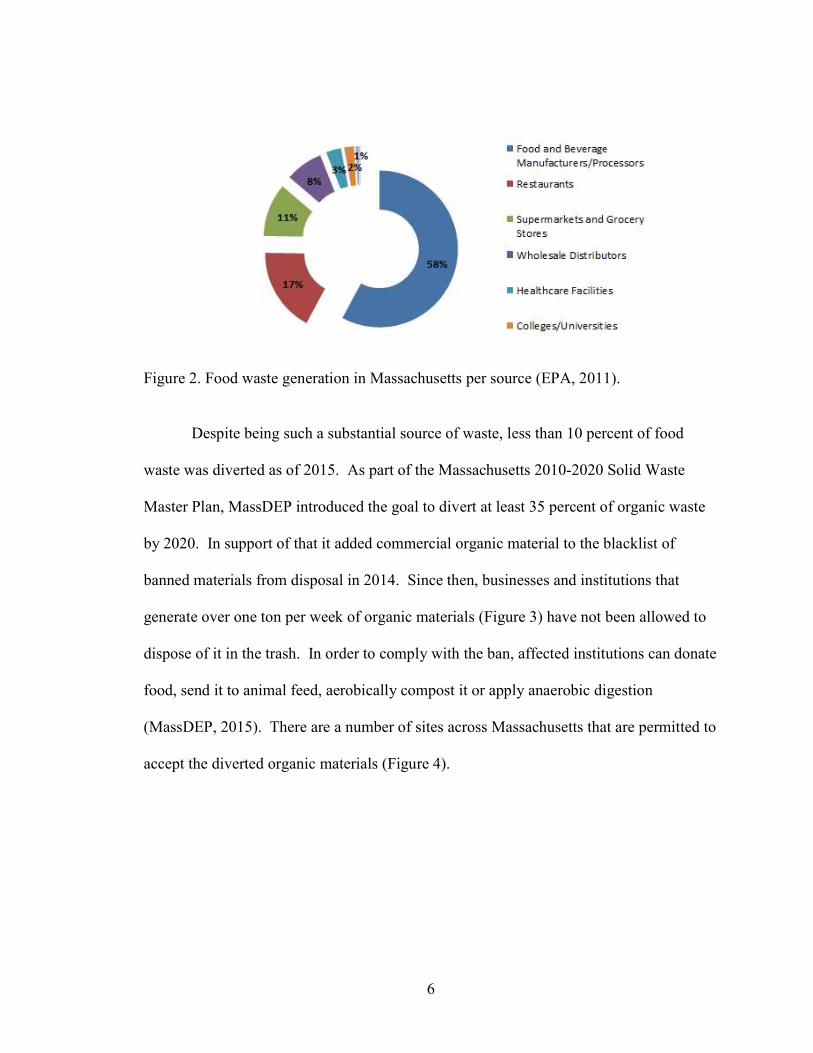
supermarkets (Figure 2).
6
Figure 2. Food waste generation in Massachusetts per source (EPA, 2011).
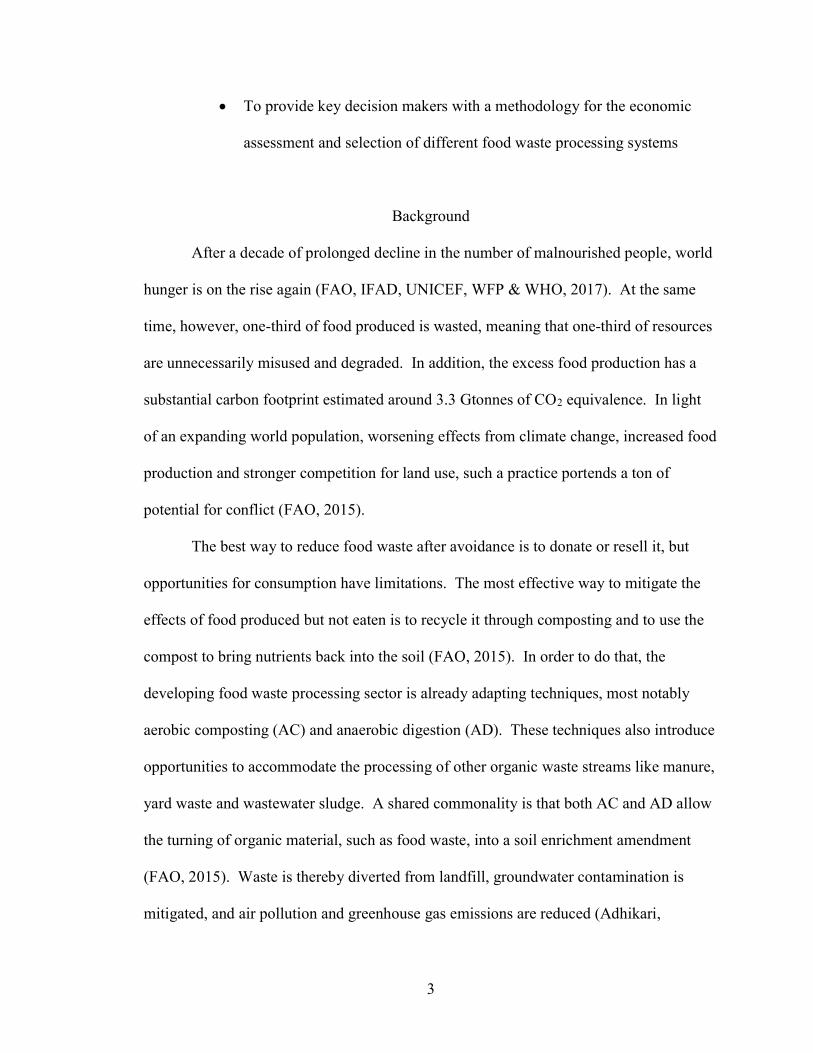
Despite being such a substantial source of waste, less than 10 percent of food
waste was diverted as of 2015. As part of the Massachusetts 2010-2020 Solid Waste
Master Plan, MassDEP introduced the goal to divert at least 35 percent of organic waste
by 2020. In support of that it added commercial organic material to the blacklist of
banned materials from disposal in 2014. Since then, businesses and institutions that
generate over one ton per week of organic materials (Figure 3) have not been allowed to
dispose of it in the trash. In order to comply with the ban, affected institutions can donate
food, send it to animal feed, aerobically compost it or apply anaerobic digestion
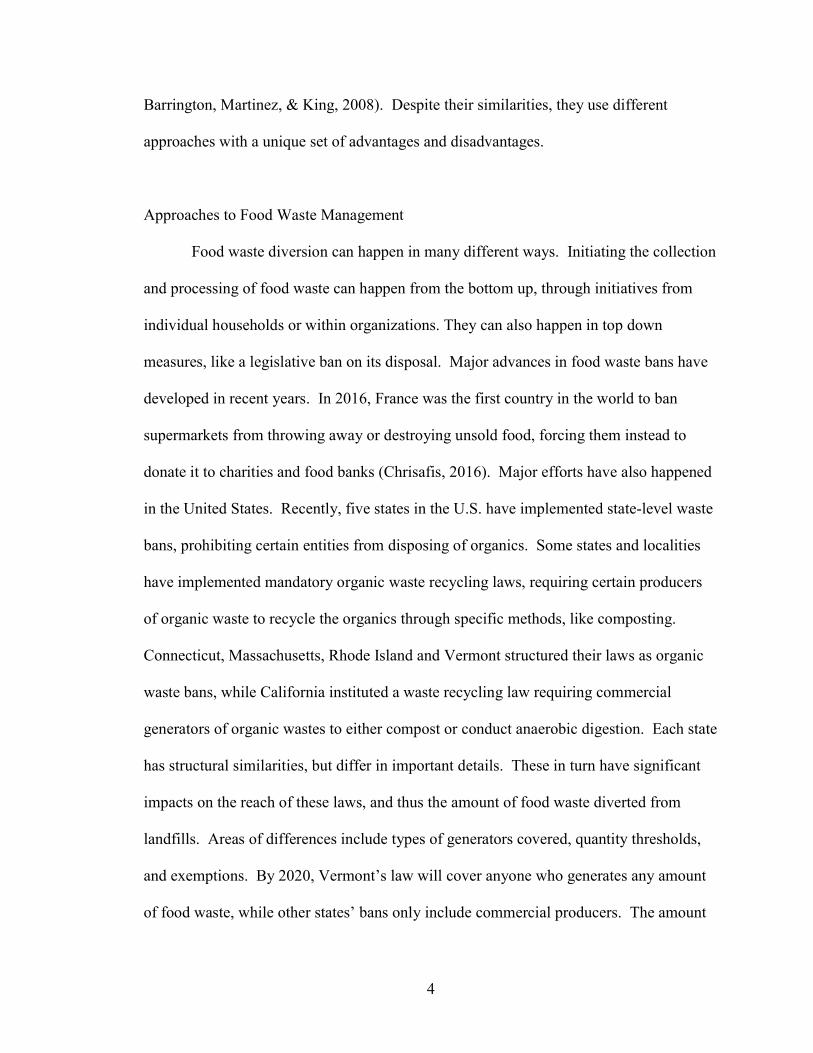
(MassDEP, 2015). There are a number of sites across Massachusetts that are permitted to
accept the diverted organic materials (Figure 4).

7
Figure 3. Food waste generators in Massachusetts (MassDEP, 2017).
Figure 4. Sites allowed to accept diverted food waste in Massachusetts (MassDEP, 2017).
8
My study was mainly concerned with the primary food waste processing
methodologies, aerobic composting (AC) and anaerobic digestion (AD). At the moment,
30 AC facilities and seven AD facilities are distributed across Massachusetts with a
combined capacity of at least 150,000 tons per year; however, meeting the 2020 diversion
requires more than doubling that capacity. MassDEP is determined to support the
development of the necessary AC and AD infrastructure (MassDEP, 2015). This will
drastically change the organic food waste landscape. ICF (2016) published a study for
MassDEP which confirms strong growth since implementation of the ban, creating jobs
and stepping up investments with more positive economic and ecological effects
envisioned to come. Yet, how much and in what form society and the environment will
benefit also depends on how food waste disposal capacity is created and which
technologies are applied. AC and AD are likely to have different socio-economic
impacts. By providing incentives for key stakeholders in food waste management, more
beneficial technologies may help to shape the industry in a way that make the most out of
this opportunity.
An Introduction to Food Waste
As outlined above, food waste represents a significant part of total waste. It is
unique among organic waste types because of its low carbon to nitrogen (C/N) ratio, high
nitrogen, oil and salt content, high organic-to-ash ratio and its loose physical structure
(Chang & Hsu, 2008; Kumar, Ou, & Lin, 2010). It is usually rich in starch, lignin,
cellulose and monosaccharides that are all easily degradable organic substances (Hedge,
Lodge, & Trabold, 2018).

9
Food Waste Processing via AC and AD
Aerobic composting (AC) and anaerobic digestion (AD) are both suitable tools to
divert food waste from landfills and to create nutrient rich compost. AC is the natural
process of decomposing organic matter in an aerobic environment (FAO, 2015). The
basic inputs to composting are organic matter, water and air while outputs are nutrient
rich compost, CO2 and the residuals that remain after screening (Figure 5).
Figure 5. Aerobic composting inputs and outputs (Kraemer & Gamble, 2014).
Compost is a fairly stable humus-like substance that can be used as organic
fertilizer, and to amend or enhance soil. The most important factors influencing food
waste composting are temperature, moisture content, aeration rate, C/N ratio, particle size
and nutrient content (Adhikari, Barrington, Martinez, & King, 2008). These factors
change frequently during the decomposition process and substantially influence the final
compost. C/N ratio, pH levels and aeration determine bacterial growth and gas
emissions. Moisture content affects the chemical and physical properties of the materials,
and temperature influences the pathogen reduction (Tiquia, 2010).
There are basically two approaches to AC, namely in-vessel systems and windrow
systems. The in-vessel system composts organic materials in a vessel, container or

10
building (Cekmeceloiglu, Demirci, Graves, & Davitt, 2005). It requires less space and is
thus more common in urban areas. The initial investment is higher as is energy
consumption. In addition, the organic material subject to composting has to be
pretreated.
Windrow systems are placed outdoors. The feedstock is laid out in long
windrows in lengths anywhere from 15 m to 115 m, and averages two meters in height
and five meters in width (Zhu-Barker, Bailey, Tha Paw U, Burger, & Horwath, 2017).
Front-loaders or windrow turners are used to mix piles for even composting of materials
and the introduction of oxygen. Windrow systems require more space and reach higher
temperatures.
Contrary to AC is AD, which takes place in an oxygen-deprived environment and
yields biogas. Inputs are feedstock like food waste, manure, yard waste and sewage,
energy and depending on the type of digester, water. Thermal energy is used to heat the
digestion tank and electricity for pumping. Outputs are the production of biogas that
typically exceeds the energy requirements of the digestion process, effluents and
digestate (Figure 6).
Figure 6. Anaerobic digestion inputs and outputs (Kraemer & Gamble, 2014).

11
AD is either tailored for low or high solid content. The technology used for the
former is called wet and the one for the latter is dry digestion. Low solid content refers to
solids representing between 3 percent and 10 percent, and high solid >= 15 percent of
total organic waste content. Solid waste is reduced to < 10 percent by adding water in
case wet digestion technology is used.
AD systems may also differ in terms of temperature. Mesophilic digesters use
temperatures in the range of 95°F to 105°F while thermophilic digesters operate between
125° and 140°F. Dry digestion is usually, but not necessarily, undertaken with
thermophilic digesters and wet digestion with mesophilic ones. The length of time
necessary to complete the degradation of food waste, also called residence time, is shorter
in the high temperature environment. Thermophilic technology also yields more biogas
for the same amount of organic waste and causes a substantially lower amount of
effluent. Nonetheless, mesophilic wet systems are the dominating technology in the U.S.
due to lower investment costs (National Renerable Energy Laboratory, 2013).
In Massachusetts, a common AD technology is wet on-farm digesters. These
help farmers manage nutrients, reduce odors, generate additional farm revenue, and often
accept outside food waste as a feedstock (US EPA, 2016). The biogas produced by the
AD system is often used to then generate electricity to fuel boilers or furnaces, or to
provide combined heat and power.

12
Cost-Benefit Analysis
It is easy to see that AD can gain major profits through biogas sales, or that it is a
major investment compared to that of an AC facility; however, the underlying logic of a
pure financial analysis of AC and AD investment and sales fails to capture the true
economic implications of the projects as a whole. Those that reap the lion’s share of the
profits might be better off, while the costs of a depleted common good such as climate
change, higher crop yields, or carbon sequestration of soil compost are borne by all. It is,
therefore, critical to extend the pure financial analysis of food waste processing systems
to include the value of less tangible services for informed decision-making.
Cost-Benefit Analysis (CBA) is an important socioeconomic valuation tool for
public investment decision making. It compares costs with benefits for the whole society
and only when the latter exceeds the former should the proposed action be undertaken.
Basically, benefits increase human well-being, while costs decrease it. Cost and benefits
will vary from one social group to another, which is why both need to be assessed for
each group separately and the numbers then aggregated. It might even be that benefit to
low-income or disadvantaged groups may receive a higher weighting than privileged
groups. Since the occurrence of costs and benefits can differ in timing, they are
discounted to present value so that figures become comparable (OECD, 2006).
CBA has been applied to AC and AD on several occasions. Depending on the
number of variables considered, a large range of net present values (NPV) has been
calculated. Many analyses only consider marketable values, such as compost or biogas
production, but lack full ecosystem services and regulatory functions (i.e. greenhouse gas
emissions, soil productivity).

13
Cost-Benefit Analyses of Aerobic Composting
Rynk et al. (1992) created an on-farm composting handbook in which economics
are thoroughly discussed. They report that at that time, compost can be sold from $10 to
$50 per cubic yard depending on its consistency, overall quality, promotion, packaging,
and associated services like bulk delivery. Agricultural composters can be large
commercial enterprises while others are small hobby farms. Some use much of the
compost on farm, while some market the compost as an agricultural product. Many use
existing on-farm technology to manage the compost piles, while others invest in
composting production equipment. AC farms can charge tipping (gate) fees and get
revenue from sales, but they can also have unexpected costs like legal fees and odor
control systems which can quickly eliminate the anticipated profits. Many farmers have
the potential to compost up to several thousand cubic yards of material each year without
significant added costs. Larger volumes require greater commitments of land, labor,
and/or capital investments.
Rynk et al. (1992) further explain that the cost of an AC operation depends on a
large number of variables that differ from farm to farm. Variables include the local costs
of labor and fuel, the value of land, and the cost of purchasing and maintaining
equipment. Several location factors can have strong influences on costs, including
proximity to neighbors and transportation. Large equipment can handle more material
and decrease processing time, taking initial costs from a few hundred dollars to hundreds
of thousands of dollars (Dreyfus, 1990; Gresham, Janke, & Moyer, 1990; Richard, 1990).
Rynk (2001) provides insight into the economics of on-farm composting via case

14
studies of seven on-farm composters located within or near the Pacific Northwest of
North America. Expenses that were looked at included business and site development,
feedstocks, equipment, labor, marketing and/or compost use, and management. Rynk
noted that savings on a farm can come from less costly manure handling, elimination or
reduction of handling and disposal costs for crop residues, benefits from fewer weed
seeds in compost rather than manure, and reduced pesticides and other costs for fly
control. In addition, intangible benefits that are difficult to put a value on, include
improved neighbor relations due to fewer odors and flies, improved animal health
resulting in lower veterinary costs and/or better productivity, a smaller risk of dispersing
pathogens and lower environmental impacts like runoff or leaching.
Rahmani, Hodges and Kiker (1999) conducted a CBA at four AC facilities in
Florida. Statistics were compiled on facility ownership, feedstocks used, parameters of
finished material, major customers, cost of making compost and income generated. Data
were obtained on the type of compost used, soils, application rates, crops, cost per ton of
compost, purchased transportation and spreading methods, effects on the yield, quality,
and changes in the fertilizer of the applied compost, impact of feedstock quality,
application rates, yield increases and fertilizer usage. The costs associated with applied
composting included compost cost, hauling cost, and cost of application. Benefits
associated with applied compost included yield increases, irrigation savings and savings
in fertilizers, pesticides and herbicides.
Cost-Benefit Analyses of Anaerobic Digestion
Duffy (2017) performed a CBA of AD of manure for a farm. The benefits that
15
were taken into consideration included the potential sale of either the biogas itself or the
use of biogas to generate electricity which could be sold back to the grid, the resale of
digested fiber as compost or liquid digestate as high-quality fertilizer, and the heat
generated by the system in the form of hot water circulated by a CHP system. Capital
costs considered included lift station pumps, mixing tanks, the digester tank itself, piping
for gas and hot water, gas pumps, flow meters, safety features, generators, electrical
wiring and controls as well as power transmission lines, design engineering, and onsite
buildings for generators, maintenance, operations, etc.
Navaratnasamy, Edeogu, & Papworth (2008) provided a high level, theoretical
approach to exploring the costs of AD. Datasets on the assumptions available in the
literature were presented on the ranges for total solids, volatile solids and biogas yield
(m3/tonne) and estimated total annual biomass production (tonnes) and energy potential
(PJ). With the calculation of total energy production, a methodology for calculating the
total capital costs was provided. Moser, Mattocks, Gettier, & Roos (1998) analyzed
seven agricultural AD systems. Variables that were considered for the calculation of the
annual benefits included electricity sales, digested fiber sales, reductions in propane use,
and hot water. Total benefits were as high as $55,400. The cost variables considered
included constructions cost of the digester system, and ranged from $125,000 to
$289,474.
Climate and Energy Benefits
Many have done assessments to calculate the climate and energy impacts of food
waste processing. Morris, Brown, Cotton and Matthew (2017) performed a

16
harmonization of life-cycle assessments (LCA) and a soil science ranking of food waste
management methods. Twenty-eight life cycle studies were used to harmonize methods
of estimating climate and energy impacts from food waste processing, and 80 scientific
soil productivity studies were assessed to rank each processing method’s soil benefits.
AC and AD were among the methods reviewed. It was determined that the harmonized
climate impacts per kg of food waste for AC was -0.10 kg of CO2e and -0.20 kg of CO2e
for AD (
Table 1). Harmonized energy impacts for AC was 1.14 MJ/kg and 0.27 MJ/kg for
AD. Qualitative rankings of AD and AC indicate AC is better for carbon storage and
water conservation, AD better for fertilizer replacement, and tie AC and AD are similar
for plant yield increase. To harmonize climate and energy impacts, all LCAs were
adjusted to use 2007 Intergovernmental Panel on Climate Change (IPCC) 100 year global
warming potentials, and to use the energetic value of electricity of 3.6MJ/kWh.
Table 1. General harmonization results for climate and energy impacts
(Morris, Brown, Cotton, & Matthew, 2017; State of Oregon Department of Environmental Quality (DEQ), 2014).

17
Morris, Brown, Cotton, and Matthew’s (2017) LCAs for harmonization of food
waste processing also estimated values for soil carbon storage, fertilizer displacement,
peat displacement, and electricity displacement impacts (Table 1). Soil carbon storage
occurs when stable soil carbon content increases following the application of AC
compost or AD digestate. Synthetic nitrogen (N) requires significant quantities of energy
to transform gaseous N to mineral N, and phosphate has to be processed from phosphate
rock into a form that is plant available. Displacement of peat in growth media and grid
electricity were additional variables that were harmonized for the carbon and energy
impacts of AC and AD.
Morris et al. (2017) also looked at qualitative studies that reviewed the climate
and energy impacts of AC vs. AD on plant and soil productivity. A qualitative approach
was taken because the response of the different amendment will be inherently variable
depending on soil type, cropping system and the characteristics of the amendments. AC
ranked higher than AD in soil carbon sequestration and water conservation, while AD
ranked higher in fertilizer replacement and yield increase (Table 2). Climate and energy
impacts of facility construction and equipment manufacturing were not included due to
the highly uncertain nature of the assessments and are typically found to be de minimus.
Also not included were the production of vehicles, roads or waste water conveyance
pipes.
Table 2. Ranking from harmonization and qualitative assessments of food waste treatments (Morris, Brown, Cotton, & Matthew, 2017).
18
Research Questions, Hypotheses and Specific Aims
The main objective of this thesis was to compare food waste processing
technologies to understand which have higher socio-economic benefits. This
comparative study would suggest sustainable ways for developing a food waste
management infrastructure. The main research question I investigated were: Which food
waste processing strategy has higher net benefits? I hypothesized that the net socio-
economic benefits of AC are higher than those associated with AD.
Another research question I examined is: Which variables drive the economics of
food waste processing methodologies the most? I hypothesized that transportation,
changes in output product prices (digestate, biogas and compost), and the social cost of
carbon would be the biggest drivers. In addition, I hypothesized that the driving variables
are the same for AC and AD.
Specific Aims
To accomplish this research, I:
1. Extracted data from the literature to estimate the economic costs and to identify
the cost and benefit variables
2. Interviewed AC and AD facilities in Massachusetts
3. Developed a CBA model for the NPV of the two methodologies
4. Analyzed the results
5. Performed a sensitivity analysis to highlight the driving factors for the NPV

19
Chapter II
Methods
I used interviews with key representatives of a large number of AC and AD
facilities in Massachusetts to produce comprehensive datasets on food waste management
in this state. Literature research helped to fill data gaps and verify collected data.
Detailed information on all aspects of windrow AC and on-farm AD were then used to
undertake a cost-benefit analysis comparing the two food waste processing approaches.
Finally, I carried out sensitivity analyses to gain an understanding about each variable’s
impact and about the robustness of the CBA results.
Data Handling
As the first state in the United States to ban food waste, I conducted my study in
the State of Massachusetts in the region of New England. To obtain an understanding of
the operational logistics of food waste processing in Massachusetts, I had meetings with
the Massachusetts Department of Environmental Protection (MassDEP) and other food
processing experts in Massachusetts. I also attended a Massachusetts based composting
conference and visited food waste processing facilities. From these meetings, I identified
the state’s primary food waste processing methodologies that would be the basis of this
study. The facilities possible for review for data on windrow composting were 30 AC
facilities, and five on-farm AD facilities. During the months of January and February,

20
2018, I called them all to solicit data on their facility. Facility managers were informed
that the data was for a CBA of food waste management in Massachusetts, and that their
facility would be kept confidential, which was a key request of many of the processors.
Finally, 10 windrow AC facilities and four on-farm AD facilities were willing to share
their data with me.
Survey questions were developed before the interviews to standardize the
approach. Some questions were derived from previous CBA in the literature that focused
on financial data of AC and AD facilities. The question catalogue was continuously
updated and extended as new facts were learned during the interviews. In some cases,
several rounds of discussions were necessary until the different datasets were
comprehensive and comparable. Data estimations were requested for an annual average,
and for only the AC or AD operations, as some facilities had additional operations.
Questions were raised to gain an understanding of the food waste processing
methodology used, the size of the facility, financial parameters and the facilities’ views
on broader food waste topics (Table 3).
Although the interviews yielded very comprehensive datasets, differences in the
data and the existence of data gaps made it essential to access literature as well. I used
peer reviewed journals and other information from trusted sources to check data for
plausibility. This was especially important for data points that varied strongly among
interview partners. In addition, not everyone was able to provide me with a full set of
answers. The resulting mosaic of very valuable data was extended by the third party
literature wherever needed to arrive at a complete table of variables that could be used for
the economic appraisal.

21
Table 3. Question catalogue for Massachusetts food waste processors surveys. General
What methodology of food waste processing do you use? What are the feedstock inputs to your operation? Please describe each step of your food waste process. Do you perform other operations in addition to food waste processing at your facility? How long has your facility been in operation?
Size
How much food waste goes into your process? What are the quantities of feedstocks inputs, or, what is the volumetric percentage of each input feedstock?
Upfront costs and immovable assets
Can you estimate your startup costs of entering this business? What were your construction costs? Did you have any preexisting infrastructure that supports your operations?
Movable assets and operating costs
Please list all equipment that supports your operation. For each piece of equipment please provide the make, model, age, price paid, estimated current price new, percent usage for the food waste operations, number of operating hours, number of labor hours, maintenance costs and fuel consumption.
Please estimate your annual equipment maintenance costs. How many labor hours are invested in the food waste operation each week? Can you think of other operating expenses you incur?
Benefits
What are your tipping fees? What products do you produce and how much do you sell them for? How much is sold externally and how much is applied to your own land?
Ancillary questions
What do you think are the biggest issues or opportunities with food waste management in MA?
What do you think are the intangible costs or benefits associated with food waste management?
What do you think can be done better to improve food waste management in MA?
Establishing Comparability between Datasets

22
Food waste processing facilities vary greatly in size. To make data comparable, I
needed to restate numbers from different facilities on a per short ton (2,000 lb, or 907.19
kg) of food waste basis. In addition, the amount of food waste processed per year was
reported in different units. I converted volumetric food waste estimates to weight-based
estimates by applying an EPA density estimation (US EPA, 2006).
Apart from facility size differences, there were also differences in how a facility is
run. Most facilities process waste other than food waste and/or run a farm partly using
the same equipment that is used for treating food waste. Where applicable, I adjusted
costs and benefits for their actual share in treating food waste (for example, if a front
loader is used only 20 percent of the time for composting and 80 percent for other farm
related work, only 20 percent of the front loader’s maintenance costs were considered).
The weight-based percentage of food waste was also applied to equipment costs,
equipment maintenance costs, land costs, employment payments, savings in
unemployment costs, and sales of finished compost or digestate. The weight-based
percentage of food waste was, however, not applied to transportation, tipping fees, or
climate and energy benefits of food waste processing, as these calculated values were
only associated with the food waste portion of the input feedstocks.
CBA Variables
The variables used for the economic appraisal include both actual costs and
benefits associated with setting up and running AC and AD facilities in Massachusetts.
The types of costs and benefits are similar for both food waste treatment methods with
differences stemming mainly from the output products and the necessity of having

23
buildings in place to run operations (Table 4). For comparability, all cost and benefit
variables were converted into dollars per short ton of food waste.
Table 4. Overview costs and benefits.
Aerobic Composting
Anaerobic Digestion
Costs Land ✓ ✓
Buildings ✓ Equipment and maintenance ✓ ✓
Operating costs including labor ✓ ✓ Transportation ✓ ✓
Benefits
Labor benefits to society ✓ ✓ Tipping fees ✓ ✓
Compost sales ✓ Electricity sales from biogas ✓
Digestate sales ✓
Heat production from biogas ✓
Energy from fertilizer replacement ✓ ✓ Energy from peat replacement ✓ ✓
Social cost of climate ✓ ✓
AC equipment and equipment maintenance costs. The type of machinery used in AC
depends on the composting system and on the quantity of organic waste treated at the
facility. All composting sites interviewed in Massachusetts were windrow composting
sites, which are also the simplest and cheapest form of composting. This system requires
machines that mix and turn windrows on a regular basis. This can be done with front-end
loaders, backhoe loaders, equipped tractors or windrow turning machines (RSS,
2017). Of the facilities surveyed, only a few AC facilities in Massachusetts use a

24
windrow turner or tractor while all AC facilities use front-end loaders. This is also
explained by the fact that farms often need front-end loaders for other activities on the
farm which means that no additional capital investments have to be made for composting
(Fabian, Richard , & Kay, 1993).
AC processors were asked to list each piece of equipment that supports their
composting operations. For each piece of AC equipment, data were collected on the
equipment type, make and model, age, purchase price, percent of usage dedicated to
composting operations, number of operating hours, number of associated labor hours,
maintenance costs, and fuel consumption. All ten AC facilities used at least one front-
end loader and most used a trommel screener. Research into the specifications of each
piece of equipment was performed online and data of significance, like a tractor’s
horsepower or a front-end loader’s bucket size, was collected. These details were
important in order to compare machinery across brands.
The respondents’ estimates of capital and maintenance costs of equipment varied
widely. In addition, many facilities do not track maintenance costs. Because of that, I
was not able to directly plug the answers into the CBA; however, knowing the type of
machinery made it possible to indirectly calculate equipment costs. The U.S. Army
Corps of Engineers (USACE) provides estimates for construction equipment ownership
and operating expense rates for the region of New England. Data from this resource
covers inter alia machinery used for food waste processing, such as front-end loaders,
tractors, excavators, and backhoes. USACE (2016) provides average hourly equipment
rates of equipment ownership and operation per type of machinery which I was able to
use for my analysis.

25
The ownership portion of the rate consists of an allowance for depreciation
(DEPR) and a facilities capital cost of monies (FCCM). For the DEPR rate, a straight
line method is used and calculated by dividing the depreciable value by the expected
economic life of the unit of equipment in hours. The FCCM rate is computed by
multiplying a discounted cost of money rate by the average value of equipment and
prorating the result over the annual operating hours. The operating portion of the rates of
equipment include fuel (FUEL), filters, oil, grease (FOG), repairs (REPAIRS), tire wear
(TIRE WEAR) and tire repair (TIRE REPAIR). The total equipment value (TEV) and
the economic life (LIFE) of each piece of equipment is also provided by
USACE. Equipment that was not listed in the USACE resource are grinders, manure
spreaders, trommel screeners, trucks and windrow turners.
For each reported piece of equipment, reported equipment data were entered into
an AC equipment calculation spreadsheet, and where available, USACE equipment rates
for DEPR, FCCM, FUEL, FOG, REPAIRS, TIRE WEAR and TIRE REPAIR, as well as,
the USACE values for TEV and LIFE. To integrate USACE rates into the CBA, several
adjustments were made. First, rates were adjusted from 2013 values to a 2017 value, by
applying inflation rates as reported by The World Bank (2018). Second, the diesel fuel
rates were adjusted for 2017 fuel rates in Massachusetts. The average price for one
gallon of diesel in Massachusetts in 2017 was $2.573 including taxes (Commonwealth of
Massachusetts, 2017). Facilities reported current diesel fuel costs between $2.75 and
$3.00 per gallon which match the diesel rates for 2018 as reported by the Commonwealth
of Massachusetts. As data was collected for historical costs, FUEL was adjusted to the
2017 Massachusetts average diesel fuel price of $2.573.

26
In the AC equipment calculations spreadsheet, annual equipment costs and
operating costs were calculated for each reported piece of equipment. Facilities will buy
equipment that is new or used. For standardization, the cost of each piece of equipment
when it was new was calculated. The annual equipment costs were estimated in two
ways. As shown in Equation 1, they were first calculated with the processors’ estimated
cost of their equipment if purchased new and then calculated as in Equation 2 using the
USACE DEPR rate. These numbers were compared for similarity, and it was observed
that the reported costs closely matched the USACE calculation of equipment costs. To
better represent the state of Massachusetts, the calculation of the reported estimations of
equipment costs new was input into the CBA model. If this was not available, the
USACE estimation was then used. The economic life was estimated as reported in the
USACE resource. Where data were not available, the estimate by Bennet & Ward (2010)
was used, that farm equipment and machinery has an asset recovery period of ten years.
𝐸𝑄𝑈𝐼𝑃𝑀𝐸𝑁𝑇 = ×
( ) (1)
Where: VALUENEW is the reported new cost estimate of a piece of equipment USAGECOMPOST is the annual usage hours for composting operations LIFE is the economic life HOURSCOMPOST is the reported number of hours the equipment was used for composting operations
𝐸𝑄𝑈𝐼𝑃𝑀𝐸𝑁𝑇 = 𝐷𝐸𝑃𝑅 × 𝐻𝑂𝑈𝑅𝑆 (2) Where:,
DEPR is the allowance for depreciation HOURSCOMPOST is the reported number of hours the equipment was used for composting operations
27
Annual operating costs were similarly estimated two ways using the AD or AC
processor’s reported data and calculations from USACE estimations (Equation 3). The
reported operating costs were extremely variable as they were dependent on the age of
the equipment and the variance in repairs year-to-year. To reduce variability, fill data
gaps and stay consistent with the straight line method of depreciation calculations, the
USACE estimations were used to estimate annual operational costs for front-end loaders,
tractors, backhoes, and excavators. For equipment not included in the USACE resource,
the reported annual maintenance cost (Equation 3) was used. Annual fuel consumption
was calculated for both the reported consumption and the USACE estimated consumption
to gain insight into the reliability of the maintenance calculations. The observed
comparison of the values showed both strong correlations and variation. If any data
needed for the aforementioned calculations was not reported or available through
USACE estimates, the costs reported by another facility were then used.
𝑀𝐴𝐼𝑁𝑇𝐸𝑁𝐴𝑁𝐶𝐸 = (𝐹𝑈𝐸𝐿 + 𝐹𝑂𝐺 + 𝑇𝐼𝑅𝐸 𝑊𝐸𝐴𝑅 + 𝑇𝐼𝑅𝐸 𝑅𝐸𝑃𝐴𝐼𝑅 +
𝑅𝐸𝑃𝐴𝐼𝑅) × 𝐻𝑂𝑈𝑅𝑆 (3) Where:
FUEL is the hourly fuel rate FOG is the hourly filters, oil, grease rate REPAIRS is the hourly repair rate TIRE WEAR is the hourly tire wear rate TIRE REPAIR is the hourly tire repair rate HOURSCOMPOST is the reported number of hours the equipment was used for composting operations
AC equipment and equipment maintenance costs. AC processors were also requested to
describe any construction work that was needed to support their operations and to provide

28
estimations of the costs. Investments in construction were variable. Most processors did
not use any infrastructure to house their equipment. A few facilities made initial
investments in excavating, grading and laying down stone at their composting
facility. One facility built an office while another used existing infrastructure for an
office. A few facilities made investments in odor control techniques like a leachate
lagoon, a grinder for the preprocessing of food waste, and a compost pile treatment and
perimeter vapor system. In general, buildings are not a crucial component of a windrow
composting facility. As such, AC construction costs were not included in the CBA.
AD construction, capital, and operating costs. Contrary to AC, AD takes place in-doors
and construction expenses are a considerable cost factor. AD processors were asked to
provide estimates of their construction or capital costs, and their annual maintenance
costs. Construction costs and any upgrades were provided, for which a ten year lifespan
was assumed (USDA, 2007). The World Bank (2018) inflation rates were applied,
adjusting costs from the year of initial construction. Maintenance costs provided by the
processors was entered into the CBA model. If maintenance costs were not provided,
three percent of the total capital costs was then estimated as the cost of maintenance as
recommended by USDA (2007) for AD. Operating costs are mainly labor costs and
electricity consumption. Labor costs are discussed later but other operating costs
incurred were mostly due to the consumption of energy to keep the digesters running. It
was not possible to get detailed figures on the energy consumption of AD processing
from my interview partners, so I used third party literature (i.e. Morris et. al., 2016) to fill
this data gap.

29
Land. The number of acres used for the processing operations was solicited from the
processors. AD facility owners reported their rental costs, which were entered into the
model. In AC operations, most land was already owned and the land value was not
known. To estimate the value of the compost land, a study on the cost of renting
agricultural land for biomass production in Massachusetts was used (Timmons, 2014). A
geographic information system model identified a landowner population. A contingent
valuation survey revealed that landowners were willing to accept a median payment of
$321 per hectare for growing biomass crops. To estimate the annual cost of food waste
processing land for AC sites, I multiplied the total number of acres by the adjusted land
rate of $792.87 per acre.
Transportation. These expenses reflect the costs of transporting food waste to the
facilities. For all food waste generators (Figure 3), for which the Massachusetts food
waste ban applies, location coordinates are provided by the MassDEP (Mass DEP,
2011). The average of all coordinates was calculated to find the average location of the
food waste generation in Massachusetts. The coordinates of this average location of all
Massachusetts food waste generators was calculated as 42.253, -71.303. The distance
from this location to each processor’s facility considered in this study was then calculated
using google maps. A 3:00 AM EST departure time was used to eliminate any variability
from traffic. Waste management companies in Massachusetts were called to get their
estimated cost associated with the transportation of food waste. One waste management
company estimated that a round trip delivery of food waste from their facility to a

30
processor facility costs $0.50 per ton of food waste for every mile travelled. To get the
cost associated with the transportation to each processor’s facility, the distance was
multiplied by the transportation cost factor.
Cost of employment. I have interviewed AC and AD facility owners to gather
information on labor intensity and costs. In addition, I used third party material to verify
the numbers. AC requires workers to operate machines, such as front loaders and
tractors. Estimations of labor hours for operating machinery are typically 10-20% longer
than the field time because of travel and the time required to lubricate and service
machines (Edwards, 2015). Machinery operation hours were multiplied by 1.15 to
calculate the labor hours associated with each reported piece of equipment. For
equipment that was reported as not needing any operation other than maintenance and
setup, like a trommel screener or a manure spreader, the multiplier was 0.15 in
calculating the associated labor hours. On-farm AD requires workers to operate the
digester. The number of labor hours needed to support the operation of the on-farm AD
systems was provided by the AD processors. Where information on the engineering
support group for AD was not provided, an estimate of 15% additional labor hours was
similarly applied to the total operating labor hours.
According to the United States Department of Labor (2016), operators of such
machinery make on average $14.60 per hour (United States Department of Labor,
2016). This value was in line with the estimates of interviewees from both AC and AD
facilities. To calculate the annual value of employment, the reported working hours were

31
multiplied by the estimated cost of labor for machinery operations from the United States
Department of Labor.
Benefits of employment to society. While employment is a financial cost for AC and AD
operators, it is a benefit to society. Employees pay income tax to the government and use
their salary/wages to buy products and services, thereby paying value-added taxes and
increasing corporate taxes paid by companies. In turn, increased unemployment rates
increases government spending on unemployment benefits. This may also require the
government to borrow money, on which it pays interest. Studies suggest that the costs of
one unemployed person may add up to as much as $100,000 per year (Masur & Posner,
2012). The labor intensiveness between AC and AD is indeed different. With AC,
workers have to operate machines to frequently turn the compost, while AD plants are
mostly operated automatically with one person supervising. Labor hours, in full year
equivalents, were multiplied by $100,000 per person and added into the CBA as a
benefit.
Tipping fee. Information on tipping (or gate) fees were collected from each
facility. Some facilities charged different tipping fees depending on the frequency of the
deliveries and the type of organic material being delivered. Some facilities did not have
revenues from a tipping fee because they had their own food waste transportation
operation or are a new facility that has not yet begun to collect food waste. Revenues
from tipping fees were added to the CBA as a benefit.
32
AC compost. Each facility was asked what input feedstocks made up their compost, and
their correlating volumetric percentage. The EPA density value for each feedstock was
applied to calculate the percentages of each feedstock by weight. Each facility was also
asked how much compost they produced each year and what their average selling price
was. The compost produced was either sold or applied to fields owned by the
processors. Independent of whether the compost was sold or applied to land, the selling
price of the compost was multiplied by the total compost produced and applied to the
CBA as a benefit.
AD biogas and the production of electricity and heat. Production of biogas from
Massachusetts AD facilities is used to generate electricity and heat. Electricity is sold to
the grid, and heat is generated and provided back to the farm at no cost. The amount of
electricity produced at each facility surveyed was collected, as well as the current selling
price of the electricity. The estimated selling price of electricity matched the 2018 values
as reported by the US Energy Information Administration (2018). Revenues from
electricity production were added into the CBA model using a Massachusetts 2017 value
of $0.15/kWh (US Energy Information Administration, 2018). In addition to the
revenues from the selling price of the biogas, carbon credits were purchased for the use of
biogas, providing additional revenues. Heat costs were estimated using source data. One
of the AD facility owners reported that their facility was saving the farmer between
$25,000 and $30,000 a year on heat costs. Farmers of on-farm AD facilities were also
asked for the solicitation of this data. One of the farmers estimated that they had an

33
annual heat cost saving between $25,000 and $35,000 a year. An average of these
estimates was applied to all the farms from which I was not able to obtain source data.
AD digestate. The quantity of liquid digestate produced from AD was calculated using
information provided by the facility. Through this process, one facility reported that the
feedstock quantity was reduced by 10% as a result of the biogas production. The quantity
of the digestate was calculated at 90% of the feedstock. One farmer, who has an AD
facility on his farm, reporting selling a tank of 5,000 gallons for $100 to $120, not
including the cost of transportation fuel. This is equivalent to $0.02 per gallon of
digestate. Dr. Ruihong Zhang, a professor of Biological and Agricultural Engineering at
the University of California Davis, mentions that digestate has been sold to farms and
agricultural material facilities at a cost of $0.10 per gallon (Zhang, 2017). However, the
source-provided estimate price of $0.02 per gallon of digestate was applied to all AD
facilities in the CBA.
Peat and fertilizer savings in energy. Morris, Brown, Cotton, & Matthew (2017) provide
rates for the energy savings from peat and fertilizer production of compost and digestate.
Synthetic nitrogen (N) requires significant quantities of energy to transform gaseous N to
mineral N, and phosphate has to be processed from phosphate rock into a form that is
plant available. Benefits from the displacement of peat in growth media and grid
electricity were added into the CBA. These energy rates were converted for an energetic
value of electricity of 3.6MJ/kWh.

34
Climate benefits. Mapping the impact on climate of all food waste management
processes would go beyond this thesis and requires different tools, such as life-cycle
assessments (LCA). Nonetheless, CO2 and methane generation may very well be
significant variables and leaving them out entirely might distort the final result. As such,
I opted to access literature to find estimates on the carbon footprint of AC and AD. The
analysis of 28 LCAs by Morris, Brown, Cotton, & Matthew (2017) calculated the release
of CO2e for each methodology per kg of food waste. This number considers greenhouse
gases generated while transporting food waste and processing it, but also takes into
account the CO2e savings from carbon sequestration and producing renewable energy,
peat and organic fertilizers. I converted this number to the unit of short ton of food waste
and added it to the CBA by multiplying the CO2e savings by a factor for the social cost
of carbon. The USEPA and other governmental agencies use estimates of the social cost
of greenhouse gases to value the climate impacts of rulemakings. The social cost of
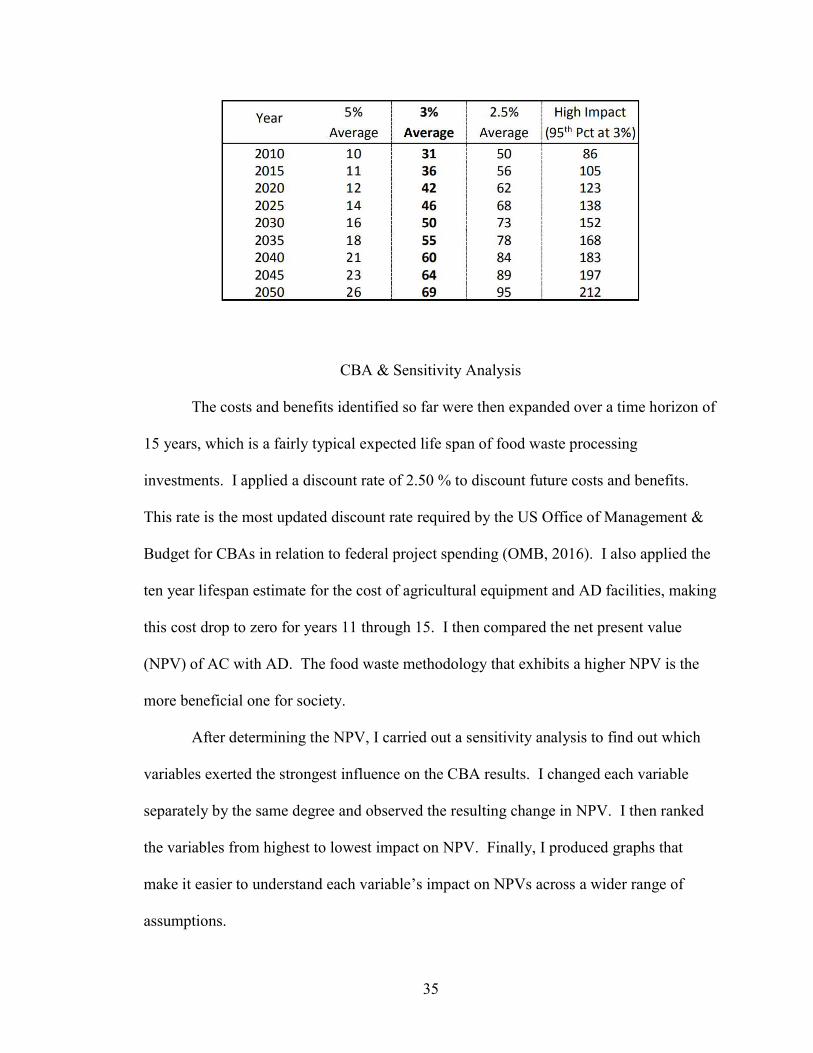
carbon is meant to be a comprehensive estimate of climate change damages and includes
changes in net agricultural productivity, human health, property damages from increased
flood risk, and changes in energy system costs, such as reduced costs for heating and
increased costs for air conditioning. Table 5 shows the summary of their findings. At a
recommended discount rate of 3%, the 2017 social cost of CO2e is $38.40 (US EPA,
2018).
Table 5. Social Cost of CO2, 2010-2050 (in 2007 dollars per metric ton of CO2e)
(US EPA, 2018).
35
CBA & Sensitivity Analysis
The costs and benefits identified so far were then expanded over a time horizon of
15 years, which is a fairly typical expected life span of food waste processing
investments. I applied a discount rate of 2.50 % to discount future costs and benefits.
This rate is the most updated discount rate required by the US Office of Management &
Budget for CBAs in relation to federal project spending (OMB, 2016). I also applied the
ten year lifespan estimate for the cost of agricultural equipment and AD facilities, making
this cost drop to zero for years 11 through 15. I then compared the net present value
(NPV) of AC with AD. The food waste methodology that exhibits a higher NPV is the
more beneficial one for society.
After determining the NPV, I carried out a sensitivity analysis to find out which
variables exerted the strongest influence on the CBA results. I changed each variable
separately by the same degree and observed the resulting change in NPV. I then ranked
the variables from highest to lowest impact on NPV. Finally, I produced graphs that
make it easier to understand each variable’s impact on NPVs across a wider range of
assumptions.

36
Chapter III
Results
A Cost-Benefit Analysis (CBA) was used to compare the economics of AC and
AD to the society in Massachusetts. With the help of a sensitivity analyses, I identified
the driving variables of the model.
Cost-Benefit Analysis
Discounting costs and benefits of AC over a lifespan of 15 years produced a
positive net present value of $10 per short ton of food waste. The biggest benefit
generators are revenues from tipping fees ($18) followed by the selling of compost ($12).
In addition, AC generates tangible benefits to a society by creating jobs ($10). This
avoids direct costs like unemployment payments, but also supports the economy since
employed people typically consume more. The biggest cost factor, by far, is the
transportation of food waste to the AC operators ($23 per short ton of food waste).
Discounted expenditures related to running AC equipment, such as front-end loaders,
amount to $4, while salaries equal $3 per short ton of food waste. Since compost
effectively avoids the need to produce fertilizers elsewhere, benefits are generated for
forgone energy consumption and CO2e release, as well (Table 6).
The NPV for AD is negative and sums up to -$12 per short ton of food waste. For
AD, the biggest cost driver is the transportation of food waste to the facilities ($33). In
Massachusetts, on-farm AD facilities are generally farther away from food waste sources,

37
Table 6. CBA results of aerobic composting.
which increased transportation costs by $10 compared to AC facilities. Unlike AC, AD
is affected by substantial cost drivers, such as construction costs and the energy needed to
run the digesters. The biggest benefit generators for AD are electricity sales from biogas
production ($19) and tipping fees ($12), even though AD facilities seem to collect lower
fees (-$6) than their AC peers. Since AD facilities are more automated and require less
manpower, the benefits to society of creating jobs is also smaller (Table 7).
Table 7. CBA results of anaerobic digestion.
38
Sensitivity Analysis
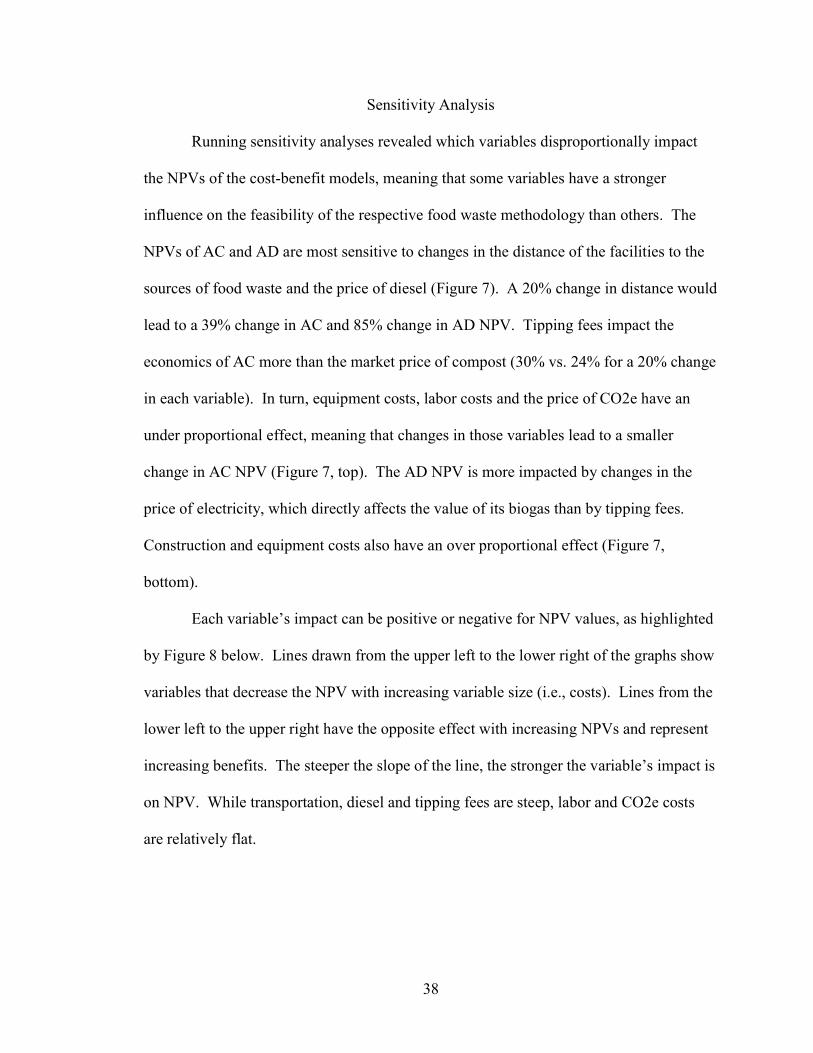
Running sensitivity analyses revealed which variables disproportionally impact
the NPVs of the cost-benefit models, meaning that some variables have a stronger
influence on the feasibility of the respective food waste methodology than others. The
NPVs of AC and AD are most sensitive to changes in the distance of the facilities to the
sources of food waste and the price of diesel (Figure 7). A 20% change in distance would
lead to a 39% change in AC and 85% change in AD NPV. Tipping fees impact the
economics of AC more than the market price of compost (30% vs. 24% for a 20% change
in each variable). In turn, equipment costs, labor costs and the price of CO2e have an
under proportional effect, meaning that changes in those variables lead to a smaller
change in AC NPV (Figure 7, top). The AD NPV is more impacted by changes in the
price of electricity, which directly affects the value of its biogas than by tipping fees.
Construction and equipment costs also have an over proportional effect (Figure 7,
bottom).
Each variable’s impact can be positive or negative for NPV values, as highlighted
by Figure 8 below. Lines drawn from the upper left to the lower right of the graphs show
variables that decrease the NPV with increasing variable size (i.e., costs). Lines from the
lower left to the upper right have the opposite effect with increasing NPVs and represent
increasing benefits. The steeper the slope of the line, the stronger the variable’s impact is
on NPV. While transportation, diesel and tipping fees are steep, labor and CO2e costs
are relatively flat.

39
Figure 7. Sensitivity analysis ranking. Top (aerobic composting). Bottom (anaerobic digestion).

40
Figure 8. Sensitivity analysis values across NPV ranges. Top (aerobic composting). Bottom (anaerobic digestion).

41
Chapter IV
Discussion
Model outputs and sensitivities highlight the significance that food waste
processing methodologies and variables have for providing ecosystem services. This
valuation of food waste processing is not meant to be comprehensive but to elucidate the
net benefits of its variables. A review of the results of the CBA of food waste processing
variables will provide this insight.
Interpretation of Cost-Benefit Analysis
My primary hypothesis was that the net socio-economic benefits of AC are higher
than those associated with AD. The results suggest that AC would have higher net socio-
economic benefits than AD by $22 per ton of food waste, thereby supporting this
hypothesis. The major contributing factors to these results were construction and
equipment, transportation, tipping fees, employment and the revenues from biogas and
compost. Equipment costs are fairly set for AD, but the costs for AC would probably be
even lower than the estimates made herein, as many facilities buy used equipment and
even do their own maintenance to keep these costs down. The revenues from AD and
AC are set by market demands. Changes in these demands can be influenced by
marketing, and a CBA presents a new marketing opportunity. It is my opinion that more
marketing about the true socio-economic value of food waste processing might not only

42
increase demand for its products, but also provide more tolerance among local
populations to the issues that these technologies bring, like odors or visual disturbances.
The NPV of transportation was $10 less for AC when compared to AD. The
estimation of transportation costs from the food waste generation location to the facility
site was largely generalized by factoring in location and diesel fuel costs as variables.
Collection of actual transportation costs were outside the scope of this project, as this
enormous dataset would be very difficult to acquire and analyze. Future research would
benefit from a separate analysis that focuses on the efficiencies of food waste
transportation. The inclusion of transportation of food waste in a CBA depends largely
on what is being compared. For this analysis, two different technologies were being
compared in a case study for which locations were known, so it made sense to include
this estimate. On the other hand, an analysis to determine if an AC or AD facility should
be added to a farm operation would not be dependent on location.
Several factors influence the location selection of AC and AD facilities in
Massachusetts. Typically, AC facilities are additions to existing farming operations, and
are often also located on farms which tend to be located farther away from densely
populated areas where food waste is generated. Both AC and AD facilities tend to also
be located in places of low population because odor can be a problem for neighbors.
Investments in odor control have the potential to mitigate this limitation, which affects
both AC and AD facilities. A second factor that influences facility location for AD is the
lack of a market for digestate in Massachusetts. Most of the digestate from AD will be
applied to the farm on which it operates. In order to reduce the risk of effluent amounts
of nutrients on farm land, AD facilities need to be located on farms with lots of

43
agricultural land, thus limiting on-farm AD location options. Marketing of digestate
would relieve this restriction, but would have to overcome two key barriers- the low
perceived value of digestate and the high costs for transportation and handling (Mouat,
Barclay, Mistry, & Webb, 2010). Further research should be performed on investments
for AC and AD odor control technology, as well as the market for digestate.
Tipping fees differ by a NPV of $6, with current AC tipping fees charging $15
more than AD. Closing this gap would also close the gap on the difference in the
financial assessment of the two facilities, making each technology similarly profitable. A
financial assessment of the data for each technology could be taken as the sum of the
processing facilities costs and their direct revenues. The results of a strictly financial
assessment of the data collected results in an NPV profit for AC of $19 per ton of food
waste and $10 for AD. Matched tipping fees between the two technologies would not
only accomplish a similarity in the profitability of each technology, but would eliminate
this competitive advantage.
A food waste generator or food waste management company will look at both the
tipping fee cost and the cost of transportation when selecting a food waste processing
facility. Eliminating differences in tipping fees between facilities would likely result in
the selection of the closer facility, increasing the likelihood that the facility with a more
efficient transportation route is selected. Tipping fees are determined by supply and
demand. Opportunities to close the gap in tipping fees, lie in either greater transparency
of the tipping fee prices or government interventions. Another argument in support of the
development of a government control on the tipping fee would be that it would ensure
food waste processing facilities remain profitable. In response to the addition of food

44
waste processing at a waste water treatment plant in Massachusetts that used AD,
concerns were reported by several AC facilities about the need to drop tipping fees to
stay competitive in the industry.
Job creation from AC is about 1.5 times more per ton of food waste than AD.
From a government point of view, this socio-economic factor alone is important in
reducing unemployment rates. AC and on-farm AD also support many farms by
providing an additional source of income so these technologies can also support
employment rates by securing agricultural and animal husbandry operations in
Massachusetts.
The case study for this project was designed to focus on the biggest food waste
processing technologies used in Massachusetts, but incorporation of all technologies
would be very useful in making future decisions on the development of food waste
processing. Future analysis should incorporate secondary technologies, like AD facilities
located at wastewater treatment plants or landfill sites, as well as landfilling of food
waste. Because of the large quantities of food waste these secondary food waste
processing facilities take in, their role in the economic landscape of food waste
processing in Massachusetts is significant, and would be highlighted with their
incorporation into the CBA. They would also be an interesting addition, as these
technologies would have very different socio-economic results when compared to on–
farm AD. Through the various discussions I have had with various industry experts and
stakeholders, the addition of food waste processing at wastewater treatment plants or
landfill sites would provide the benefit of greatly reducing transportation costs in
Massachusetts, but would have less socio-economic benefits when compared to on-farm

45
AD or AC (Mass.gov, 2018). The addition of landfilling food waste into the CBA would
also provide additional insight into the value of food waste collection and processing and
would be a valuable element in the promotion of the food waste collection program.
When taking the aforementioned interpretations into consideration, a discussion
presents itself around a scenario in which transportation costs are removed from the
analysis and the closing of the tipping fee gap. Tipping fees are set by the facility and it
is not clear from this analysis why there is a difference between AC and AD prices. If
these two variables were matched for AD and AC composting, then the socio-economic
benefits of AC and on-farm AD would be more closely matched ($6 per short ton of food
waste). If it is assumed that digestate is undervalued and there is a market for this
resource, then this would result in a rejection of the hypothesis due to the indifference
between the socio-economic benefit of AC and AD.
Interpretation of Sensitivity Analysis
My second hypothesis stated that transportation factors, changes in output product
prices (digestate, biogas and compost) and the social cost of carbon will be the biggest
drivers of NPV, and that the driving variables would be the same for AC and AD. I reject
both of these hypothesis, as the driving variables were not as hypothesized and were not
matched for AC and AD. AD-only drivers included electricity price and construction and
equipment costs. The only driver for AC was the price of compost. Drivers that
impacted both AC and AD were transportation, diesel price, and tipping fees.
The result of the sensitivity analysis confirmed the importance of further research
into reducing factors that limit location options for windrow AC and on-farm AD, as well

46
as the optimization of transportation and its associated costs. It also indicated the
importance of tipping fee prices and the need for further evaluation of its optimization
options. Finally, it confirmed the value of developing marketing for food waste products
and increasing awareness around the value of AD electricity and AC compost.
Data Collection, Research Limitations and Caveats
There are several caveats and limitations to the data collection. Since results are
only as good as the input data, several potential factors of this study may have negatively
influenced the accuracy of the data. Due to the infancy of food waste processing,
limitations of data availability was a major restriction in data accuracy. The small
number of AD processors in Massachusetts significantly limits the size of this dataset.
Similarly, AC processing would have been better represented by a larger dataset.
Although there are significantly more AC facilities than AD facilities and a much higher
number of datasets were collected, many things are optional in AC processing (i.e.
trommel screener, turn rates, feedstocks) so there are many variables that differed
between facilities.
Data collection was voluntary and time availability for the processors was varied
and limited. I connected with many processors that provided data they had readily
available. For data not readily available, some processors were not able to invest the
additional time required to collect this data from their historical records. Also, some
processors were not able to make all estimations, particularly if there were multiple
operations at the facility. Another major variable was the level of knowledge of ones
financials. AC facilities provided more estimations of their financials, while AD

47
operations and some larger AC operations tend to run more like companies and have a
more comprehensive understanding of their financials. Transparency and competition
concerns were also contributing factors, affecting the willingness of a facility to share its
data. Lastly, the voluntary nature of the data collection also made it challenging to
pursue data accuracy details. It should be noted and recognized that most facility
managers made major efforts to work with me and to provide the most accurate
estimations of the data requested. Future analysis should pursue opportunities to mandate
participation and to use the opportunity to request a detailed account that would optimize
the data accuracy. I would also recommend that future survey questionnaires be
developed with representatives of each technology as much of the process details were
learned while going through the survey process.
The data accuracy of operational costs were also dependent on a number of
variables that differed between technologies and from facility to facility. Major variables
included the operational process used, the cost of purchasing and maintaining equipment,
the set price of the revenue products, and the types, availability and quantities of
feedstocks. In developing the model, I attempted to assimilate these variables by
normalizing data, taking median values of estimates, and isolating costs for the food
waste portion of the operation. The drawback of these procedures is that they could
potentially introduce additional inaccuracies to the calculations. There are many possible
approaches to eliminating these sources of variability. Future analysis might include
having a problem-solving meeting with key stakeholders to collaborate on the
development of methodologies for data accuracy optimization.

48
Another limiting factor was the input feedstocks that are needed for the AC or
AD processing of food waste. Yard waste, for example, is a critical input in food waste
compost because of the carbon demands. Yard waste availability is limited and mostly
seasonal, unlike commercial food waste generation which is ongoing. Future analysis
may want to evaluate the impact on ecosystem services of the seasonality and limitations
of various food waste feedstocks. Another limiting factor of the feedstocks lies in the
sensitivity AC and AD have to the contamination of food waste feedstocks. Many
processors reject contaminated food waste feedstock or incur additional costs and
penalties in its processing. This suggests that more effort in food waste contamination
reduction is needed and would ensure that food waste collected is getting repurposed.
A final limiting factor of this analysis was the availability of quantitative data.
Some cost and benefits could not be included, as a complete analysis into the differences
between AC and AD does not currently exist. As the research develops, rates for the
costs and benefits of yield increases and water conservation should be included in the
CBA analysis. Other quantitative factors that could not be included were cost and the
benefits associated with the final destination of output products. Food waste that is
composted in Massachusetts is going to where soil fertility improvements are needed, as
this product is enters the market and is dispersed across Massachusetts. Food waste that
is digested is generally only being applied to a few farms and remains restricted to these
farms year after year.
49
Additional Considerations Warranting Discussion
The cost of carbon was not highlighted by the sensitivity analysis, but major
discrepancies exist in the literature on how to value the cost of carbon. The EPA
estimation of $38.40 per ton is currently most widely accepted, but other studies have
concluded that the actual cost, as estimated in 2015, can be somewhere closer to $220 per
ton. This could significantly increase the NPV of climate benefits of AC and AD by $7
and $14, respectively. Also, this would close the gap between AC and AD from $22 to
only $14. Such an impact would really change the numbers and so keeping an updated
CBA would ensure that decisions stay updated with the evolution of scientific research.
Food waste diversion supports our move from a linear global food system that
creates the food waste and degrades soil to a circular global food system that reduces
these impacts and provides us with an opportunity to address many of our global
sustainability issues. Food waste is a precious resource that presents us with an
opportunity to address several major global issues, like soil degradation, atmospheric
carbon, hunger, and poverty. Soil degradation is a result of conventional agriculture and
linear food systems (Project Drawdown, 2017). Without returning the carbon back to the
soil, the soil becomes severely depleted, causing issues of food security, water security,
energy sustainability, climate stability, biodiversity, ecosystem service delivery, lower
yields, land abandonment and unsustainable agricultural practices (McBrathney, Field, &
Koch, 2013). Future research should continue to build-in variables that are
comprehensive of the potential food waste has on restoring our depleting soils (FAO,
2006, 2011).

50
Conclusions
Both, windrow AC and on-farm AD have high socio-economic benefit potential.
Major opportunities exist for the further development of both these processes to increase
the net socio-economic benefit of food waste processing and to ensure they are both
major players in the industry. They have different costs and benefits, as well as
opportunities and limitations, so the continued support for the development of both
technologies is best advised for optimizing food waste diversion efforts. These benefits
from AC include continued support of small farm operations and jobs, and the
composting of additional organic materials, like yard waste, which produce a very high
quality compost. On-farm AD supports large farm operations without taking away from
the farmer’s labor hours. It also produces a product that reduces our reliance on non-
renewable sources of energy. Both of these food waste recycling methodologies also
support soil restoration and limit soil contamination when compared to AD facilities on
wastewater treatment plants and landfill sites.
One of the greatest opportunities for improving the socio-economic benefits of
AC and AD are the investments in the development of AC and AD technologies to be
less sensitive to location restrictions. Development opportunities lie in investments for
odor control technology, development of an AD digestate market, development of more
efficient transportation systems, and reducing costs associated with its transportation (i.e.
using the empty food waste delivery trucks and more efficient modes of transportation).
Another major opportunity is the control of tipping fees through incentives or
subsidies. Tipping fees are major sources of revenue in food waste processing and

51
control of this source of income will ensure that our facilities remain operational and
profitable. This would also support improvements in transportation efficiencies.
Additional considerations in the development of food waste processing include
marketing and the cost of carbon. Improvements in the marketing of food waste
processing would increase tolerance, as well as match the market value of its products to
their socio-economic value. More specifically, the development of a market for digestate
would help close the socio-economic gap between AC and AD. This gap can also
significantly change with developments in estimations for the cost of carbon.
Further development of CBA and its sustained use in decision-making of food
waste management development will provide the opportunity to increase the socio-
economic benefit of food waste processing. As technology, infrastructure and regulations
change, the results of a CBA will continuously change and provide guidance for decision
makers. Developing and sustaining a comprehensive CBA for food waste processing will
enhance the likelihood that the most sustainable, efficient and effective decisions will
always be made.

52
References
Adejuyigbe, C. O., Adesodun, J. K., Harris, P., & Aiyelaagbe, I. (2012). Potential of on-farm produced compost and organic amendments in soil fertility management for organic maize production in southwesten Nigeria. Archives of Agronomy 7 Soil Science, 58, 170-174.
Adhikari, B., Barrington, S., Martinez, J., & King, S. (2008). Characterization of food waste and bulking agent for composting. Waste Management, 28(5), 795-804.
Ajayi, O., Festus, A., Gudeta, S., & Chakeredza, S. (2007). Adoption of renewable soil fertility replenishment technologies in the southern African region: Lessons learnt and the way forward. Natural Resources forum, 31(4), 306-317.
Bailey, K. (2017, June 22). Zero Waste for the Rest of Us. Retrieved from Waste360: http://www.waste360.com/waste-reduction/zero-waste-rest-us
Bennett, J., & Ward, R. (2010, November). RuralTax. Retrieved from Rural Tax Education: https://www.ruraltax.org/files-ou/depclasslife.pdf
Broad Lieb, E., Rice, C., & Mahoney, J. (2016). Fresh look at organics ban and waste recycling laws. BioCycle 57 (10), 16.
Brown, S. (2016). Greenhouse gas accounting for landfill diversion of food scraps and yard waste. Conpost Science & Utilization, 24, 11-19.
Brown, S., Kurtz, K., Bary, A., & Cogger, C. (2011). Long-term effects of organic amendments on soil carbon storage and physical properties. Envrion. Sci. Technol. 45 (71), 7451-7458.
Cekmecelioglu, D., Demirci, A., Graves, R., & Davitt, N. (2005). Applicability of optimized in-vessel food waste composting for windrow systems. Biosystems Engineering, 91(4), 479-486.
Chang, J., & Hsu, T.-E. (2008). Effect of compositions on food waste composting. Bioresource Technology, 8068-8074.
Chrisafis, A. (2016, 2 4). French law forbids food waste by supermarkets. Retrieved from The Guardian: https://www.theguardian.com/world/2016/feb/04/french-law-forbids-food-waste-by-supermarkets
Commonwealth of Massachsuetts. (2017). Commonwealth of Massachsuetts. Retrieved from Massachusetts Retail Gasoline & Diesel Fuel Prices:

53
https://www.mass.gov/service-details/massachusetts-retail-gasoline-diesel-fuel-prices
Dreyfus, D. (1990). Feasability of On-Farm Composting. Peteaux (France): Rodale Institute.
Duffy, D. P. (2017). Waste in, energy out: The costs and benefits of anaerobic digesters. MSW Management, 27(1), 22-28.
Ebner, J. H., Labatut, R. A., Rankin, M. J., Pronto, J. L., Gooch, C. A., Williamson, A. A., & Trabold, T. A. (2015). Lifecycle greenhouse gas analysis of an anaerobic codigestion facility processing dairy manure and industrial food waste. Envrionemtnal Science & Technology, 49(18), 11199-11208.
Edwards, W. (2015, May). Estimating Farm Machinery Costs. Retrieved from Iowa State University Extension and Outreach: https://www.extension.iastate.edu/agdm/crops/html/a3-29.html
EPA. (2017, April 15). Greenhouse Gases Equivalencies Calculator - Calculations and References. Retrieved from EPA: https://www.epa.gov/energy/greenhouse-gases-equivalencies-calculator-calculations-and-references
Ermolaev, E. P. (2012). Greenhouse gas emission from covered windrow composting with controlled ventilation. Waste Management & Research: The Journal Of The International Solid Wastes & Public Cleansing Association, ISWA, 30(2), 155-160.
Fabian, E., Richard , T., & Kay, D. (1993). Agricultural Composting: A Feasibility Study of New York Farms. Ithica: Cornell University.
FAO. (1992). Cost Control in Forest Harvesting and Road Construction. Rome: FAO. Retrieved from FAO: http://www.fao.org/docrep/T0579E/t0579e00.htm#Contents
FAO. (2013). Food Wastage Footprint: Impacts on the Natural Resources. New York: Food and Agriculture Organizatio of the United Nations. Retrieved from FAO.
FAO. (2014). FAO. Retrieved from Mitigation of Food Wastage: Societal Costs and Benefits: http://www.fao.org/3/a-i3989e.pdf
FAO. (2015). Composting: Let's Give the Soil Something Back. Retrieved from FAO: http://www.fao.org/soils-2015/news/news-detail/en/c/280674/
FAO, IFAD, UNICEF, WFP & WHO. (2017). The State of Food Security and Nutrition in the World 2017. Building resilience for peace and food security. Rome: FAO. Retrieved from FAO: http://www.fao.org/3/a-I7695e.pdf
Gresham, C., Janke, R., & Moyer, J. (1990). Composting of Poultry, Leaves and Newspapers. Rural Urban Office: Rodale Institute.
54
Gunders, D. (2012). Wasted: How America Is Losing Up to 40 Percent of Its Food from Farm to Fork to Landfill. New York City: Natural Resources Defense Fund.
Hartmann, H., & Ahring, B. K. (2006). Strategies for the anaerobic digestion of the organic fraction of municipal solid waste: an overview. Water Science & Technology, 53(8), 7-22.
Hegde, S., Lodge, J., & Trabold, T. (2018). Characteristics of food processing wastes and their use in sustainable alcohol production. Renewable and Sustainable Energy Reviews, 81(1), 510-523.
ICF. (2016, December). Massachusetts Commercial Food Waste Ban Economic Impact Assessment . Retrieved from MassDEP: https://www.mass.gov/files/documents/2016/12/nx/orgecon-study.pdf
IPCC. (2006). 2006 IPCC GUidelines for National Greenhouse Gas Inventories. Retrieved from IPCC: http://www.ipcc-nggip.iges.or.jp/public/2006gl/vol4.html
Kraemer, T., & Gamble, S. (2014). Integrating anaerobic digestion with composting. BioCycle, 55(7), 32. Retrieved from https://www.biocycle.net/2014/11/18/integrating-anaerobic-digestion-with-composting/
Krull, E. S., Baldock, J. A., & Skjemstad, J. O. (2003). Importance of mechanism and processes of the stabilisation of soil organic matter for modelling carbon turnover. Functional Plant Biology, 30, 207-222.
Kumar, M., Ou, Y.-L., & Lin, J.-G. (2010). Co-composting of green waste and food waste at low C/N ratio. Journal of Environmental Management, 70(4), 602-609.
Lei, F., & VanderGheynst, J. (2000). The effect of microbial inoculation and pH on microbial community structure changes during composting. Process Biochemistry, 35(9), 923-929.
Luo, W., Yuan, J., Luo, Y., Li, G., Ngheim, L., & Price, W. E. (2014). Effects of mixing and covering with mature compost on gaseous emissions during composting. Chemosphere, 117, 14-19.
Magdoff, F. (2007). Ecological agriculture: Principles, practices, and constraints. Renewable Agriculture and Food Systems, 22(2), 109-117.
Mass DEP. (2011). Food Waste Generators in Massachusetts Map. Retrieved from Mass DEP: http://www.mass.gov/eea/docs/dep/recycle/priorities/foodmap.pdf
Mass.gov. (2018, February 20). Energy and Environmental Affairs. Retrieved from Mass.gov: http://www.mass.gov/eea/agencies/massdep/climate-energy/energy/program/anaerobic-digestion-case-studies-wastewater.html

55
Massachusetts Department of Agricultural Resources. (2011). Massachusetts Department of Agricultural Resources. Retrieved from Guide to Agricultural Composting: https://www.mass.gov/files/documents/2017/12/11/Guide%20to%20Agricultural%20Composting.pdf
MassDEP. (2015, July). Factsheet Food Waste Composting. Retrieved from MassDEP: https://www.mass.gov/files/documents/2016/08/ni/organics.pdf
MassDEP. (2016, February 9). Commercial Food Waste Disposal Ban. Retrieved from MassDEP: http://www.mass.gov/eea/agencies/massdep/recycle/reduce/food-waste-ban.html
MassDEP. (2017, May). Sites Accepting Diverted Food Material. Retrieved from MassDEP: http://www.mass.gov/eea/docs/dep/recycle/reduce/06-thru-l/fdcomlst.pdf
Masur, J., & Posner, E. A. (2012). Regulation, Unemployment, and Cost-Benefit. 98 Virginia Law Review 579 . Retrieved from https://chicagounbound.uchicago.edu/cgi/viewcontent.cgi?article=2742&context=journal_articles
McBrathney, A., Field, D., & Koch, A. (2013). The dimensions of soil security. Geoderma, 213, 203-213.
Miller, B., Juliette, S., & Camille, K. (2014). Costs and benefits of pneumatic collection in three specific New York City cases. Waste Management, 34(11), 1957-1966.
Miranda, N. D., Tuomisto, H., & McCulloch, M. D. (2015). Meta-analysis of greenhouse gas emissions from anaerobic digestion processes in dairy farms. Environmental Science &Technology, 49(8), 5211-5219.
Moller, J., Boldrin, A., & Christensen, T. H. (2009). Anaerobic digestion and digestate use: accounting of greenhouse gases and global warming contribution. Waste Management & Reserach, 27(8), 813-824.
Montgomery, D. (2007). Soil Erosion and agricultural sustainability. Proc. Natl. Acad. Sci. U.S.A. 104(33), 13268-13272.
Moore, F., & Diaz, D. (2015). Temperature impacts on economic growth warrant stringent mitigation policy. Nature Climate Change (5), 127-131. Retrieved from https://www.nature.com/articles/nclimate2481
Morris, J., Brown, S., Cotton, M., & Matthew, H. (2017). Life-cycle assessment harmonization and soil science ranking results on food-waste management methods. Environmental Science and Technology (51), 5360-5367. Retrieved from http://pubs.acs.org.ezp-prod1.hul.harvard.edu/doi/pdf/10.1021/acs.est.6b06115

56
Moser, M., Mattocks, R., Gettier, S., & Roos, K. (1998). Benefits, Costs and Operating Experience at Seven New Agricultural Anaerobic Digesters. Washington: EPA.
Mouat, A., Barclay, A., Mistry, P., & Webb, J. (2010). Digestate Market Developement in Scotland. Scotland: Natural Scotland . Retrieved from http://www.wrap.org.uk/sites/files/wrap/Zero_Waste_Scotland_Digestate_Market_Development.pdf
Mourad, M. (2015). France Moves Toward A National Policy Against Food Waste. Paris: NRDC.
Murto, M., Bjornsson, L., & Mattiasson, B. (2003, 11 12). Impact of food industrial waste on anaerobic co-digestion of sewage sludge and pig manure. Journal of Environmental Management, 70(2), 101-107. Retrieved from Journal of Environmental Management.
National Renerable Energy Laboratory. (2013). Feasibility Study of Anaerobic Digestion of Food Waste in St. Bernard, Louisiana. Retrieved from NREL: https://www.nrel.gov/docs/fy13osti/57082.pdf
Navaratnasamy, M., Edeogu, I., & Papworth, L. (2008). Economic feasability of anaerobic digesters. Agdex, 768-6.
OECD. (2006). Cost Benefit Analysis and the Enviroment: Recent Developements. Paris: OECD Publishing.
OMB. (2016, 11). Guidelines and Discount Rates for Benefity-Cost Analysis of Federal Programs. Retrieved from Circular A-94: https://obamawhitehouse.archives.gov/omb/circulars_a094/a94_appx-c
Rahmani, M., Hodges, A., & Kiker, C. (1999). Analyzing compost economics. BioCycle, 40(9), 66-69.
Rahmani, M., Hodges, A., & Kiker, C. (2004, July). Compost users' attitudes toward compost application In Florida. Compost Science & Utilization, 12, 55-60.
Richard, T. (1990). Livestock Bedding: A New Market for Old News. New York, New York: The Sixth Annual Conference on Solid Waste Management and Materials Policy.
RTI International. (2010). Greenhouse Gas Emissions Estimation Methodologies for Biogenic Emissions from Selected Source Catagories: Solid Waste Disposal Wastewater Treatment Ethanol Fermentation. Research Triangle Park: US EPA.
Rynk, R. (2001). Exploring the economics of on-farm composting. Biocycle 42(4), 62-70. Retrieved from https://www.agriculture-xprt.com/articles/cost-benefit-analyses-exploring-the-economics-of-on-farm-composting-2215
57
Rynk, R., van de Kamp, M., Willson, G., Singley, M., Richard, T., Kolega, J., . . . Brinton, W. (1992). On-Farm Composting Handbook. Ithica: Cooperative Extension.
Sanchez, A., Artola, A., Font, X., Gea, T., Barrena, R., Gabriel, D., & Sanchez-Menedero, M. (2015). Chapter 2: Greenhouse Gas from Organic Waste Composting: Emissions and Measurement. In E. Lichtfouse, J. Schwarzbauer, & D. Robert, Environmental Chemistry for a Sustainable World (pp. 33-42). Switzeralnd: Springer International Publishing.
Sanchez, P. A., Shepherd, K. D., Soule, M., Place, F., Buresh, R., Mokwunye, I., . . . Woomer, P. (1997). Replenishing Soil Fertility in Africa. Madison: Soil Science Society of America and American Society of Agronomy.
State of Oregon Department of Environmental Quality (DEQ). (2014). Evaluation of Climate, Energy, and Soils Impacts of Selected Food Discards. Portland, OR: DEQ. Retrieved from Evaluation of Climate, Energy, and Soils Impacts of Selected Food Discards: https://pubs-acs-org.ezp-prod1.hul.harvard.edu/doi/pdf/10.1021/acs.est.6b06115
Stewart, C., Follett, R., Wallace, J., & Pruessner, E. (2012). Impact of biosolids and tillage on soil organic matter fractions: implications of carbon saturation for conservation management in the Virgina Coastal Plain. Scoil Sci. Am. J. 76, 1257-1267.
The World Bank. (2018, 2 16). Inflation, consumer prices (annual %). Retrieved from The World Bank: https://data.worldbank.org/indicator/FP.CPI.TOTL.ZG?end=2016&locations=US&start=1960
Timmons, D. (2014). Using former farmland for biomass crops: MA landowner motivations and willingness to plant. Agricultural and Resource Economics Review (43,3), 1-19.
Tiquia, S. M. (2010). Reduction of compost phytotoxicity during the process of decomposition. Chemosphere, 79(5), 506-512.
United States Department of Labor. (2016, May). Bureau of Labor Statistics. Retrieved from Occupational Employment and Wages: Agricultural Equipment Operators: https://www.bls.gov/oes/current/oes452091.htm
US Army Corps of Engineers. (2016, November). Construction Equipment Ownership and Operating Expense Schedule Region 1. Retrieved from US Army Corps of Engineers: http://www.publications.usace.army.mil/Portals/76/Publications/EngineerPamphlets/EP_1110-1-8_Vol_01.pdf?ver=2017-05-15-124253-820
58
US Energy Information Administration. (2018, 2 15). Massachusetts: State profile and energy estimates. Retrieved from US Energy Information Administration: https://www.eia.gov/state/data.php?sid=MA#Prices
US EPA. (1998, April). An Analysis of Composting as an Environmental Remediation Technology. Washington: US EPA. Retrieved from United States Environmental Protection Agency.
US EPA. (2006, 2 28). US EPA. Retrieved from Standard Volume-to-Weight Conversion Factors: https://www.epa.gov/sites/production/files/2016-03/documents/conversions.pdf
US EPA. (2011). Food Waste Generators in Massachusetts. Retrieved from MassDEP: http://www.mass.gov/eea/docs/dep/recycle/priorities/foodgen.pdf
US EPA. (2016 , 10 3). Types of Anaerobic Digesters. Retrieved from US EPA: https://www.epa.gov/anaerobic-digestion/types-anaerobic-digesters
US EPA. (2016). Inventory of U.S. Greenhouse Gas Emissions and Sinks: 1990-2004. Washington: US EPA.
US EPA. (2016, March). Waste Reduction Model (WARM) Version 14. Retrieved from US EPA: https://www.epa.gov/warm/versions-waste-reduction-model-warm#WARM Tool V14
US EPA. (2018, 2 24). The Social Cost of Carbon. Retrieved from EPA: https://19january2017snapshot.epa.gov/climatechange/social-cost-carbon_.html
USDA. (2007, October). An Analysis of Energy Production Costs from Anaerobic Digestion System on U.S. Livestock Production Facilities. Retrieved from USDA: https://www.agmrc.org/media/cms/manuredigesters_FC5C31F0F7B78.pdf
van Otterdijk, R., & Alexandre, M. (2011). Global Food Losses and Food Waste: Extent Causes and Prevention. Dusseldorf: FAO. Retrieved from FAO.
Wuest, S., & Reardon, C. (2016). Surface and root inputs produce different carbon/Phosphorus ratios in soil. . Soil Sci. Soc. Am. J. 80, 463-471.
You, S., Wang, W., Dai, Y., Tong, Y., & Wang, C.-H. (2016). Comparison of the co-gasification of sewage sludge and food wastes and cost-benefit analysis of gasification- and incineration-based waste treatment schemes. Bioresource Technology, 218, 595-605.
Zhang, R. (2017, November 2). US EPA. Retrieved from Digestate Alone and with Compost: Designing for Specific End Users: https://www.epa.gov/sites/production/files/2017-11/documents/cba2017-digestate_alone_and_with_compost.pdf

59
Zhentong, L., Lu, H., Ren, L., & He, L. (2013). Experimental and modeling approaches for food waste composting: A review. Chemosphere, 93(7), 1247-1257.
Zhu-Barker, X., Bailey, S. K., Tha Paw U, K., Burger, M., & Horwath, W. R. (2017). Greenhouse gas emissions from green waste composting windrow. Waste Management, 70-79. Retrieved from Waste Management.
Please ignore. Formatting for sustaining the accuracy of the reference section. ``````(Adhikari, Barrington, Martinez, & King, 2008) (Cekmecelioglu, Demirci, Graves, & Davitt, 2005) (Chang & Hsu, 2008) (Kumar, Ou, & Lin, 2010) (Duffy, 2017) (Navaratnasamy, Edeogu, & Papworth, 2008) (Moser, Mattocks, Gettier, & Roos, 1998) (Rynk, et al., 1992) (Rynk, Exploring the economics of on-farm composting, 2001) (Rahmani, Hodges, & Kiker, 1999) (ICF, 2016) (Dreyfus, 1990) (Gresham, Janke, & Moyer, 1990) (Richard, 1990) (The World Bank, 2018) (Bennett & Ward, 2010)


