

Dr B. Dylan Bradley and Professor Berkeley Hill
November 2015
Cost of and good practices
for
FADN data collection
Final Report

EUROPEAN COMMISSION
Directorate-General for Agriculture and Rural Development
Directorate E — Economic analysis, perspectives and evaluation
E-mail: [email protected]
European Commission
B-1049 Brussels

EUROPEAN COMMISSION
Directorate-General for Agriculture and Rural Development
Costs of and good practice for FADN data collection
2015
Cost of and good practices
for
FADN data collection
Final Report

LEGAL NOTICE
The information and views set out in this report are those of the author(s) and do not necessarily reflect the
official opinion of the Commission. The Commission does not guarantee the accuracy of the data included in
this study. Neither the Commission nor any person acting on the Commission’s behalf may be held
responsible for the use which may be made of the information contained therein.
More information on the European Union is available on the Internet (http://www.europa.eu).
Luxembourg: Publications Office of the European Union, 2015
ISBN: 978-92-79-50061-9
doi: 10.2762/294831
© European Union, 2015
Reproduction is authorised provided the source is acknowledged.
Printed in [EN]
Europe Direct is a service to help you find answers
to your questions about the European Union.
Freephone number (*):
00 800 6 7 8 9 10 11
(*) The information given is free, as are most calls (though some operators, phone
boxes or hotels may charge you).

Study on cost of and good practices for FADN data collection
v
Study on costs of and good practices for FADN data collection
Authors: Dr B. Dylan Bradley and Professor Berkeley Hill
Date: November 2015
Table of Contents
ACRONYMS.............................................................................................................................................. VIII
ABSTRACT ................................................................................................................................................ XII
EXECUTIVE SUMMARY ....................................................................................................................... XIII
1. INTRODUCTION ................................................................................................................................. 1
1.1. OVERALL APPROACH TO THE STUDY ........................................................................................................ 1
1.1.1. Distinguishing patterns in FADN data collection ............................................................. 2
1.1.2. Measuring the costs and benefits of FADN data collection ......................................... 2
1.1.3. Identifying explanatory factors ............................................................................................. 3
1.1.4. Identifying best practice that can be shared ................................................................... 3
1.2. STRUCTURE OF THE REPORT .................................................................................................................... 3
2. THE EU POLICY FRAMEWORK FOR FADN DATA COLLECTION AND USE ................. 4
2.1. THE PURPOSE OF FADN .......................................................................................................................... 4
2.2. LEGISLATIVE REQUIREMENTS .................................................................................................................. 6
2.3. THE FADN FIELD OF OBSERVATION ....................................................................................................... 7
2.4. NATIONAL RESPONSIBILITY FOR FADN .................................................................................................. 8
2.5. EU CONTRIBUTION TO NATIONAL DATA COLLECTION ............................................................................ 9
2.6. THE USE MADE OF FADN RESULTS ......................................................................................................... 9
3. METHODOLOGY ................................................................................................................................ 11
3.1. DATA COLLECTION TOOLS ...................................................................................................................... 11
3.1.1. Brainstorming ............................................................................................................................ 11
3.1.2. Expert advisory team .............................................................................................................. 11
3.1.3. Literature review ...................................................................................................................... 12
3.1.4. Online survey ............................................................................................................................. 12
3.1.5. Case studies ............................................................................................................................... 13
3.1.6. Attendance at relevant workshops/meetings ................................................................ 17
3.1.7. Interviews outside the FADN data supply chain ........................................................... 18
4. THE LEGAL, INSTITUTIONAL, ORGANISATIONAL AND ECONOMIC
FRAMEWORK AT MEMBER STATE LEVEL.................................................................................... 19
5. ORGANISATION OF FADN AND METHODS OF COLLECTING THE DATA ................ 21
5.1. LEGAL FRAMEWORK AND BACKGROUND TO THE NATIONAL FARM SURVEYS ....................................... 21
5.1.1. Legal framework ....................................................................................................................... 21
5.1.2. Establishment of national farm surveys and current rationale ............................... 23

Study on cost of and good practices for FADN data collection
vi
5.2. ANALYSIS OF FADN ORGANISATION .................................................................................................... 23
5.2.1. Organisation of the national farm survey ....................................................................... 23
5.2.2. National FADN Committees .................................................................................................. 26
5.2.3. Scope of national data collection ........................................................................................ 27
5.2.4. The FADN sample ..................................................................................................................... 30
5.2.5. Farmer participation and benefits ...................................................................................... 34
5.3. DATA COLLECTION METHODOLOGIES .................................................................................................... 35
5.3.1. Methods used ............................................................................................................................. 35
5.3.2. Data sources used .................................................................................................................... 39
5.3.3. Data recording methods ........................................................................................................ 39
5.3.4. Reasons for the methods used ............................................................................................ 40
5.3.5. Changes to methods used and rationale ......................................................................... 41
5.3.6. Data validation .......................................................................................................................... 42
5.4. TYPOLOGY OF NATIONAL FARM SURVEYS .............................................................................................. 46
6. THE COSTS OF COLLECTING FADN DATA IN MEMBER STATES ................................. 50
6.1. KEY ISSUES ............................................................................................................................................. 50
6.1.1. Stages in the data supply chain ......................................................................................... 50
6.1.2. Metrics of costs ......................................................................................................................... 50
6.1.3. Confidence in money cost figures ...................................................................................... 51
6.1.4. Confidence in labour input figures ..................................................................................... 52
6.1.5. Separability ................................................................................................................................. 53
6.2. RESOURCE (TIME) COSTS OF SUPPLYING FADN ................................................................................. 54
6.2.1. Total time requirement and allocation to main activities .......................................... 54
6.2.2. Time requirements along the FADN supply chain ........................................................ 57
6.3. MONETARY COSTS OF SUPPLYING FADN ............................................................................................. 64
6.3.1. Total monetary costs .............................................................................................................. 64
6.3.2. Allocation of monetary costs to activity........................................................................... 72
6.3.3. Reconciliation between money costs and labour time utilisation .......................... 74
6.3.4. Investigation of factors explaining differences in cost ............................................... 78
6.4. COSTS OF CHANGE OR ADAPTATION ..................................................................................................... 88
6.4.1. Changing the scope of variables collected for EU-FADN ........................................... 88
6.4.2. Changing the number of EU-FADN completed Farm Returns .................................. 90
7. THE BENEFITS OBTAINED FROM FADN DATA TO MEMBER STATES ....................... 91
7.1. KEY ISSUES ............................................................................................................................................. 91
7.1.1. Benefits to actors in the data supply chain .................................................................... 91
7.1.2. Estimating the benefits .......................................................................................................... 92
7.1.3. The approach taken here ...................................................................................................... 93
7.2. PUBLICATION OF RESULTS AT MEMBER STATE LEVEL .......................................................................... 93
7.3. USES OF RESULTS OF THE NATIONAL FARM ACCOUNTS SURVEY ......................................................... 95
7.3.1. A typology of data uses ......................................................................................................... 95
7.3.2. The uniqueness of farm accounts survey data ............................................................. 97
7.3.3. Use by national or regional governments of Member States .................................. 98
7.4. VALUING THE BENEFITS FROM USE OF THE NATIONAL ACCOUNTS SURVEY DATA AND RESULTS .... 112

Study on cost of and good practices for FADN data collection
vii
8. BEST PRACTICES IN FADN DATA COLLECTION AND USE THAT CAN BE SHARED
AMONG MEMBER STATES ................................................................................................................ 118
8.1. KEY ISSUES ........................................................................................................................................... 118
8.2. CASE STUDY RESPONSES ON BEST PRACTICE ..................................................................................... 119
8.3. ASSESSMENT OF BEST PRACTICE BY THE RESEARCH TEAM AND ITS EXPERT ADVISORS ................. 123
8.3.1. Reducing costs ......................................................................................................................... 123
8.3.2. Increasing benefits ................................................................................................................ 125
8.3.3. Improving the benefits/costs ratio .................................................................................. 126
8.3.4. Increasing quality and timeliness of databases .......................................................... 127
8.3.5. Reducing the burden on farmers ...................................................................................... 129
8.4. THE APPLICABILITY OF BEST PRACTICE IN OTHER MEMBER STATES ................................................ 130
9. CONCLUSIONS ................................................................................................................................ 133
9.1. OVERARCHING CONCLUSIONS ............................................................................................................. 133
9.2. ORGANISATION OF FADN AND METHODS OF COLLECTING THE DATA ............................................. 134
9.3. THE COSTS OF COLLECTING FADN DATA IN MEMBER STATES ........................................................ 139
9.4. THE BENEFITS OBTAINED FROM FADN DATA TO MEMBER STATES .................................................. 141
9.5. BEST PRACTICES IN FADN DATA COLLECTION AND USE THAT CAN BE SHARED AMONG MEMBER
STATES ........................................................................................................................................................... 143
10. REFERENCES ................................................................................................................................. 146
Study on cost of and good practices for FADN data collection
viii
ACRONYMS
Member States/countries
AT: Austria LV: Latvia
BE: Belgium LT: Lithuania
BG: Bulgaria LU: Luxembourg
CY: Cyprus NL: Netherlands
CZ: Czech Republic NO: Norway
DE: Germany SI: Slovenia
DK: Denmark PL: Poland
EE: Estonia PT: Portugal
EL: Greece ES: Spain
FI: Finland RO: Romania
FR: France SK: Slovakia
HR: Croatia MT: Malta
HU: Hungary SE: Sweden
IE: Ireland CH: Switzerland
IT: Italy UK: United Kingdom
Abbreviations
AAC: Agricultural Advisory Centre (Poland)
AFBI: Agri-Food and Biosciences Institute (UK)
APCA: Assemblée permanente des chambres d'agriculture (France)
ARMA: Agency for Restructuring and Modernisation of Agriculture (Poland)
ARMS: US Agricultural Resource Management Survey
AWU: Annual Work Unit
BEA: Bureau of Economic Analysis (US)
BMEL: Federal Ministry of Food and Agriculture (Germany)
BMELV: Federal Ministry of Food, Agriculture and Consumer Protection
(Germany)
BMLFUW: Federal Ministry of Agriculture, Forestry, Environment and Water
Management (Austria)
CAA: Centre for Agricultural Assistance (Italy)
CAFRE: College of Agricultural, Food and Rural Enterprise (UK)
CAP: Common Agricultural Policy
CASD: Centre d’accès sécurisé à distance (France)
CBS: Croatian Bureau of Statistics
CEI: Centre of Economic Information (Netherlands)
CER FRANCE: Conseil National du Réseau (France)
CGTA: Centre de Gestion Technique Agricole (Belgium - Wallonia)
CPD: Continuing Professional Development
CRA: Agricultural Research Centre (Italy)
CSO: Central Statistics Office (Ireland)

Study on cost of and good practices for FADN data collection
ix
CVR: Central Business Register (Denmark)
DAEA: Direction de l’Analyse économique agricole (Belgium - Wallonia)
DAFM: Department of Agriculture, Food and the Marine (Ireland)
DARD/DARDNI: Department of Agriculture and Rural Development, Northern Ireland
DESTATIS: Federal Statistical Office (Germany)
DG AGRI: Directorate-General for Agriculture and Rural Development (EU)
DGARNE: Department of Agricultural Economic Analysis within the Directorate
General for Agriculture, Natural Resources and Environment (Belgium -
Wallonia)
DKK: Danish Krone
DOM: Département d'outre-mer (France)
DRAAF: Directions régionales de l’Alimentation, de l’Agriculture et de la Forêt
(France)
DRAPs: Direcções Regionais de Agricultura e Pescas (Portugal)
EAA: Economic Accounts for Agriculture
ECA: European Court of Auditors
ECB: European Central Bank
EDI-CIRCLE: Centralised system of recording and paying invoices (Netherlands)
EDR: Electronic data reporting/recording
EFA: Ecological focus area
ELSTAT: Hellenic Statistical Authority (Greece)
ESRC: Economic and Social Research Council (UK)
ESU: European Size Unit
FACEPA: Farm Accountancy Cost Estimation and Policy Analysis of European
Agriculture
FADN: Farm Accountancy Data Network
FADNTOOL: Integrating Econometric and Mathematical Programming Models into an
Amendable Policy and Market Analysis Tool using FADN Database
FAPRI: Food and Agricultural Policy Research Institute (US)
FAS: Farm Accounts Survey (UK - Scotland)
FBS: Farm Business Survey (UK - England and Wales)
FLINT: Farm Level Indicators for New Topics on policy evaluation
FMS: Farm Management Survey (UK)
FSS: Farm Structure Survey
FTE: Full-time equivalent
GDP: Gross Domestic Product
GHG: Greenhouse Gas
GPP: Gabinete de Planeamento, Política e Administração Geral (Portugal)
HICP: Harmonised Index of Consumer Prices
HUF: Hungarian Forint
IA: Impact Assessment
IACS: Integrated Administration and Control System
IAFE-NRI: Institute of Agricultural and Food Economics - National Research
Institute (Poland)
IBERS: Aberystwyth University’s Institute of Biological, Environmental and
Rural Sciences (UK)

Study on cost of and good practices for FADN data collection
x
IDELE: Institut de l’elevage (France)
INEA: Istituto di Nazionale Economia Agraria (Italy)
INPS: National Institute of Social Security (Italy)
INRA: Institut national de la recherche agronomique (France)
INSEE: Institut national de la statistique et des études économiques (France)
ISS: Institute for Sustainability Sciences (Switzerland)
ISTAT: National Institute of Statistics (Italy)
JEU: National farm accounts survey (Sweden)
JRC: Joint Research Centre
JRC-IPTS: The JRC Institute for Prospective Technological Studies
KTBL: Association for Technology and Structures in Agriculture (Germany)
LAAS: Lithuanian Agricultural Advisory Service
LAO: FADN Liaison Agency
LCA: Life Cycle Assessment
LEI / LEI-DLO: Landbouw Economisch Instituut (NL)
LFA: Less Favoured Area
LFL: Bayerische Landesanstalt für Landwirtschaft (Germany)
LIAE: Lithuanian Institute of Agricultural Economics
LLFG: Landesanstalt für Landwirtschaft, Forsten und Gartenbau (Germany)
LRF: Federation of Swedish Farmers
LU: Livestock unit
LUKE: Natural Resources Institute Finland
LVL: Latvian Lat
MAAF: Ministry of Agriculture, Agro-food and Forestry (France)
MAF: Ministry of Agriculture and Food (Bulgaria)
MAGRAMA: Ministerio de Agricultura, Alimentación y Medio Ambiente (Spain)
MAPA: Ministry of Agriculture, Fisheries and Food (Spain)
MSA: Mutualité Sociale Agricole (France)
MTT: Agrifood Research Finland
NFS: Irish National Farm Survey
NIA: Northern Ireland Assembly
NLB: New Land Bookkeeping
NPPC-VUEPP: National Agricultural and Food Centre, Research Institute of Agricultural
and Food Economics (Slovakia)
NSO: National Statistics Office (Malta)
NUTS: Nomenclature des Unités Territoriales Statistiques
OECD: Organisation for Economic Co-operation and Development
OGA: Other Gainful Activities
OMB: Office of Management and Budget (US)
ONS: Office for National Statistics (UK)
PA: Paying Agency (Malta)
PLN: Polish Zloty
RAD: Regional Agricultural Directorates (Bulgaria)
RBR: Rural Business Research (UK)
RDP: Rural Development Programme
RDR: Rural Development Regulation
Study on cost of and good practices for FADN data collection
xi
REA: Survey on the Economic Performance of Farms (Italy)
REPS: Rural Environment Protection Scheme (Ireland)
RERC: Rural Economy Research Centre (Estonia)
RIAE: Research Institute of Agricultural Economics (Czech Republic)
RICA: Réseau d'Information Comptable Agricole
RIIAE: Research and Information Institute for Agricultural Economics
(Hungary)
ROCE: Return on Capital Employed
SCB: Statistika centralbyran (Sweden)
SCM: Standard Cost Model
SEK: Swedish Krona
SER: Service d'économie rurale (Luxembourg)
SFP: Single Farm Payment
SG: Scottish Government
SGM: Standard Gross Margin
SLR: Standard Labour Requirements
SMARTSOIL: Sustainable farm Management Aimed at Reducing Threats to SOILs
under climate change
SO: Standard Output
SPS: Single Payment Scheme
SRISE: Services régionaux de l’information statistique et économique (France)
SRUC: Scotland’s Rural College
SSP: Service de la Statistique et de la Prospective (France)
SUDAT: Latvian national farm survey
SVAPPAS: Sustainable Value Analysis of Policy and Performance in the Agricultural
Sector
TBN: German national farm accounts survey/ network
TI: Thünen Institute (Germany)
TIFF: Total Income from Farming
TS: Tender Specifications
UAA: Utilised agricultural area
USDA: United States Department of Agriculture
USDA-ERS: USDA Economic Research Service
USDA-NASS: USDA National Agricultural Statistics Service
WG: Welsh Government
WTO: World Trade Organization
Study on cost of and good practices for FADN data collection
xii
ABSTRACT
This study investigates the cost of and good practices for FADN data collection in EU
Member States during the period 2012-2014 using evidence gathered from existing
literature, a survey of EU-28 FADN Liaison Agencies, nine case studies, and interviews
with senior policy officials within the European Commission and the OECD. A desk-based
study of the comparator system in the USA was also undertaken. Costs were assessed
both in money terms and by labour input along the data supply chain. A variety of
institutional arrangements are used by Member States to provide data to FADN. Within
these, three types of organisation carry out the process of data collection: FADN Liaison
Agencies; public advisory bodies; and, accounting firms. Data collection by accounting
firms from accounts drawn up at the expense of farmers for tax purposes provides data
at the lowest public cost per farm. At the other extreme, highest costs per farm are
where advisory agencies combine data collection with provision of extension services.
FADN data are widely used by Member States and therefore bring substantial, if
unquantified, benefits. Examples of good practices which can be shared between
Member States and that are reflected principally in costs and benefits are identified.
RÉSUMÉ
Cette étude examine le coût de la collecte de données RICA et les bonnes pratiques qui y
sont liées dans les États membres de l'UE pour de la période 2012-2014. Les
informations pour cette étude ont été recueillies auprès de différentes sources: un
examen de la documentation existante; une enquête en ligne auprès des 28 organes de
liaison des États membres; des études de cas dans neuf États membres; et des
entrevues avec des hauts responsables de la DG AGRI et de l'OCDE. Une étude de cas
sur le système équivalent au RICA aux Etats-Unis, sur base d’un examen de la
documentation existante, a également été entreprise. Les coûts ont été évalués à la fois
en terme monétaire et en termes d'apport de travail tout au long de la chaîne
d'approvisionnement de données. Différents arrangements institutionnels sont utilisés
par les États membres afin de fournir des données RICA. Trois types d'organisation
effectuent le processus de collecte de données: les organes de liaison RICA; les services
de conseil publics; et les cabinets comptables. La collecte de données par des cabinets
comptables, en utilisant les comptes établis par les agriculteurs à des fins fiscales, est la
moins chère par exploitation en termes de coût public. À l'autre extrême, les coûts par
exploitation sont les plus élevés si les services de conseil publics combinent la collecte de
données avec les services de vulgarisation agricole. Les données RICA sont largement
utilisées par les États membres et donc elles apportent des avantages substantiels,
même si ces avantages ne sont pas quantifiables. Des exemples de bonnes pratiques qui
peuvent être partagées entre les États membres et qui se reflètent principalement dans
les coûts et les avantages sont identifiés.

Study on cost of and good practices for FADN data collection
xiii
EXECUTIVE SUMMARY
Introduction
The Farm Accountancy Data Network (FADN or EU-FADN) is an instrument, launched in
1965, for evaluating the incomes and business operation of agricultural holdings and the
impacts of the Common Agricultural Policy (CAP) viewed from the EU level. To do this it
uses data contributed by national farm accounts surveys in each Member State in the
form of completed “Farm Returns”. Member States receive a standard fee from the
Commission for each duly completed “Farm Return”, within certain rules established by
the FADN legislation. The current legal base is Council Regulation (EC) No 1217/2009.
In the interests of clarity, this report uses the term “FADN” or “EU-FADN” to refer to the
EU system (the latter where added clarity is needed) and the term “national farm
accounts survey(s)” to refer to the national systems which provide data for the FADN.
There can be benefits from using national farm survey data at the national level, and
most Member States take the opportunity provided by the need to contribute to FADN, as
well as the data collected, for their own purposes. Many Member States also collect and
use additional data beyond the requirements of FADN and/or maintain larger samples for
national reasons.
The organisation of the national farm surveys contributing data to FADN at national level,
the methods of collecting data and the related costs vary greatly across the EU. In the
absence of a comprehensive overview of national farm accounts survey data collection
methods and related costs, the Directorate-General for Agriculture and Rural
Development (DG AGRI) commissioned this study from Agra CEAS Consulting Ltd, in
association with Areté. In addition to providing an inventory of methods and costs, an
objective of the study was to help improve the data collection process (including data
quality and timeliness) through benchmarking and the sharing of best practice. The
study was organised into four themes (organisation and data collection methodologies;
costs; benefits; and, best practice which can be shared).
Methodology
This study used multiple methodologies to gather evidence. A literature review was the
starting point for descriptive chapters covering the EU policy framework for FADN and the
organisation and operation of national farm accounts surveys. The main body of
evidence was gathered through two methodologies, first an online survey of all 28
Member State Liaison Agencies (plus their counterparts in Norway and Switzerland) and,
second, case studies in nine EU Member States selected to cover the variety of
organisational structures used by Member States (plus a desk-based case study of the
USA equivalent to FADN, the Agricultural Resource Management Survey (ARMs)). Case
studies were carried out in Bulgaria, France, Germany, Italy, Lithuania, the Netherlands,
Poland, Sweden and the UK and covered more than half (56%) of all EU-FADN holdings.
The study benefited from a panel of expert advisors who peer-reviewed the analysis.
Additional information came, inter alia, from interviews with senior DG AGRI staff outside
the EU-FADN unit, senior OECD staff and participation in international workshops and
meetings.
Study on cost of and good practices for FADN data collection
xiv
Findings and conclusions
The organisation of FADN and methods of collecting the data
Legal framework: The EU-FADN Regulations apply within each Member State without
the need for national legislation. However, 16 Member States do have additional national
legislation, largely it appears to allocate tasks to institutions.
National legal constraints on the use of administrative records (which can offer a
potential way of reducing costs and minimising the burden on farmers) do not apply in
most Member States. Even where such restraints are found, access on a permissive
basis often offers a way by which this information can be used.
Legal constraints can extend to uses of data gathered from farms. The main such
constraint relates to the assurance of confidentiality given to farmers by the Regulation.
Our conclusion is that these legal restrictions on use do not constrain access to results at
the national level in a way that impacts significantly on the public benefits obtainable.
However, for some research purposes, access to individual farm data is desirable, and a
variety of arrangements can be found in Member States by which this is possible without
compromising disclosure assurances.
Establishment of national farm accounts surveys and current rationale: For many
Member States the establishment of national farm accounts surveys predated their
requirement to supply data to EU-FADN and was to serve national purposes. While EU
Membership carries this obligation to supply data, national purposes are still relevant.
Status of the Liaison Agencies: The status of the Liaison Agency is primarily a matter
of administrative convenience and there seems to be no obvious association between this
and the functioning of the national farm accounts survey, including the running costs.
Organisation of the FADN supply chain: There is considerable variety in terms of the
division of responsibilities along the FADN supply chain. Organisational structure within
individual Member States is fairly stable and is explained primarily by history (with a high
level of path dependence) and practical considerations.
National FADN Committees: The National FADN Committees typically have
representation from along the FADN supply chain. Many National FADN Committees have
additional functions beyond those set out in the EU-FADN legislation, although there is no
discernible impact on performance within these groups. Regional Committees are only
found in Belgium, Germany and Spain.
Representativeness of the sample: Agricultural production and area are well
represented by the FADN sample, but this applies far less to the proportion of holdings
(and by implication holders) within the FADN field of observation. Given this divergence,
EU-FADN is probably rather better suited for policy analyses relating to the economics of
agricultural production than it is to the more social aspects of the wellbeing of the wider
agricultural population. Any change in the current EU-FADN sample orientation towards
a greater coverage of holdings (and holders) would carry cost implications, but may also
bring additional benefits, which we recommend be considered should any change be
proposed.
Sample turnover and recruitment: Sample turnover is typically 10% or less. There is
substantial variation in the methods used by Member States to add fresh farms to their
national farm accounts survey. For family farms the two main approaches are: (i)
selection at random from a list of farms derived from the Farm Structure Survey; and,
(ii) selection from existing clients of data collectors. The first approach offers potential
statistical superiority, but a lower recruitment rate. The second approach may introduce

Study on cost of and good practices for FADN data collection
xv
selection bias (by focusing on farmers receiving advice), but by building on existing
relationships offers a higher success rate and therefore cheaper recruitment. Our
conclusion is that the approach used to recruit farms will carry cost implications, and that
there may be a trade-off with statistical quality, though this is by no means certain.
Farmer participation incentives: Participating farmers receive financial payments (at
various rates) in 11 Member States. Payment in kind, in the form of a set of completed
accounts, is provided in 14 Member States. Participating farmers are provided with
benchmarking data in 21 Member States and those in Member States where data are
collected by advisory/extension agents also benefit from specific advice based on their
documented performance. In conclusion, participating farmers receive different
incentives but it is not evident to what extent these are actually required to induce
cooperation or to improve sample retention. However, withdrawal of established
incentives could be expected to impact on participation.
Data collection methods and sources used: Data collection is a complex, though
fairly stable, process with most Member States (18) indicating more than one ‘main’
method. Even within a single Member State there may be different methods for small
farms who are not obliged (by national tax legislation) to keep accounts and for farms
that have corporate status. Data collection from farmers/farm secretaries is considered
to be a main data collection method in most Member States. Extraction of data by
private accounting firms from completed accounts is the main data collection method in
eight Member States. Data extracted from secondary sources such as registers and
administration systems is a main data collection methodology in 15 Member States.
Data recording methods: Member States use a range of data recording methods and
the balance between them will have cost implications; many Member States use more
than one method of recording data. The most widely used method remains paper
recording for subsequent electronic entry into the national farm accounts survey
database. Online entry is used in 16 Member States and offline entry in nine Member
States. Thirteen Member States extract data from farm accounting software packages.
Data validation: Data are generally validated at national level before entry to RICA-1,
the collection and verification system for the Commission’s EU-FADN database. For the
majority of Member States, this takes place at multiple points in the data supply chain. A
number of techniques are used, ranging from informal examination to deep scrutiny with
IT systems. There are three stages at which data can be validated before uploading to
the Commission’s RICA-1 (which then generates additional queries). Nine Member
States employ validation when data are (i) collected; (ii) entered into regional databases;
and, (iii) entered into the national farm accounts system. At the other end of the
spectrum, five Member States validate data only on entry into the national system.
Typology of national farm accounts surveys: Although it is possible to distinguish
groups of Member States with respect to various metrics, there is little consistency in
these groups when different categorisations are used. The most relevant typology in the
context of this study is by data collection methodology and this is likely to be a key
determinant of cost. Our conclusion is that Member States can broadly be divided into
three types: those where the Liaison Agency collects data (Type 1: C-LA); those where
data collection is carried out by public advisory services (Type 2: C-AS); and those which
collect data through a network of accounting firms (Type 3: C-AF).
The costs of collecting FADN data in Member States
Resource requirements: Resource requirements (labour usage) per completed Farm
Return, covering data collection, data processing and organisation (including validation),
were calculated for 21 Member States for which sufficient data were available. The
number of hours required by Liaison Agencies and data collectors per completed Farm

Study on cost of and good practices for FADN data collection
xvi
Return varied considerably between Member States with the data collection process
forming the most time-intensive activity. The share taken by this activity was higher
where the sample size was larger (as fixed costs were spread over a larger number of
holdings) and/or where the data collection methodology was more labour demanding.
A more exhaustive coverage of the complete data supply chain, including additional
elements not covered in the above analysis (such as time contributed by the farmer),
was possible for case study countries. This confirmed the wide diversity of labour
requirements: total time required per completed FADN Farm Return ranged from eight
hours in Germany to 63 in Poland.
Monetary costs: A similar finding comes from the analysis of costs. The total public
cost to budget of Member States for the EU-28, averaged for the 2012-14 period, was
just over €58 million. This amounts to a (weighted) average cost at the EU-28 level of
€678 per completed Farm Return but with considerable variation between Member
States, ranging from an average (2012-14) of €107 in Bulgaria and €156 in Romania, to
€2,905 in Belgium.
Factors explaining differences in cost: A number of factors can be identified that
explain, at least in part, the differences observed in monetary costs. Some of these
relate to the structure and nature of the national farm accounts survey, for example
relative scale and scope and different resource requirements resulting from different data
collection methods. Others relate to external factors such as different wage levels
between Member States and different average farm sizes within the FADN field of
observation.
The choice of data collection methodology can offset, at least to some extent, higher
costs arising from greater wage levels and from increased farm scale. The most efficient
form of data collection in terms of public cost is from existing accounts (which have been
produced at private cost) (Type 3: C-AF) and this approach is therefore most suited to
Member States with a large sample, large average farm size or high labour costs or any
combination of these. Of course, not all Member States require the production of
accounts for tax reasons, or at least not for all farms, and so cannot produce national
farm accounts survey data on this basis.
Costs of change or adaptation: National farm accounts surveys will be required to
adjust the scope or scale periodically to meet the changing needs of the policymakers
who form their main group of clients. While we conclude that the costs of adaptation will
be specific to each Member State, some general principles are evident. The cost of
changing the variables collected under national farm accounts surveys will be related to
the extent to which Member States are already collecting this information for national
purposes. Although extending the collection of any type of data to the Member States
that do not currently collect it would incur costs, these would be marginal to the basic
data collection infrastructure already in place. In the other direction, savings from
reducing the scope of EU-FADN coverage would be marginal, again as a result of the
existing data collection infrastructure. In both cases changes would have impacts on
benefits which would need to be taken into account.
Adjustments to sample size involve similar considerations. Any increase would incur
additional costs, but these would be marginal rather than average as the existing fixed
costs would be spread over a greater number of Farm Returns. Conversely, a reduction
in sample size would not lower the total by the average cost, but rather by the marginal
cost as fixed costs would be spread over fewer Farm Returns.

Study on cost of and good practices for FADN data collection
xvii
The benefits obtained from FADN data to Member States
A main conclusion concerning the benefits obtained from farm accounts survey data is
that these are hard to quantify in monetary terms that might be compared with the costs
of carrying out the surveys. The benefits obtained from making use of farm accounts
survey information take two main economic forms. First, there are the private benefits,
of which the main example will be those accruing to farm businesses in the form of
improved performance through, for example, using the data for benchmarking purposes.
These are, in principle, measurable, though there are substantial practical problems in
doing so. Second there are the public benefits linked to the use of the results to assist in
decisions by government on issues of policy; the need for information coming from
national farm accounts surveys was a prime reason why accounts surveys that pre-dated
the requirement to supply data to EU-FADN were originally set up. Better policy
decisions should in turn lead to better and more appropriate outcomes. The rationale for
spending public money on farm accounts surveys will be similar to those for maintaining
public statistics of any type. Similarly, the value to research of farm accounts results is
difficult to determine.
Access to results and data: With a few exceptions, our finding is that availability of the
results of national farm accounts survey results is good, although access to farm-level
raw data for research could be improved. Almost all Member States publish results from
their national farm accounts surveys with an apparent preference for electronic
publication. Public databases are available in 15 countries; this should greatly facilitate
access, though quite what this gives access to varies. In contrast to the availability of
standard results, access to farm-level data, a feature that obviously adds greatly to its
value as a research tool, is universally restricted, respecting the general principle of
maintaining confidentiality. However, often there are circumstances in which this may be
relaxed while at the same time safeguarding precautions are applied, or technical
solutions devised that make anonymous data accessible and costless (for example,
remote access to the Netherlands national farm accounts survey database and the Data
Builder tool in England within the UK).
Users and uses: A clear finding is that the data collected by national farm accounts
surveys are widely used by the national (and where appropriate regional) governments of
Member States. The data are almost universally used in policy formulation and
evaluation and are also a common source of data supplied to Eurostat for the Economic
Accounts for Agriculture or for similar accounts at national level; estimating costs of
production is another common use.
Results are widely (almost universally) used as the basis of providing extension and
advice to farmers, including in the form of benchmarking. This suggests that the various
organisational arrangements for collecting data from farms do not impact on this form of
use to an extent that can be detected. However, the impact on the economic
performance of participating farms that a combined approach to data collection and the
provision of advice may give rise to may be significant.
Valuing the benefits: To help fill the information gap on the value of national farm
accounts surveys to Member States, a set of contingency questions was put to relevant
government departments in case study countries to establish the perceived level of
present benefits in relation to the known costs. There was a wide range of responses to
the perception of the benefits compared with the total cost, from ‘lower’ in the UK
(England and Scotland) to ‘much higher’ in Germany and Poland. Overall, Bulgaria,
Germany, the Netherlands and Poland regarded their farm accounts surveys as
representing good value for money, and the UK (England) reasonable value.
Governmental use was clearly seen to be the principal beneficiary. Academic institutions
and research bodies came next, followed by farmers through advisors and extension

Study on cost of and good practices for FADN data collection
xviii
agents. Farmers benefitting directly and farmers’ lobby groups were seen as benefitting
the least. Our conclusion is that the perceived value of benefits relative to costs would
cause Member States to at least consider continuing with national farm accounts surveys
in the absence of a requirement to supply EU-FADN with data.
Best practices in FADN data collection and use that can be shared
Based on the types of evidence available to this study, a number of best practices exist
that should be considered for general adoption among Member States. Fundamental to
improving performance of national farm accounts surveys is the periodic carrying out of
evaluation, with associated monitoring exercises. We recommend that all Member States
introduce appropriate systems to examine both the costs of data collection and analysis,
the variability within this, and the reasons, and the uses to which the results are put.
Allied to this, we recommend collaboration at the EU level to introduce a common and
consistent evaluation framework.
In terms of collection of data, there are several specific examples of best practice:
The use of data already in accounts where these have to be kept for taxation
purposes;
the use of administrative data which can reduce data collection costs;
the provision of access to administrative data via consent that avoids the testing
of legal constraints;
the elimination of stages in the data supply chain that can reduce costs, remove
the causes of transcription error, speed the process and assist with validation.
The most elementary of these is the replacement of paper data entry by electronic
entry;
the carrying out of validation procedures at multiple points along the data supply
chain before data are entered into the national farm accounts system, and the
introduction of systems that learn from past experience; there may be the
opportunity for international cooperation in the design of programmes for this
purpose;
the necessity of making of payments to participating farmers should be
periodically reviewed.
The relatively low level of sample turnover allows panel data (longitudinal sample) to be
used to investigate issues such as exposure to risk and productivity growth. However,
the availability of panel data is currently by accident rather than design and this imposes
limits on its utility. An explicit longitudinal panel, within the overall sample and suitably
weighted, would increase the value of FADN as a research tool.
Where a fee is currently charged for access to data, consideration should be made to
removing this. However, a preferred solution is that offered by the UK (England) in
which access to the basic raw data is provided through a website which allows queries to
be raised and returns datasets while maintaining safeguards for confidentiality.
Finally, given the different practices across Member States, frequent lack of awareness of
what happens in other countries and a silo attitude to some developments (such as in
IT), we conclude that there are currently impediments to the free flow of information on
data collection. We recommend that consideration be given to how this might be
improved and cooperation fostered to reach solutions to common problems. These may
involve building on the existing framework provided by the EU-FADN Committee and its
associated working groups and the Pacioli network, but may also need to go beyond
these to form technical groups or task forces with the specific aim of sharing information
and spreading good practice.
Study on cost of and good practices for FADN data collection
1
1. INTRODUCTION
The concept of the Farm Accountancy Data Network (FADN or EU-FADN) was launched in
1965. The FADN is an instrument for evaluating the incomes and business operation of
agricultural holdings and the impacts of the Common Agricultural Policy (CAP) viewed
from the EU level. To do this it uses data contributed by national farm accounts surveys
in each Member State in the form of completed “Farm Returns”. Member States receive
a standard fee from the Commission for each duly completed “Farm Return”, within
certain rules established by the FADN legislation. Some of the national farm accounts
surveys pre-date FADN, but others were developed specifically to meet this requirement
of EU membership. The current legal base of EU-FADN is Council Regulation (EC) No
1217/2009.
In the interests of clarity, this report uses the term “FADN” or “EU-FADN” to refer to the
EU system (the latter where added clarity is needed) and the term “national farm
accounts survey(s)” to refer to the national systems which provide data for the FADN.
The terms “farm” and “holding” are used interchangeably.
There can be benefits from using national farm survey data at the national level, and
most Member States do use the opportunity provided by the need to contribute to FADN,
as well as the data collected, for their own purposes. Many Member States also collect
and use additional data beyond the requirements of FADN and/or maintain larger
samples for national reasons.
In the absence of any comprehensive overview of national farm accounts survey data
collection methods and related costs, the European Commission’s Directorate-General for
Agriculture and Rural Development (DG AGRI) requested tenders to carry out a study.
The Tender Specification1 for this work has shaped the nature and content of this
publication. The contractors were required to examine the methods by which Member
States collect data to feed into the FADN, the costs incurred in doing this, the benefits
obtained and to identify best practice. The underlying purpose of the study is to help
improve the data collection process (including data quality and timeliness) through
benchmarking and the sharing of good practice.
Agra CEAS Consulting Ltd, a joint venture between Informa plc and Imperial College
London, in association with Areté, was awarded the contract.
1.1. Overall approach to the study
In addition to some descriptive elements of the policy background to FADN data
collection and use, the report covers four Themes:
1. Organisation of FADN at Member State level and methods of collecting the data.
2. The costs of collecting FADN data in Member States.
3. The benefits obtained by member States from FADN data.
4. Best practices in FADN data collection and use that can be shared among Member
States.
These Themes were analysed on the basis of information gathered from a comprehensive
literature review and primary data collected through an online survey of Member State
Liaison Agencies plus case studies in nine Member States. Supplementary information on
the perceived value of EU-FADN results was collected through interviews with senior staff
in the Commission and other external users. A desk-based case study of the US
Agricultural Resource Management Survey (ARMS) provided a non-EU comparator.
1 http://ec.europa.eu/agriculture/calls-for-tender/tender-documents/2014/246799/specs_en.pdf

Study on cost of and good practices for FADN data collection
2
1.1.1. Distinguishing patterns in FADN data collection
This element of the study laid the foundation for the later stages. An early task was to
understand the ways in which national farm accounts surveys, which contribute data to
the FADN system, are organised and the data collection methodologies they use. A
typology of Member States was produced based on their method of data collection. This
typology then informed our selection of case study countries, alongside consideration of
the ways in which data are used, as well as for the later analysis.
1.1.2. Measuring the costs and benefits of FADN data collection
A key issue in comparing costs of collecting data for EU-FADN between Member States is
the need for an acceptable basis on which this can be undertaken. We used two
approaches: a top-down approach based on total budgetary cost, which was then
adjusted for different labour costs and for national samples that are larger than those
required under EU-FADN, was applied to all Member States; a bottom-up approach based
on the Standard Cost Model, i.e. distribution of cost according to labour inputs was
applied to our case study countries only.
The key issue to confront was the need to not compare simply in monetary terms given
the different cost base across the EU. To address this issue we considered costs in terms
of the resource required in full-time equivalent labour units as a first step (in line with
the Standard Cost Model approach, described later). The standardisation of labour cost
allowed a comparison between Member States with this important factor controlled for.
However, it is important to bear in mind that the differential cost of labour may make
some approaches more/less cost effective in some Member States than in others, and
this will need to be recalled when considering best practice.
Where a national farm accounts survey is used solely to provide data to FADN, all costs
associated with it should be assigned to the FADN data collection/processing system.
However, where national farm account surveys exceed the scale and/or scope of FADN, it
may not be appropriate to assign all costs to the FADN system. In some Member States,
national farm accounts surveys pre-dated the need for that country to supply FADN on
accession to the EU; clearly these were in a different situation when moving to meet their
FADN data obligations from those where a completely new system had to be established.
However, a Member State’s obligation to provide FADN with data would continue even if
there was no longer any perceived national requirement for a farm accounts survey. Our
basic assumption is that there are core costs of FADN which vary between countries and
reflect the organisation and collection method; if a Member State chooses to collect
additional data, the costs of doing so are the marginal elements. Member States may
benefit from the national use of basic FADN data. If additional costs are incurred through
more extensive collection (in terms of variables or numbers of sample farms), these will
have to be weighed by Member States against the additional benefits that can be
extracted. In practice in this study it was necessary to take a case-by-case approach to
this issue where the national farm accounts survey different in scale and/or scope from
the requirements of FADN.
Required resources were considered in total and also in terms of where they fall.
National farm accounts surveys which rely on considerable farmer involvement (either
directly or through the farmer’s employment of an accountant) may incur lower
budgetary costs for the FADN system, but at the expense of an increased burden on
participants or public extension services. We therefore developed a “FADN supply chain”
in each case study Member State which elaborated the process of data collection and in
so doing identified the stages and actors involved to which resource requirement should
be allocated.
Study on cost of and good practices for FADN data collection
3
1.1.3. Identifying explanatory factors
Our online survey identified the main reasons behind the organisation of national farm
surveys and data collection methodologies so that we can present an overview at the EU-
28 level. However, understanding the explanatory factors in greater detail was only
possible through our case studies. That said, the reasons behind certain organisational
and methodological approaches are likely to be similar and the material uncovered in the
case studies should therefore be capable of extrapolation to the EU-28.
It should be noted that, where national farm accounts surveys pre-date FADN, a key
determinant of organisation and data collection method will be simple path dependency
and the original rationale may be lost in the mists of time; while this may also apply to
more recently instigated surveys, it is likely to be to a lesser extent. It is also possible
that the approach taken historically would not have been taken more recently. It was
therefore important to consider within the case studies the extent to which the current
national farm survey would be implemented differently if it were to be started from
scratch (ab initio).
1.1.4. Identifying best practice that can be shared
In considering best practice we draw a distinction between approaches which could be
adopted by Member States in the short-term and those that would require longer-term
changes. We also make a distinction between what might be optimal in the long-term
and what might be achievable, i.e. a form of “constrained best practice” or “better
practice”; Poppe and Beers (1996a) note that it is not always easy to copy successful
innovation from one region to another (and in some cases it may not be possible).
Constraints of this nature are likely to include legal factors, such as the use which can be
made of tax records, which are unlikely to be altered by a Member State to facilitate the
collection of data in a specific sector of the economy.
An important guide to identifying best practice is the changes that Member States have
introduced in the recent past or plan to introduce in the near future. Our working
assumption behind changes made is that these will have been to reduce costs or
burdens, improve robustness or timeliness, take advantage of technological
developments or adapt to changes in policy requirements. This assumption was
challenged in the case studies; it may also be the case that changes were driven by other
reasons, but nonetheless had impacts in these areas. In some cases changes may have
resulted in a better cost/benefit ratio; alternatively changes could simply have
reallocated costs along the supply chain between activities and/or organisations involved
(including the Commission in terms of the extent to which data checks are required). As
well as pointing directly to best (or better) practice, the changes made, and other options
considered at the time, may also highlight approaches not to take.
1.2. Structure of the report
The structure of this report reflects the requirements of the Tender Specification for the
study. It begins with an explanation of the EU policy framework for FADN data collection
and use (Chapter 2), which provides essential background to the FADN system. The
methodology followed in carrying out this study is set out in Chapter 3. Chapter 4
describes the content of our inventory of the organisation, data collection methods,
resources and costs, and data uses in national farm accounts surveys. Our analysis of
the four study Themes is contained in Chapters 5 to 8 and our conclusions and
recommendations in Chapter 9.

Study on cost of and good practices for FADN data collection
4
2. THE EU POLICY FRAMEWORK FOR FADN DATA COLLECTION AND USE
2.1. The purpose of FADN
The FADN is an instrument for evaluating the income of agricultural holdings and the
impacts of the Common Agricultural Policy (CAP); it is one of a set of information tools
for managing the CAP (Bajek, 2015). The concept of the FADN was launched in 1965,
when Council Regulation 79/65/EEC of 15 June 19652 established the legal basis for the
organisation of the network. This base legislation has been amended several times and
Council Regulation (EC) No 1217/2009 of 30 November 2009 provided a codified version.
This legislation makes clear a number of points. First, the purpose of the FADN (recital
(2)):
“The development of the common agricultural policy requires that there should be
available objective and relevant information on incomes in the various categories of
agricultural holding and on the business operation of holdings coming within
categories which call for special attention at Community level”.
This purpose is elaborated by Article 1 and is worth quoting in full:
1. To meet the needs of the common agricultural policy, a Community network for
the collection of farm accountancy data is set up (hereinafter referred to as the
‘data network’).
2. The purpose of the data network shall be to collect the accountancy data needed
for, in particular:
a) an annual determination of incomes on agricultural holdings coming within
the field of the survey defined in Article 4; and
b) a business analysis of agricultural holdings.
3. The data obtained pursuant to this Regulation shall, in particular, serve as the
basis for the drawing up of reports by the Commission on the situation of
agriculture and of agricultural markets as well as on farm incomes in the
Community. The reports shall be submitted annually to the European Parliament
and the Council, in particular for the annual fixing of prices of agricultural
produce.
Specifically, Article 39 of the Treaty on the Functioning of the European Union (using the
same words as in the 1957 Treaty of Rome) notes that the objectives of the CAP (with
particular relevance to FADN) are:
a) to increase agricultural productivity by promoting technical progress and by
ensuring the rational development of agricultural production and the optimum
utilisation of the factors of production, in particular labour;
b) thus to ensure a fair standard of living for the agricultural community, in
particular by increasing the individual earnings of persons engaged in agriculture.
FADN is necessary to provide information about farmers’ incomes in order to assess
progress against Objective b). FADN offers the only source of harmonised farm data
which allows EU-wide comparisons and provides EU policy makers with an evidence base
on which to make informed decisions.
Wesseler (2015) reports on the first communication on FADN (dating from 1962) which
notes that the system would help the Commission in applying EU regulations already in
force and in developing the CAP.
2 The basic act currently in force is Council Regulation (EC) No 1217/2009 of 30 November 2009.

Study on cost of and good practices for FADN data collection
5
Impact assessments of prospective policy scenarios are carried out on economic,
environmental and social sustainability of farm businesses by sector, by Member State
and by region (European Commission, 2015). Bajek (2015) provides a list of the ways in
which FADN has been used by the Commission in the impact assessment of policy
proposals:
Pre-1992: Annual price package, various schemes (including LFA);
1992: MacSharry reform – price cuts, direct payments;
1998-99: Agenda 2000 – more price cuts, direct payments;
2002-03: 2003 reform – decoupled payments;
2003: EU sugar policy reform options;
2006: EU wine policy reform options;
2007-08: CAP Health Check 2008 (including milk quota abolition);
2012-13: CAP 2020 policy options;
2013: State aid in agriculture (de-minimis);
2015: CAP 2020 Member States’ choice of implementing options.
These impact assessments have been used to assess the effect on income (by type of
farm and by region) of introducing/withdrawing policies either progressively or
immediately, fully or partially, in a coupled, decoupled or recoupled manner and whether
limited or not by capping or modulation. Mainly it has been the impact of Pillar I
subsidies that have been examined using FADN data, but they have also been employed
in estimating the costs of “greening” measures.
Bajek (2015) also notes the use of FADN data in:
Annual budget planning for the CAP (share of direct payments below €5,000 per
Member State and per support scheme in the context of financial discipline).
Trade negotiations (price changes).
Risk in agriculture (price volatility).
Impact of crises (rising costs, impact of crop failure/disease).
The production of regular and occasional reports (covering farm economics and
income; margins and income in the milk, beef, cereals, pig fattening, olives, nuts
and rice sectors; production costs; organic farms; farming in Less Favoured
Areas; and, rural development support).
Plees (2015) reports on the use of FADN in evaluating policy implementation for DG
AGRI. Evaluation is a requirement for any policy using the EU budget and is an
opportunity to assess the performance of CAP, receive input for policy steering and
enhance the CAP’s acceptability and credibility. The importance of evaluation has risen
over time with increasing evaluation of non-spending programmes and examination of
the continuing rationale of policies. The use made of FADN has shifted; initially it was
used only for economic analysis, but later it began to be used to assess the
environmental impact of the CAP and as a data source for modelling.
Plees (2015) reports that 61 of 89 evaluations (69%) carried out by DG AGRI since 2000
depended on information from FADN. Three of these evaluations used FADN data at the
EU level, 19 at the Member State level and 39 at the regional level. FADN data were
used to study the following within these evaluations:
farm income (42);
intermediate consumption (32);
importance of subsidies (31);
margins (29);
Study on cost of and good practices for FADN data collection
6
cost of production (27); and,
farm structures (27).
The 2013 CAP reform introduced a monitoring and evaluation framework for the CAP
which is based, as far as possible, on existing information sources such as the FADN.
The Commission is aware of the strengths and weaknesses of FADN, as well as the
opportunities and threats, as evidenced by Wesseler (2015) which form a sub-set of
issues raised in this report.
2.2. Legislative requirements
Recital (3) of Regulation (EC) No 1217/2009 states that “the accounts of agricultural
holdings constitute the basic source of essential data for any assessment of incomes on
agricultural holdings or study of their business operation” while recital (4) notes that data
should be obtained from specially selected agricultural holdings and stresses the need for
a common approach to both the selection of holdings and definitions used. Recital (5)
stresses the voluntary nature of participation3.
The Regulation sets out the need for the sample accurately to reflect the structure of the
agricultural sector and makes clear that the main decisions concerning the selection of
holdings should be adopted at the national level with a regional dimension permitted
where this is appropriate.
Recital (14) explicitly makes clear that farmers are to be provided with assurances that
their accounts and other individual details obtained in connection with FADN will not be
used for taxation purposes, purposes other than those provided for in the Regulation or
divulged by persons involved in the FADN. This is addressed in detail under Article 16.
However, this assurance does not preclude the use by FADN of data assembled by
farmers for taxation purposes, or where national legislation allows this, the use of
taxation records to supply data to FADN.
Article 6 sets out the requirement for Member States to set up a National FADN
Committee which shall be responsible for the selection of returning holdings. This entails
responsibility for the selection plan and a report on the implementation of this plan.
Regional FADN committees (where they exist) must cooperate with the Liaison Agency in
selecting returning holdings.
Article 7 sets out the duties of the Liaison Agencies which include (in summary):
a) Informing the National Committee, Regional Committees and the accountancy
offices of the detailed rules of application concerning them and ensuring that
these are properly implemented.
b) Drawing up the selection plan for approval by the National Committee and
reporting on its implementation.
c) Compiling a list of returning holdings and a list of accountancy offices willing and
able to complete Farm Returns.
d) Collate completed Farm Returns and verify that they have been duly completed.
e) Forward duly completed returns to the Commission.
f) Liaise between the Commission, the National Committee and Regional Committees
as necessary.
3 However, senior DG AGRI staff wondered whether, in the future, it would be appropriate to make participation mandatory in exchange
for receiving public support.

Study on cost of and good practices for FADN data collection
7
Accountancy office(s) are contracted on the authority of Member States to provide duly
completed Farm Returns.
The FADN system therefore consists of an annual survey carried out in Member States on
a sample of their agricultural holdings. Although derived from national surveys, the
FADN is harmonised in that the bookkeeping principles and definition of the variables are
the same in all Member States, allowing comparability.
A Committee for the Farm Accountancy Data Network (the ‘Community Committee’,
established under Article 18 of Regulation (EC) No 1217/2009) assists the Commission in
the management of the FADN network at the EU level.
2.3. The FADN field of observation
Holdings are selected to take part in the survey on the basis of sampling plans
established at the level of each region in the EU (see above). FADN focuses on
agricultural holdings deemed to be commercial, in the sense that they are large enough
to provide a main activity for the farmer and a level of income sufficient to support his or
her family (Commission of the European Communities, 1985). However, the
interpretation of what is commercial has changed over time. The original Council
Regulation 79/65 stipulated that the field of survey should cover those agricultural
holdings, which (a) are run as market-oriented holdings; and, (b) provide the main
occupation of the operator. The most recent reference to the field of survey is in Article
2 of Regulation (EU) No 1198/2014, which explains that ‘the field of the survey
represents the largest possible share of agricultural output, agricultural area and farm
labour, of holdings run with a market orientation’.
During the first three years of FADN, data were taken only from agricultural holdings
having an area exceeding five hectares, with the exception of holdings producing wine,
fruit, vegetables and olives. In 1972 this was amended. In addition to being market-
oriented, and providing the main occupation of the operator, holdings were to be of a
size capable of employing at least one worker (one work unit) over a year, though this
threshold could be reduced to 0.75 work units (Hyvönen, 2004). These criteria implied a
discrimination against part-time farmers in the sample, but this was justified by the belief
that ‘main-living’ farms constituted the most important target for agricultural policy
measures, an interpretation which should not go unnoticed. However from 1982/83 a
new tool, Economic Size Units (ESUs), became available and subsequently selection
thresholds were made only in terms of these units (which are based on Standard Gross
Margin), later changed again to Economic Size (expressed in Standard Output terms).
No notice is intended to be taken when selecting the sample of any other gainful
activities in which the operator may engage.
Consequently, while the overwhelming majority of farming activity falls within the FADN
field of observation (approximately 90% of total agricultural production), only 42% of the
EU’s agricultural holdings found in its farm structure survey are represented (2015).
However, figures for the latter metric vary widely between countries. For example, in
Slovakia only 17% of farms are covered by FADN (but these represent 96% of the
economic activity), whereas in Ireland 75% of the farms are covered (with 98% of the
activity). Though numerically important, holdings below the FADN size thresholds
contribute very little in terms of agricultural activity4. In many Member States, especially
more recent additions to the Union, it is likely that the coverage within FADN of actual
4 By way of context, although not directly comparable to the FADN field of observation, European Parliament (2013) notes that in 2010
there were 8.1 million farms with UAA less than five hectares which together contributed 67% of all farm holdings and engaged 42% of
total Annual Work Units, but accounted for only 7% of total EU-27 UAA.

Study on cost of and good practices for FADN data collection
8
holdings is even lower because some fall below the minimum size threshold for inclusion
in the Structure Survey.
The EU-FADN size thresholds are proposed by Member States, discussed and then
approved by the Commission; an implementing Regulation is then adopted. The role of
size thresholds, as specified in Commission Delegated Regulation (EU) No 1198/2014, is
to allow representative results for the field of survey to be obtained. In doing this they
should “maximise the benefit/cost ratio and be determined with the aim of including in
the field of survey holdings that represent the largest possible share of agricultural
output, agricultural area and farm labour, of those holdings which are run with a market
orientation”.
No farms below a Standard Output (SO) size threshold of €2,000 are included in FADN at
all and no farms below €25,000 SO are included in Belgium, Germany, Luxembourg,
Netherlands, Slovakia or most of the UK5, or below €8,000 in Austria, Czech Republic,
Denmark, Finland, France, Ireland or Sweden. The consequence of this is that FADN
results for farms within these lower size classes must be treated with caution as they do
not encompass farms from every Member State. For example, in published EU-27
results, farms in the €2,000 to €8,000 size class only come from 14 countries6 and those
in the €8,000 to €25,000 size class 22 countries7. Only in results for farms with SO of
€25,000 and over are all Member States represented. This is important in making
observations about the relationship between variables and farm size using EU-level
results and also when drawing comparisons between Member States.
In summary, the FADN sample is not universal (in the sense that it does not attempt to
cover everyone engaged in agricultural activity, many of whose holdings are of very
small scale and who do so for hobby, self-supply or other non-commercial purposes).
The omission of farmers at the smaller end of the scale is important when viewing the
CAP as a policy directed at the standards of living of the persons engaged in agriculture,
as a policy aimed at supporting the viability of small farms, at the rural community or,
indeed, as a policy with implications for the environment and climate change (where
comprehensive coverage may be important). However, within its (limited) field of
observation, the methodology does provide data which are representative in terms of
region, economic size and type of farming and which also cover the vast majority of
agricultural production. Hence, FADN is likely to be valuable for the analysis of economic
policy relating to the agricultural sector. However, it is likely to be less useful for the
analysis of social policy relating to the rural population linked to ‘the land’.
2.4. National responsibility for FADN
Management of FADN is the responsibility of the national Liaison Agency. During our
reference period (2012-14), this role was undertaken by research institutes in 12
Member States that often, but not necessarily, conduct the data collection with its own
staff8. In 14 Member States the FADN was under the direct management of the Ministry
of Agriculture with data collection often outsourced, in some cases to an extension
service9, in other cases to a fiscal accounting office. Responsibility for FADN fell under
the government statistical department in two Member States.10 In 2015 responsibility for
FADN in Cyprus was transferred from the Agricultural Research Institute to the
Department of Agriculture.
5 The SO threshold is €15,000 in Northern Ireland. 6 BG, CY, EE, EL, ES, HU, IT, LT, LV, MT, PL, PT, RO and SI. 7 The additional eight Member States are AT, CZ, DK, FR, IE, FI, SI and UK (Northern Ireland). 8 CY, CZ, DE, EE, FI, HU, IT, LT, LV, NL, PL, SK. 9 AT, BE, BG, EL, ES, IE, FR, HR, LU, MT, PT, RO, SI, UK. 10 DK, SE.
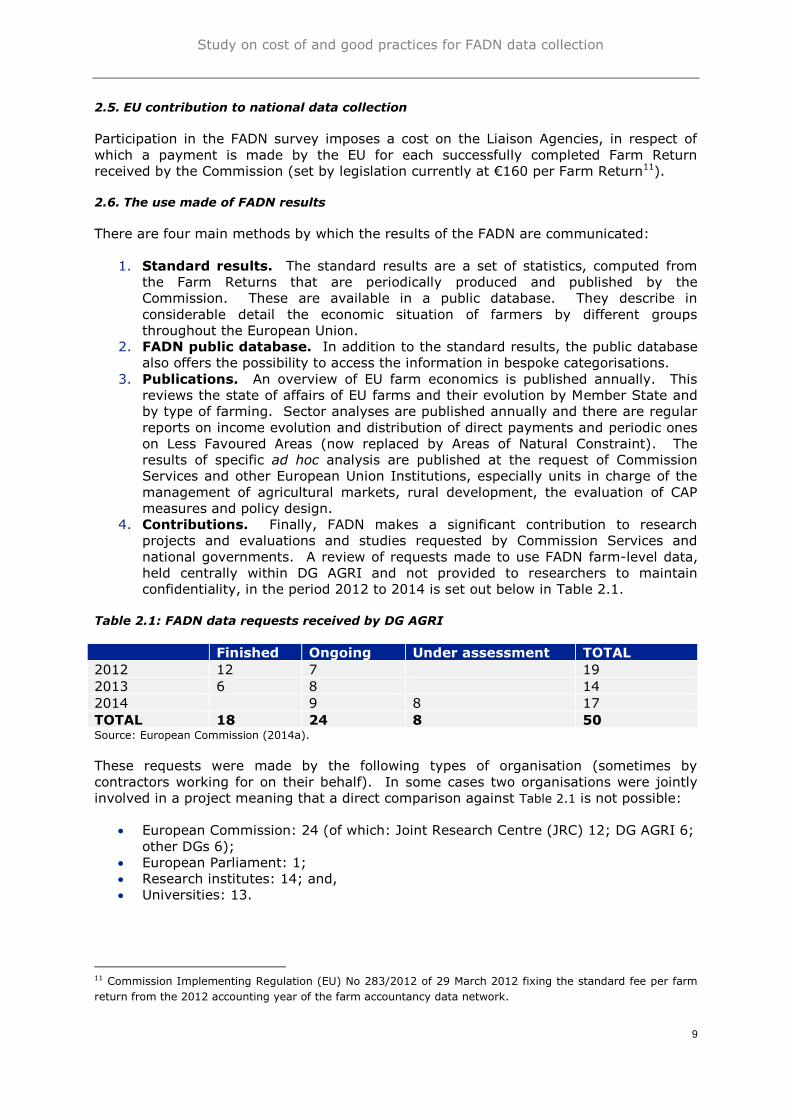
Study on cost of and good practices for FADN data collection
9
2.5. EU contribution to national data collection
Participation in the FADN survey imposes a cost on the Liaison Agencies, in respect of
which a payment is made by the EU for each successfully completed Farm Return
received by the Commission (set by legislation currently at €160 per Farm Return11).
2.6. The use made of FADN results
There are four main methods by which the results of the FADN are communicated:
1. Standard results. The standard results are a set of statistics, computed from
the Farm Returns that are periodically produced and published by the
Commission. These are available in a public database. They describe in
considerable detail the economic situation of farmers by different groups
throughout the European Union.
2. FADN public database. In addition to the standard results, the public database
also offers the possibility to access the information in bespoke categorisations.
3. Publications. An overview of EU farm economics is published annually. This
reviews the state of affairs of EU farms and their evolution by Member State and
by type of farming. Sector analyses are published annually and there are regular
reports on income evolution and distribution of direct payments and periodic ones
on Less Favoured Areas (now replaced by Areas of Natural Constraint). The
results of specific ad hoc analysis are published at the request of Commission
Services and other European Union Institutions, especially units in charge of the
management of agricultural markets, rural development, the evaluation of CAP
measures and policy design.
4. Contributions. Finally, FADN makes a significant contribution to research
projects and evaluations and studies requested by Commission Services and
national governments. A review of requests made to use FADN farm-level data,
held centrally within DG AGRI and not provided to researchers to maintain
confidentiality, in the period 2012 to 2014 is set out below in Table 2.1.
Table 2.1: FADN data requests received by DG AGRI
Finished Ongoing Under assessment TOTAL
2012 12 7 19
2013 6 8 14
2014 9 8 17
TOTAL 18 24 8 50 Source: European Commission (2014a).
These requests were made by the following types of organisation (sometimes by
contractors working for on their behalf). In some cases two organisations were jointly
involved in a project meaning that a direct comparison against Table 2.1 is not possible:
European Commission: 24 (of which: Joint Research Centre (JRC) 12; DG AGRI 6;
other DGs 6);
European Parliament: 1;
Research institutes: 14; and,
Universities: 13.
11 Commission Implementing Regulation (EU) No 283/2012 of 29 March 2012 fixing the standard fee per farm
return from the 2012 accounting year of the farm accountancy data network.
Study on cost of and good practices for FADN data collection
10
Within these requests FADN data were used (some projects belong in more than one
category and are therefore counted twice):
to evaluate, or assess the impact of, policy: 13;
to assess prospective policy or the impact on agriculture of alternative approaches:
13;
for economic studies: 11;
to build or develop sector models: 7;
to develop indicators: 4; and,
to investigate aspects of climate change: 4.

Study on cost of and good practices for FADN data collection
11
3. METHODOLOGY
3.1. Data collection tools
A number of methodologies were used in the conduct of this study. These are briefly
elaborated in the sub-sections below.
3.1.1. Brainstorming
The objective of this methodology was to make use of the contractor’s existing
knowledge of the national farm accounts survey data collection systems, of the use
Member States make of the results from the national farm accounts survey and of the
organisation and use of similar systems in third countries, plus the research expertise
within our team in order to assist with the structuring of the project and the development
of the various methodological tools (including specifically interview topic guides and
questionnaires). This methodology also utilised our panel of expert advisors (see below).
The output from this methodology was the elaboration of the overall approach to the
study, the development of the descriptive sections, the identification of sources of
information, the identification of the criteria for the selection of case studies, the
elaboration of the methodology and tools to be used (including case study structure and
defining the scope of the literature review). This methodology was also used to guide the
analysis and reporting phases.
Regular brainstorming sessions took place throughout the study for the purposes set out
above. The study team held a number of discursive meetings to refine our approach to
the study. The output from these sessions included the questionnaire used in the online
survey, the topic guide employed in the discussion held in case study countries, the
proposed analysis to be undertaken and the structure and content of reporting.
3.1.2. Expert advisory team
The objective of this methodology was to provide guidance, advice and validation at key
stages of the study.
The output from our use of the expert advisors fed into various stages of the study, but
was especially important in our analysis and in validating our conclusions.
We established a panel of high level expert advisors to help guide the study. These
were:
David Cawley, formerly senior economist at Defra and one time UK representative
on the FADN Committee
Professor Sophia Davidova, Professor of European Agricultural Policy, University of
Kent
Dr Shingo Kimura, Organisation for Economic Co-operation and Development
(OECD)
Dr Laure Latruffe, Researcher in Applied Agricultural Economics, Institut national
de la recherche agronomique (INRA)
Professor Cristina Salvioni, Associate Professor of Agricultural Economics,
University of Chieti-Pescara
The expert advisors were used at strategic points in the study to provide advice and
guidance to the study team. At an early stage this was especially important in providing
advice on information sources to be used and in designing the online survey

Study on cost of and good practices for FADN data collection
12
questionnaire and setting out the case study topic guide. As the study progressed the
expertise of our advisors was helpful in making the final case study selection and in peer-
reviewing our analysis, conclusions and recommendations. We retained a flexible
approach and requested feedback from individual team members where we felt that this
would be useful. Of particular note was the contribution of Dr Laure Latruffe to the
French case study.
3.1.3. Literature review
The objective of this methodology was to gather as much data and relevant literature as
possible and to identify the precise relevance of this data/literature to the different study
themes.
The output from our literature review provided an evidence base which was used, in
particular, in constructing the descriptive chapters and in addressing all four study
themes. The literature review also played a role in identifying the criteria for selecting
the case studies.
The literature review was dynamic in that it was updated with information coming to light
throughout the project. The identification of literature was facilitated by our team’s
extensive knowledge of national farm accounts surveys and the FADN system and how it
is built up in a range of Member States. This meant that the risk of important
information sources being missed was considerably reduced. In practice, the majority of
the literature of direct relevance to this study is contained within a few sources, mainly
the Pacioli workshop reports, and a series of unpublished papers made available by the
FADN unit within DG AGRI.
Once identified, literature was screened for relevance. For example, the Pacioli
workshop reports were read to identify which contained material relating to the themes
under consideration in this study. The collection of literature was simply a logistical
task which involved retrieval of the articles to be reviewed. Once collected, literature
was reviewed in detail and used to construct our literature review.
3.1.4. Online survey
The objective of the online survey was to gather comparable information for all 28
Member States on the organisational structure of the national farm surveys, data
collection methodologies, costs (resource use and financial) and the uses to which the
data are put at national level.
The main output from this survey was a comprehensive and consistent dataset for the
inventory of national approaches and the establishment of a typology of approaches to
validate the selection of case study countries. Additional outputs include a headline view
of the situation across all EU-28 Member States, including cost information where this
has been supplied. The online survey results were used in the analysis of the study
themes.
An online survey of FADN Liaison Agencies in each Member State (and their equivalents
in Norway and Switzerland) was carried out. The survey was designed to be easy to
complete with a focus on closed questions. The intention was that the FADN Liaison
Agencies could complete the questionnaire with known information without the need for
additional research. An exception to this was the section on resource requirements and
costs. Although we did not expect to receive comprehensive answers here, in practice
response rates were better than anticipated.

Study on cost of and good practices for FADN data collection
13
The questionnaire was developed from the requirements for the inventory and was
designed explicitly to populate this in a consistent manner; too much of the material in
the literature was not comparable in either time or scope. The final version of the
questionnaire benefited from comments provided by our expert advisors and the study’s
Steering Group (coordinated by DG AGRI). Responses were facilitated by the opportunity
provided to the contractor by the Commission to attend the 194th FADN Committee
Meeting in Brussels on 11 March, 2015, at which the Commission introduced the study to
Member State Liaison Agency delegates and requested cooperation with the study. The
contractor stressed the importance of completing the online questionnaire and requested
assistance.
Once finalised the questionnaire was transformed into an online script for use with our
online survey software (Surveymonkey). A contact list provided by the DG AGRI FADN
unit was used to disseminate the survey which was launched on 26 March, 2015.
Ultimately responses were received from the EU-28 (plus Norway and Switzerland).
The survey responses were subjected to a validation process and amendment where
necessary. We are confident that the replies received and validated provide
comprehensive and accurate information.
3.1.5. Case studies
The objective of our case studies was to provide detailed information on the
organisation of the national farm survey data collection systems, the methodologies used
to obtain the data, the costs of implementation on a total and marginal basis and the use
to which national farm accounts survey data are currently put. By selecting the case
studies to take account of the diversity of organisational and methodological approaches
we ensured that they are representative of the approach taken in the EU-28 as a whole.
The output from the case studies was a series of Member State fiches providing (i) a
description of the organisation of the national farm survey data collection network; (ii)
description of the methodological approach to data collection; (iii) an assessment of the
costs involved in data collection; and, (iv) a description of the national uses to which the
national farm accounts survey data are currently put. The information gathered formed
part of the evidence base on which the analysis of the themes was carried out.
3.1.5.1. Selection of case studies
It was agreed that the final case study selection should cover the majority of collected
FADN data. This provided the first constraint in selecting our case studies: the need to
include at least three of the four Member States with the largest FADN samples, i.e.
Germany, Italy, Poland and Spain.
The second constraint was the need to ensure that the case studies selected covered
each of the main patterns of data collection within national farm accounts surveys. Our
literature review was used to address this second criterion, though it was recognised that
some of the information may have been outdated or incomplete (case studies had to be
chosen in advance of the results of the on-line survey coming to hand). In doing this our
selection focused on the need to understand the resource and cost implications of
different approaches to data collection. We considered the organisation of the national
farm accounts survey, including which organisation collects the data and how this
organisation relates to the Liaison Agency (data collected by employees of the Liaison
Agency, accounting firms, etc.). We also considered the data collection methodology
(based on the mixture of existing administrative records, the use of information from
accounts and primary data collection from farmers).

Study on cost of and good practices for FADN data collection
14
Based on the above constraints, a proposal was made to carry out case studies in the
Member States presented in Table 3.1. The first three were included in order to ensure
that, overall, the majority of FADN sample farms was covered. Additional reasons for
selecting these Member States were:
Germany: partial use of administrative records, use of accountancy firms, federal
structure with regional variations (on the advice of the Liaison Agency we decided
to focus on Bavaria and Sachsen-Anhalt to provide a contrast in circumstances).
Italy: 19 regions and 2 autonomous provinces, very heterogeneous in scale and
type of farming.
Poland: new Member State, heterogeneous farm sizes, data collected by
agricultural advisory centres.
We also felt that there was a strong rationale for including:
Sweden: extensive use of administrative records and the designation of the
national statistics organisation as FADN Liaison Agency.
Netherlands: some use of administrative records, sophisticated use of IT and
long established uses of the data.
UK: long-standing national farm accounts system and use of universities to collect
data under a tendering arrangement.
The rationale for selecting the remaining three case studies was less compelling. In the
interests of providing a good balance between the EU-15 and new Member States we
suggested that two of these should be relatively recent additions to the Union. A Baltic
State and Black Sea Member State were proposed to provide geographic balance. In
order to cover the most FADN sample farms (and thereby respect the first criteria) we
selected Lithuania and Bulgaria; this also provided one Member State where the
Liaison Agency is the Ministry (Bulgaria) and one where it is an institute (Lithuania). We
selected France as the remaining case study country to ensure that our total coverage
exceeded 50% of FADN sample farms. France also has a substantial number of farms for
which the keeping of accounts is not required by the national tax system and because of
the regional approach taken there. Table 3.1 presents the case study countries selected
which together account for 56% of the total FADN sample.
Table 3.1: Case study coverage
Member
State
Contribution
to coverage
Reason for selection
Bulgaria 3%% Liaison Agency: Ministry.
Economic Size threshold low and therefore small
farms are included.
Different approach to data collection depending on
existence of accounts.
Data collection by advisory service.
Data collection via multiple farm visits and recorded
on paper.
No national validation of data.
National system introduced to meet the
requirements of FADN.
Data provision to external users is restricted.
Geographical balance and new Member State.
Germany 10%% Accounts for a major proportion of total Farm
Returns.

Study on cost of and good practices for FADN data collection
15
Member
State
Contribution
to coverage
Reason for selection
Liaison Agency: Institute. Federal structure with
regional variations.
National system pre-dates FADN.
National sample includes farms under the FADN size
threshold, use of additional selection criteria and
collection of additional output information; the
national sample is much larger than the EU FADN
sample.
Some data on household incomes is collected, but
only for farms run by individuals.
Data collected by accountancy firms and provided by
farmers depending on whether there are existing
accounts.
Payments made to farmers.
France 9%% Accounts for a major proportion of total Farm
Returns.
Liaison Agency: Ministry.
Regional approach.
Data collection by accountancy firms.
National selection ensures farms falling within the
fixed tax regime and those compiling standard tax
returns are included.
Collection of additional output information.
Data collected from accounts and via farm visits.
Italy 13%% Accounts for a major proportion of total Farm
Returns.
Liaison Agency: Institute.
19 regions and 2 autonomous provinces, very
heterogeneous in scale and type of farming.
National system includes parallel survey for the
Economic Accounts for Agriculture (EAA) which also
covers smaller farms.
Data collection by Institute.
Compulsory participation.
Collection of additional output information.
Lithuania 1%% Liaison Agency: Institute.
Lithuanian Agricultural Advisory Service (LAAS)
collects data from family farms; (Lithuanian Institute
of Agricultural Economics, LIAE), Liaison Agency)
collects data from agricultural companies.
Geographical balance.
New Member State.
Netherlands 2%% Liaison Agency: Institute.
Additional national criteria for stratification of field of
survey.
Use of different size classes within farm type and
separate stratum for organic and nationally
important sectors.
Maximum size threshold and limits on proportion of
non-agricultural income.
Additional data collected.
Data collection is carried out by the Liaison Agency’s
regional data collectors.
Data collection based on documentary evidence as
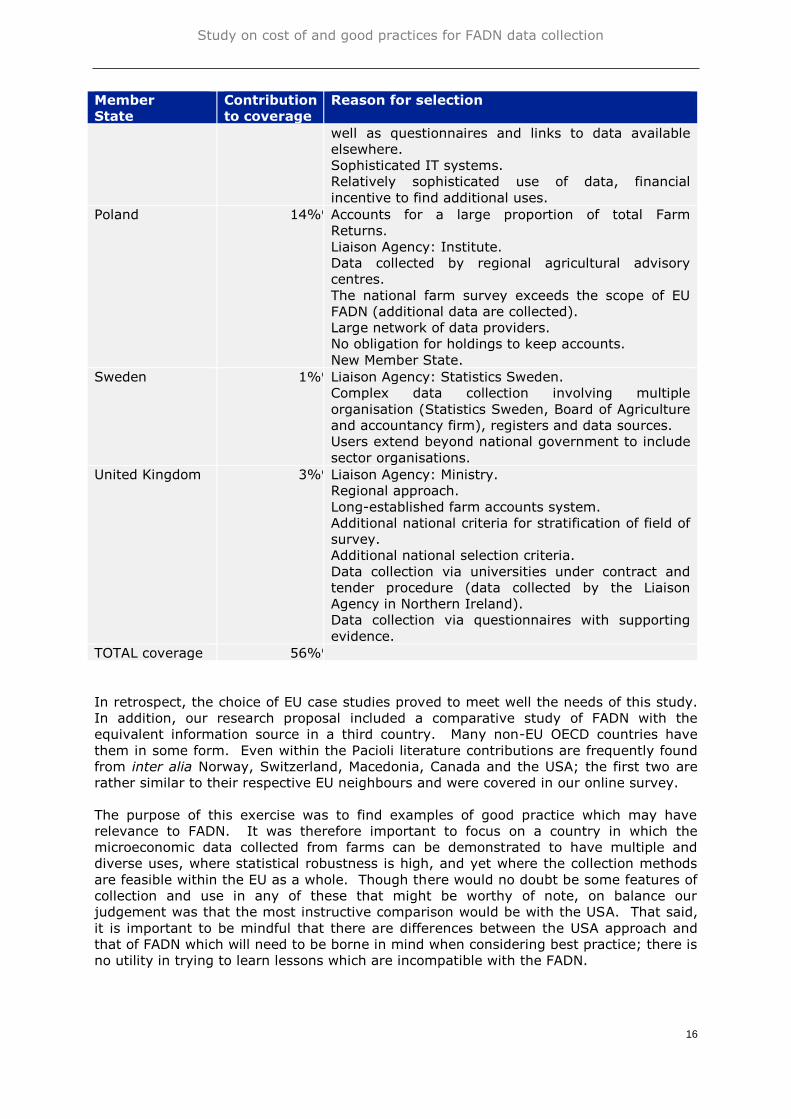
Study on cost of and good practices for FADN data collection
16
Member
State
Contribution
to coverage
Reason for selection
well as questionnaires and links to data available
elsewhere.
Sophisticated IT systems.
Relatively sophisticated use of data, financial
incentive to find additional uses.
Poland 14%% Accounts for a large proportion of total Farm
Returns.
Liaison Agency: Institute.
Data collected by regional agricultural advisory
centres.
The national farm survey exceeds the scope of EU
FADN (additional data are collected).
Large network of data providers.
No obligation for holdings to keep accounts.
New Member State.
Sweden 1%% Liaison Agency: Statistics Sweden.
Complex data collection involving multiple
organisation (Statistics Sweden, Board of Agriculture
and accountancy firm), registers and data sources.
Users extend beyond national government to include
sector organisations.
United Kingdom 3%% Liaison Agency: Ministry.
Regional approach.
Long-established farm accounts system.
Additional national criteria for stratification of field of
survey.
Additional national selection criteria.
Data collection via universities under contract and
tender procedure (data collected by the Liaison
Agency in Northern Ireland).
Data collection via questionnaires with supporting
evidence.
TOTAL coverage 56%%
In retrospect, the choice of EU case studies proved to meet well the needs of this study.
In addition, our research proposal included a comparative study of FADN with the
equivalent information source in a third country. Many non-EU OECD countries have
them in some form. Even within the Pacioli literature contributions are frequently found
from inter alia Norway, Switzerland, Macedonia, Canada and the USA; the first two are
rather similar to their respective EU neighbours and were covered in our online survey.
The purpose of this exercise was to find examples of good practice which may have
relevance to FADN. It was therefore important to focus on a country in which the
microeconomic data collected from farms can be demonstrated to have multiple and
diverse uses, where statistical robustness is high, and yet where the collection methods
are feasible within the EU as a whole. Though there would no doubt be some features of
collection and use in any of these that might be worthy of note, on balance our
judgement was that the most instructive comparison would be with the USA. That said,
it is important to be mindful that there are differences between the USA approach and
that of FADN which will need to be borne in mind when considering best practice; there is
no utility in trying to learn lessons which are incompatible with the FADN.
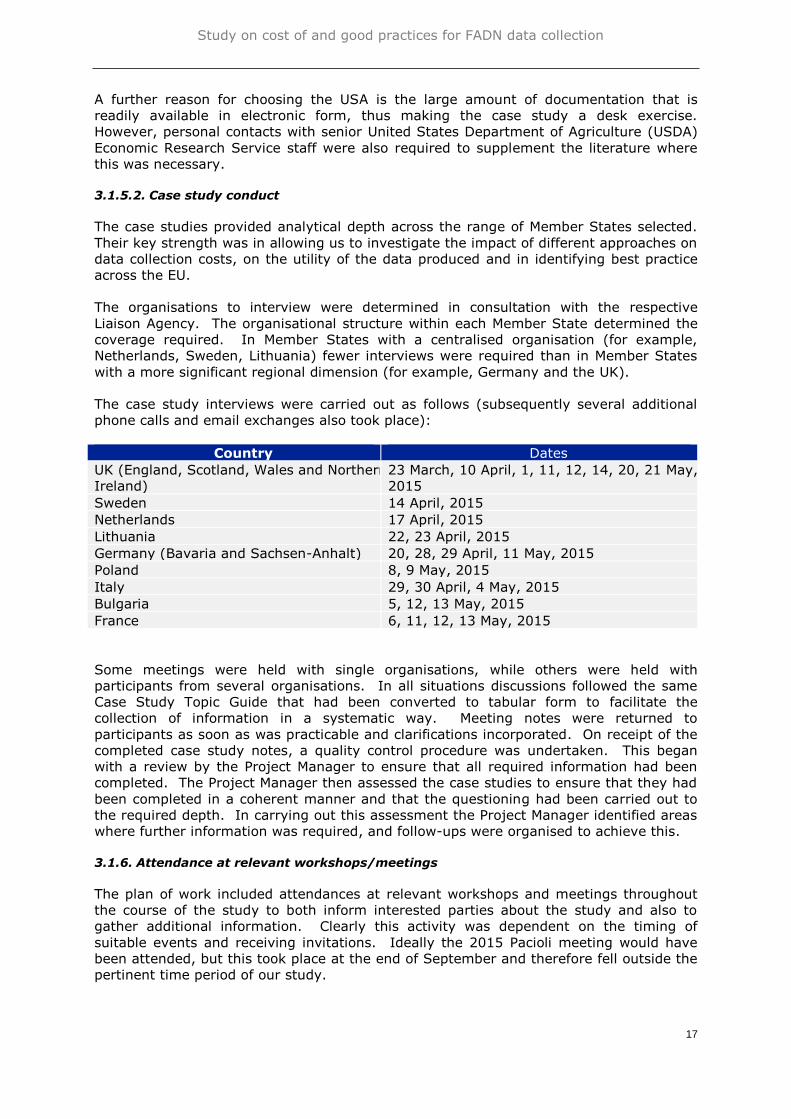
Study on cost of and good practices for FADN data collection
17
A further reason for choosing the USA is the large amount of documentation that is
readily available in electronic form, thus making the case study a desk exercise.
However, personal contacts with senior United States Department of Agriculture (USDA)
Economic Research Service staff were also required to supplement the literature where
this was necessary.
3.1.5.2. Case study conduct
The case studies provided analytical depth across the range of Member States selected.
Their key strength was in allowing us to investigate the impact of different approaches on
data collection costs, on the utility of the data produced and in identifying best practice
across the EU.
The organisations to interview were determined in consultation with the respective
Liaison Agency. The organisational structure within each Member State determined the
coverage required. In Member States with a centralised organisation (for example,
Netherlands, Sweden, Lithuania) fewer interviews were required than in Member States
with a more significant regional dimension (for example, Germany and the UK).
The case study interviews were carried out as follows (subsequently several additional
phone calls and email exchanges also took place):
Country Dates
UK (England, Scotland, Wales and Northern
Ireland)
23 March, 10 April, 1, 11, 12, 14, 20, 21 May,
2015
Sweden 14 April, 2015
Netherlands 17 April, 2015
Lithuania 22, 23 April, 2015
Germany (Bavaria and Sachsen-Anhalt) 20, 28, 29 April, 11 May, 2015
Poland 8, 9 May, 2015
Italy 29, 30 April, 4 May, 2015
Bulgaria 5, 12, 13 May, 2015
France 6, 11, 12, 13 May, 2015
Some meetings were held with single organisations, while others were held with
participants from several organisations. In all situations discussions followed the same
Case Study Topic Guide that had been converted to tabular form to facilitate the
collection of information in a systematic way. Meeting notes were returned to
participants as soon as was practicable and clarifications incorporated. On receipt of the
completed case study notes, a quality control procedure was undertaken. This began
with a review by the Project Manager to ensure that all required information had been
completed. The Project Manager then assessed the case studies to ensure that they had
been completed in a coherent manner and that the questioning had been carried out to
the required depth. In carrying out this assessment the Project Manager identified areas
where further information was required, and follow-ups were organised to achieve this.
3.1.6. Attendance at relevant workshops/meetings
The plan of work included attendances at relevant workshops and meetings throughout
the course of the study to both inform interested parties about the study and also to
gather additional information. Clearly this activity was dependent on the timing of
suitable events and receiving invitations. Ideally the 2015 Pacioli meeting would have
been attended, but this took place at the end of September and therefore fell outside the
pertinent time period of our study.

Study on cost of and good practices for FADN data collection
18
Nevertheless, several opportunities arose that were more timely. As noted above, an
invitation was accepted to attend the 194th meeting of the FADN committee in Brussels
(11 March, 2015). This provided an opportunity to explain the purpose of the study,
briefly inform delegates about its organisation, stage of the work and encourage
cooperation with the study. The contractor also took the opportunity to network with
Member State officials who would be targeted by the online survey and the case studies.
Members of the study team attended the 89th Annual Conference of the Agricultural
Economics Society at the University of Warwick, England on 13 - 15 April, 2015, the 29th
International Conference of Agricultural Economists in Milan, Italy on 9 – 14 August,
2015 and the Rural Business Research and Defra Farm Business Survey Seminar in
London, 9 September, 2015. These conferences provided an opportunity to talk to many
members of the international agricultural economic research community about their use
of FADN data in research; members of government departments which use FADN data
were also in attendance and many useful insights were gleaned. The contacts provided
and suggestions made provided useful background, particularly on access to FADN data
for research purposes and the uses to which FADN data are put.
3.1.7. Interviews outside the FADN data supply chain
Interviews were held with several people during the course of our case studies who also
have wider expertise of FADN, for example, the current coordinator of the FP7 FLINT
project12 and the organiser of the Pacioli network. Additional interviews were held with
senior Commission officials who are able to comment on FADN from a wider perspective.
Similarly, discussions were held with a senior official within the OECD and a UK Defra
official in the EU and International Directorate who were able to take an overview and
were able to comment on FADN from the perspective of making international
comparisions for policy purposes. The list of interviewees is as follows:
Jens Schaps, Director, Directorate C - Single CMO, economics and analysis of
agricultural markets, DG AGRI
Pierre Bascou, Director, Directorate D – Direct support, DG AGRI
Tassos Haniotis, Director, Directorate E - Economic analysis, perspectives and
evaluation; communication, DG AGRI
Josefine Loriz-Hoffmann, Director, Directorate F - Rural development programmes
I, DG AGRI
John Bensted-Smith, Director of the JRC Institute for Prospective Technological
Studies (IPTS)
Catherine Moreddu, Trade and Agriculture Directorate, OECD
Grant Davies, Economic Advisor, CAP Analysis & Reform, Better Regulation, EU
and International Directorate, Department for Environment, Food and Rural Affairs
(Defra)
12 FLINT (Farm Level Indicators for New Topics in Policy Evaluation) is an EU Framework 7 project which will
define Farm Level Indicators to improve the policy evaluation on, inter alia, cross-compliance, sustainability and
innovation in the CAP. The data collection on these indicators will be linked to the FADN Network to the extent
possible, although alternatives will be explored. Project reference: 613800.

Study on cost of and good practices for FADN data collection
19
4. THE LEGAL, INSTITUTIONAL, ORGANISATIONAL AND ECONOMIC
FRAMEWORK AT MEMBER STATE LEVEL
Inventories setting out the organisation of FADN in each EU Member State, including how
data are collected, have been populated from our literature review, our online survey and
our cases studies; these were used as an evidence base for the analysis. Key
information which can be used to quickly compare the situation between Member States
contains the following categories and items:
Organisational issues
FADN Liaison Agency
Actors involved in:
- Sample creation/selection
- Sample recruitment
- Data collection
- Data checking/validation
- Submission to RICA-1
- National publication of results
- Feedback to participating farmers
Number of FADN regions
National farm accounts survey established
National sample size
Scope of coverage (additional variables)
Depth of coverage (i.e. greater detail)
Economic size threshold (Standard Output)
FADN sample size
Field of observation coverage
Annual change in sample (2012-2014)
Incentives used for farmer participation
Data collection methodologies
Main data collection methodologies
Data sources
Data recording method
Data validation stages
Release of validated data
FADN resources and costs
Total expenditure on the national farm accounts survey (2012-14 average)
Average cost per completed FADN Farm Return (2012-14 average)
Average cost per completed national Farm Return (2012-14 average)
Liaison Agency staff required for data organisation and processing (including
validation)
Liaison Agency staff required for data collection (if applicable)
Other data collection staff
Average number of completed Farm Returns per full-time equivalent (FTE) data
collector

Study on cost of and good practices for FADN data collection
20
Data use
Use by national and/or regional government
Use by other organisations and farmers
Access to an online national farm accounts survey database
It should be noted that this Inventory of key information does not contain a category on
legislation. The legal framework within which farm accounts surveys operate was, in the
years 2010-12 (which formed the specified reference period for this study), Council
Regulation (EC) No 1217/2009 of 30 November 2009, described in detail in section 5
below. There is also related implementing legislation. Because this legislation is in the
form of a Regulation it is directly applicable in all Member States.
However, certain Member States have additional national legislation directly relating to
their national farm surveys. Sometimes this national legislation refers to setting up the
infrastructure and data collection processes in advance of joining the FADN network. In
other countries there is national legislation covering issues such as data confidentiality.
There are also situations where undertakings (i.e. assurances rather than specific law)
have been given to cooperating farmers which place a restriction on the freedom of FADN
to integrate with other data sources. Again, section 5 below provides more details. The
ability to develop FADN in certain directions may face constraints as a result of these
legal and quasi-legal restrictions.
National legislation is detailed in the online survey results, but is not contained in the
summary of key information because it does not materially impact on the operation of
the FADN network.

Study on cost of and good practices for FADN data collection
21
5. ORGANISATION OF FADN AND METHODS OF COLLECTING THE DATA
This section is concerned with the analysis of Theme 1 of this study (see section 1.1
above for a list of the Themes) and reports on the organisation of farm accounts surveys
in Member States and their data collection methods. The analysis draws on evidence
from our online survey, the case studies and the literature review. Where patterns can
be identified in this evidence, these are described. The analysis covers all EU-28 Member
States and culminates in the production of a typology by data collection method which is
then used to structure the analysis from Chapter 6 onwards. A retro-fitting of the
typology to the analysis in this Chapter reveals very little. On occasions where it appears
that there is a pattern this is mentioned in a footnote.
5.1. Legal framework and background to the national farm surveys
Before the framework in which FADN operates at Member State level can be understood
and its organisation appreciated, it is first necessary to set out the legal framework and,
second, the circumstances in which the contribution by Member States to EU-FADN was
established. Path dependency is a feature of decisions in public policy, not least in that
relating to agriculture, and this is also a characteristic common in the collection of FADN
data.
5.1.1. Legal framework
5.1.1.1. General legislation
The EU-FADN legislation is in the form of Regulations (rather than Directives) and
therefore applies in each Member State without the need for additional national
legislation. However, in 16 Member States there is additional national legislation. As a
generality, national legislation is more common in Member States which joined the EU in
2004 or subsequently (it is found in Bulgaria, Croatia, Cyprus, Czech Republic, Hungary,
Latvia, Lithuania, Poland, Romania, Slovakia and Slovenia). Only Austria, France,
Germany, Greece and Luxembourg among the EU-15 Member States have national
legislation. Estonia and Malta are the only relatively new Member States which do not
have additional national legislation.
Our case studies in Bulgaria, Lithuania and Poland (and scrutiny of the legislation in
the non-case study countries) revealed that national legislation was required to establish,
prior to accession, the mandate for a national farm survey which accorded with FADN
requirements. After accession the implementation of the national farm survey operated
under the EU legislation. National legislation typically designated the Liaison Agency and
established the composition and mandate of the National FADN Committee. Data-
collecting organisations are also sometimes specified. Much of the national legislation,
however, sets out definitions and clarifies operational aspects that are set out in the EU
Regulations, such as that participation is voluntary and that data are not to be used for
tax purposes. National legislation was not deemed necessary in Estonia, probably
because a national farm survey was in use from 1997, i.e. sometime before accession.
The national legislation in Germany dates to 1955 (in the former Federal Republic of
Germany) and established the national farm accounts survey. The national legislation in
France merely makes reference to the EU Regulation and sets out the implementation of
FADN in France; the Greek legislation performs a similar function. The legislation in
Luxembourg is the general legislation on rural development and stipulates that the
beneficiaries of investment aid may be required to provide accounting information; it is
not clear whether this is within the framework of the national farm accounts survey or
separate from it as in Germany.

Study on cost of and good practices for FADN data collection
22
There are legal constraints relating to the national farm survey in a number of Member
States. In France, Romania and Sweden there are constraints on the data collection
methods. (This is also the case in Norway.)
5.1.1.2. Legislation on national uses of existing data
Another aspect of the legal framework of relevance to this study relates to the potential
use of existing data relating to individual farms. One form of this are the legal
constraints on the use of various administrative data, by which we infer Integrated
Administration and Control System (IACS) records, agricultural census material, etc.
taken from registers held by the source organisations (printed output from these
organisations supplied by the farmer is not included).
In the online survey six Member States reported constraints on the use of administrative
records, though in practice the situation is not always clear cut; among non-case study
countries, those reporting legal constraints were Belgium, Cyprus, Czech Republic,
Slovenia (and Norway). However, the case study countries showed that the real
situation concerning access can be more nuanced. In Germany, the strict position is
that access to administrative records for completion of parts of the national farm
accounts return is not permitted (although revision of this situation is under
consideration). However, we were told in discussions with data collectors that, in
practice, administrative databases such as IACS and cattle tracing systems (HIT) are
used by bookkeepers/data collectors to verify data gathered from farmers, and access
does not require the permission of farmers; these data are made available by Länder
administrations. In the Netherlands, another case study country, the general laws on
confidentiality mean that direct access to administrative data is not allowed, though in
practice the legal constraint is not an issue; farmers there are asked for their permission
to access administrative records and much else (such as bank records) which allows their
use13. The only type of data used for which farmer permission is not sought explicitly is
the use of agricultural census results.
It is not legally possible to use taxation records held by taxation authorities as a data
source in nine Member States (plus Northern Ireland in the UK, and Norway), though of
course farmers may voluntarily make what they submit available to data collectors.
However, irrespective of the legal situation, our case studies revealed that taxation
records would not be able to provide much of the data that are required under FADN
because they are insufficiently detailed. There is also the suggestion that their contents
may be influenced unduly by their purpose, with an inbuilt bias towards minimising
income subject to taxation.
There are no legal constraints on the use of administrative or taxation data in well over
half the Member States (17, including the UK (England, Scotland and Wales)). The issue
of administrative records is revisited on a number of occasions in the analysis contained
in this study.
5.1.1.3. National legislation on the use of results
Legal constraints on the use of results from national farm accounts surveys are more
common. These exist in 13 Member States. However, the nature of the constraints in
use is not clear from the survey, although it is a requirement of the FADN legislation that
data remain confidential (and cannot be used by governments for tax purposes). Our
case studies suggest that what is constrained is the access to individual data, as well as
13 A similar permissive approach to access to existing electronic data is taken in Germany where farmers can
agree to have data made available to bookkeepers which reduces the burden they face in providing information
themselves; the vast majority agree.

Study on cost of and good practices for FADN data collection
23
access to aggregated data where the number of data points falls below a certain level
and could possibly be used to identify individual farms/holdings. It may therefore be
that, when replying to our online survey, some Liaison Agencies were referring to this
confidentiality issue rather than additional national restrictions. Nevertheless, our case
studies found that there are circumstances in which individual data can be made
available for research purposes, typically involving the removal of variables that would
allow individuals to be identified (see later analysis under Theme 3 of the uses of data).
5.1.2. Establishment of national farm surveys and current rationale
The online survey showed that the first Member State to establish a national farm survey
was Finland in 1912 (although Norway established its farm survey in 1911). Another
Nordic country, Denmark, was also an early adopter of a national farm survey (1918).
National farm surveys were established in the UK in 1936 and Sweden in 1939, in the
Netherlands in 1940 and in Germany, Luxembourg and Austria in 1955, 1958 and 1959
respectively. The Belgian national farm survey was established in 1960. All these
Member States therefore have national farm surveys which pre-date the introduction of
the EU-FADN in 1965; the early roots of these surveys are a strong influence on the way
in which the requirements of EU-FADN have been met subsequently and, in particular,
our case studies demonstrate that the collection methods have proved to be remarkably
durable. France and Italy established national farm surveys after the introduction of EU-
FADN, Greece, Ireland and Portugal after accession and Spain after the introduction of
FADN but 14 years before accession.
Amongst the more recent Members of the EU, national farm surveys were established in
anticipation of accession in Bulgaria, Croatia, Malta, Lithuania, Romania and Slovakia.
National surveys were established somewhat earlier in Cyprus, Czech Republic, Estonia,
Hungary, Latvia and Slovenia. Our case study of Poland found that the roots of
surveying farm accounts there go back to 1920, with a remodelling of the system in
1956, though the survey in its present form was established only in 2004 to meet the
requirements of accession.
For all Member States the current rationale for maintaining the national farm survey has
to be, at least in part, compliance with EU requirements. However, many countries also
indicated a national rationale in responses to our online survey; only eight Member
States (Belgium, Bulgaria, Croatia, Greece, Malta, Romania, Slovakia and Slovenia) did
not cite national purposes as a current rationale (though for Slovenia the literature
review found that its establishment in 1994 was in order to provide economic advice and
as an input to agricultural policy). In the case of Belgium this is because there is a
regional rather than a national purpose. This implies that, in the absence of the FADN
requirement, these Member States without an explicit national purpose may not carry out
a farm accounts survey and this could be seen as a defining characteristic (although
Belgium probably would through the regional approach). (This issue is revisited in the
analysis of benefits under Theme 3, where Germany, Lithuania and Poland indicated
that they definitely would continue with a national survey; Bulgaria, Netherlands,
Sweden and the UK were uncertain.)
5.2. Analysis of FADN organisation
5.2.1. Organisation of the national farm survey
5.2.1.1. Status of the Liaison Agency
The status of Liaison Agencies (LAO) falls into two main groups, Ministries and public
research institutions. Atypically, in Denmark and Sweden the Liaison Agency is the
government statistical body. Liaison Agencies are located in Ministries in 12 Member
States (Austria, Belgium, Bulgaria, France, Greece, Luxembourg, Malta, Portugal,

Study on cost of and good practices for FADN data collection
24
Romania, Slovenia, Spain and the UK). Liaison Agency function is provided by public
research institutions in 14 countries (Croatia, Cyprus14, Czech Republic, Estonia, Finland,
Germany (although only since 2012), Hungary, Ireland, Italy, Latvia, Lithuania,
Netherlands, Poland and Slovakia). In terms of typology, it is more common for the
Liaison Agency to be a Ministry rather than an institute in EU-15 Member States (eight
c.f. five) while the selection of a public institute is more common in newer Member States
(nine c.f. four).
The rationale for the selection of public institutes rather than Ministries as the Liaison
Agency is usually a matter of history but, among the more recent Member States, related
also to skill set and capacity at the time that the national survey was set up (among our
case studies both Lithuania and Poland represent examples). It is rare for the LAO to
change, and when it does the reasons seem to have little connection with the
performance of the survey.
Germany provides an example in which, according to information gathered in our
case study, the Federal Ministry of Food and Agriculture (BMEL) handed over LAO
responsibility to the Thünen Institute; the explanation appears to be linked to
changes taking place within the BMEL.
In Denmark, according to our literature review and a discussion with the Liaison
Agency, the Danish LAO unit was moved from the University of Copenhagen to
Statistics Denmark in 2009 as the result of a government decision to gather all
official statistics in Denmark in one place. The intention was to maintain critical
mass for agricultural statistics and make use of the synergies between FADN and
other agricultural statistics. This relocation did indeed provide some advantages,
for example Statistics Denmark has a Section of Survey and Methods, which has
helped to improve the sample used for FADN and national farm statistics
(Hækkerup, 2010). A disadvantage of this relocation has been the greater
distance placed between the data collection process and the researchers who use
the data.
There are also situations in which the nominated LAO is the head of a rather complex set
of institutional arrangements. For example, in the UK, the ministry (Defra) which is the
LAO has passed operational responsibility for supplying data to EU-FADN to the devolved
governments of Wales, Scotland and Northern Ireland (while retaining responsibility for
England). In Sweden, although Statistics Sweden is the LAO, the Board of Agriculture is
heavily involved in both data collection and in dissemination, even though the main data
collecting organisation (LRF Konsult) is under contract to the LAO.
In general, the status of the LAO seems to be primarily a matter of administrative
convenience. Though a case could be made that communication between, on the one
hand, the EU-FADN Committee and the administrators in the Commission and, on the
other, national data collection systems might be affected by which organisation formed
the LAO, any such problems could be minimised by good internal exchange of
information. There seems to be no obvious association between the nature of the LAO
and the functioning of the national farm accounts survey.
5.2.1.2. Organisation of the FADN supply chain
Although there is considerable variety in terms of the division of responsibilities along the
FADN supply chain (by which we mean the relationship between organisations that
undertake activities from sample selection, recruitment, data collection, validation,
submission to RICA-1 and national dissemination and feedback), funding responsibility
14 In 2015 (after the reference period for this study) responsibility for FADN in Cyprus was transferred from the Agricultural Research
Institute to the Department of Agriculture.

Study on cost of and good practices for FADN data collection
25
rests almost universally with government ministries, with the exception of Finland where
it is the Natural Resources Institute Finland (although as a public research body
ultimately this receives government resources).
In response to our online survey, the summary rationales provided for the plethora of
organisational structures varied little between Member States with most claiming both
historic and practical reasons. Some 21 Member States (all except Croatia, Greece,
Lithuania, Malta, the Netherlands, Portugal and Romania) said that the reason for the
organisational structure was historic and all but Austria, Netherlands, Slovakia and Spain
said the rationale was practical. In some Member States there is national legislation
assigning responsibility for activities to various organisations; in these situations it is
assumed that the rationale was practical. Rather fewer Member States said that the
rationale was budgetary (in combination with historic and/or practical rationales)
(Bulgaria, France, Germany, Latvia, Lithuania, Poland, Slovenia, Spain and the UK
(England and Wales)). Ultimately most Member States cited at least two rationales.
Perhaps the most useful way to distinguish Member States on this metric of the rationale
for the present organisational structure is the citation of budgetary reasons, as this
suggests some consideration of alternatives. Among case study countries, the
Netherlands stands out in this analysis for stating that the organisational structure was
designed to be independent and objective. However, many other Member States would
no doubt also claim that their organisational structure is independent and objective; this
was a factor in the UK’s selection of the universities as data collectors.
Discussion with the other case study countries frequently found that historic and practical
factors were predominant in determining responsibilities along the data supply chain, and
where there were national surveys that predated EU-FADN, the earlier structures have
tended to continue or to evolve in minor ways.
The organisational structure is fairly stable, with 24 Member States reporting no change
in the last ten years/since accession. The significant organisational changes that have
been made include:
Denmark, where in 2009 the government decided to gather all official agricultural
statistics within Statistics Denmark (which involved a repositioning of the LAO).
Until 2009 the Danish liaison “FADN office” was at a research institute. The board
of directors of the research institute, which included representatives of farmers,
also functioned as the National FADN Committee. As noted above this change
was not directly linked to the performance of the farm accounts system but more
to a governmental decision on agricultural statistics in general. It was done
mainly to maintain critical mass for agricultural statistics and to make use of the
synergies between other agricultural statistics and accounts (FADN) statistics.
France, where the Ministry took over all tasks in 2007. The case study interviews
found that, prior to 2007, the management of the national farm accounts survey
was shared among the Service de la Statistique et de la Prospective (SSP – part of
the ministry of agriculture), Institut national de la statistique et des études
économiques (INSEE) and the INRA. These were respectively in charge of the
collection phase, storage of the Farm Return, and scientific development. From
2007 the SSP has been in charge of all of these functions, and within SSP the Pôle
RICA has the responsibility for all relevant aspects of the survey.
Germany where the Liaison Agency moved from the Federal Ministry (BMEL) to
the Thünen Institute in 2012. As noted above, this does not seem to have been
brought about for reasons connected with the performance of the national farm
accounts network (the TBN).
The UK (England) where the case study discussions found that responsibility for
data collection had moved from individual agreements between the ministry and a
set of universities and colleges, each of which had collected data in their
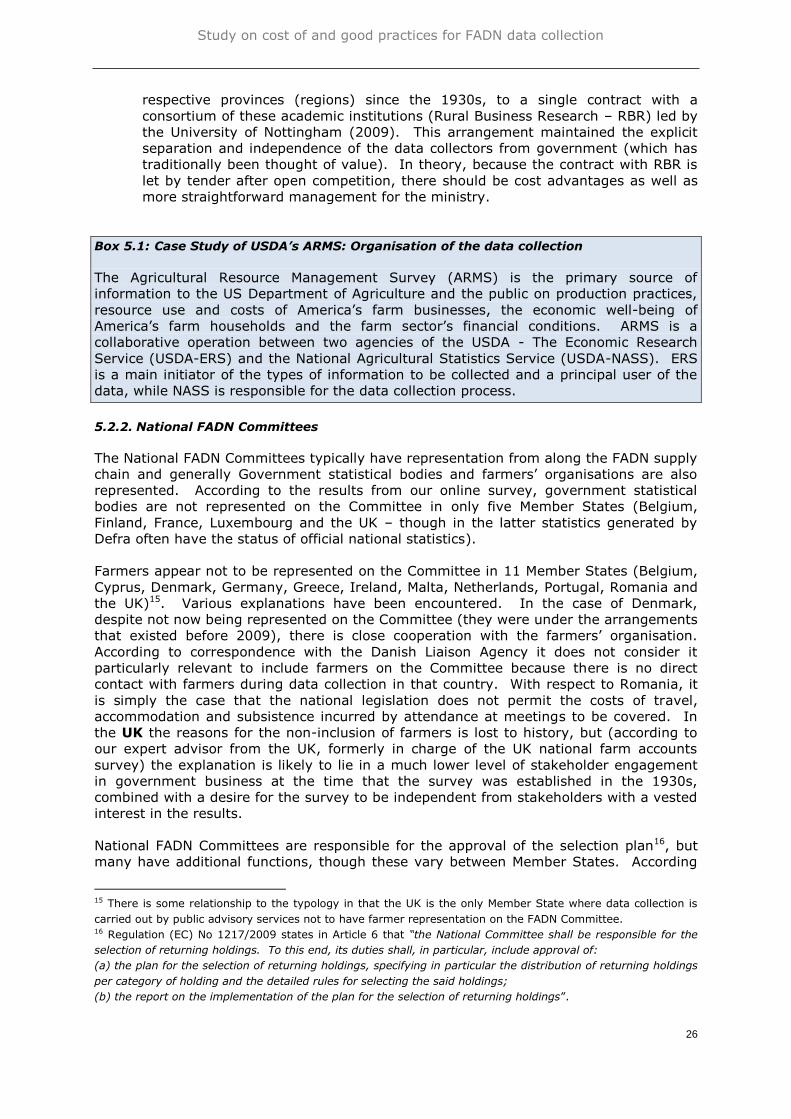
Study on cost of and good practices for FADN data collection
26
respective provinces (regions) since the 1930s, to a single contract with a
consortium of these academic institutions (Rural Business Research – RBR) led by
the University of Nottingham (2009). This arrangement maintained the explicit
separation and independence of the data collectors from government (which has
traditionally been thought of value). In theory, because the contract with RBR is
let by tender after open competition, there should be cost advantages as well as
more straightforward management for the ministry.
Box 5.1: Case Study of USDA’s ARMS: Organisation of the data collection
The Agricultural Resource Management Survey (ARMS) is the primary source of
information to the US Department of Agriculture and the public on production practices,
resource use and costs of America’s farm businesses, the economic well-being of
America’s farm households and the farm sector’s financial conditions. ARMS is a
collaborative operation between two agencies of the USDA - The Economic Research
Service (USDA-ERS) and the National Agricultural Statistics Service (USDA-NASS). ERS
is a main initiator of the types of information to be collected and a principal user of the
data, while NASS is responsible for the data collection process.
5.2.2. National FADN Committees
The National FADN Committees typically have representation from along the FADN supply
chain and generally Government statistical bodies and farmers’ organisations are also
represented. According to the results from our online survey, government statistical
bodies are not represented on the Committee in only five Member States (Belgium,
Finland, France, Luxembourg and the UK – though in the latter statistics generated by
Defra often have the status of official national statistics).
Farmers appear not to be represented on the Committee in 11 Member States (Belgium,
Cyprus, Denmark, Germany, Greece, Ireland, Malta, Netherlands, Portugal, Romania and
the UK)15. Various explanations have been encountered. In the case of Denmark,
despite not now being represented on the Committee (they were under the arrangements
that existed before 2009), there is close cooperation with the farmers’ organisation.
According to correspondence with the Danish Liaison Agency it does not consider it
particularly relevant to include farmers on the Committee because there is no direct
contact with farmers during data collection in that country. With respect to Romania, it
is simply the case that the national legislation does not permit the costs of travel,
accommodation and subsistence incurred by attendance at meetings to be covered. In
the UK the reasons for the non-inclusion of farmers is lost to history, but (according to
our expert advisor from the UK, formerly in charge of the UK national farm accounts
survey) the explanation is likely to lie in a much lower level of stakeholder engagement
in government business at the time that the survey was established in the 1930s,
combined with a desire for the survey to be independent from stakeholders with a vested
interest in the results.
National FADN Committees are responsible for the approval of the selection plan16, but
many have additional functions, though these vary between Member States. According
15 There is some relationship to the typology in that the UK is the only Member State where data collection is
carried out by public advisory services not to have farmer representation on the FADN Committee. 16 Regulation (EC) No 1217/2009 states in Article 6 that “the National Committee shall be responsible for the
selection of returning holdings. To this end, its duties shall, in particular, include approval of:
(a) the plan for the selection of returning holdings, specifying in particular the distribution of returning holdings
per category of holding and the detailed rules for selecting the said holdings;
(b) the report on the implementation of the plan for the selection of returning holdings”.
Study on cost of and good practices for FADN data collection
27
to replies by Laison Agencies to our online survey, most common is a role in addressing
problems and difficulties (all except Belgium, Finland (although recommendations can be
made here), Greece, Ireland, Latvia and Luxembourg). In 11 Member States the
Committee plays a role in reviewing the performance of data collectors (Bulgaria, Czech
Republic, Estonia, France, Germany, Netherlands, Romania, Slovakia, Slovenia, Spain
and the UK).
In some Member States the Committee approves the questionnaire and suggests
amendments (Austria, France, Germany, Luxembourg, Romania and Slovakia) while in
others the Committee only suggests amendments (Denmark, Ireland, Portugal, Slovenia
and the UK). Finally, the Committee plays a guiding role in implementation in Austria,
France, Germany, Greece, Hungary, Poland, Romania, Slovakia, Slovenia and the UK.
Taking an overview, the role played by the National FADN Committee can be used to
distinguish two main groups; those Member States were it plays a major role, with
multiple additional functions beyond its minimal legal requirements, and those where its
function closely aligns with these minimal requirements. Austria, France, Germany,
Romania, Slovakia, Slovenia and the UK fall into the first group and Belgium, Croatia,
Cyprus, Finland, Greece, Ireland, Italy, Latvia, Lithuania, Malta and Sweden fall into the
second group. Other Member States fall somewhere between the two17.
Greece and Luxembourg are the only Member States where FADN Committee meetings
do not take place in person (in Sweden the meetings occasionally take place in person).
Ireland, Italy, Luxembourg, Malta, Sweden and the UK also all use online, video or phone
conferencing and Denmark, Greece, Luxembourg, Malta and the UK also use
correspondence.
In 21 Member States FADN Committee meetings are held annually with the others
holding two or three meetings a year (Croatia, Denmark, Finland, Netherlands, Slovakia
and the UK) or according to need (Austria and Greece). In Cyprus, Greece, Ireland,
Latvia, Luxembourg and Malta meetings are held on an ad hoc basis; in all other Member
States meetings are scheduled.
Regional Committees are found in Belgium (Flanders and Wallonia), Germany (each of
the 16 Länder) and Spain (three). In Germany the Regional Committee meetings differ
in frequency, but have a common representation and remit.
5.2.3. Scope of national data collection
5.2.3.1. Number of national farm accounts survey cases
According to the responses to our online survey, the sample size of the national farm
survey is the same as the required FADN sample18 in most Member States. In eight
Member States it is larger (Austria, Czech Republic, Denmark, Finland, Germany,
Lithuania, Luxembourg and the UK). Often the reason for a larger sample is linked to the
requirement to cover a broader range of farm types in the national farm accounts survey
(for example, the literature review indicates that in Denmark there is interest in mink
farming and the organic sector), and/or farms that are too small to be included in EU-
17 No Member States where data collection is carried out the Liaison Agency fall into the first group and there is
only one example (Sweden) where Member States which use accounting firms to collect data fall into the
second group. This may suggest that greater Liaison Agency involvement in the FADN data supply chain
replaces a need for involvement in the FADN Committee. 18 Member States need to have a slightly larger sample to allow for farms which do not ultimately fall within the
typology or which are rejected.
Study on cost of and good practices for FADN data collection
28
FADN (for example, Germany, where in Bavaria there is also regional interest in
specialist hop farms).
Discussions in case study countries showed that the judgement whether the national
sample has more holdings than is required for FADN is not simple. It is common for
some Farm Returns to be rejected when submitted to RICA-1 at Commission level, so
Member States routinely collect more at national level to provide a safety margin. In the
literature the European Court of Auditors was critical of the practices in some Member
States of substituting farms from the surplus rather than identifying and correcting the
reasons for rejection (ECA, 2004). Here we are more concerned with the size of the
margin that Member States consider to be ‘normal’ so that when, under Theme 2,
estimates are made of cost per completed Farm Return supplied to EU-FADN this only
includes the normal safety margin. It should not include the costs of the (sometimes)
substantial larger numbers of Farm Returns that some Member States collect for national
purposes (for example, to give them coverage of farms that fall below the EU-FADN
threshold).
Among case study countries with ‘larger’ samples, the UK (England) currently collects
from about 1,900 farms in order to supply its required 1,500 EU-FADN Farm Returns; the
size of the margin is being gradually reduced, but the judgement of the Liaison Agency is
that to fall below 1,750 would cut the margin for error very fine. There would be an
increasing danger of surveyed farms falling below the €25,000 SO threshold, leading to a
focus on farms somewhat larger, which might leave no farms at the bottom of the size
range. In Germany there is clearly a larger national sample than is required for EU-
FADN (11,500 farms compared with the 8,800 holdings stipulated for EU-FADN), in part
explained by the use of a lower national threshold and the need to have adequate
numbers to explore issues of interest at Federal and regional levels. In Lithuania the
larger numbers seem linked to the loss of holdings which through rapid structural change
fall out of the typology required by EU-FADN.
5.2.3.2. Scope of coverage
In terms of scope of coverage (i.e. breadth of data collected to include variables such as
household income and depth of data collected to include more detail of variables
currently in the EU-FADN Farm Return), the national farm survey in 20 Member States
exceeds the FADN requirements to some extent; mostly the additional scope and depth
are found together, though in four countries (Croatia, Hungary, Lithuania and Poland)
further depth is not accompanied by broader scope. The other eight countries in which
the breadth of coverage is the same as EU-FADN are Bulgaria, Greece, Latvia, Malta,
Romania, Slovakia, Slovenia and Spain.
The findings on depth of detail in this study, based on responses to our online survey,
are broadly in line with those of Delame and Butault (2010) who examined in detail the
input and output categories used nationally and noted that only Bulgaria of the Member
States they examined collected no additional data beyond the EU-FADN requirements
(though another source claims that the Bulgarian national questionnaire is slightly more
detailed than the EU-FADN questionnaire in terms of crops, assets and livestock). The
literature review also indicated Member States where this extra breadth covered other
sources of income received by the operator (such as Agra CEAS Consulting, 2007 and
Hill, 2012) and, occasionally, more general additional categories. For example, in Ireland
the data collected provides detailed information on economic, social and environmental
aspects of the agricultural sector - see Kinsella, 2004). In Belgium the Walloon national
farm survey covers additional technical, environmental and social data (Ministère de la
Région wallonne, 2004).
Study on cost of and good practices for FADN data collection
29
Among the Member States selected as case studies, all except Bulgaria19 exceed in their
national farm accounts surveys the requirements of EU-FADN. Information collected
shows that there are different mixes of broader coverage and further depth, and some
light is thrown on the reason for this additional coverage. In general it appears that
broader coverage is primarily to provide information of national/regional policy interest,
whereas greater depth is to enhance quality of results, though this should not be
regarded as an absolutist assessment:
The scope and depth of the national survey exceeds EU-FADN requirements in
France with additional information on output variables collected and most
headings further disaggregated, with feeds distinguished by type and livestock
enterprise.
Addtional cost sub-headings are used in Germany and additional information on
output variables is collected.
In Italy the scope of the national survey is larger, as this includes additional
variables mainly to investigate issues which have relevance specifically to Italy
and in order to support national and regional policymaking. However, although
the response to our survey states that the depth (of EU-FADN variables) is as
required by the Farm Return, literature suggests that greater details are collected
for some variables (for example, cost data by enterprise).
In Lithuania, in contrast, the additional questions represent further depth of EU-
FADN indicators, not broader scope. The extra data collected are necessary to
produce the EU-FADN variables; the national farm survey has more checks and
controls than operated by EU-FADN.
In the Netherlands a feature of the broader scope of the national farm accounts
survey is its coverage of many aspects of sustainability. This reflects the need to
service national policy. Examples of where it exceeds EU-FADN requirements are
in manure application, NPK application, mineral balances, energy use, antibiotics
and pesticides, water quality, Other Gainful Activities and farm tourism. Core EU-
FADN data alone probably would not be used much nationally; it is the additional
material collected in combination with the core EU-FADN data that is considered
by the Dutch government and Liaison Agency to make it really useful.
In Poland the situation is similar to that of Lithuania. There is some additional
detail not required by EU-FADN. For example, assets are recorded by type rather
than just in aggregate, and there are data on the volume of fertiliser used20.
However, coverage of household income is no longer part of the national farm
accounts survey; data on this is now collected by a separate voluntary survey
distributed alongside the farm accounts survey.
In Sweden the national farm survey goes beyond the detail required. The
rationale for this is to improve the quality of the national survey (and hence EU-
FADN) rather for any national need. The only additional information not required
by EU-FADN is the gender of the workforce.
In the UK the data collected exceed EU-FADN requirements on subjects such as
the allocation of variable costs between enterprises and farm household incomes.
In addition there are modules of questions (generally outside core EU-FADN
coverage) introduced periodically to cover specific policy areas. As agriculture is a
devolved policy, each country within the UK may use different additional
questions, but with a common UK core.
19 Although interviewees in France suggested that the scope matched EU-FADN, this is not actually the case
according to our expert advisor in France. 20 There is a separate study on costs by enterprise which has been carried out on farms supplying data to the
national farm accounts survey since 2004: http://www.agrokoszty.pl/index.php?id=19

Study on cost of and good practices for FADN data collection
30
There are regional difference in the information collected in Belgium and the UK. In the
case of the UK, the collection of farming data is devolved, with each national government
having responsibility for its own survey, and there are differences in the information
collected as a result. For example, while all the countries collect financial data for
enterprise gross margin data, in Northern Ireland this includes physical quantities of key
inputs (feed, fertiliser, etc.) plus details on fertiliser/manure practices on around 100
farms. Scotland collects data on veterinary and (animal) medicine costs.
Although Germany and Spain take a regional approach to data collection, the national
farm form used is common throughout.
5.2.4. The FADN sample
5.2.4.1. Representation of the sector
The literature shows that the EU-FADN sample covers a high proportion of Standard
Output of agriculture in each Member State; only in Lithuania (86%) and Romania (83%)
does it fall below 90%. In 13 Member States coverage of Utilised Agricultural Area
exceeds 90%. Coverage falls below 80% in five Member States and is lowest in Malta at
56%. In 16 Member States coverage of Annual Work Units equals or exceeds 75%; only
in Hungary (46%) does coverage fall below half the agricultural workforce.
However, there is a substantial difference between Member States in terms of the
coverage of number of holdings in their respective Farm Structure Surveys and, by
implication, of their holders.
In Hungary and Slovakia, the FADN sample represents less than 20% of farms in
the Farm Structure Survey (FSS).
In Bulgaria, Cyprus, Latvia, Lithuania, Malta, Portugal and Romania between 20%
and 39% of FSS farms are represented.
Between 40% and 59% of farms are represented in Estonia, Greece, Italy, Poland,
Slovenia, Sweden and the UK.
At least 60% of FSS farms are represented in Austria, Belgium, Czech Republic,
Denmark, Finland, France, Germany, Ireland (75% and the highest coverage),
uxembourg, Netherlands and Spain.
According to replies to our online survey, Cyprus is the only Member State currently to
formally restrict the number of years that farmers can remain within the sample
(although several Member States previously imposed restrictions). In Italy it is
considered best statistical practice for farms to remain in the sample for not more than
four to five years while in Denmark farms should rotate out of the survey after four
years, although the farm can be reselected if no other farm can be found of the
appropriate size, type and region to replace it.
This means that, by default, most Member States have a longitudinal panel (constant
sample), the period of which is determined by the sample turnover rate. However, just
over half of the Member States within this analysis (16) use this longitudinal panel
routinely (a longitudinal panel has also been used by the OECD to analyse farm level risk
and risk management strategies and policies - see for example Kimura, et al, (2010)).
5.2.4.2. Sample turnover
In the literature on farm accounts surveys, comments on the turnover of its sample are
usually made in the context of the impact of slow rates of replacement on the ability of
the survey to remain representative. It is anticipated that farms in the survey will

Study on cost of and good practices for FADN data collection
31
benefit in various ways through participation, especially where feedback of their results
and comparisons with benchmarks take place. Thus with the passing of time the nature
of the farm business changes and is no longer representative of farms outside the survey
sample. The representativeness of results based on participants of long-standing is likely
therefore to come into question.
In this study the concern with turnover is not primarily one of data quality in EU-FADN,
but rather of the way in which this affects the costs of the survey and is related to best
practice in data collection. Higher turnover implies the use of greater quantities of
resources to select and, more particularly, recruit farms into the national farm accounts
survey.
Some turnover is inevitable. The dynamics of the agricultural community will mean that
the occupiers of a small proportion of farms will change each year, and some of these
successors will not wish to continue in the survey. Farms grow or shrink or change their
enterprise mix, which can carry implications for whether they are suitable for inclusion.
Such need for replacement is common to all Member States, so there will be some costs
associated with this. What differs is the attitudes of countries to turnover beyond this,
and the costs involved.
For Member States that are not case studies, the literature review shows that in several
the sample is characterised by minimal turnover. For Belgium, Broekhoven (2007)
reports that in Flanders (with a sample of 720) the turnover is around 5-6% annually,
though Taragola (1999) claims that a characteristic of the Belgian FADN is that there is
no rotation system of the holdings belonging to the sample. Broekhoven (2007) also
observes that some farms have been participating in FADN for more than fifteen years
and that sample turnover is a determinant of cost, with accountants spending more time
collecting data from new participants because with established holdings the farmer is
familiar with the forms and procedures and the accountant is familiar with the structure
and peculiarities of the farm.
The lowest sample turnover rates are in Croatia, Hungary, Spain and the UK (Scotland,
Wales and Northern Ireland) at 5% or less. Perhaps the most explicit example of a
preference for sample stability is Finland, where there are incentives for not leaving the
farm accounts survey, with prizes for 5, 10, 20, 50, 75, 90, 100 years in FADN. In
Denmark selection contains a partial panel approach with around 80% of holdings
retained from year to year. This implies a turnover rate of 20%, similar to the 20-25%
in Italy; in both Member States there is view that sample turnover increases statistical
robustness. The sample turnover rate in Slovenia is 29%, but this is partly explained by
recent moves to better meet the sample frame. These extremes aside, just over a third
of Member States have a turnover of around 10%.
Among case study countries discussions generated the following information on turnover:
In Bulgaria a large number of holdings remain in the sample for several years
with an annual turnover rate of less than 10% (8% between 2012 and 2013).
Between 2007 and 2014 some 4,004 farms had been part of the FADN sample,
meaning a retention rate over this period of 50%. According to the Liaison
Agency, this low turnover simplifies the holdings to include in the sample each
year and their recruitment.
In Germany overall the national sample is rather stable with a low annual rate of
drop-out (10%), mainly due to generation change (the children decide not
continue farming). Of the Länder visited, the turnover is about 5% in Bavaria
(where small farms predominate) and 10% in Sachsen-Anhalt, though even there
many farms had remained in the sample for around 20 years.

Study on cost of and good practices for FADN data collection
32
In France, there appears to be no limit on the period that farms can remain in
the survey, though there is a longitudinal panel included in the sample from which
they are removed after ten years. The annual turnover rate is 10%.
In Italy sample turnover is between 20% and 25% in line with the perception
that a dynamic sample results in greater statistical robustness.
In Lithuania the annual turnover rate is about 20%, due to structural change and
reluctance to participate. The sample of company farms is more stable.
In the Netherlands the annual turnover rate is about 10%, but many farms
remain in the sample for a number of years.
In Poland the annual turnover rate is about 10% but many farms remain in the
sample for a long time; some 4,500 (out of 12,100) have been in since 2004.
In Sweden, according to the literature accessed before the case study visit, over
time farmers have been remaining within the FADN sample for longer. Reinsson
(2009) explained that in the 1990s it was unusual for farms to remain within the
survey for more than six years, but that by 2007 some holdings had been
contributing data for 18 years. The current rotation rate is 7-10 years and the
annual sample turnover rate is around 11%. The case study discussions revealed
some disagreement with regard to length of retention. The National FADN
Committee takes the view that farmers should be in the sample for a long time,
although the Ministry would prefer to replace smaller farmers with larger ones
over time to match their area of policy interest.
In the UK the annual turnover (England) is about 10%; formerly there was a limit
of 15 years retention, but this had now been suspended21. Some 1,257 farms
have been in the England sample for at least five years (out of 1,500). Turnover
in the other devolved regions of the UK is around 5%.
5.2.4.3. Sample recruitment
Another issue emerging from the case studies which has both data quality and cost
implications is the manner in which recruits for the national farm accounts survey are
obtained. While the numbers required by EU-FADN by region are set centrally by the
Commission, there is substantial variation in the methods used to meet these obligations
by recruiting farms of certain size and type to cells that are not fully populated by farms
that are already in the national survey.
Two main approaches to family (non-corporate) farms are discernible from case study
information; treatment of legal entities (corporations, which are far less numerous) may
follow a different pattern. The first is where contacts with family farms are made at
random, based on a list of farms derived from the Farm Structure Survey. Among case
study countries, this is the procedure adopted in the UK (England). Addresses are
supplied by Defra (the agricultural ministry for England) and farms are contacted (in
order) by letter, telephone and personal visit to explain the farm accounts survey and the
nature of the commitment. There is a consent form to be signed by the farmer. The
success rate is only 8% to 9%, though this varies between farming types; some sectors
are particularly problematic (horticulture and granivores). (Separately Brown (2011)
puts the recruitment success rate at 10% in England and notes that this is a difficult
process, although retention is high at 90%.) The potential statistical superiority of
random sampling is probably offset by the low recruitment rate, which the literature
generated within the Liaison Agency (Woodend 2011) points to as a possible source of
bias in the results. This approach also is expensive, both in terms of money and labour
input. The UK estimates that one full-time equivalent (FTE) of labour input is required
for recruiting each year (this is based on the larger UK sample; on a pro rata basis, 0.76
FTEs would be required for the FADN sample only).
21 Suspension will allow a restriction to be brought back in should it be felt necessary.

Study on cost of and good practices for FADN data collection
33
In Sweden a similar process takes place. Statistics Sweden provides contact details for
ten times the sample needed in each sampling cell. Then selected farmers are sent a
recruitment letter setting out the purpose of the survey, followed up by telephone some
seven to ten days later for a ten-minute interview to ascertain whether the farm is
suitable for the survey (data based on the Farm Structure Survey can be out of date) and
willingness to participate. Recruitment has been getting more difficult and, as with the
UK, certain sizes and type are particularly problematic (in Sweden’s case those near the
size threshold because they tend to be pluriactive and unwilling to give the time required,
and granivores).
The other approach, while still respecting the selection plan, recruits only from farmers
who are already in contact with data collectors.
In Poland, where data collection is undertaken by the Agricultural Advisory
Centres, selection by advisors is made from those farms that are already known
to them through their role as advisors; they are free to approach any farms that
meet the sample requirements. Even so more than 50% of farmers decline to
participate, the two main reasons being (i) not wanting to spend time keeping
records (accounts are not compulsory for taxation); and, (ii) unwillingness to
disclose data, even though the data are confidential (this is especially so for
farmers that are not VAT registered).
In Lithuania, the situation is closely similar. Data collection is undertaken by the
Lithuanian Agricultural Advisory Service (LAAS), which also provides accountancy
(bookkeeping) services for farmers (who pay for this). Farms are recruited to
meet the selection plan from those who are clients of LAAS for accountancy
services and, for smaller farms which do not keep accounts, for other services.
(To put this in perspective, there are about 61,000 farms above the economic size
threshold, of which some 4,500 use bookkeeping. Some 10,000 are clients of
LAAS for non-bookkeeping services). It is important to note that almost all
farmers that are approached agree to participate; the cost of recruitment is
therefore very low. The LAAS is working with farmers who rely on them for
advice, so they are amenable to participation in the farm accounts survey. Trust
is clearly important.
In Germany data collection is done by private commercial accountancy firms
which provide services to farmers in general. These are made aware of the
nature and types of farms that need to be recruited and then identify farms
among their clients which match the required profile. Farmers are approached by
telephone and, if agreeable, complete a form providing basic farm characteristics;
these are then used to check whether the farm meets the sample requirements.
Of the farmers approached, there is a very high recruitment rate (virtually 100%),
explained by the long-established relationship between the farmer and his
accountant.
It is clear from these examples that recruitment that builds on established relationships
between farmers and professionals providing services greatly facilitates the process and
achieves a high success rate. Against this, there are potential threats to the ability of the
sample to be representative of the farming sector. The issue of costs of recruitment is
revisited in the analysis of Theme 2 where the evidence is presented.
Box 5.2: Case Study of USDA’s ARMS: The sample
ARMS is a nationally representative survey targeting about 5,000 fields and 30,000 farms
each year. The sample, which is newly selected each year, is designed to provide
coverage of all farms in the 48 contiguous States plus state level data for the 15 main
producing states. The farm population includes all establishments which produced and

Study on cost of and good practices for FADN data collection
34
sold, or would normally have sold, at least $1,000 of agricultural products during the
previous year. This makes ARMS rather more representative of the agricultural sector
than EU-FADN which focuses on output rather than farms. A list frame is maintained by
USDA-NASS, and the USDA-ERS selects a sample from this. The sample is stratified,
with separate strata for state, commodity type and size, and there are different sampling
probabilities for each strata. Furthermore, a sampling strategy is used that reduces the
chances that a farm will be selected in consecutive years. The sample is thus not
completely random. Respondents receive an initial mailing requesting their participation.
This is followed by a postal questionnaire with non-respondents contacted by
enumerators. Some very large farms, which receive multiple NASS questionnaires during
the year, work directly with NASS field offices to manage their burden. Larger farms,
where there may only be a few of each type, are over-sampled. There is no formal
agreement between participating farmers and USDA-NASS.
5.2.5. Farmer participation and benefits
According to replies to our online survey farmers receive something in exchange for
participation in their national farm accounts survey in all Member States with the
exception of Denmark, France and Romania (where benchmarking data is to be
introduced in the future). Monetary payments are made to farmers in 11 Member States
(Austria, Cyprus, Estonia, Germany, Greece, Latvia, Malta, Poland, Slovakia, Slovenia
and Sweden)22 23. In some cases farmers receive a sum equal to the EU fee paid per
completed Farm Return accepted into EU-FADN (company farms in Lithuania), more
than this in Slovenia (€175 according to the literature review), but in others they receive
only smaller sums (€55 in Germany, ~€50 in Poland). The conventional rationale for
making payments to farmers is to reflect the time required by them to maintain
logbooks, keep receipts, etc. though what starts out as a valid argument when a survey
is set up can be overtaken by changes in circumstances. Our case study for Poland
throws some light onto its payments which may find resonances elsewhere.
Firstly, the process of making payment to farmers is not a costless exercise.
Payments made by the Liaison Agency (the Institute of Agricultural and Food
Economics - National Research Institute, IAFE-NRI) directly into the participating
farmer’s bank account costs 10% (PLN 20) of the fee paid for bank transfer,
sending tax forms to farmers and paying Agricultural Advisory Centre (AAC)
officers to provide the additional information required.
The receivers of the payments may have preferences for how they are paid.
Some Polish farmers do not like bank transfers because they think the money can
be used by the bank to repay debts. These farmers require payment by post
which costs another PLN 12. This system is also labour intensive.
The implementation of electronic data transfer is ongoing (with implications for
the amount of effort required by farmers, and thus for the rationale for the
payments).
Lowering or removing payments needs a strategy. Efforts are underway to work
with other departments to enhance the value of the information provided and to
make farmers understand the value of the data with a view to removing the
payment to farmers.
The rationale for making payments to farmers is revisited in the analysis of Theme 4.
Turning to other benefits, farmers are provided with a copy of their completed accounts
in 14 Member States (see Figure 5.1). There is little overlap between the Member States
22 No monetary payments are made where data are collected by Liaison Agencies. 23 Company farms receive payment in Lithuania, but not family farms.

Study on cost of and good practices for FADN data collection
35
making payments to farmers and those giving copies of their accounts, which suggests
that most Member States take an “either/or” approach to providing the farmer with
benefits.
According to the online survey, most Member States provide farmers with benchmarking
data (Figure 5.1). Farmers in Member States where the data are collected by
advisory/extension agents also benefit from specific advice based on their documented
performance. Among the case study countries, the Netherlands is an example where
farmers receive considerable feedback which is considered to be of high value. Farmers
in Poland, Lithuania and some regions of Germany (Sachsen-Anhalt, for example) also
benefit from specific advice provided by the extension agency which oversees data
collection by accounting firms. (This combination of data collection and giving advice is
revisited in the analysis of Theme 3.)
Figure 5.1: Farmer benefits from participation
5.3. Data collection methodologies
Data collection methodologies form a topic in which it is particularly necessary to draw
from all three main sources of evidence (online survey, case studies and literature
review). What is revealed is a very complex set of arrangements that frequently can
only be understood by drilling down to include factors such as the structure of agriculture
(in terms of farm size, legal status of businesses and the relationship of these to farming
types), national taxation systems, structure of firms providing accountancy services,
national forms of agricultural advisory service and relationships between the Liaison
Agency, government and the data collecting organisation. Among Member States there
are multiple combinations of these factors, and even within a single country there can be
a range of possibilities.
5.3.1. Methods used
The online survey asked several questions, based on the literature review, about
methodology of data collection. The first was about the ‘main’ data collection
methodologies used, with the options of data collection from the farmer or farm
secretary, data collection from private accountancy firms and data extracted from other
Benchmarking data:
CZ, ES, HR
Monetary payments:
AT, CY, MT
Provided with accounts:
PT
No ‘compensation’
for participation:
DK, FR, RO
EE,
EL,
PL
DE, LV, SI,
SE, SK
BE, BG,
FI, HU,
IE, IT,
LT, LU,
NL, UK
Study on cost of and good practices for FADN data collection
36
(secondary) sources. It is recognised that ‘main’ is subjective, but the intention was to
gain an impression rather than a detailed account of all possibilities. Replies were an
early indication of the complexity, with most Member States (23) indicating more than
one option as being ‘main’ (of which the Estonia, Romania and Slovenia indicated three
‘mains’).
5.3.1.1. ‘Main’ methods of collecting data
Bearing in mind that many Member States use combinations of methods to collect data,
in the online survey the most common ‘main’ method reported (only Denmark, France
and Sweden did not indicate its use), and probably one used in all Member States to
varying degrees, is collection from farmers/farm secretaries24. The extent to which this
methodology is used differs. In Denmark it is not used at all; this is supported by
material in the literature review which explains that there is no need for direct contact
with farmers as the Danish Liaison Agency collects data directly from farm accounts and
supplements this with an annual survey to cover structural data for those units which
contribute to FADN. This involves some matching of existing data with the greater detail
required by FADN, a task that is facilitated by some 80% of Danish farms having an
accountant known to Statistics Denmark (Hækkerup, 2010; Pedersen 2008).
Among case study countries, in Italy, Lithuania, Poland and the UK this is the primary
form of data collection, with data collectors (who in Lithuania and Poland may also be
advisors and who are termed ‘researchers’ in the UK) visiting farms to gather information
and supporting evidence used to draw up an account which forms the basis of the
national Farm Return. Where the main data collection methodology is via accountants, it
is still necessary to collect some information directly from farmers relating to physical
information which would not appear in financial accounts and greater detail which again
is not required in accounts.
According to the online survey, data collection by private accounting firms that extract
data from completed accounts to populate the national Farm Return were a ‘main’
method in ten Member States (Austria, Denmark, Estonia, France, Germany, Hungary,
Romania, Slovenia, Spain and Sweden). In both of the case study countries in this group
(France and Germany) the accountants, in addition to extracting data from existing
accounts, assemble evidence to draw up accounts for sample farms which do not do so
(because they are too small) and additionally collect data directly from farmers where
this is not covered in the financial accounts.
Data extracted from other (secondary) sources such as registers and administration
systems was a ‘main’ method of data collection in 19 Member States (Croatia, Cyprus,
Czech Republic, Denmark, Estonia, Finland, France, Ireland, Italy, Latvia, Lithuania,
Luxembourg, Malta, Netherlands, Portugal, Romania, Slovenia, Sweden and UK (Scotland
and Northern Ireland)). Among case study countries, this is the primary means of data
collection in the Netherlands and Sweden. In Sweden, administrative sources are used
to complete around 30% of the FADN Farm Return (this information is added to that
provided by the accounting firm). In addition, several Member States used
administrative sources as a minor source or as a way of checking data collected in other
ways (Italy, Germany).
A prerequisite for the use of administration data is the ability to link records to farmers
within the national farm survey sample. Most Member States use a unique identifier, but
24 The online survey suggests that this is not a main source of data in Denmark, France or Sweden. The
literature review supports this for Denmark where there is no need for any direct contact with farmers.
However, our case studies in France and Sweden suggest that this is a source for some data, although not an
important one.

Study on cost of and good practices for FADN data collection
37
this is not the case in Belgium, Cyprus, Germany, Hungary, Lithuania, Portugal, Slovenia
and Spain which precludes the (straightforward) use of secondary data in these Member
States. The need for a unique identifier is under active discussion in Germany.
The case studies also demonstrated that there are common technical reasons why
administration data do not match well with data for the farm business; a farm business
may contain more than one holding for which separate administrative returns are made
and, conversely, what superficially appears as a complete business may be part of a
larger entity which has been split for taxation or similar reasons. For example, Germany
has particular problems associated with its large corporate farms, and accountants are
paid additional fees to ‘consolidate’ sets of accounts into businesses that conform to
national farm accounts survey requirements.
A second question in the online survey asked whether the data collection methodology
differed by type of information and by the characteristics of the farm (size, legal status
and type of farming). It frequently does, as the next sections illustrate.
5.3.1.2. Differences by type of information
According to the replies to the online survey, Member States tend to use a variety of data
collection methodologies according to the type of information. Nine Member States (France,
Germany, Greece, Hungary, Italy, Lithuania, Poland, Slovakia and Spain) replied that the
type of information was not a determinant of the data collection methodology used.
However, where data are taken from farm accounts drawn up for taxation purposes (at least
for those farms that are required to keep accounts for tax purposes) as the basis for the
FADN Farm Return (such as France, Germany, Lithuania and Spain), it is still necessary
to obtain some data from other sources, principally by the direct questioning of farmers,
about variables that are not covered in business accounts, even though this was not
indicated in the survey responses. Even in the Netherlands, where every effort is made to
utilise existing material (the records of commercial transactions, administrative data, bank
accounts, taxation records (and more), almost all used with the explicit agreement of the
farmer) some direct data collection from the farmer is still required. However, this is kept
to a minimum; putting direct questions to farmers typically takes less than two hours per
year, and this mainly relates to sorting out queries about data.
5.3.1.3. Differences by size of farm
According to the online survey, the methodology used differs by the size of farm in Austria,
Estonia, France and Romania. Information from the case studies establishes that the real
issue causing the difference is not size but the taxation status that is linked with size in
national taxation systems relating to income or VAT; this link is not direct but reflects the
amount of income or turnover generated. The implication is that, for farms below a certain
national threshold, data for national farm accounts surveys (and hence for EU-FADN) are
not in existing accounts but have to be collected direct from farmers. The case studies
throw light on to this situation.
In France farms below a certain turnover (receipts) threshold (a two year’s
average under €76,000) do not need to produce accounts for tax purposes as
below this level there is an option to be taxed under the régime du forfait collectif,
a collective standard basis rather than on actual income. In our literature review,
the OECD (2005) report on taxation in agriculture describes the rather complex
arrangement in France and points to the need for caution when using the word
‘revenue’ which can mean receipts (=turnover) or income (net, after the

Study on cost of and good practices for FADN data collection
38
deduction of costs), depending on circumstances25. Accountancy offices already
hold data for farms for which they draw up tax accounts, but for those below the
threshold they have to act as data collectors.
Farms below a certain size in Germany also have no obligation to produce
accounts. According to OECD (2005) a “flat-rate” system applies below an area
ceiling of 20 hectares; other ceilings are in place for animal production, vineyards
and other activities. As in France, the implication is that accountancy firms (that
supply data to the national farm accounts survey – the TBN) have to collect data
in order to prepare accounts for these small farms before it can be extracted, for
which an additional fee is paid.
In Lithuania small farms similarly do not have to keep accounts. These
represent about 10% of farms in the sample. As is the case for France and
Germany, direct data collection has to take place in a different way for these
farms by the (public sector) Lithuanian Agricultural Advisory Service (LAAS) using
questionnaires.
5.3.1.4. Differences by legal status
Data are often collected from company farms (legal persons) in a way different from that
used for family farms. In response to the online survey, ten Member States reported this
(Austria, Czech Republic, Estonia, Finland, Germany, Hungary, Lithuania, Poland,
Romania and Slovakia). The case studies point to the significance of the national
taxation system, in that accounting appears to be mandatory for companies even where
it is not for all private (‘family’) farms. For example:
In Germany in-house accounting staff in company farms, predominantly in the
East, complete the national accounts survey questionnaire themselves and submit
this directly to the State body responsible for data collection; they are known as
“self-bookers”.
A similar situation prevails in Poland.
In Lithuania, data from company farms are collected by the Liaison Agency
rather than the advisory service which collects data from family farms. The
Liaison Agency (LIAE) supplies companies with questionnaires once a year that
contain provision for all the required data (including that which would not
normally appear in company accounts). Unlike the occupiers of family farms,
companies in Lithuania receive a fee (equal to the EU contribution per Farm
Return, currently €160) for providing the information, that sometimes comes
electronically and sometimes on paper.
Caution has to be exercised in making simplistic assumptions that a ‘family’ farm cannot
also be a corporate farm. The literature points to the fact that, for example, many farms
in the UK that are entirely owned and managed by single families and often also largely
operated by them (in the sense of labour input), adopt the status of corporations for
taxation convenience or as ways of equitably distributing farming assets and income.
Though the proportion tends to increase with farm size, examples can be found
throughout the size spectrum. Furthermore, in the way they function they often behave
as if they were not corporations. In the UK no distinction results from corporate status in
the way in which data are collected; a legal requirement to keep accounts for taxation
purposes applies universally. In practice family farms run as companies are treated
normally as if they were non-incorporated for the purpose of measuring family labour
input.
25 This ambiguity, even within the WTO Agreement on Agriculture, has important implications for what forms of
income stabilisation schemes are permitted; it appears not to have been tested by challenge.

Study on cost of and good practices for FADN data collection
39
5.3.2. Data sources used
A variety of sources are used to generate the data required to complete the national farm
accounts surveys, and these are partly correlated with the methodologies employed.
Among the sources emanating from the farms themselves, or accountants working with
them, in our online survey the most commonly reported source of evidence used to
supply the data is farm accounts, whether drawn up for other purposes or specifically for
the survey. According to the replies, only Belgium, Cyprus and Malta do not use
accounts as an information source; it should be recalled that this includes data for
company farms, which may represent only a small proportion of the total.
Twenty Member States use evidence from log books for at least some farms; this is
usually used to supplement information available from accounts by providing greater
detail. Entries in logbooks in both Poland and Lithuania are not universally backed up
by documented evidence, so an element of recall is implied in their completion.
In 25 Member States at least some information is recalled by farmers with explicit
documentary support, the exceptions being Cyprus, Denmark and Sweden; some 18
Member States also use farmer recall without documentary support, a group that almost
completely lies within the previous one (the exception being Cyprus). Our case studies
provided evidence that such methods relate primarily to variables that do not appear in
conventional tax accounts but which are required by EU-FADN or for national purposes;
even in the Netherlands, where efforts are made to utilise all existing data, the need to
collect some material from farmers is not totally absent. Sweden (and Denmark)
reported that they do not use farmer recall (with or without documentary support) as a
source.
Turning to the sources of data that come from outside the farm business, external
sources (banks, input suppliers, etc.) are used by 11 Member States. Among case study
countries these are an important source of information (for accountants in compiling farm
accounts, so before completion of the national survey) in Germany and in the
Netherlands.
Administrative records were cited as an information source in our online survey by 22
Member States (the exceptions were Germany, Hungary, Lithuania, Poland, Slovakia,
Spain and the UK (England)). The literature review underlined the importance of
matching data sources by a unique identifier and the variation in the challenges this
presents, from being relatively simple in Malta to being highly complex in the UK.
However, our case studies suggested that there may be a subtle difference between, on
the one hand, the use of such data to complete the national farm accounts survey and,
on the other, to check or verify what has already been collected from farms. For
example, in Germany though it is not possible to use administrative data in completing
the national survey, it is possible to use some administrative data (IACS and cattle
movement information) to verify data provided by farmers. In Lithuania data from IACS
is provided to the data collector directly, but this is with the permission of the farmer. In
Poland there is access to administrative data for checking purposes (though there are
technical reasons why it may not match and legal constraints on its use). Among the
case studies the greater use of administrative records in electronic form was frequently
mentioned as something that is desirable (Germany, Italy, Lithuania, Netherlands,
UK). This issue is revisited in the analysis of Theme 3.
5.3.3. Data recording methods
Many Member States use more than one method of recording data from the farm. The
online survey asked about paper recording for subsequent electronic data entry, direct

Study on cost of and good practices for FADN data collection
40
electronic data entry online, the same but offline, extraction from other software
packages and other. Those indicating only one method were Bulgaria, Malta and Spain
(paper recording); Croatia, Greece and Slovakia (direct online entry) and Ireland (direct
offline entry). The most widely used method of data entry remains paper recording for
subsequent electronic entry (22 Member States); according to the online survey this
method is used by all Member States with the exception of Croatia, Denmark, Finland,
Greece, Ireland and Slovakia. Mostly it is used in parallel with other methods.
Data collectors in 16 Member States enter data electronically online (those in italics also
enter data offline): Austria, Croatia, Czech Republic, Estonia, Finland, France, Greece,
Hungary, Latvia, Lithuania, Netherlands, Portugal, Romania, Slovakia, Slovenia and
Sweden. Data are entered electronically but only offline in Belgium, Cyprus, Denmark,
Germany, Ireland, Italy, Luxembourg, Poland and the UK. According to the literature
review, in Ireland farmers appear to contribute to the data entry; they are provided with
a customised tool for this purpose (in Microsoft Excel). In Croatia the online tool
developed for data collectors in accounting year 2013, which allows the submission of
Farm Returns online and runs some preliminary data quality checks (limits, coherence
test, etc.), was planned to be accessible to farmers as a replacement for their ‘log book’
(Jelaković, 2013); it may now be in use.
The only Member States not reporting the use of either online or offline electronic data
entry are Bulgaria, Malta and Spain (clearly data are entered electronically at a later
stage).
Finally, a group of 13 Member States extracts data from other software packages,
although none do so exclusively: Cyprus, Czech Republic, Denmark, Finland, France,
Germany, Lithuania, Netherlands, Portugal, Romania, Slovenia, Sweden and the UK
(England, Scotland and Wales).
5.3.4. Reasons for the methods used
As part of the base on which to build up the inventory of national approaches to the
organisation of the national farm surveys and the data collection methodologies,
respondents were asked to indicate the importance of a number of reasons for the data
collection processes used by means of a scale of “very important”, “quite important”,
“not very important” or “not a factor”. Assigning these options a score of 3 for “very
important” to 0 for “not a factor”, it is possible to weight the relative importance of the
different rationales26. It is recognised that these can only be a perception by the
respondent, but nevertheless might be useful in explaining the status quo and could be
built on during discussions with case study countries.
According to the replies, the most important rationale for the data collection process used
was “best practice” with an average score of 2.6. “Driven by data availability” was
second (2.4) followed by a desire to “reduce the burden on farmers” (2.3). The need for
robust data in order to make “evidence-based policy decisions” was fourth (2.1) followed
by “least cost” and “robustness” (2.0). Perceived reluctance to change the data
collection process by farmer organisations received the lowest scores and therefore is not
generally regarded as an explanatory factor in the approach taken.
There were, however, some interesting exceptions. For example, Latvia and the
Netherlands did not consider “best practice” to be a factor in their approach to data
collection. Legal restrictions on the use of data, while not generally considered
important, were “very important” in Belgium, Germany, Luxembourg, Slovenia and
Spain. Also not considered generally important was “acceptance by farmer
26 The average of the country responses was used in the UK.

Study on cost of and good practices for FADN data collection
41
organisations”, although this was “very important” in Estonia, France and Slovakia. In
Italy reluctance to change the process by farmer organisations is seen as “very
important”; this is also the case for stakeholders in Cyprus, Czech Republic, Greece, Italy
and Portugal.
In summary, most Member States cite a number of important reasons to explain the way
in which data are collected and it is not possible to identify specific groups of Member
States using this metric. Also it might be noted that the response to the online survey to
this qualitative question may not have represented the considered opinion of the Liaison
Agency as an organisation, even less that of the supply chain as a whole.
5.3.5. Changes to methods used and rationale
The online survey asked whether there had been changes in the general collection
methodologies in the last ten years (or since accession where appropriate). Explicitly,
changes in scope of data collected or in sample sizes were excluded from consideration.
In their replies, nine Member States indicated that they have made changes (some
multiple) to the way in which they collect data in the last ten years/since accession
(Luxembourg and Poland plan to make changes from 2015). Generally greater emphasis
has been placed on secondary data sources. Greater use has been made of
administrative data in five countries (Denmark, Estonia, Greece, Ireland and Italy and is
planned in Luxembourg); accountancy packages used by farmers (Lithuania and the UK
(England and Wales)); and, electronic bank data (planned in Luxembourg). However,
greater use has been made of primary data collection from the farmer in Greece, Italy,
Lithuania and Slovakia.
The Member States which have made changes (and also Luxembourg and Poland which
are planning to) provided a number of explanations for them in the online survey. The
two most common were to improve the quality of the data (eight Member States) and
the adoption of best practice (seven Member States). A desire to reduce the burden on
farmers and to improve timeliness were each cited four times. Only three Member States
noted that the changes made were driven by a change in data availability, and two that it
was due to a change in policy on data collection.
Of the case study countries, five reported changes in the online survey (Italy, Lithuania,
Poland, Sweden and the UK (England and Wales)). Further discussion gathered the
following information:
Italy: the reply to the online survey indicated both the greater use of secondary
data and of primary data collected from the farmer. The case study discussion
found that there has been a change and improvement in software; the GAIA
software, first launched in 2004 has been further improved since 2008. In 2009,
an IT procedure allowing direct data checks by data collectors (GAIA-TEST) has
been fully implemented in GAIA. In 2010, an IT procedure for verification of farm
typology (CLASS-CE) has also been launched. The evolution of IT tools for the
carrying out of data collection and validation has mostly been focused on time
saving and improvement of final data quality. In addition, data checks have
become the responsibility and direct management of the Istituto di Nazionale
Economia Agraria’s (INEA) from 2005 onwards. As for the organisation of data
collection, most of the protocols for carrying out FADN data collection activities
between INEA and Regional Governments have been replaced by direct
assignments to INEA’s regional offices. At present, the only protocols still in force
are those with the Emilia Romagna region and with the Autonomous Provinces of
Trento and Bolzano.
Lithuania: there has been no change in the organisational structure of the
national farm accounts survey, but the greater use of farmers’ own accounts

Study on cost of and good practices for FADN data collection
42
(software packages), and of primary data collected from the farmer. The data
collector (Lithuanian Agricultural Advisory Service, LAAS) is aware of a general
trend towards greater automation, which saves time and money and reduces the
burden on farmers. On balance these represent evolution rather than a distinct
change.
Poland: the main change (which is not strictly within the period covered by this
study) has been the introduction in 2015 of an online electronic data transmission
system, after two years of tests with the 200 company farms in the survey.
Previously data were entered by the advisors (data collectors) in the local offices
of the Agricultural Advisory Centre and sent by email (attachments) to the Liaison
Agency (IAFE-NRI).
Sweden: there have been no organisational changes, but there is a greater use
of administrative data (IACS, etc.). The Swedish Statistics Act provides the
authority to access administrative records, and even specifies that existing
information should be used where possible. In a matter of detail, there have been
changes to the valuation of buildings and the calculation of depreciation.
United Kingdom: the main organisational change in England has been the
replacement of a set of agreements with separate universities and colleges to
collect farm accounts survey data by a contract, awarded by tender, to a
consortium of them (RBR) led by the University of Nottingham. This makes
procurement and contract management less time consuming for both parties and
has promoted a more consistent approach to data collection across the individual
centres. Greater use of farmers’ own accounting packages is taking place, but
this is an evolutionary rather than a discrete form of change.
5.3.6. Data validation
Data are generally validated at multiple points in the data supply chain and using a range
of techniques from informal examination to deep scrutiny and by people or IT systems.
The online survey asked whether validation took place at three discrete points: (i) when
collected from the farm/accountancy firm, (ii) when entered into the regional/area data
bases (this will in part reflect if there is a regional structure to the collection system) and
then (iii) when entered into the national farm accounts system. Of course, all Farm
Returns are subject to validation checks by the Commission when data are entered into
RICA-1, but the focus here is what happens at national level; checking and correction
here can be expected to reduce the number of rejections and queries generated at the
RICA-1 stage.
According to the online survey replies, in Belgium, Finland, Germany, Italy, Netherlands,
Portugal, Spain, Sweden and the UK data are validated at all three stages. At the other
end of the spectrum, data are validated only on entry into the national system in Austria,
Denmark, Greece, Romania, Slovakia and Slovenia. In Malta validation only took place
when collected from the farmer and not at a later stage. Data are not confirmed with the
farmer in Austria, Bulgaria, Denmark, France, Greece, Romania, Slovakia and Slovenia.
The case studies showed that validation is an activity that typically is taken very seriously
by Member States, not least because it can lead to a reduction in rejections at the RICA-
1 level and the subsequent need for correction involving investigation often going back to
the farm level (with an implication for national costs). Most Member States, though not
all, have a system to check data when it is first collected, often initially informal by
experienced staff, but also with IT programmes that flag up inconsistencies and
implausible figures.
IT programmes are also used, almost universally, to check at later stages in the data
supply chain (only Bulgaria appears not to use such a programme). Several Member
States specifically mention the procedures to update these programmes as issues

Study on cost of and good practices for FADN data collection
43
become evident – they are learning systems. However, these IT solutions use software
that it seems are always designed nationally, with no examples encountered of
international cooperation or integration at EU level (before the RICA-1 stage) other than
the use by Luxembourg of accountancy software provided by Germany mentioned in the
literature review. This issue is revisited when costs and best practice are considered
under later Themes.
Bulgaria: checks are operated at different levels of the national FADN chain. A first
control is made by the expert when inserting data in the Excel file from the paper format.
A second control is made by the regional coordinator by a cross-checking with the
national agricultural payment agency data, but the aggregated level of the data is not
completely comparable so this is not seen as an efficient control system. A third
(occasional) control is made by the Liaison Agency during the upload to RICA-1.
Although each officer is capable of detecting anomalies in data when these are
transmitted by them from one format to another, often anomalies are not picked up until
the data are uploaded on RICA-1. As noted above, no national checks appear to be IT
based.
France: data are mainly checked through a computer-based consistency control. As
reported to the online survey, there does not appear to be validation when data are
collected by accountancy offices (bookkeeper firms) from existing accounts or for ones
drawn up especially for FADN by accountants. Rather, they are first checked by the
Regional Officers, after accountancy offices have uploaded the data in the national
software (called RICA-2 and not to be confused with the EU-level RICA-2 system). This
check can take up to one working day per Farm Return. A second check is then
implemented at national level by the Ministry of Agriculture (SSP), based on the same
methods and tools (consistency control operated at national level). The inclusion of
qualitative items in the scope of the FADN survey raised some concerns on the
effectiveness of the checking process for this part of the data.
Germany: all returns to the national farm accounts survey (TBN) are checked by
Winplausi, a plausibility check programme which highlights missing and suspicious values
and flags these for investigation and ultimately correction or explanation. This
programme also provides logical checks such as if there is milk production there must be
dairy cows. Winplausi is used at multiple levels, first by bookkeepers and again by the
regional organisation responsible for the TBN. The rationale for the use of Winplausi by
bookkeepers is that it is best to identify and correct mistakes as early in the process as
possible when it is easier to find explanations. The second check performed by the
regional body responsible for the TBN is essentially to ensure that all of the necessary
explanations have been provided. Additional checks are carried out by the BMEL before
transmission of the data to the Liaison Agency. The use of Winplausi throughout the data
supply chain acts as a form of due diligence, with each organisation involved being as
sure as they can be that the data passed along are accurate. The Winplausi system is
considered very effective and the Liaison Agency reported that the number of Farm
Returns not accepted by RICA-1 for quality reasons is declining.
In addition to the Winplausi validation checks, the LfL in Bavaria (Institute responsible for
implementing the TBN) carries out an annual control mission under which farms are
visited in the presence of the accountancy firm responsible for their Farm Return. This is
effectively an audit to assess the performance of the bookkeeper.
Italy: direct checks on individual items in Farm Returns are carried out by data collectors
using the GAIA software (GAIA-TEST). Inter-farm checks and validation of completed
Farm Returns is then carried out by INEA in the regional offices, prior to the upload of
completed Farm Returns to RICA-1. A third and final set of checks and validation takes
place at the INEA central office. These are statistical checks (e.g. detection of outliers)

Study on cost of and good practices for FADN data collection
44
on the entire set of completed Farm Returns (these checks do not concern individual
items in completed Farm Returns).
Lithuania: the first stage of validation is at data collection. If data appear incorrect, the
collector (LAAS staff) asks the farmer to explain or correct the information. Queries are
raised on data entry and also where document evidence does not seem correct. The
software has a pop-up system for checking rogue data entry. Farmers are also required
to sign a document to say that the data they have provided are correct. Data checking
continues by the LAAS once the data have been transferred to the LIAE (the Liaison
Agency) server. When LAAS is satisfied that a Farm Return is complete it is marked as
such on the LIAE server. It is not possible to mark a Farm Return as complete if there
are missing data or errors identified by the software. Once the record has been finalised
by LAAS, the LIAE begins to validate the data. Queries are raised with the advisors. The
national control programme is designed to suit the data collected, but also to be
consistent with the RICA-1 checks to reduce the instances of these. For company farms
(from which data are collected directly by the LIAE) queries are raised by the LIAE as
these farms are less receptive to being questioned than private farmers and it therefore
can take longer to resolve queries.
RICA-1 generates queries and these usually take around two weeks to justify and/or
correct. The error rate is very low and most errors are warnings only.
Netherlands: the work flow management approach of the central server prompts
questions when data are entered that are followed up by data collectors. There is a
systematic programme of assurance of data quality, from the data entry stage using
double entry bookkeeping, through RIA (relevance, integrity and actuality) rules,
confirmation, feedback reports, visual inspection, farm comparison, all before the RICA-1
checks are run. Data are checked by sector specialists in their reporting. RICA-1
generates a few queries, usually to do with issues of odd holdings and with continuity
(such as inventory changes).
Poland: data are checked in the first instance by the AAC advisor (the data collector
organisation) in discussion with the farmer. The next check is online when the data are
entered into electronic form; the software highlights possible entry errors. The regional
coordinator then assesses the data and looks for outliers. A validation programme is
then run on the data to check for anomalies and outliers. Mistakes are rectified or an
explanation provided where the value is judged to be correct. Ultimately the regional
coordinator must approve explanations. The Liaison Agency (IAFE-NRI) carries out
further data checks when it receives the data including a comparison against average
data from similar farms. All explanations provided by the AAC advisors are read and
assessed by IAFE-NRI staff. This assessment identifies systematic explanations which
may have been provided generically and therefore ensures that each explanation is
specific. The farmer must sign the results (when returned) to say that they are accurate.
Payment (to the AAC and the farmer) is only made when this has taken place, so this is a
fourth level of testing/validation.
There is also an audit function. The IAFE-NRI identifies farms where the data do not
appear to be correct. There is then an investigation with the farmer to see how
frequently the extension officer has visited the farm and the farmer is asked to let the
IAFE-NRI review the farmer’s books. Where an account is rejected the payment is not
made.
Sweden: data validation begins on data entry where LRF-Konsult (the main data
collector organisation) uses a check list developed by Statistics Sweden designed to
reduce the number of subsequent queries (implemented from 2013, accounting year
2012). The IT application has an integral data validation system (including simple issues
Study on cost of and good practices for FADN data collection
45
such as if there are dairy cows there should be milk and checking for rogue data entry).
Continual improvements are introduced as issues become apparent. Once data have
been transmitted to Statistics Sweden, their system, which has a more sophisticated
validation and control system, generates questions which are sent out to LRF-Konsult for
explanation/amendment27. A record is retained of queries made for each farm. This
allows systematic issues to be identified and further checks introduced as required. This
also means that once a query has been addressed, it is retained for future reference and
need not be asked again if a suitable explanation has been provided. This can be seen as
good practice. When the data have been validated they are submitted by Statistics
Sweden to RICA-1 which then automatically raises additional queries which are
addressed.
United Kingdom: the process of validation is similar in each of the four countries that
constitute the UK, but these are undertaken separately and with differences in detail.
England: Defra (as Liaison Agency) does not have a role in carrying out routine
validation itself in England; the procedures are carried out by the data collector
organisation (RBR). Defra’s current role is to specify additional systematic validation
checks when analysis shows something that does not look right. Informal validation by
RBR starts with the data collectors, whose background means that they understand what
would be credible numbers. Formal validation starts when data are entered into Excel
workbooks used as the first stage of data entry; there is a validation system within these
workbooks. Some checks are based on ranges (data can be outside the range with an
explanation); others require a balance that must be correct. The Duchy College, which
brings the workbooks together for all the regional collector organisations into a single
database, carries out validation as well.
Scotland: there are several steps in the data validation process. There are more than a
thousand checks within the software used by Scotland’s Rural College (SRUC), which
collects the data. These are essentially logical tests, stock reconciliations, etc.. Any
specific issues are logged and addressed so that these can be communicated to the other
analysts. One member of the team assesses all accounts before they are finalised; this
picks up issues which are not of a technical nature, for example atypical
enterprises/results which should not go forward into the averages (large changes in the
size of enterprises, for example). Two to three days are set aside to review for errors
before submission. RICA-1 also generates queries. These are declining year on year and
can now be dealt with in a total time of three weeks. Atypical farms are not submitted to
FADN, which reduces the queries to some extent; these include issues such as off-farm
income from large wind turbine developments which result in a sudden increase in
income.
Wales: validation checks first take place when data are entered into a laptop by the
Institute of Biological, Environmental and Rural Sciences (IBERS) data collector, usually
on the farm; there is a programme that flags up any queries. Another check takes place
before the holding’s records are submitted to the country’s database (at
Aberystwyth/IBERS). Then there are checks in the office by some staff whose job is to
look for suspect entries and inconsistencies. Then Type 1 and 2 FADN-type tests are run,
before sending to Duchy College/RBR, which also runs tests and sends any queries back
to Aberystwyth, where they are directed to the member of staff who signed off the
account. Queries have to be resolved and signed off; these include explanations for
outlying figures. The data are then submitted to RICA-1 (via Duchy College), from which
again there may be further queries.
27 This new system has generated some efficiency savings. It is also very flexible. New variables and controls
can be added easily and at low cost.

Study on cost of and good practices for FADN data collection
46
Northern Ireland: there is now a system of macros to check the data, but this is
relatively new; validation now takes place within Excel using macros rather than the
previous Fortran system. Prior to its introduction validation was undertaken in a specific
programme into which the Excel sheets (containing data transcribed from the paper
Northern Ireland Farm Return) were uploaded. Now there is a validation programme run
on the Liaison Agency (DARD) system which raises queries for the fieldstaff. This has
reduced a step in the data chain. Any queries are passed back to the fieldstaff. After
validation a programme then calculates the variables for the FADN return from the
database which is uploaded to RICA-1.
Box 5.3: Case study of USDA’s ARMS: Data collection
ARMS data are collected in three data phases:
Phase I, the ARMS Screening survey, collects general farm data such as
crops grown, livestock inventory and value of sales. Screening data are used
to qualify (or screen) farms for the other phases. Phase I screening is performed by
post and phone; when replying to postal questionnaires, responses can be returned
on the printed form or through electronic data reporting (EDR). Operators that are
in business and/or have the commodity of interest are eligible to be selected for
Phase II or Phase III. The commodity of interest is determined by the ERS.
Phase II collects data associated with agricultural production practices,
resource use and variable costs of production for specific commodities.
Farm operators provide data on fertiliser and nutrient applications, pesticide
applications, pest management practices and irrigation. Phase II data are collected
by personal interview.
Phase III collects whole farm finance, operator characteristics and farm
household information. It is this Phase III element that most closely resembles
EU-FADN in terms of the scope of its questions. Farm operators provide data on
farm operating expenditures, capital improvements, assets and debt for agricultural
production. In addition, operators provide data on farm-related income, government
payments, the source and amount of off-farm income and characteristics of
themselves and their household. The ARMS Phase III is very detailed, which requires
the majority of interviews to be completed in person, being conducted by trained
USDA-NASS enumerators. Farmers are requested to have their accounts (drawn up
for tax purposes) available, from which data can be extracted. There is a detailed
Interviewers’ Manual that establishes protocols for making contact with farmers and
for collecting data. According to the 2013 Manual, it appeared that in 2013 recording
was on paper, though transition to the use of iPads for data entry is underway; in
2014 only about 2% of data entry was electronic28. Data collectors were
recommended to interview the farmer (rather than another person) and to give an
indication of the average length of time needed. No administrative data are currently
used, although the secure use of such data is a topic under discussion.
At USDA-NASS, editing (validation) is first done manually on paper questionnaires and
then electronically on individual reports as well as at the macro level. SAS computing
procedures check for errors in coding, physical relationships (such as yield limits) and
simple economic relationships between interrelated questionnaire cells. This is a similar
validation process to that undertaken in EU-FADN in many Member States.
5.4. Typology of national farm surveys
As has been demonstrated above, there are lots of ways of categorising national farm
surveys, but usually only by one metric at a time; there is little consistency in the
28 http://www.nass.usda.gov/Surveys/ARMS_Progress_Report.pdf
Study on cost of and good practices for FADN data collection
47
groupings produced when categorisations by different metrics are produced. The focus of
this study is on organisation, data collection, costs, use and best practice, so any
typology needs to be oriented in these directions. For example, it is possible to produce
a typology of Member States by coverage of holdings within FADN, but this is not directly
relevant to the study objectives.
With the aims of this study in mind, and within Theme 1, specifically organisation and
data collection, a typology based on data collection methodology appears to be the most
relevant as this reflects organisation and is likely to be a key determinant of cost. This is
set out in Table 5.1 where the status of the Liaison Agency is also identified. Our case
study Member States are identified within the typology in bold and it should be noted
that these are distributed well across this typology. Cluster analysis was used to validate
this typology (see section 6.3.4.5).
It should be stressed that the typology does not always represent a neat division; while
the situation in some Member States is clear, in others the reality is more complex than
it at first appears. For example, in many eastern Member States (and in the former East
Germany) legal entities (i.e. company farms) are treated differently from family farms.
Thus while in Germany data collection is usually by accounting firms, institutions
responsible for the TBN system in the Länder receive data directly from legal entities.
The situation is similar in Lithuania and Poland with public advisory services collecting
data from family farms and the Liaison Agencies receiving data from legal entities. This
is because legal entities are required to produce accounts (Lithuania and Poland) and
therefore have their own accountants to do this, or are of a scale where it is necessary to
employ their own accounting staff (Germany).
In some other Member States (Czech Republic, Italy, Romania) data are collected using
several data collector types. In Estonia half the number of Farm Returns are provided by
accounting firms and half by public advisory services; there is a similar split in Slovakia.
In Sweden, although the majority of data collection is by an accounting firm, the Liaison
Agency and the responsible government agency also collect data from a sub-sample of
holdings.
Finally, the UK appears to be a special case which could actually merit its own category.
In England, Scotland and Wales data are collected by university researchers, but in
Northern Ireland data are collected by the devolved government. While data collectors in
England, Scotland and Wales most closely resemble accountants in their function, as they
do not provide extension advice, the process they follow to produce national survey
returns is closer to that of extension agents. It therefore seems more appropriate to
place England, Scotland and Wales in the public advisory service typology. The data
collection process in Northern Ireland is closest to collection by a ministry, even though
the devolved government is not the Liaison Agency. The UK has therefore been split
between two of the categories
Data collection by Liaison Agencies is more common among EU-15 Member States than
in Member States that joined the Union from 2004 onwards. Ten Member States (and
Switzerland) use private accounting firms to extract data and seven (plus England,
Scotland and Wales within the UK) use advisory service staff (who in effect provide a
similar function to private accounting firms with the added benefit of being able to
provide advice). The approach to legal entities is sometimes different, but for simplicity
Member States with these organisations have been classified according to their approach
to family farms. In Lithuania and Poland legal entities provide a completed national
survey form directly to the Liaison Agency. In Germany legal entities provide completed
survey forms to the State organisation which is responsible for the farm survey. In all
three cases accountants employed by the legal entities extract the data required.
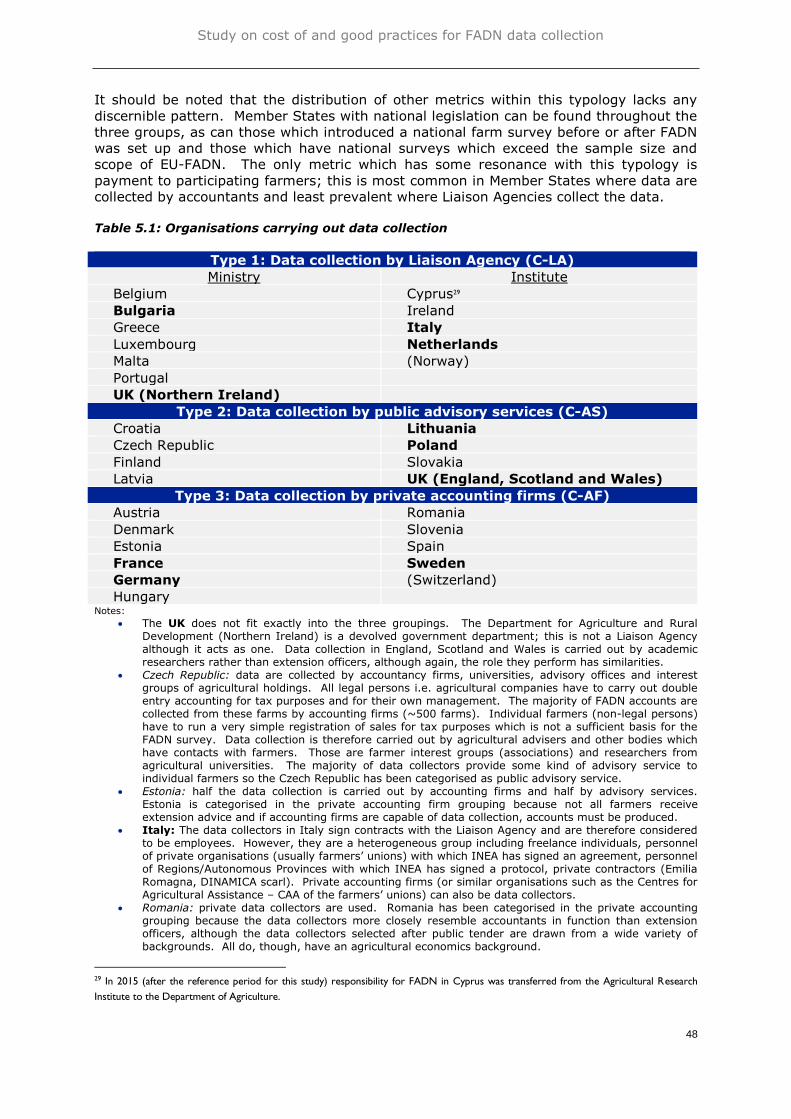
Study on cost of and good practices for FADN data collection
48
It should be noted that the distribution of other metrics within this typology lacks any
discernible pattern. Member States with national legislation can be found throughout the
three groups, as can those which introduced a national farm survey before or after FADN
was set up and those which have national surveys which exceed the sample size and
scope of EU-FADN. The only metric which has some resonance with this typology is
payment to participating farmers; this is most common in Member States where data are
collected by accountants and least prevalent where Liaison Agencies collect the data.
Table 5.1: Organisations carrying out data collection
Type 1: Data collection by Liaison Agency (C-LA)
Ministry Institute
Belgium Cyprus29
Bulgaria Ireland
Greece Italy
Luxembourg Netherlands
Malta (Norway)
Portugal
UK (Northern Ireland)
Type 2: Data collection by public advisory services (C-AS)
Croatia Lithuania
Czech Republic Poland
Finland Slovakia
Latvia UK (England, Scotland and Wales)
Type 3: Data collection by private accounting firms (C-AF)
Austria Romania
Denmark Slovenia
Estonia Spain
France Sweden
Germany (Switzerland)
Hungary Notes:
The UK does not fit exactly into the three groupings. The Department for Agriculture and Rural Development (Northern Ireland) is a devolved government department; this is not a Liaison Agency although it acts as one. Data collection in England, Scotland and Wales is carried out by academic researchers rather than extension officers, although again, the role they perform has similarities.
Czech Republic: data are collected by accountancy firms, universities, advisory offices and interest groups of agricultural holdings. All legal persons i.e. agricultural companies have to carry out double entry accounting for tax purposes and for their own management. The majority of FADN accounts are collected from these farms by accounting firms (~500 farms). Individual farmers (non-legal persons) have to run a very simple registration of sales for tax purposes which is not a sufficient basis for the FADN survey. Data collection is therefore carried out by agricultural advisers and other bodies which have contacts with farmers. Those are farmer interest groups (associations) and researchers from agricultural universities. The majority of data collectors provide some kind of advisory service to individual farmers so the Czech Republic has been categorised as public advisory service.
Estonia: half the data collection is carried out by accounting firms and half by advisory services. Estonia is categorised in the private accounting firm grouping because not all farmers receive extension advice and if accounting firms are capable of data collection, accounts must be produced.
Italy: The data collectors in Italy sign contracts with the Liaison Agency and are therefore considered to be employees. However, they are a heterogeneous group including freelance individuals, personnel of private organisations (usually farmers’ unions) with which INEA has signed an agreement, personnel of Regions/Autonomous Provinces with which INEA has signed a protocol, private contractors (Emilia Romagna, DINAMICA scarl). Private accounting firms (or similar organisations such as the Centres for Agricultural Assistance – CAA of the farmers’ unions) can also be data collectors.
Romania: private data collectors are used. Romania has been categorised in the private accounting grouping because the data collectors more closely resemble accountants in function than extension officers, although the data collectors selected after public tender are drawn from a wide variety of backgrounds. All do, though, have an agricultural economics background.
29 In 2015 (after the reference period for this study) responsibility for FADN in Cyprus was transferred from the Agricultural Research
Institute to the Department of Agriculture.

Study on cost of and good practices for FADN data collection
49
Slovakia: data collection is carried out by both the Research Institute of Agriculture and Food (an Institute) and the Slovak Agriculture and Food Chamber (more closely defined as an advisory service). The Chamber provides data for 360 holdings, 64% of the total (562). Slovakia has therefore been categorised in the advisory services grouping.
We expect this typology to provide a useful distinction between different approaches to
the organisation of national farm surveys which is likely to have bearing on costs; it is
less likely that a typology based on data collection methodology will have bearing on
benefits in terms of the use of the data. Without prejudice to later analysis, where the
costs of data assembly are partly met by farmers in order to meet their legal obligations
under taxations systems (use of private accounting firms), the net public cost of the farm
accounts system should be less than where the total cost falls on the public purse, for
example, where there is a need to produce accounts specifically for the farm survey
either by primary data collection or through other means. It is also likely that the
pattern of benefits will differ where data collection takes place alongside the provision of
advice or research. The impact in terms of best practice is likely to be dependent on
organisation with some approaches being lower cost while others potentially bring
greater benefits.
Throughout the rest of this report, the typologies will be referred to as Type 1: C-LA;
Type 2: C-AS; and, Type 3: C-AF with Tables and Figures grouped accordingly. Except
where the devolved authorities are treated separately, the UK appears as Type 2
reflecting the combined weights of England, Scotland and Wales in the overall UK picture.

Study on cost of and good practices for FADN data collection
50
6. THE COSTS OF COLLECTING FADN DATA IN MEMBER STATES
6.1. Key issues
6.1.1. Stages in the data supply chain
A central purpose of the present study was to establish both overall costs and those for
each stage of the FADN data supply chain between farm and RICA-1 (the entry point to
the Commission’s FADN database). To do this the authors have used a detailed
breakdown which reflects the information available in the Member States used as case
studies. In particular the data collection stage can often be broken down into sub-stages
which can assist with analysis and understanding. The breakdown is as follows:
A Overall management
A1 National FADN Committee
A2 Regional FADN Committees (where applicable)
B Design of selection plan
C Recruiting participating farmers
D Maintaining farms in the network (farmer feedback)
E Data collection
E1 Administration, management, etc.
E2 Training
E3 Data collection
E4 Data entry and collation
F Data quality control
F1 Pre-submission validation
F2 Post-submission validation
G Data storage (IT operation and management)
H Data processing and transfer to RICA-1
I DG AGRI FADN Unit time
6.1.2. Metrics of costs
Two metrics are used in our analysis of costs – money costs in Euro (for countries not
using the Euro conversions are made from national currencies at the official ECB rate of
exchange prevailing at the time) and labour time expressed in Full Time Equivalents30 or
hours per completed Farm Return31, as appropriate. Costs in financial terms were
obtained from our online survey while costs in labour time were estimated using the
Standard Cost Model approach in our case study countries. Financial figures relate to the
spending of public funds, i.e. both national and EU contributions.
The Standard Cost Model (SCM) is used by the Commission to assess the administrative
burden of policy measures on the basis of the average cost of the required administrative
activity (Price) multiplied by the total number of activities performed per year (Quantity).
This approach represents a useful means to compare the cost of activities between
Member States where the cost of labour differs and a comparison in unadjusted financial
terms would therefore be misleading.
30 National definitions of an FTE differ, see Brun-Schammé (2014) who requested actual average annual
working time for all salaried workers from Eurostat’s Labour Force Survey; these data are not published by
Eurostat. Actual annual time worked also fluctuates from year to year. 31 Figures presented in hours have been calculated from FTEs using the actual average annual working time
(2013) for all salaried workers data series (Eurostat), i.e. adjusting for different FTE definitions.
Study on cost of and good practices for FADN data collection
51
Under the SCM approach, the cost is generally estimated by multiplying a tariff (based on
average labour cost per hour including overheads) and the time required per action.
However, it is not strictly necessary to multiply the time requirement by a labour cost
because we are interested in a comparison between Member States and using a
representative cost would only scale up the time allocations and would not alter the
magnitude of any differences assuming that the same grade of staff is required to
perform the same duties. While the SCM can take account of other types of costs such
as equipment, this is not necessary in this application where the main cost is in data
collection, which is dominated by labour cost.
When using the SCM it is important that the scope of the activities for which a time
allocation is provided is the same across comparative groups; this is why we have
divided the task of supplying FADN data into discrete activities and requested from
Member States a breakdown of time requirements against these activities.
It should be noted that the purpose of the SCM methodology is to produce estimates
that allow an order of magnitude of the time commitment required to be identified. In
practice, case study respondents found it difficult to separate out the robust data on
overall time requirements into the different activities, and the results should be
considered an indicative rather than definitive guide to the allocation of time (see further
detail below).
6.1.3. Confidence in money cost figures
Money costs of the FADN data supply chain have been taken from what is shown in
government budgets, and a high degree of confidence can be attached to them. These
costs generally cover the entire national farm accounts survey activities, though in some
Member States (such as where data collection is undertaken by a separate organisation)
money costs for individual stages may be available from the same source and with the
same reliability. For countries which are case studies, the total cost (and, where
appropriate, costs for data collection) have been confirmed as part of discussions.
For some Member States in which data collection is undertaken by organisations under
contract awarded by competitive tender from the relevant government department, this
cost of data collection is a matter of commercial confidence and is not in the public
domain, though the overall cost of the national farm accounts surveys is. This applies in
the UK (England, Wales and Scotland). In the Netherlands, while the total cost of the
institute that carries out the farm accounts survey is a matter of public record, this also
covers additional activities; the cost of the survey (data collection and other related
functions) is again a matter of commercial sensitivity and, while an approximation in
money terms has been provided by a government source, it should not be regarded as
definitive as it too may cover more than the collection of farm accounts survey material.
Where work on farm accounts surveys is undertaken as a commercial operation under
contract, VAT may be chargeable. Of course, VAT will be received by the treasuries of
Member States and its charging therefore represents a redistribution. To improve
comparability between Member States we have endeavoured to measure costs before
VAT is applied.
In many Member States, some actions that are essential to the data supply chain are
undertaken by government departments other than the one that finances the national
farm accounts survey or by parts of the relevant department that are not covered by the
survey budget. Examples are statistical advice and the drawing of the sample. While in
some cases an estimate of the amount of labour input into such activities is possible,
their monetary cost will not be covered in the figures declared by Member States as the
cost of the survey.

Study on cost of and good practices for FADN data collection
52
Costs are taken gross, that is, before funding contributed by the EU in the form of the
standard fee per completed Farm Return accepted by the Commission is deducted. This
is to enable the operating costs of the farm accounts survey to be fully reflected. As the
fee is known, it is not difficult to make estimates net of the Commission payment if this is
needed, although given that the fee is the same per completed Farm Return across all
Member States such an estimation would not alter cost differences in absolute terms.
Very occasionally, and for specific purposes, national costs net of the fees received from
the Commission are cited; these circumstances are made clear.
Costs covered in the estimates here are those borne by public budgets alone. Where
farmers are obliged to keep accounts in order to satisfy national taxation requirements,
and pay accountancy firms to help prepare them, and these accounts are used as the
basis for data extraction, the private costs borne by the farmer are not counted within
our estimates given that they would have to be incurred in the absence of EU-FADN. The
rationale is that, if a farmer is recruited to the survey and he is already paying for the
drawing up of accounts, there is no additional cost to the farmer attributable to the
survey; alternatively, if the farm accountancy survey were discontinued, the private costs
of producing accounts would continue. A case could be made that, if farms would not
provide information because of the additional private costs incurred in doing so, then
payment to offset these costs should be made from public funds; in reality a number of
Member States make payments to farmers, but these are within public budgets and are
included in our cost estimates. So too are the additional costs of producing accounts for
farmers who are not obliged by tax regulations to keep accounts (as happens for small
farms in several Member States). However, private costs per se do not form part of our
costs estimates (the time input required by farmers or their accountants is separately
considered in our estimations of time requirements – see below).
No Member State was able to give direct information on the monetary cost of each of the
various stages (described above) of the data supply chain in the national farm accounts
survey, and some could not distinguish even the data collection cost. In the absence of
this information, an estimate has been made using information contained in the Standard
Cost Model, in which known labour inputs for each stage (or groups of stages) are used
as a distribution key for costs.
6.1.4. Confidence in labour input figures
As with money costs, greatest confidence is attached to the overall FTEs associated with
the national farm accounts survey. Within case study countries, the picture of FTEs used
at each stage was built up (usually in hour terms) by questioning respondents in
organisations along the data supply chain (typically the ministry responsible for funding,
the Liaison Agency, and the data collecting organisation, which in some countries are the
same). Confidence is also generally high when considering the data collection stage, in
that respondents have been able to give with some certainty the numbers of individuals
working on this activity and their full-time or part-time status. However, problems arise
when data collection is combined with other functions, such as the provision of advice
(for example, in Lithuania). When data collection and the provision of advice may take
place simultaneously rather than consecutively, the two might be considered as ‘joint
products’32 of the attendance of the fieldworker (in the economic sense). In such
circumstances an estimate of the time allocation by the organisation involved has to be
relied upon. In the absence of a detailed work-study exercise, such estimates have to be
taken at face value; only occasionally are alternative views of such proportions available.
It should be noted that data collection accounts for the large majority of the overall FTEs
used in national farm accounts surveys. Less certainty surrounds the FTEs allocated to
32 The production of wool and meat in sheep production is a classic example from agricultural economics.
Study on cost of and good practices for FADN data collection
53
other stages. Again there are problems of ‘joint products’; for example, in many
countries data entry is combined with the first (pre-submission) validation check, in the
form of a warning generated by the software alerting the person entering data of possible
mistakes or things to check for plausibility. Only in a few Member States (such as the
Netherlands) was the national source capable of providing a carefully worked out set of
estimates (a by-product of the project-type approach employed there). In other case
study countries the breakdown has been determined after careful questioning of national
officials and, though subject to scrutiny and tests of what seems reasonable (both in
relation to the national data chain and from comparisons with other countries) there was
no way of checking independently the validity of responses for individual items. The
results should therefore be treated as indicative rather than definitive.
For completeness, the time input of farmers (or their representative) has been included
in some analyses, based on their involvement with data collectors. As with the money
cost estimate, the time spent by farmers in activities required by national taxation
regimes (such as drawing up accounts) is not included. At the other end of the supply
chain, time spent by the Commission in raising queries arising from RICA-1 testing is also
allowed for because this will differ according to the quality of the national validation
programme. Inclusion or not of these two categories in our analysis depends on
circumstances.
6.1.5. Separability
Costs related to FADN data collection need to be distinguished from those of other
activities of the operators. A point of principle adopted in this work is that the legal
requirement to collect data for the FADN under Council Regulation (EC) No 1217/2009 of
30 November 200933 means that the costs of doing so are core costs. The implication is
that, when asking Member States for information, FADN costs have to be extracted from
total costs of national farm accounts surveys by deducting the marginal costs associated
with the additional material contained in the national accounts survey. This can take the
form of additional questions, depth of questions, additional holdings, or any combination
of these.
When dealing with national accounts surveys that use a broader scope than FADN (such
as the coverage of off-farm income or for greater depth required for national purposes),
online survey respondents and case study interviewees were asked for the saving that
would be achieved by not requiring these non-FADN questions to be asked. Because
national questionnaires differ greatly, the potential time saving is specific to individual
countries. Again reliance had to be placed on the professional expertise of the
representatives of the data collecting organisations; some case study countries found the
question very hard to answer (not least because to them what is a FADN variable and
what a national one is not usually evident), while the range of responses among those
that attempted an answer went from 0% time saving in data collection by omitting
national questions to 25%. Where figures have been given, they have been used as
adjustment factors (see section 6.3.4.1). In some Member States sometimes additional
questions of a more detailed nature are asked, the purpose of which is to provide a more
robust answer to FADN questions; the point was made that a saving in time by not
collecting this data would have to be spent on additional validation.
When the national survey has a larger sample than is required by FADN, there is a prima
facie case for making a pro-rata reduction in the total cost. However, this is too
simplistic an approach due to the presence of fixed as well as variable costs. In addition
33 This is the basic regulation in operation during the period to which this study relates. It can be traced back
to Council Regulation 79/65/EEC of 15 June 1965 which established the legal basis for the organisation of the
network.

Study on cost of and good practices for FADN data collection
54
to this, Member States typically maintain a somewhat larger number of farms in their
sample to ensure that their commitment to FADN in terms of Farm Returns is met fully,
so some margin is ‘normal’ and does not represent an attempt to have a larger national
survey. Hence, in our analysis we have only considered larger national samples where
they meet explicit additional national needs.
6.2. Resource (time) costs of supplying FADN
It is possible to build up the time resource requirements necessary to supply data to
FADN from the labour required at various stages in the FADN supply chain. This has
been done in two ways: first based on total time requirement and allocation to main
activities (for all EU-28 Member States using evidence gathered via our online survey);
and, second through more detailed discussions in our case study Member States which
have allowed us to break the FADN supply chain down by stage and also by the
organisations involved. This methodology follows the Standard Cost Model approach.
Our findings are presented in section 6.2.1 and section 6.2.2 respectively.
6.2.1. Total time requirement and allocation to main activities
Our online survey asked Liaison Agencies to provide the number of full-time equivalent
(FTE) staff employed on the key tasks34 related to the national farm accounts survey in:
a) data organisation and processing (including validation);
b) data collection (where this is a task of the Liaison Agency); and,
c) data collection where this is carried out by other organisations (if known).
The findings are reported in Table 6.1. The final column provides the time in hours per
completed FADN Farm Return to allow comparisons between Member States taking into
account different sample sizes. This table should not be directly compared to later
investigations of time requirements in case study countries because the information here
only relates to the major time requirements for the Liaison Agencies and data collectors
(where different) and is therefore a (slight) underestimation of total time requirement.
Detailed discussions in the case study countries allowed estimations to be produced
where the exact number of FTEs involved in data collection were either not known or
could not be provided in our online survey for reasons of commercial confidentiality.
The total number of FTEs required to provide data to FADN varies enormously by Member
State, although this is heavily influenced by the sample size (the use of our typology is
only meaningful after adjustment for sample size, i.e. the final column in the Table). The
lowest number of FTEs required (not including Member States for which not all FTEs are
known) is Sweden at 5.0, followed by Latvia and Cyprus with 8.0 FTEs each. The highest
number of FTEs is required in Poland (375.3), followed by Italy (97.1) and the UK (83.8).
In terms of labour input used (in hours) per completed Farm Return, not including farmer
time and again excluding Member States with only partial information, the greatest
labour requirement is 80 hours in Luxembourg, followed by 75 in Belgium, 71 in
Lithuania, 59 in Poland and 55 in the UK. However, in Luxembourg, Lithuania and the UK
the national sample size exceeds FADN requirements and dividing the time requirement
by the national sample size reduces the time requirement per completed national
questionnaire to 40, 54 and 42 hours respectively. This leaves Belgium (75 hours per
completed EU-FADN Farm Return) and Poland (59 hours) as the most labour intensive
34 Some additional time is required for activities not covered under these headings and other organisations
besides the Liaison Agencies and data collectors are involved, but as will become apparent in section 6.2.2 in
both cases this is relatively marginal.

Study on cost of and good practices for FADN data collection
55
systems. At the other end of the spectrum, only seven hours are required per completed
Farm Return in Germany (five if total time is divided by the larger national sample size)
and Sweden, eight in Spain and ten in France. All four of these Member States fall into
Type 3: C-AF where data collection relies on already completed accounts which reduces
the time requirement per completed Farm Return considerably.
Table 6.1: Labour requirements for supplying national farm accounts survey data
Year Liaison Agency
Is time
require-
ments for
data
collectors
known?
Time
require-
ments for
data
collectors
(FTEs)
Total
time per
FADN
Farm
Return
(hours)
Data
organisation
and
processing
(including
validation)
(FTEs)
Data
collection
(if
applicable)
(FTEs)
Type 1: Data collection by Liaison Agency
Belgium 2014 10.5 46.6 No - >75
Bulgaria 2013 3.5 19.1 N/A - 20
Cyprus 2013 2.4 5.6 N/A - 30
Greece 2013 2.0 1.0 Yes 65.0 24
Ireland 2014 2.0 13.0 N/A - 27
Italy 2013 10.2 20.5 Estimated 66.4 14
Luxembourg 2013 2.0 19.8 N/A - 80
Malta 2013 1.4 0.6 No - >7
Netherlands 2013 0.9 39.2 N/A - 36
Norway 2013 5.8 1.0 No - >13
Portugal 2014 3.2 32.8 N/A - 27
Type 2: Data collection by public advisory services
Croatia 2014 4.0 14.5 N/A - 29
Czech
Republic
2014 11.0 N/A No - >14
Finland 2013 7.0 N/A No - >10
Latvia 2013 5.0 N/A Yes 3.0 15
Lithuania 2014 4.6 1.0 Estimated 32.9 71
Poland 2013 5.5 9.0 Estimated 360.8 59
Slovakia 2014 4.0 2.0 Estimated 3.6 32
UK 2013 4.0 N/A Estimated 79.8 55
Type 3: Data collection by private accounting firms
Austria 2013 4.0 N/A Yes 22.0 21
Denmark 2014 6.0 N/A No - >4
Estonia 2014 6.0 N/A Yes 6.7 36
France 2013 14.2 2.0 Estimated 35.3 10
Germany 2013 1.3 N/A Estimated 38.0 7
Hungary 2013 5.0 N/A No - >5
Romania 2013 5.0 N/A No - >2
Slovenia 2013 2.1 N/A Yes 12.8 32
Spain 2013 5.0 N/A Estimated 35 8
Sweden 2013 0.7 0.2 Estimated 4.1 7
Switzerland 2013 3.6 N/A No - >5 Source: Online survey, literature review and case study material. Notes:
N/A means not applicable.
FTEs converted to hours per FADN Farm Return using actual average annual working time for all salaried workers in 2013 (Eurostat) for all EU Member States with the exception of Slovenia where an

Study on cost of and good practices for FADN data collection
56
FTE was defined in the survey response; Eurofound (2015) for Norway and Swiss Federal Statistics Office for Switzerland.
France: For consistency, data collection includes a large allowance for validation which Liaison Agencies in other Member States allocated to data collection.
Germany: Data collectors include accounting firms and regional institutions. Slovakia: estimated based on ratio between Farm Returns collected by the Liaison Agency and those
by the external data collector and the FTEs required in the Liaison Agency. Spain: FTEs calculated using 250 cases per data collector (mid-point of 200-300 range). UK: Data collectors include university researchers and Department of Agriculture and Rural
Development in Northern Ireland. Where this figure is an underestimation because the time spent on data collection by other
organisations is not known to the Liaison Agency, the cell is unshaded.
The proportion of total time resource required for data collection (where full information
is available) is presented in Figure 6.1. The EU average (for those Member States for
which there is full information) shows that 92% of total labour requirement is for data
collection. Member States where labour requirements for data collection form a
substantial proportion of the total include those with very large samples such as
Germany and Poland. In contrast, Member States with smaller samples, such as Cyprus
(500 holdings), Slovakia (562 holdings) and Estonia (658 holdings) show a lower
proportion of data collection costs in total costs, probably reflecting the greater relative
importance of fixed costs. There are also examples where the data collection method is
very labour intensive, for example, the UK. As the Figure shows, there is no discernible
pattern by data collection type.
Figure 6.1: Importance of data collection time requirement in total time requirement
Source: Online survey.
0%
10%
20%
30%
40%
50%
60%
70%
80%
90%
100%
NL EL PT LU IT IE BG CY PL UK LT HR SK LV DE ES SE SI AT FR EE
Type 1: Liaison Agency Type 2: Advisory service Type 3: Accounting firm
EU average
Study on cost of and good practices for FADN data collection
57
6.2.2. Time requirements along the FADN supply chain
Our case study countries allowed a more detailed investigation of the resource costs of
producing data for EU-FADN. They provided a somewhat more extended view of the data
supply chain than could be formed on the basis of replies to the online survey given
above, to cover for example staff in ministries who oversaw the organisation of the
complete national accounts system. Figures for this more detailed approach and its
analysis are therefore generally marginally larger than those in the previous section
though the two are, of course, fully compatible. For completeness an estimate of the
time spent by the farmer in supplying data is also included, but this is easily excluded for
analyses when only the stages involving public resource use are considered.
A Standard Cost Model approach was used (see section 0). This apportioned total time
requirements by both the stage in the supply chain (see section 6.1.1) and by the
actors/organisations involved. Some Member States had high quality data on overall
time requirements from time sheet recording systems and were able to allocate this
overall resource by task with a high degree of confidence. In others it was necessary to
build up an overall estimation of resource requirements from the bottom up through a
series of discussions with the Liaison Agency and other involved actors. In all cases this
was a complex and iterative process, necessarily involving varying degrees of estimation
and approximation.
Data were provided in a variety of formats, from total number of hours and/or FTEs to an
estimation of time per completed Farm Return. The format depended on the stage in the
chain. All data have been converted to time requirement per completed Farm Return to
allow comparison between Member States with different FADN sample sizes.
Where the national farm accounts survey has a larger sample size than is required by
EU-FADN (Germany, Lithuania and the UK), values have been calculated in the first
instance per national Farm Return. This provides more accurate information on variable
costs and allows the total time commitment for just the EU-FADN sample to be calculated
with greater precision. Activities in the data supply chain which are considered to form
fixed costs (comprising A: overall management; B: Design of the selection plan; E1: Data
collection - administration, management, etc.; E2: Data collection - training; and, G:
Data storage (IT operation and management)) have been recalculated when considering
the time requirement strictly to fulfil the requirements for EU-FADN, with all these costs
allocated to the EU-FADN sample. This is because (a) providing data to FADN is an EU
requirement; and, (b) interviewees did not feel that any savings would be made to fixed
costs if the sample size did not exceed EU-FADN requirements. Variable costs have been
summed for only the EU-FADN sample (these comprise C: Recruiting participating
farmers; D: Maintaining farms in the network (farmer feedback); E3: Data collection -
data collection; E4: Data collection - data entry and collation; F: Data quality control;
and, H: Data processing and transfer to RICA-1).
It is accepted that the data supply chain ends with the DG AGRI FADN unit and that the
time required to raise RICA-1 queries will differ by Member State. However, DG AGRI is
not able to report on the precise time required for this activity in respect of each
individual Member State. The amount of time is influenced by the size of the sample,
quality of the data delivered and language used by a Member State to reply. Under
normal circumstances the data check takes the EU FADN unit one month for Member
States with large samples (amongst our cases study countries France, Germany, Italy
and Poland) and for Member States with methodological issues (such as Bulgaria), and
less than one month for Member States with smaller sample sizes (Lithuania,
Netherlands, Sweden and the UK). A second round of clarifications is sometimes
necessary for Member States with large sample sizes. DG AGRI time has not been added
to our estimations.

Study on cost of and good practices for FADN data collection
58
The figures for Germany have been extrapolated from those obtained in Bavaria and
Sachsen-Anhalt. Bavarian figures were weighted by the EU-FADN sample in former West
German states and Sachsen-Anhalt figures were weighted by the EU-FADN sample in
former East German states. The figures for the UK have been weighted by the EU-FADN
sample in the four constituent UK countries.
Table 6.2 presents a summary of the aggregate time resources by stage in the FADN
supply chain to allow a comparison between case study Member States. Cells with 0.00
indicate a very small value; blank cells indicate that there is no time allocation at all.
There is some simplification of the stages in the supply chain as set out above in section
6.1.1. E1: Data collection - Administration, management, etc. is included in A: Overall
management where data collection is carried out by the Liaison Agency. E4: Data
collection – data entry and collation was often considered inseparable from the data
collection activity itself.
The key point to note is that data collection accounts for the vast majority of total time
requirement. In those countries where data are extracted from existing accounts by
accountants (Type 3: C-AF: Germany, Sweden and France) the data collection process
is short, at between eight and nine hours including farmer time and five and six hours
net of this. France has a relatively substantial data validation requirement at five hours,
most of which is required to validate the information in the accounts and which could also
be considered part of the data collection process. The German Winplausi system
provides validation on data entry (and hence is effectively incorporated within the data
collection process) so the only separable validation activity here is dealing with RICA-1
queries.
Data collection accounts for a similar proportion of total time in Poland and the UK
(89% and 82% respectively) and for 76% of total time required in Lithuania. Given that
data collection in these Type 2: C-AS Member States is relatively time intensive, this
might be expected. Although the Netherlands also has a relatively high requirement for
time to gather data (37 hours per Farm Return), the Liaison Agency explained that this
results from the additional information that is collected and which cannot be separated.
Data collection times in Bulgaria and Italy, where data are collected under the auspices
of the Liaison Agencies (Type 1: C-LA), are comparable at 19 and 17 hours (66% and
63%) respectively.
There are some interesting differences in the time required for recruitment per completed
Farm Return. At one end of the scale, this is negligible in Germany and Poland, where
recruitment is made from existing clients of accounting firms/advisory services (Type 3:
C-AF/Type 2: C-AS)35. In Germany this is because accountants are well aware of the
typology of their clients’ farms and have very good relations with their clients which
means that (a) ensuring a farm meets the selection criteria is very straightforward; and,
(b) when approached farmers are easily persuaded to participate. Another key factor
here is a relatively low sample turnover which reduces the need to find replacements.
The situation in Poland may well be similar in terms of the knowledge of farm
typologies, but here it was also impossible to separate recruitment activities from other
contact with farms in the context of providing advice.
In other case study countries, recruitment accounts for 9% of the total time requirement
per Farm Return in Bulgaria and 10% in Italy (both Type 1: C-LA), 3% in Lithuania
and Sweden and only 1% in the Netherlands and the UK.
35 In Sweden holdings are selected without this constraint which may be a factor in higher recruitment costs as
not all have their accounts produced by the main data collecting organisation.

Study on cost of and good practices for FADN data collection
59
While the proportion of time used for management in the data supply chain is generally
low overall, it is more substantial in Sweden (20%) and Germany (12%) and France
(5%, including regional management of data collection). These three Member States all
collect data through accounting firms (Type 3: C-AF) and the relatively high management
requirement is a function of the low overall time requirement for data collection (a
variable cost) and, as a consequence, the relatively high central fixed cost. In the case
of Germany the regional structure also adds a layer of central (non-variable)
management. In absolute terms the time required for overall management in Poland is
comparable to that in Sweden, but this is spread over a much larger sample and is
further diluted by the intensive data collection process. Overall management in the UK is
also relatively high in absolute terms. As in Germany the devolved structure adds an
additional “overhead”.
Time spent per Farm Return on maintaining farmers in the network (producing and
providing feedback to farmers and processing payments, etc.) varies from a high of 4%
of total time requirements in Bulgaria, Lithuania and the UK to a low of virtually
nothing in Poland.36 In Lithuania this activity requires just less than two FTEs in the
Liaison Agency, but this level of input is fairly marginal in per Farm Return terms and is
not especially significant compared to data collection requirements. There is no clear
relationship with data collection typology.
It is sometimes difficult to separate out data validation, at least pre-submission, from
data collection because the two activities are often heavily linked (post-submission
validation is easier to separately identify). As mentioned above, in Germany data are
checked on entry; this is also the case in the UK (albeit relatively recently in the case of
Northern Ireland). There is a low time requirement to check data in the Netherlands
because they are extracted from existing registers. Data validation in the other case
study countries is both more separable as an activity and more significant in terms of
time requirement. In France data validation accounts for a third of the total time
requirement, although, as mentioned above, given that the pre-submission validation
checks comprise verifying account data it would be possible to think of data validation
and data collection as facets of the same activity. Data validation accounts for 26% of
total time requirement in Italy. Here checks are carried out by the data collector and
also centrally within the Liaison Agency; this duplication of activity is a partial
explanation for the relatively high time requirement. Again, there is no clear relationship
with data collection typology.
In Bulgaria the total time requirement for data validation is 9% of the total time
requirement and here there is a slightly higher requirement in relation to Farm Returns
derived from double entry bookkeeping systems because it is necessary to check the
accounts; this is not necessary where the data collector has compiled the account. Again
this shows that the two activities are inter-related and hard to divide.
Data storage (IT operation and management) was generally considered to constitute a
fairly insignificant time requirement, especially in per Farm Return terms. However, this
might be a less visible cost in most situations, with separate identification only possible
when a database manager or similar (or fraction thereof) is employed within the Liaison
Agency (for example Lithuania, Netherlands, Poland, UK (England and Scotland)),
where there is a clear requirement for a certain number of days of IT input (for example,
UK (Northern Ireland)) or where there is a task which is clearly related to this
category (for example, data archiving in Germany). Again, this is a difficult category to
36 There is a time cost for the Liaison Agency in making payments to farmers of 0.17 FTE, but the extension
service cannot separate out other aspects of this activity from the general provision of advice. The large Polish
sample means that the time input is insignificant in per Farm Return terms.

Study on cost of and good practices for FADN data collection
60
separately identify, as IT operation is necessary throughout the FADN supply chain and
usually integrated with other activities.
Data processing and transfer to RICA-1 (not including time required to respond to
queries, which is addressed under validation) is also usually a marginal activity in terms
of time requirement. In many cases Liaison Agencies likened this activity to “pushing a
button”. This activity amounted to less than 2% of total time requirement in all case
study countries except Sweden where it accounted for 4% of total time requirement,
mainly because of the overall low time requirement by the data supply chain and the fact
that the Board of Agriculture requires just over a third of an FTE to calculate the EU-
FADN variables from the Swedish national variables.

Study on cost of and good practices for FADN data collection
61
Table 6.2: Time requirements to supply FADN (hours and percentage of total hours per holding)
Type 1: Data collection by Liaison Agency Type 2: Data collection by public advisory service Type 3: Data collection by private accounting
firms
BG IT NL LT PL UK DE FR SE
A: Overall
management
2.88 10.2% 0.02 0.1% 0.69 1.7% 1.39 2.2% 3.35 3.6% 3.42 6.1% 1.20 12.1% 0.64 4.5% 3.10 20.3%
A1: National FADN
Committee
0.05 0.2% 0.02 0.1% 0.12 0.3% 0.14 0.2% 0.00 0.0% 0.02 0.0% 0.04 0.4% 0.01 0.1% 0.02 0.1%
A2: Regional FADN
Committee
- - 0.09 0.9%
A3: Stuttgart
Programme
- - 0.02 0.2%
B: Design of
selection plan
0.10 0.4% 0.01 0.0% 0.79 1.9% 1.56 2.5% 0.03 0.0% 0.01 0.0% 0.01 0.1% 0.01 0.1% 0.04 0.3%
C: Recruiting
participating farmers
2.50 8.8% 2.75 10.0% 0.45 1.1% 2.00 3.2% 0.00 0.0% 0.52 0.9% 0.03 0.3% 0.16 1.1% 0.39 2.5%
D: Maintaining farms in the
network
(farmer
feedback)
1.00 3.5% 0.25 0.9% 0.07 0.2% 2.68 4.3% 0.03 0.0% 2.18 3.9% 0.07 0.8% 0.00 0.0% 0.14 0.9%
E: Data collection 18.75 66.2% 17.25 62.7% 37.17 89.6% 48.11 76.3% 81.76 88.7% 46.14 81.9% 8.22 83.3% 8.51 60.0% 8.95 58.5%
E1: Admin,
management,
etc.
- - 0.00 0.0% 0.00 0.0% 0.47 0.7% 5.94 6.4% 4.38 7.8% 0.00 0.0% 0.20 1.4% 0.12 0.8%
E2: Training 3.00 10.6% 1.50 5.4% 0.00 0.0% 1.64 2.6% 2.56 2.8% 2.89 5.1% 0.09 0.9% 0.31 2.2% 0.47 3.1%
E3: Data collection 13.25 46.8% 15.75 57.2% 37.17 89.6% 42.00 66.7% 53.42 57.9% 37.25 66.1% 8.13 82.5% 8.00 56.5% 7.60 49.6%
E4: Data entry and
collation
2.50 8.8% 0.00 0.0% 0.00 0.0% 4.00 6.3% 19.85 21.5% 1.62 2.9% 0.00 0.0% 0.00 0.0% 0.77 5.0%
F: Data quality
control
2.50 8.8% 7.26 26.4% 0.57 1.4% 5.32 8.4% 4.88 5.3% 0.86 1.5% 0.18 1.9% 4.80 33.9% 1.76 11.5%
F1: Pre-
submission validation
1.25 4.4% 7.25 26.3% 0.55 1.3% 4.16 6.6% 3.99 4.3% 0.63 1.1% 0.16 1.7% 4.60 32.5% 0.75 4.9%
F2: Post-
submission
validation
(RICA-1
queries)
1.25 4.4% 0.01 0.0% 0.02 0.0% 1.16 1.8% 0.89 1.0% 0.22 0.4% 0.02 0.2% 0.20 1.4% 1.07 7.0%
G: Data storage
(IT operation
and
management)
0.10 0.4% 0.00 0.0% 1.47 3.6% 1.09 1.7% 1.92 2.1% 2.22 3.9% 0.09 0.9% 0.00 0.0% 0.27 1.8%
H: Data
processing and
transfer to
RICA-1
0.50 1.8% 0.00 0.0% 0.26 0.6% 0.86 1.4% 0.23 0.3% 1.00 1.8% 0.06 0.6% 0.04 0.3% 0.66 4.3%
Total hours per
holding
28.33 27.53 41.48 63.01 92.20 56.35 9.86 14.16 14.16

Study on cost of and good practices for FADN data collection
62
Type 1: Data collection by Liaison Agency Type 2: Data collection by public advisory service Type 3: Data collection by private accounting
firms
BG IT NL LT PL UK DE FR SE
Total FTEs (national sample)
32.27 187.40 45.85 46.30 587.01 113.60 71.38 70.45 70.45
Total FTEs excluding
farmer (national
sample)
29.99 146.56 43.91 44.88 433.36 100.38 49.55 55.53 55.53
TOTAL FTEs (FADN
sample)
32.27 187.40 45.85 35.51 587.01 92.38 57.00 70.45 70.45
Total FTEs excluding
farmer (FADN
sample)
29.99 146.56 43.91 34.42 433.36 82.36 40.29 55.53 55.53
Total hours per
holding excluding
farmer (FADN
sample)
26.33 21.53 39.73 63.16 67.69 53.93 7.23 11.16 11.16
Source: Case study investigations.

Study on cost of and good practices for FADN data collection
63
Figure 6.2 provides a comparison between the total time required per completed Farm
Return for the EU-FADN sample in our case study Member States37. These Member
States fall clearly into our three typological groups. Germany, France and Sweden
have the lowest time requirements, 10.23, 14.16 and 15.31 hours respectively including
farmers’ time and 7.23, 11.16 and 12.81 hours excluding this. These data collection
systems employ accountants who extract the required data from completed accounts
(Type 3: C-AF).
The time requirements in Bulgaria and Italy, where data collection is managed by the
Liaison Agency (Type 1: C-LA) are also similar to one another. The Liaison Agency also
undertakes data collection in the Netherlands using largely secondary sources and so it
is perhaps surprising that the time requirement here is so relatively high. However,
considerably more information is collected in the Netherlands than is required by FADN
and this is likely to at least partially explain the high time requirement.
Data collection in Lithuania and Poland is via public advisory services (Type 2: C-AS)
and time required, not including farmer input, is similar at 63.16 and 68.20 hours per
Farm return respectively. A key difference though is in the time requirement on the part
of the farmer which is much more substantial in the case of Poland. It is recognised that
it is difficult to apportion farmers’ time when they are both providing data and receiving
advice, and this time might in fact be dual purpose. Another potential reason for the
difference in farmer time is that in Lithuania farmers are required to have accounts for
taxation purposes and so may be more likely to have necessary information available,
whereas in Poland they do not face the same requirement and so may be less organised.
The UK appears comparable in terms of time requirement to Lithuania and Poland (53.93
hours not including farmer time), which is consistent with the rationale behind the
placing of England, Scotland and Wales in the same typology, even though the UK is hard
to categorise. It should be noted though that Northern Ireland accounts for 13% of the
UK aggregate time calculation and, with data collection there being carried out by the
devolved government, this could offer an explanation for the slightly lower time
requirement compared to Lithuania and Poland. However, an investigation of the time
requirement in Northern Ireland reveals that it is actually very similar to that in Scotland
and Wales.
37 The time requirement per national farm return is slightly lower for Germany, Lithuania and the UK because
fixed costs are spread over a larger sample.
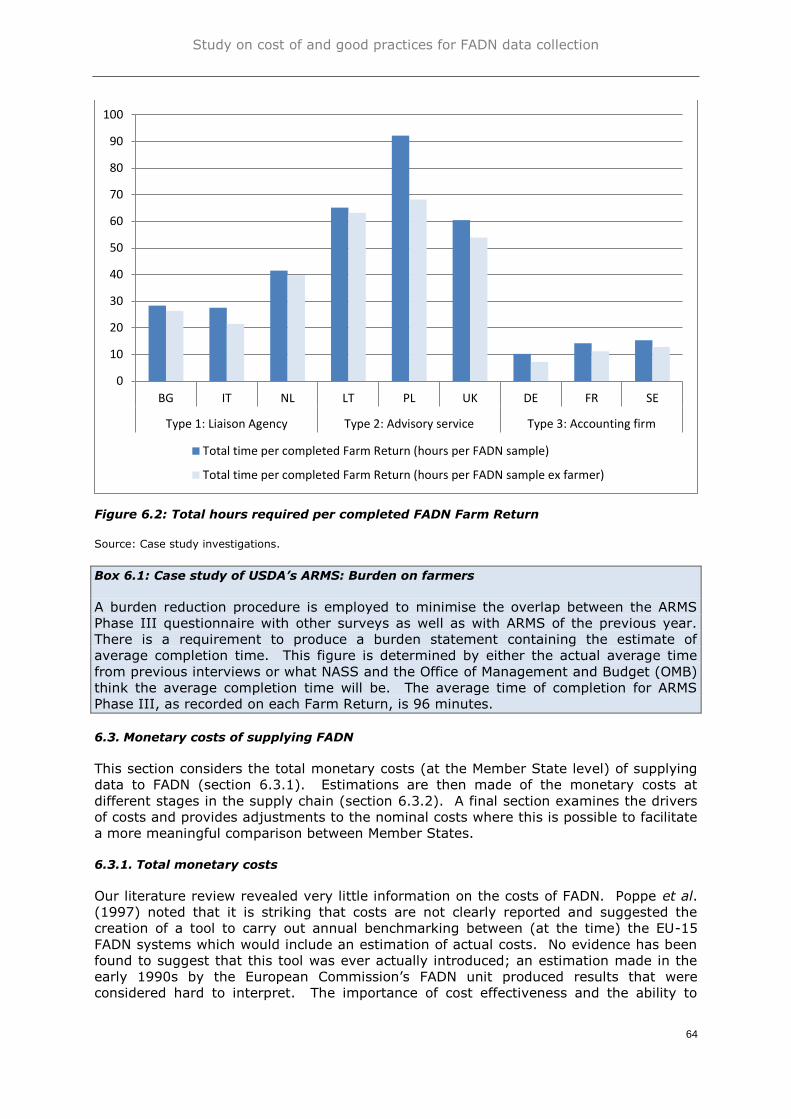
Study on cost of and good practices for FADN data collection
64
Figure 6.2: Total hours required per completed FADN Farm Return
Source: Case study investigations.
Box 6.1: Case study of USDA’s ARMS: Burden on farmers
A burden reduction procedure is employed to minimise the overlap between the ARMS
Phase III questionnaire with other surveys as well as with ARMS of the previous year.
There is a requirement to produce a burden statement containing the estimate of
average completion time. This figure is determined by either the actual average time
from previous interviews or what NASS and the Office of Management and Budget (OMB)
think the average completion time will be. The average time of completion for ARMS
Phase III, as recorded on each Farm Return, is 96 minutes.
6.3. Monetary costs of supplying FADN
This section considers the total monetary costs (at the Member State level) of supplying
data to FADN (section 6.3.1). Estimations are then made of the monetary costs at
different stages in the supply chain (section 6.3.2). A final section examines the drivers
of costs and provides adjustments to the nominal costs where this is possible to facilitate
a more meaningful comparison between Member States.
6.3.1. Total monetary costs
Our literature review revealed very little information on the costs of FADN. Poppe et al.
(1997) noted that it is striking that costs are not clearly reported and suggested the
creation of a tool to carry out annual benchmarking between (at the time) the EU-15
FADN systems which would include an estimation of actual costs. No evidence has been
found to suggest that this tool was ever actually introduced; an estimation made in the
early 1990s by the European Commission’s FADN unit produced results that were
considered hard to interpret. The importance of cost effectiveness and the ability to
0
10
20
30
40
50
60
70
80
90
100
BG IT NL LT PL UK DE FR SE
Type 1: Liaison Agency Type 2: Advisory service Type 3: Accounting firm
Total time per completed Farm Return (hours per FADN sample)
Total time per completed Farm Return (hours per FADN sample ex farmer)

Study on cost of and good practices for FADN data collection
65
demonstrate this was reiterated in the context of the recent financial crisis and the
associated need for governments to find ways of reducing their budgets (Vrolijk, 2012).
The information gathered here should be useful to Member States by allowing a
comparison between countries which relates costs to the data collection methods used.
Some cost elements are discussed very occasionally in the literature. Amongst these is
the comparison of open source and bespoke software solutions (Westerhof, 2013). The
former offers cost savings, but implies some compromises in terms of suitability. For
example, Pesti (2012) notes that the costs of commercial software solutions are in the
region of €40,000 to €60,000 per year compared to free open source solutions. There
are though advantages of commercial software, not least a support function and lower
programming costs (although it is easy to find programmers). Open source software
requires additional time to fix problems, but is low cost, whereas commercial solutions
save time, but cost more. Pesti (2012) also reports on the switch towards the use of
open source software from 2011 in Hungary. However, though software costs are clearly
important, they are very minor compared to labour costs which account for by far the
greatest cost element in data collection across the EU.
Even where national farm accounts survey data collection methodologies look the same,
differences at a more operational level can still be important in terms of costs. For
example, different methods of calculation of the value of assets can impact on them.
Reinsson (2009) noted that the calculation used to value buildings in Sweden prior to
2007 (which included a declining balance approach to depreciation) was time consuming
and complicated and, as a result, costly. Changes made (including a linear approach to
depreciation) should have resulted in greater cost effectiveness without compromising
accuracy. Del'Homme and Aamisep (2009) also draw attention to differences in
accountancy methodology. Again though, these cost elements are relatively minor.
The only known example of an EU-wide study on costs is that undertaken by Agra CEAS
Consulting (2007) which collected information on the costs of EU-FADN (both average
and marginal costs) as part of its feasibility study for Eurostat on re-establishing its
Income of the Agricultural Households Sector statistics on a uniform, microeconomic
basis for all EU-28 Member States. National farm accounts surveys were seen as a
possible source of data as it was known that, in some countries, they went beyond what
was required for FADN and already collected household income data.
According to the information supplied by national government sources at the time of the
study, average costs ranged downwards from €3,000 per completed Farm Return in the
Netherlands, with typical figures in the range €300 to €650 (see Table 6.3, which also
includes these figures inflated to 2012 values, see below for analysis). These differences
reflect, inter alia, the collection mechanism but will also reflect differing national labour
and other costs. Limited cost information was also presented in ECA (2003), but these
figures predate the Agra CEAS Consulting work and formed part of its evidence base.
The wide variation in cost is partly explained by disparities in what was covered and in
particular the degree to which data analysis was included. For example, the Netherlands
probably included much of the Liaison Agency core costs in the figure provided. Perhaps
as a consequence there is little correlation with our typology.
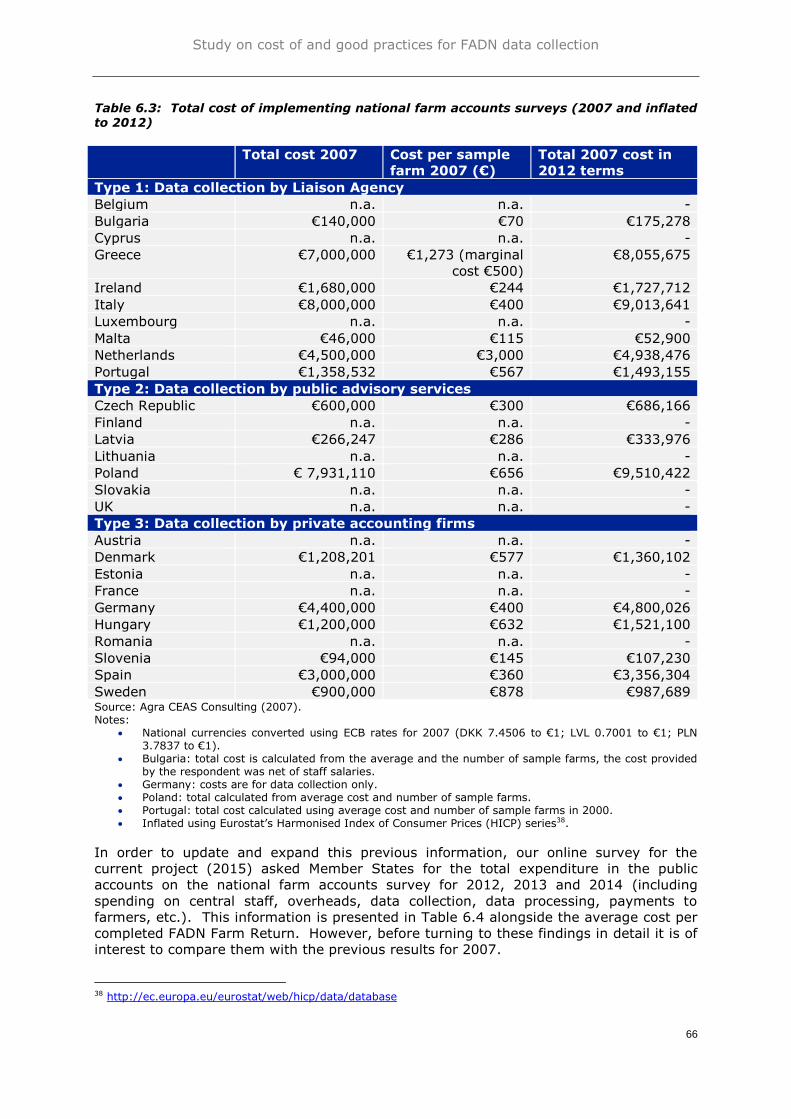
Study on cost of and good practices for FADN data collection
66
Table 6.3: Total cost of implementing national farm accounts surveys (2007 and inflated
to 2012)
Total cost 2007 Cost per sample
farm 2007 (€)
Total 2007 cost in
2012 terms
Type 1: Data collection by Liaison Agency
Belgium n.a. n.a. -
Bulgaria €140,000 €70 €175,278
Cyprus n.a. n.a. -
Greece €7,000,000 €1,273 (marginal
cost €500)
€8,055,675
Ireland €1,680,000 €244 €1,727,712
Italy €8,000,000 €400 €9,013,641
Luxembourg n.a. n.a. -
Malta €46,000 €115 €52,900
Netherlands €4,500,000 €3,000 €4,938,476
Portugal €1,358,532 €567 €1,493,155
Type 2: Data collection by public advisory services
Czech Republic €600,000 €300 €686,166
Finland n.a. n.a. -
Latvia €266,247 €286 €333,976
Lithuania n.a. n.a. -
Poland € 7,931,110 €656 €9,510,422
Slovakia n.a. n.a. -
UK n.a. n.a. -
Type 3: Data collection by private accounting firms
Austria n.a. n.a. -
Denmark €1,208,201 €577 €1,360,102
Estonia n.a. n.a. -
France n.a. n.a. -
Germany €4,400,000 €400 €4,800,026
Hungary €1,200,000 €632 €1,521,100
Romania n.a. n.a. -
Slovenia €94,000 €145 €107,230
Spain €3,000,000 €360 €3,356,304
Sweden €900,000 €878 €987,689 Source: Agra CEAS Consulting (2007). Notes:
National currencies converted using ECB rates for 2007 (DKK 7.4506 to €1; LVL 0.7001 to €1; PLN 3.7837 to €1).
Bulgaria: total cost is calculated from the average and the number of sample farms, the cost provided by the respondent was net of staff salaries.
Germany: costs are for data collection only. Poland: total calculated from average cost and number of sample farms. Portugal: total cost calculated using average cost and number of sample farms in 2000. Inflated using Eurostat’s Harmonised Index of Consumer Prices (HICP) series38.
In order to update and expand this previous information, our online survey for the
current project (2015) asked Member States for the total expenditure in the public
accounts on the national farm accounts survey for 2012, 2013 and 2014 (including
spending on central staff, overheads, data collection, data processing, payments to
farmers, etc.). This information is presented in Table 6.4 alongside the average cost per
completed FADN Farm Return. However, before turning to these findings in detail it is of
interest to compare them with the previous results for 2007.
38 http://ec.europa.eu/eurostat/web/hicp/data/database
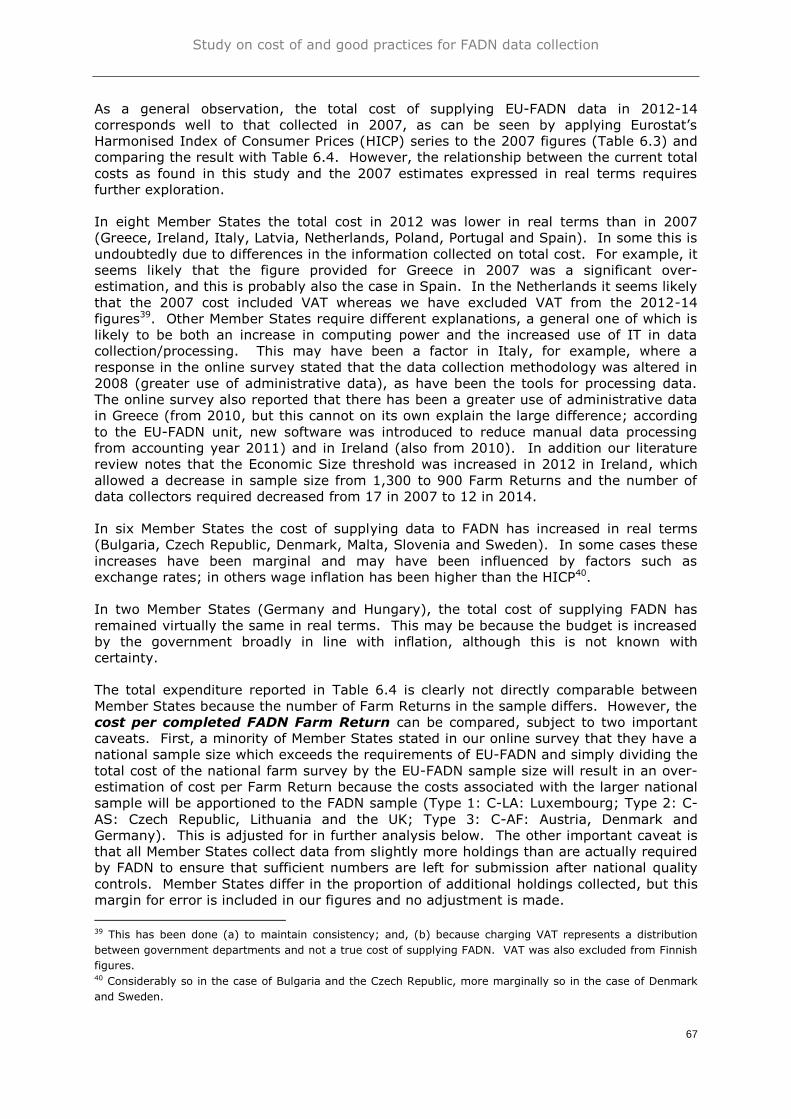
Study on cost of and good practices for FADN data collection
67
As a general observation, the total cost of supplying EU-FADN data in 2012-14
corresponds well to that collected in 2007, as can be seen by applying Eurostat’s
Harmonised Index of Consumer Prices (HICP) series to the 2007 figures (Table 6.3) and
comparing the result with Table 6.4. However, the relationship between the current total
costs as found in this study and the 2007 estimates expressed in real terms requires
further exploration.
In eight Member States the total cost in 2012 was lower in real terms than in 2007
(Greece, Ireland, Italy, Latvia, Netherlands, Poland, Portugal and Spain). In some this is
undoubtedly due to differences in the information collected on total cost. For example, it
seems likely that the figure provided for Greece in 2007 was a significant over-
estimation, and this is probably also the case in Spain. In the Netherlands it seems likely
that the 2007 cost included VAT whereas we have excluded VAT from the 2012-14
figures39. Other Member States require different explanations, a general one of which is
likely to be both an increase in computing power and the increased use of IT in data
collection/processing. This may have been a factor in Italy, for example, where a
response in the online survey stated that the data collection methodology was altered in
2008 (greater use of administrative data), as have been the tools for processing data.
The online survey also reported that there has been a greater use of administrative data
in Greece (from 2010, but this cannot on its own explain the large difference; according
to the EU-FADN unit, new software was introduced to reduce manual data processing
from accounting year 2011) and in Ireland (also from 2010). In addition our literature
review notes that the Economic Size threshold was increased in 2012 in Ireland, which
allowed a decrease in sample size from 1,300 to 900 Farm Returns and the number of
data collectors required decreased from 17 in 2007 to 12 in 2014.
In six Member States the cost of supplying data to FADN has increased in real terms
(Bulgaria, Czech Republic, Denmark, Malta, Slovenia and Sweden). In some cases these
increases have been marginal and may have been influenced by factors such as
exchange rates; in others wage inflation has been higher than the HICP40.
In two Member States (Germany and Hungary), the total cost of supplying FADN has
remained virtually the same in real terms. This may be because the budget is increased
by the government broadly in line with inflation, although this is not known with
certainty.
The total expenditure reported in Table 6.4 is clearly not directly comparable between
Member States because the number of Farm Returns in the sample differs. However, the
cost per completed FADN Farm Return can be compared, subject to two important
caveats. First, a minority of Member States stated in our online survey that they have a
national sample size which exceeds the requirements of EU-FADN and simply dividing the
total cost of the national farm survey by the EU-FADN sample size will result in an over-
estimation of cost per Farm Return because the costs associated with the larger national
sample will be apportioned to the FADN sample (Type 1: C-LA: Luxembourg; Type 2: C-
AS: Czech Republic, Lithuania and the UK; Type 3: C-AF: Austria, Denmark and
Germany). This is adjusted for in further analysis below. The other important caveat is
that all Member States collect data from slightly more holdings than are actually required
by FADN to ensure that sufficient numbers are left for submission after national quality
controls. Member States differ in the proportion of additional holdings collected, but this
margin for error is included in our figures and no adjustment is made.
39 This has been done (a) to maintain consistency; and, (b) because charging VAT represents a distribution
between government departments and not a true cost of supplying FADN. VAT was also excluded from Finnish
figures. 40 Considerably so in the case of Bulgaria and the Czech Republic, more marginally so in the case of Denmark
and Sweden.

Study on cost of and good practices for FADN data collection
68
Table 6.4 shows that the total annual combined cost to the public purse across Member
States of the national farm accounts surveys which supply EU-FADN (not including costs
incurred at the EU level or private costs such as the value of farmers’ time) averaged just
over €58 million for the 2012-14 period. This amounts to a (weighted) average cost at
the EU-28 level of €678 per completed Farm Return. However, average costs in specific
Member States deviated considerably from this EU-28 average, with a range from €107
per completed Farm Return in Bulgaria and €156 in Romania to €2,905 in Belgium. The
cost to the EU budget is currently €160 per completed Farm Return, i.e. just under €14
million, just under a quarter of total public cost, plus the costs incurred centrally by the
FADN unit.
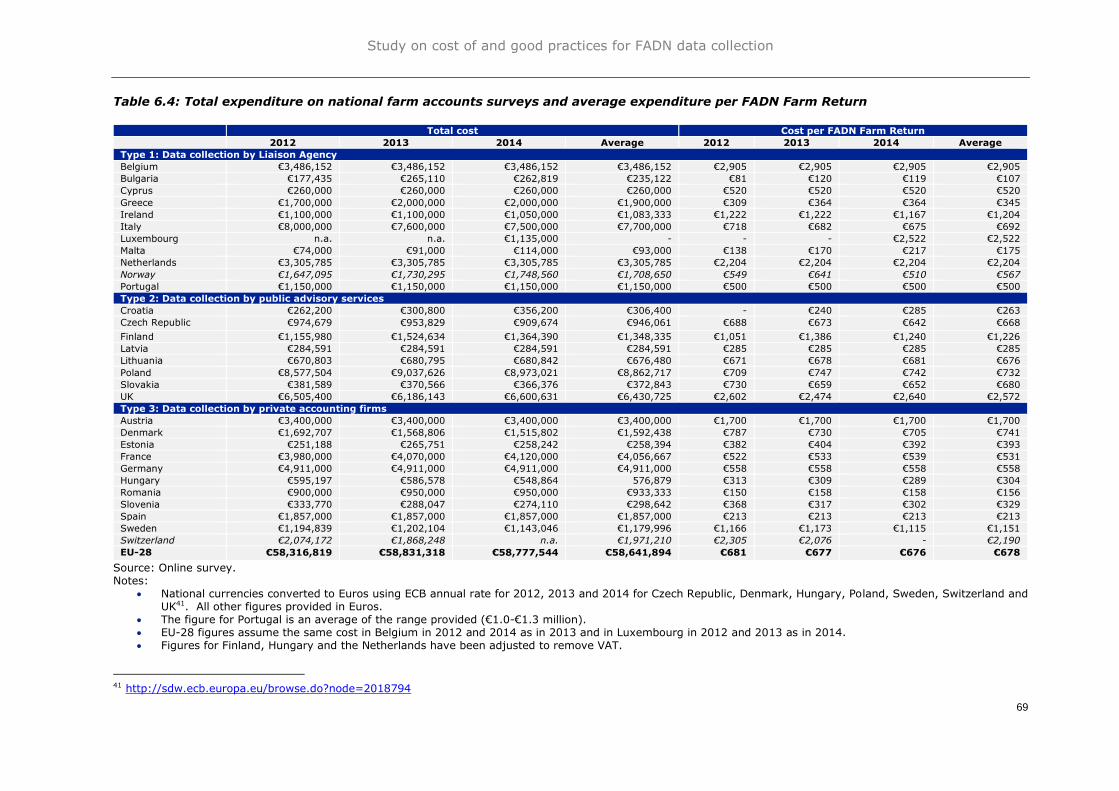
Study on cost of and good practices for FADN data collection
69
Table 6.4: Total expenditure on national farm accounts surveys and average expenditure per FADN Farm Return
Total cost Cost per FADN Farm Return
2012 2013 2014 Average 2012 2013 2014 Average
Type 1: Data collection by Liaison Agency
Belgium €3,486,152 €3,486,152 €3,486,152 €3,486,152 €2,905 €2,905 €2,905 €2,905
Bulgaria €177,435 €265,110 €262,819 €235,122 €81 €120 €119 €107
Cyprus €260,000 €260,000 €260,000 €260,000 €520 €520 €520 €520
Greece €1,700,000 €2,000,000 €2,000,000 €1,900,000 €309 €364 €364 €345
Ireland €1,100,000 €1,100,000 €1,050,000 €1,083,333 €1,222 €1,222 €1,167 €1,204
Italy €8,000,000 €7,600,000 €7,500,000 €7,700,000 €718 €682 €675 €692
Luxembourg n.a. n.a. €1,135,000 - - - €2,522 €2,522
Malta €74,000 €91,000 €114,000 €93,000 €138 €170 €217 €175
Netherlands €3,305,785 €3,305,785 €3,305,785 €3,305,785 €2,204 €2,204 €2,204 €2,204
Norway €1,647,095 €1,730,295 €1,748,560 €1,708,650 €549 €641 €510 €567
Portugal €1,150,000 €1,150,000 €1,150,000 €1,150,000 €500 €500 €500 €500
Type 2: Data collection by public advisory services
Croatia €262,200 €300,800 €356,200 €306,400 - €240 €285 €263
Czech Republic €974,679 €953,829 €909,674 €946,061 €688 €673 €642 €668
Finland €1,155,980 €1,524,634 €1,364,390 €1,348,335 €1,051 €1,386 €1,240 €1,226
Latvia €284,591 €284,591 €284,591 €284,591 €285 €285 €285 €285
Lithuania €670,803 €680,795 €680,842 €676,480 €671 €678 €681 €676
Poland €8,577,504 €9,037,626 €8,973,021 €8,862,717 €709 €747 €742 €732
Slovakia €381,589 €370,566 €366,376 €372,843 €730 €659 €652 €680
UK €6,505,400 €6,186,143 €6,600,631 €6,430,725 €2,602 €2,474 €2,640 €2,572
Type 3: Data collection by private accounting firms
Austria €3,400,000 €3,400,000 €3,400,000 €3,400,000 €1,700 €1,700 €1,700 €1,700
Denmark €1,692,707 €1,568,806 €1,515,802 €1,592,438 €787 €730 €705 €741
Estonia €251,188 €265,751 €258,242 €258,394 €382 €404 €392 €393
France €3,980,000 €4,070,000 €4,120,000 €4,056,667 €522 €533 €539 €531
Germany €4,911,000 €4,911,000 €4,911,000 €4,911,000 €558 €558 €558 €558
Hungary €595,197 €586,578 €548,864 576,879 €313 €309 €289 €304
Romania €900,000 €950,000 €950,000 €933,333 €150 €158 €158 €156
Slovenia €333,770 €288,047 €274,110 €298,642 €368 €317 €302 €329
Spain €1,857,000 €1,857,000 €1,857,000 €1,857,000 €213 €213 €213 €213
Sweden €1,194,839 €1,202,104 €1,143,046 €1,179,996 €1,166 €1,173 €1,115 €1,151
Switzerland €2,074,172 €1,868,248 n.a. €1,971,210 €2,305 €2,076 - €2,190
EU-28 €58,316,819 €58,831,318 €58,777,544 €58,641,894 €681 €677 €676 €678
Source: Online survey. Notes:
National currencies converted to Euros using ECB annual rate for 2012, 2013 and 2014 for Czech Republic, Denmark, Hungary, Poland, Sweden, Switzerland and UK41. All other figures provided in Euros.
The figure for Portugal is an average of the range provided (€1.0-€1.3 million). EU-28 figures assume the same cost in Belgium in 2012 and 2014 as in 2013 and in Luxembourg in 2012 and 2013 as in 2014. Figures for Finland, Hungary and the Netherlands have been adjusted to remove VAT.
41 http://sdw.ecb.europa.eu/browse.do?node=2018794

Study on cost of and good practices for FADN data collection
70
Average total costs are also presented in Figure 6.3 where they are ranked within
typology by value in descending order. As a general rule, average costs are lowest
where data are collected by accounting firms (Type 3: C-AF) and highest where data
collection is by public advisory service (Type 2: C-AS), although there are exceptions in
both cases. It is also noticeable that, as a generality, EU-15 Member States have higher
average costs than the other Member States, although again there are exceptions linked
to the typology (Type 3: C-AF: France, Germany, Spain) and to a generally low-cost
environment (Greece and Portugal). Poland, Slovakia, Lithuania and the Czech Republic
(Type 2: C-AS) are the only non-EU-15 Member States with average costs higher or
approximately equal to the EU average.
Figure 6.3: Average total cost per completed Farm Return (2012-14 average)
Source: Online survey.
Figure 6.4 shows the average cost per completed Farm Return plotted against FADN
sample size. Member States where data collection is carried out by Liaison Agencies
(Type 1: C-LA) are shown in blue triangles, those where data are collected by public
advisory services (Type 2: C-AS) in green squares and those where data are collected by
private accounting firms (Type 3: C-AF) in red diamonds. This Figure again shows that
the Member States with higher unit costs tend to be those which are generally higher
labour-cost countries and which fall predominantly into Type 1: C-LA, but the addition of
the FADN sample size suggests that there may be some scale economies (as would be
expected) with Member States with the largest EU-FADN samples tending to have lower
unit costs as fixed costs are spread over more holdings (although data collection method
also offers an explanation – many of these are Type 3: C-AF). Only Italy and Poland
(Type 1: C-LA and Type 2: C-AS respectively) have average unit costs higher than the
EU-28 weighted average and a FADN sample size over 3,000 (although obviously
Member States with large sample sizes have greater influence over the EU-28 weighted
average).
€0
€500
€1,000
€1,500
€2,000
€2,500
€3,000
€3,500
BE
LU
NL IE IT
NO
CY
PT EL
MT
BG
UK FI
PL
SK LT
CZ LV
HR
CH
AT SE DK
DE
FR EE SI
HU ES
RO
Type 1: Liaison Agency Type 2: Advisory service Type 3: Accounting firm
Ave
rage
cost
of co
mple
ted F
arm
Retu
rn
Member State/country average EU-28 Typology weighted averages

Study on cost of and good practices for FADN data collection
71
Figure 6.4: Average total cost per completed Farm Return vs FADN sample (2012-14 average)
Source: Online survey.
0
2,000
4,000
6,000
8,000
10,000
12,000
14,000
€0 €500 €1,000 €1,500 €2,000 €2,500 €3,000
FA
DN
sam
ple
siz
e
Crude cost per holding
PL
IT
DE
FR
RO
EL
NL
UK
LU NO
AT
FI SE
IE
HR
BG
CH
CZ
SK
HU
LT
EE LV SI
DK
EU unweighted average (€877)
EU weighted average (€678)
MT
ES
PT
CY
BE

Study on cost of and good practices for FADN data collection
72
Box 6.2: Case Study of USDA’s ARMS: Costs of the data collection
The USDA’s Economic Research Service (USDA-ERS) pays the National Agricultural
Statistics Service (USDA-NASS) $7 million annually for the survey. ERS also devotes
three staff full-time to the survey, and parts of the time of several other staff. The in-
house ERS commitment to survey and database development (which cannot be
separated identified) amounts to approximately $750,000. NASS also contributes some
resources beyond the ERS commitment to support NASS products from the survey. This
budget it unknown. Based on the coverage of 30,000 farms and the cost information
above, the unit cost of ARMS amounts to $258 (€19442), although this does not include
the staff costs within the ERS or the cost to NASS of supporting products and is therefore
a (slight) underestimation.
6.3.2. Allocation of monetary costs to activity
Respondents to the online survey were asked to allocate the total cost to the Liaison
Agency of the national farm accounts survey into the following activities:
a) data organisation and processing (including validation and IT maintenance);
b) data collection (when carried out by the Liaison Agency);
c) payments to farmers (if applicable); and,
d) data collection carried out by other organisations.
The results are shown in Table 6.5 and Figure 6.5. As would be expected a priori, and as
noted in the consideration of time requirements in section 6.2, data collection accounts for
the majority of total cost in most cases. Where this is not the case, partial explanation at
least is likely to be offered by the method of collection or the relative cost of labour. For
example, in Denmark and Sweden the relatively low proportion of data collection costs
reflects the extraction of data from accounts and in Finland and Malta from secondary data
sources. In the cases of Latvia and Estonia, however, the explanation for the relatively
low importance of data collection cost in total cost is likely to reflect lower wages amongst
data collectors compared to those paid to staff in the Liaison Agencies.
There is also a relationship between the size of the sample and the relative importance of
data collection costs because fixed costs will be spread over a larger number of Farm
Returns as the sample size increases, meaning that the average cost per Farm Return will
be lower. For example, France, Germany and Spain all have a high proportion of data
collection cost, even though FADN Farm Returns in these Member States are based
(largely) on completed accounts (Type 3: C-AF).
The importance of the cost of payments to farmers is a function of both sample size and
the payment rate as the overall amount will be determined by the product of the two.
Hence, although there is a large sample in Germany, participating farmers are only paid
€55 each, tending to reduce the relative importance of the cost of these payments within
the overall total. In contrast, in Slovakia, payments to farmers average €290 each. In
Lithuania the EU contribution per completed Farm Return is only paid to legal entities in
the sample (50 at €160 in 2014 = €8,000). The EU weighted average payment to farmers
is €83 (€85 without the Lithuanian payments).
42 Converted using the ECB annual rate for 2014 ($1.3285: €1).

Study on cost of and good practices for FADN data collection
73
Table 6.5: Allocation of total cost to different activities
Total cost
(2013
unless
noted)
Data
organisation
and
processing
(including
validation and
IT
maintenance)
Data collection
(by Liaison
Agency or
other
organisations)
Payments
to farmers
(if
applicable)
Cost to
other
organisations
Type 1: Data collection by Liaison Agency
Belgium €3,486,152 €972,352 €2,513,800 - -
Bulgaria €265,110 €19,371 €245,739 - -
Cyprus €260,000 €60,000 €140,000 €60,000 -
Greece €2,000,000 €50,000 €1,280,940 €669,060 -
Ireland €1,100,000 €150,000 €950,000 - -
Italy €7,600,000 €3,700,000 €3,700,000 - €200,000
Luxembourg €1,135,000 n.a. n.a. - -
Malta €91,000 €6,000 €24,000 €31,088 €29,912
Netherlands €3,305,785 n.a. n.a. - -
Portugal €1,150,000 €125,000 €1,025,000 - -
Type 2: Data collection by public advisory services
Croatia €356,200 €132,200 €224,000 - -
Czech
Republic
€909,674 €292,300 €617,374 - -
Finland €1,524,634 €990,492 €534,142 - -
Latvia €284,591 €135,292 €76,139 €73,160 -
Lithuania €680,842 €140,680 €532,162 €8,000 -
Poland €9,037,626 €1,251,517 €6,842,670 €694,721 €248,718
Slovakia €370,566 €67,000 €140,476 €163,090 -
UK €6,186,143 n.a. n.a. - -
Type 3: Data collection by private accounting firms
Austria €3,400,000 €700,000 €2,100,000 €240,000 €360,000
Denmark €1,568,806 €777,699 €791,107 - -
Estonia €258,152 €115,024 €77,628 €65,500 -
France €4,000,000 €70,000 €3,930,000 - -
Germany €4,911,000 €391,130 €3,887,370 €632,500 -
Hungary €586,578 €74,521 €512,057 - -
Romania €950,000 €350,000 €600,000 - -
Slovenia €288,047 €68,252 €156,620 €63,175 -
Spain €1,857,000 €157,000 €1,700,000 - -
Sweden €1,202,104 €361,903 €677,339 €162,862 Source: Online survey. Notes:
Figures for CZ, EE, HR and LT are for 2014. Accountaning firms in the Czech Republic make payments to farmers, but the value of these is not
known. Costs to other organisations have been inferred as the difference between the total cost and the
Liaison Agencies expenditure on the specified activities. No breakdown could be provided for Luxembourg, the Netherlands or the UK. In the case of the
UK this is for reasons of commercial confidentiality.
Study on cost of and good practices for FADN data collection
74
Figure 6.5: Importance of data collection cost and payments to farmers in total cost
Source: Online survey. Note: Luxembourg, Netherlands and UK are excluded due to a lack of data availability.
6.3.3. Reconciliation between money costs and labour time utilisation
This ‘monetised’ approach to costs in the various stages of the FADN data supply chain,
as well as being informative in its own right, also provides a useful cross-check on the
allocation of time resource to different activities (see section 6.2.2 above). Where the
cost of labour is broadly the same, and where there are no payments to farmers, the
proportion of cost required for data collection should be approximately the same as the
proportion of total labour time required. This is indeed the situation. For example, the
proportion of cost required for data collection in Ireland is 86% and the proportion of
time 87%. In Portugal the respective proportions are 89% and 91%. After an
adjustment to remove payments to farmers, the proportion of monetary and time cost
required for data collection is the same in Cyprus (70%) and very similar in Latvia (36%
c.f. 38%).
There is, however, a greater disparity between the proportions in some Member States.
For example, in Germany, while 91% of total cost after adjustment for farmer payments
is required for data collection, the equivalent proportion of time required is 97%. This is
likely to reflect the fact that bookkeepers do not consider the payment they receive to
sufficiently cover costs, in other words, the monetary cost does not quite meet the time
requirement.
Under the simplifying assumption that labour requirements are closely related to financial
resource requirements, it is possible to provide a more detailed disaggregated estimate
of the monetary cost of the different stages in the FADN data supply chain for the case
study countries. This has been done by using the allocation of time as a key with which
0%
10%
20%
30%
40%
50%
60%
70%
80%
90%
100%
EL BG PT IE CY BE MT IT PL SK LT CZ HR LV FI FR DE ES HU SI AT RO EE DK SE
Type 1: Liaison Agency Type 2: Advisory service Type 3: Accounting firm
Proportion of payments to farmers in total cost
Proportion of data collection cost in total cost
EU-25 proportion of data collection cost in total cost
EU-25 proportion of payments to farmers in total cost

Study on cost of and good practices for FADN data collection
75
to distribute the known total cost (net of payments made to participating farmers which
are shown separately). The results are shown in Table 6.6 and Table 6.7. These are
provided for completeness, though the basic information behind them (the proportional
allocation) is no more than what has been described above (money costs and time
utilisations).

Study on cost of and good practices for FADN data collection
76
Table 6.6: Estimation of costs for specific activities along the FADN supply chain
Type 1: Data collection by Liaison
Agencies
Type 2: Data collection by public advisory
services
Type 3: Data collection by private accounting
firms
BG IT NL LT PL UK DE FR SE
A: Overall
management €25,695 €6,423 €57,618 €15,243 €400,629 €442,128 €746,419 €232,475 €246,235
A1: National FADN
Committee €487 €6,423 €10,191 €1,547 €475 €2,922 €24,921 €3,805 €1,549
A2: Regional FADN
Committee €58,287
A3: Stuttgart
Programme €15,322
B: Design of selection plan
€893 €1,927 €65,495 €17,153 €3,897 €975 €6,943 €4,046 €3,099
C: Recruiting participating
farmers
€22,327 €983,553 €37,641 €21,947 €67,446 €18,429 €59,156 €30,985
D: Maintaining farms in
the network (farmer
feedback)
€8,931 €89,414 €5,991 €29,405 €3,300 €281,054 €46,247 €10,845
E: Data collection €149,591 €4,023,625 €2,947,256 €505,933 €6,917,447 €5,112,035 €3,253,797 €2,000,433 €512,154
E1: Administration,
management, etc.
€5,149 €710,834 €566,215 €72,677 €9,296
E2: Training €26,792 €536,483 €17,954 €306,128 €372,945 €53,858 €110,832 €37,182
E3: Data collection €100,471 €3,487,142 €2,947,256 €438,936 €3,523,119 €3,963,318 €3,199,939 €1,816,924 €404,821
E4: Data entry and
collation €22,327 €43,894 €2,377,366 €209,557 €60,855
F: Data quality control €22,327 €2,595,058 €47,245 €58,381 €584,240 €110,735 €115,167 €1,744,247 €139,995
F1: Pre-submission
validation €11,163 €2,593,003 €45,921 €45,702 €478,129 €81,819 €102,321 €1,671,570 €59,774
F2: Post-submission
validation (RICA-1
queries)
€11,163 €2,055 €1,324 €12,678 €106,111 €28,916 €12,845 €72,677 €84,822
G: Data storage (IT
operation and
management)
€893 €122,708 €11,933 €230,424 €287,105 €55,439 €21,690
H: Data processing and
transfer to RICA-1 €4,465 €21,832 €9,486 €28,059 €129,246 €36,060 €16,311 €52,133
Payments to farmers €8,000 €694,721 €162,862
TOTAL (2012-14 average) €235,122 €7,700,000 €3,305,785 €677,480 €8,862,717 €6,430,725 €6,430,725 €4,056,667 €1,179,996
Source: Online survey and case study investigations.

Study on cost of and good practices for FADN data collection
77
Table 6.7: Estimation of costs for specific activities along the FADN supply chain (average costs/Farm Return)
BG IT NL LT PL UK DE FR SE
A: Overall management €11.67 €0.58 €38.41 €15.24 €33.11 €176.85 €84.82 €30.43 €240.23
A1: National FADN
Committee €0.22 €0.58 €6.79 €1.55 €0.04 €1.17 €2.83 €0.50 €1.51
A2: Regional FADN
Committee €6.62
A3: Stuttgart Programme €1.74
B: Design of selection plan
€0.41 €0.17 €43.66 €17.15 €0.32 €0.39 €0.79 €0.53 €3.02
C: Recruiting participating farmers
€10.14 €88.31 €25.09 €21.95 €0.00 €26.98 €2.09 €7.74 €30.23
D: Maintaining farms in the network (farmer
feedback)
€4.06 €8.03 €3.99 €29.40 €0.27 €112.42 €5.26 €10.58
E: Data collection €67.93 €361.28 €1,964.84 €505.93 €571.69 €2,044.81 €369.75 €261.84 €499.66
E1: Administration, management, etc.
€5.15 €58.75 €226.49 €9.51 €9.07
E2: Training €12.17 €48.17 €17.95 €25.30 €149.18 €6.12 €14.51 €36.28
E3: Data collection €45.63 €313.11 €1,964.84 €438.94 €291.17 €1,585.33 €363.63 €237.82 €394.95
E4: Data entry and
collation €10.14 €43.89 €196.48 €83.82 €59.37
F: Data quality control €10.14 €233.01 €31.50 €58.38 €48.28 €44.29 €13.09 €228.30 €136.58
F1: Pre-submission
validation €5.07 €232.83 €30.61 €45.70 €39.51 €32.73 €11.63 €218.79 €58.32
F2: Post-submission
validation (RICA-1
queries)
€5.07 €0.18 €0.88 €12.68 €8.77 €11.57 €1.46 €9.51 €82.75
G: Data storage (IT
operation and
management)
€0.41 €81.81 €11.93 €19.04 €114.84 €6.30 €21.16
H: Data processing and
transfer to RICA-1 €2.03 €14.55 €9.49 €2.32 €51.70 €4.10 €2.13 €50.86
Payments to farmers €8.00 €57.41 €71.88 €158.89
TOTAL (2012-14 average) €106.78 €691.39 €2,203.86 €677.48 €732.46 €2,572.29 €558.07 €530.98 €1,151.22
Source: Online survey and case study investigations.

Study on cost of and good practices for FADN data collection
78
6.3.4. Investigation of factors explaining differences in cost
Differences between Member States in cost per completed FADN Farm Return can arise
for a number of reasons. Some result from the structure and nature of the national farm
accounts surveys, for example:
relative scale and scope of national farm accounts surveys; and,
different requirements for labour (largely reflecting different approaches to data
collection).
Others result from external factors such as:
different wage levels between Member States; and,
different size distributions of farm businesses and average farm size (partly
influenced by the FADN field of observation).
The impact of these factors is discussed in the following sub-sections.
6.3.4.1. Relative scale and scope of national farm accounts surveys
A key issue when considering the costs of the FADN system, as mentioned above, is the
complication caused when Member States have:
a) a larger national sample (beyond a reasonable ‘safety’ margin to allow for
rejection);
b) greater scope in terms of the data collected; and/or,
c) greater depth in terms of the data collected.
Our online survey provided information on these characteristics, shown in Table 6.8.
Eight Member States said that their national farm accounts survey exceeded the
requirements of FADN in terms of scale; with the exception of Luxembourg, these
Member States are found in the Type 2: C-AS and Type 3: C-AF groups. Although the
over sample is not large in Denmark, farms below the FADN economic size threshold are
included in the national typology.
Sixteen Member States reported that their national farm accounts survey exceeded the
scope of EU-FADN and 18 said that it went beyond the depth required. Although there is
little relationship to our typology in terms of additional scope, it does appear as though
Member States where data collection is undertaken by accounting firms (Type 3: C-AF)
are least likely to collect a greater depth of coverage.

Study on cost of and good practices for FADN data collection
79
Table 6.8: National farm accounts survey scale and scope
Larger national
sample
Greater scope of
coverage
Greater depth of
coverage
Type 1: Data collection by Liaison Agency
Belgium No Yes Yes
Bulgaria No No No
Cyprus No Yes Yes
Greece No No No
Ireland No Yes Yes
Italy No Yes No
Luxembourg Yes (900/450,
100%)
Yes Yes
Malta No No No
Netherlands No Yes Yes
Portugal No Yes Yes
Type 2: Data collection by public advisory services
Croatia No No Yes
Czech Republic Yes (1,475/1,417,
4%)
Yes Yes
Finland Yes (1,195/1,100,
9%)
Yes Yes
Latvia No No No
Lithuania Yes (1,300/1,000,
30%)
No Yes
Poland No No Yes
Slovakia No No No
UK Yes (3,300/2,500,
32%)
Yes Yes
Type 3: Data collection by private accounting firms
Austria Yes (2,250/2,000,
13%)
Yes Yes
Denmark Yes (2,200/2,150,
2%)
Yes Yes
Estonia No Yes Yes
France No Yes Yes
Germany Yes (11,500/8,800,
31%)
Yes Yes
Hungary No No Yes
Romania No No No
Slovenia No No No
Spain No No No
Sweden No Yes No Source: Online survey.
Where the national farm accounts survey exceeds the scale, scope or depth of EU-FADN,
then, in principle, some correction should be made to the total cost as not all of it is
incurred by the requirements of FADN. For this reason, Liaison Agencies were asked to
separately identify the costs of only the FADN component where this was known.
However, none were able to do so; this figure was claimed either to be unknown or not
capable of calculation. This issue was probed in more depth in our case studies and
these confirmed that it is not possible to split total cost between EU-FADN and purely
national requirements with any degree of precision.

Study on cost of and good practices for FADN data collection
80
In Germany and the UK the sample, scope and depth of the national farm accounts
survey exceeds EU-FADN requirements. In Germany the point was made that, while the
FADN sample is 77% of the national sample, costs include a fixed as well as variable
element and it does not follow that the true cost of FADN is 77% of the cost of the
national farm accounts survey. In the UK (England) the organisation responsible for data
collection explained that an over sample is required to ensure that the selection plan can
be met after allowing for rejections43. The national sample in England has been around
1,900 in recent years (1,500 completed Farm Returns are required by EU-FADN), but this
will be reduced to 1,800 from 2015. The data collector felt that it would not be possible
to reduce the sample below 1,750 (17% surplus) to guarantee the supply of 1,500 Farm
Returns which fulfil the selection plan44.
In terms of greater scope and depth, in Germany it was explained that the time required
to collect individual variables differs and, where these are simply extracted from
electronic secondary data sources, the number of variables being collected makes very
little difference to the task. In Lithuania the Liaison Agency pointed out that there
would be little or no difference in data collection costs if the depth of coverage did not
exceed FADN. In fact, the extra depth of coverage is claimed to result in a reduction in
validation effort which offsets any small additional cost. Interviewees in the
Netherlands stated that it is not possible to estimate the cost of meeting the EU-FADN
requirements alone with any certainty.
In Poland we were told that there would be no saving from only collecting the data
required by EU-FADN; the additional information collected there is considered to be very
marginal.
However, in Italy the Liaison Agency estimated that around a quarter of the current
employment cost could be saved if the national farm accounts survey matched the
coverage of EU-FADN. This is in line with the perception in the UK (England and
Scotland) where a saving of around 20% was estimated. That said, the point about fixed
and variable costs was also made in England and the collection of additional data is only
a marginal cost, given that the data collector would still have to visit holdings and the
same infrastructure would be required.
The data collector in the UK (Wales) took a different view and suggested that the
collection of additional detail does not incur additional cost as it is required to produce
the EU-FADN variables in any case; information on off-farm income is required anyway to
reconcile accounts and there would be no net saving from not collecting the data not
required by FADN.
In summary, it is not possible to make a precise correction for increased scale and scope
in national farm accounts surveys. However, it is possible using some assumptions to
make some effort in this regard. In terms of scale, this is easiest in Germany where
accounting firms are paid a fee per completed national farm accounts survey
questionnaire of €250 and farmers receive €55. An additional fee of €410 is paid where
the farm does not require accounts for tax purposes, but the majority of these farms fall
below the FADN economic size threshold. It is therefore reasonable to conclude that the
additional national sample is provided at a cost of approximately €823,500 (2,700 *
€305, no adjustment to fixed costs is made). This would reduce the cost per completed
FADN Farm Return in Germany from €558 to €464, a reduction of some 17% (c.f. the
23% reduction of sample size).
43 This will be the case for all Member States. 44 The data collector in Wales corroborated this and stated that a 20% surplus is required.
Study on cost of and good practices for FADN data collection
81
Without knowing the variable cost per completed Farm Return in any of the other
Member States with additional national sample it is not possible to perform similar
adjustment calculations. Different data collection methods make it unwise to expect a
similar percentage decrease in unit cost, although any reduction will be less than the
reduction in sample size because of the effect of the fixed costs. An estimation of the
impact of increased scale is provided in section 6.3.4.5.
In terms of scope, an estimation of the saving possible in Italy and the UK (England
and Scotland) can be made using the breakdown of time requirements presented
above. The 20% saving in time in England and Scotland would translate into a saving of
14% of total cost after adjustment to variable costs. In Italy, using the same process,
the saving of 25% data collection costs translates into a total cost saving of saving of
23%.
6.3.4.2. Different labour requirements
Labour requirements are heavily influenced by the type of data collection system used,
and so differences in labour requirements largely reflect this. The total cost of labour for
the data supply chain is also influenced by the mix of labour required, with differences
expected in the wages of accountants, temporary data collectors, extension agents and
Liaison Agency staff, although it is not practicable to consider this here. Ultimately there
will still be differences in labour costs between Member States, even after the
adjustments explored below, as a result of structural differences and labour productivity.
With reference to Table 6.1 and Table 6.4 above, some Member States with relatively
high unit costs do, as expected, have relatively high labour usage. Within Type 2: C-AS
where data are collected by public advisory services, the UK, Lithuania and Poland all
have relatively high unit costs and relatively high labour requirements, although with the
exception of Poland, this is partially explained by having a larger national sample than
required to supply FADN.
Some Member States with relatively low unit costs, as a result of collecting data via
accounting firms (Type 3: C-AF) again as expected, have low labour requirements, for
example, Denmark, Germany (and Switzerland).
6.3.4.3. Different wage levels
Another factor which confounds a simple comparison of unit cost between Member States
is the differential cost of labour. Differential wage levels will therefore be a key driving
factor behind the different level of costs. Total hourly labour costs are presented in Table
6.9. Whilst these do not necessarily in absolute terms reflect the labour costs faced by
Member States in providing data to EU-FADN, this is the most appropriate dataset
available and it is expected that the relative levels are indicative of general differences in
wages between Member States. High labour cost countries include Belgium and
Luxembourg, which have high Farm Return unit costs and labour intensive approaches to
data collection (Type 1: C-LA). Denmark and Sweden have high hourly labour costs,
but moderate Farm Return unit costs as a result of their (labour efficient) extraction of
data from accounts (Type 3: C-AF). Countries with low hourly labour costs tend to have
low Farm Return unit costs irrespective of data collection methodology, for example
Bulgaria, Latvia and Romania, all from different typological groups.

Study on cost of and good practices for FADN data collection
82
Table 6.9: Total hourly labour costs (including employment costs)
2012 2013 2014 Average
Type 1: Data collection by Liaison Agency
Belgium €38.00 €38.80 €39.00 €38.60
Bulgaria €3.40 €3.70 €3.80 €3.63
Cyprus €16.80 €16.30 €15.80 €16.30
Greece €15.70 €14.60 €14.60 €14.97
Ireland €29.80 €29.80 €29.80 €29.80
Italy €27.70 €28.10 €28.30 €28.03
Luxembourg €33.90 €35.00 €35.90 €34.93
Malta €11.80 €12.10 €12.30 €12.07
Netherlands €32.50 €33.50 €34.00 €33.33
Norway €56.40 €56.30 €54.00 €55.57
Portugal €13.30 €13.20 €13.10 €13.20
Type 2: Data collection by public advisory services
Croatia €9.50 €9.50 €9.40 €9.47
Czech Republic €10.00 €9.80 €9.40 €9.73
Finland €31.30 €31.90 €32.30 €31.83
Latvia €5.90 €6.20 €6.60 €6.23
Lithuania €5.90 €6.20 €6.50 €6.20
Poland €7.90 €8.10 €8.40 €8.13
Slovakia €8.90 €9.20 €9.70 €9.27
United Kingdom €21.70 €20.90 €22.30 €21.63
Type 3: Data collection by private accounting firms
Austria €29.70 €30.50 €31.50 €30.57
Denmark €39.40 €39.90 €40.30 €39.87
Estonia €8.60 €9.20 €9.80 €9.20
France €34.30 €34.30 €34.60 €34.40
Germany €30.50 €31.00 €31.40 €30.97
Hungary €7.40 €7.40 €7.30 €7.37
Romania €4.10 €4.40 €4.60 €4.37
Slovenia €15.60 €15.30 €15.60 €15.50
Spain €21.10 €21.20 €21.30 €21.20
Sweden €37.30 €38.20 €37.40 €37.63
Switzerland €56.40 €56.30 €54.00 €55.57
EU-28 €23.90 €24.20 €24.60 €24.23 Source: Source: Eurostat (lc_lci_lev). Notes: Industry, construction and services (except public administration, defence, compulsory social security).
6.3.4.4. Different average farm size
Interviewees in our case study countries explained that producing data for larger farms is
more time consuming than for smaller farms. In fact, in Germany (Sachsen-Anhalt),
bookkeepers explained that farmers are charged between €500 and €12,000 to produce
an account depending on scale, which illustrates the different potential time requirement.
Where accounts need to be produced as the basis for the FADN Farm Return, labour
requirements and hence cost will tend to increase with farm size. However, this is
unlikely to be a factor in data collection systems which draw on accounts that have
already been completed for tax purposes.
It should be noted that the Economic Size threshold which defines the lower boundary of
the EU-FADN field of observation is not uniform across the EU and, reflecting this and

Study on cost of and good practices for FADN data collection
83
differences in structural characteristics, farm sizes covered by the national survey vary.
FADN data were used to examine the average Economic Size of farms (Figure 6.6). It
can be seen that many Member States with high unit costs also have relatively large
farms within their FADN sample (Type 1: C-LA: Belgium, Luxembourg and Netherlands;
Type 2: C-AS: Czech Republic and the UK). Many of those with relatively small farms
have low unit costs (for example, Type 1: C-LA: Cyprus, Greece, Malta, Portugal; Type 3:
C-AF: Romania).
Farm size, on its own, cannot explain variations in unit costs between Member States.
Average farm size in the Lithuanian and Polish FADN sample is relatively small, and yet
unit costs are high (Type 2: C-AS); the same is true, to a lesser extent, of Hungary
(Type 1: C-AF). At the other end of the spectrum, average farm size in the FADN sample
is relatively high in Denmark, France and Germany and yet cost per completed FADN
return is relatively low, partly due to the extraction of data from accounts (Type 3: C-
AF).
Figure 6.6: Economic Size of farms within the FADN sample (2010-12 average) Source: DG AGRI EU-FADN.
6.3.4.5. Cumulative impact of factors explaining differences in cost per FADN Farm Return
This section brings together the preceding analysis and provides an adjustment to the
nominal costs per completed Farm Return to allow a more meaningful comparison of
resource usage between Member States. Labour costs have been adjusted by calculating
the ratio between the average wage in each Member State and the average for the EU-
2845 and then multiplying this ratio by the nominal cost in each Member State. Using an
index based on wages rather than other measures such as price indices is appropriate
45 Total hourly labour costs (including employment costs): Industry, construction and services (except public
administration, defence, compulsory social security). Eurostat (lc_lci_lev).
€0
€50
€100
€150
€200
€250
€300
€350
€400
EL BG MT PT CY IE IT LU BE NL PL LT LV FI UK CZ SK RO SI HU ES AT EE SE FR DE DK
Type 1: Liaison Agency Type 2: Advisory service Type 3: Accounting firm
Ave
rage
far
m s
ize (€'0
00 E
S)

Study on cost of and good practices for FADN data collection
84
because (a) wages, not the prices faced by employees, account for the majority of costs
incurred46; and, (b) a wage index reflects different productivity levels which are not
reflected in a price index. This wage adjustment has the effect of increasing average
resource costs in Member States where wage costs are below the EU average and
decreasing average resource costs in Member States where wage costs are above the EU
average and allows a comparison having controlled for this key explanatory variable. In
principle, a distinction should be drawn between the type (and therefore cost) of labour
used for different activities, but such a distinction goes beyond the data available and, in
any case, there will be a division of labour in all Member States which, while not the
same, is not likely to be sufficiently different to alter the findings substantially.
As a check on this approach a similar analysis was undertaken using a ratio derived from
a Eurostat price index series47. This showed the same overall pattern of results by
typology as presented below, although countries with higher wages indices relative to
price indices became comparatively more expensive and those with lower ones became
comparatively cheaper under this alternative adjustment reflecting different levels of
disposable income.
The other key difference between Member States which can be controlled for is the size
of the national farm accounts sample compared to the FADN requirements. In the case
of Germany this has been done by reference to the marginal cost paid to accountants per
Farm Return as explained above. In the other Member States where the national sample
exceeds the FADN sample this has been done more crudely by dividing the total cost by
the national rather than the EU-FADN sample (i.e. spreading the total cost over more
holdings and presenting cost per national survey response in these cases). While this
does not allow for fixed costs, it is the most accurate method possible with the data
available. We have not adjusted for increased scope or depth of coverage in those two
countries which provided an estimate of the cost saving possible because (a) comparable
information was not available across all relevant Member States and (b) the adjustments
provided were qualitative estimations only; this should be borne in mind when
interpreting results, particularly for Italy and the UK.
After adjustment for different sample sizes and different wages, the average total cost
per completed Farm Return is shown against the FADN sample in Figure 6.7. Member
States where data collection is carried out by the Liaison Agency (Type 1: C-LA) are
shown in blue triangles, those where data collection is carried out by public advisory
services (Type 2: C-AS) in green squares and those where data collection is carried out
by accounting firms (Type 3: C-AF) in red diamonds. The Figure shows some interesting
redistributions. First, and as expected, Member States with lower wage levels move to
the right (for example, Type 1: C-LA: Bulgaria; Type 2: C-AS: Croatia, Czech Republic,
Lithuania and Poland; Type 3: C-AF: Romania and Hungary) and some Member States
with higher wage levels move to the left (Type 1: C-LA: Belgium and Netherlands; Type
2: C-AS: Finland and Type 3: C-AF: Austria). Although not EU Member States, the very
high labour costs in Norway (Type 1: C-LA) and Switzerland (Type 3: C-AF) explain their
respective moves to the left after this adjustment.
When comparing specific Member States, the nominal cost per completed Farm Return is
important. For example, Belgium and Sweden have similar labour rates48 and therefore
46 Prices tend to converge in a single market under the law of one price whereas wages are more ‘sticky’ due to
impediments to movement such as language and mutual recognition of qualifications. Wages therefore differ
more between countries than prices. 47 “Comparative price levels of final consumption by private households including indirect taxes”:
http://ec.europa.eu/eurostat/tgm/table.do?tab=table&tableSelection=1&labeling=labels&footnotes=yes&langua
ge=en&pcode=tec00120&plugin=0 48 Belgium 1.59 times EU-28 average and Sweden 1.56 times.
Study on cost of and good practices for FADN data collection
85
the percentage adjustment is also similar. However, the higher nominal cost in Belgium
leads to a greater adjustment in monetary terms.
Member States for which adjusted costs are little different from nominal costs include
Italy (Type 1: C-LA), the UK (Type 2: C-AS) and France, Germany and Spain (Type 3: C-
AF). In the case of Italy, Spain and the UK this is mainly because labour costs are close
to the EU-28 average; in the case of Germany and France a data collection system
(largely) based on already completed accounts provides an additional explanation49.
An examination by typology (the weighted averages for the three groups are shown in
the Figure) shows that Member States where data collection is based on completed
accounts (Type 3: C-AF) tend to have both above average sample size and lower than
average adjusted costs. In contrast, Member States in which data collection is carried
out by public advisory services (Type 2: C-AS) tend to be clustered in the quadrant with
below average sample size, but above average adjusted costs (Poland is an exception
with a very large sample size). There is less of a discernible pattern to the distribution of
adjusted costs in Member States where data collection is carried out by the Liaison
Agency (Type 1: C-LA), but these Member States also tend to have relatively small
sample sizes and costs that are, on average, slightly lower than the EU average,
although there are some notable exceptions.
Cluster analysis was used to validate our typology. While this did not create groupings
that were meaningful outside the parameters used to generate the clusters (i.e. costs of
data collection and sample size), it did confirm that different data collection
methodologies are associated with different average costs. The weighted adjusted
average costs per completed national Farm Return for each typology fall into three
distinct clusters, even though individual Member States within the typology are more
scattered.
One cluster included Bulgaria, Croatia, Denmark, France, Germany, Greece, Italy,
Malta, (Norway) and Spain as well as the weighted average for Member States where
data are collected by accounting firms (Type 3: C-AF). Forty percent of the Member
States (4/10) in this cluster (in bold) fall into this typology. A second cluster included
Austria, Cyprus, Estonia, Finland, Hungary, Ireland, Latvia, Luxembourg, Portugal,
Romania, Slovakia, Slovenia, Sweden and (Switzerland) as well as the weighted average
for Member States/countries where data are collected by Liaison Agencies (Type 1: C-
LA). Some 29% of Member States/countries in this cluster fall into this typology (4/14).
A third cluster included Belgium, Czech Republic, Lithuania, Netherlands, Poland, UK
(England, Scotland, Wales) and UK (Northern Ireland); this group included the
weighted average for Member States where data are collected by public advisory services
(Type 2: C-AS). In this case 57% of Member States in this cluster also fall into this
typology (4/7). All Member States/countries where data collection is carried out by
accounting firms (Type 3: C-AF) fall into the first two clusters suggesting a clearer
difference in costs between this grouping and the grouping where data are collected by
public advisory services (Type 2: C-AS).
Although the choice of data collection approach adopted in each Member State rarely
seems to have been the result of the conscious consideration of a number of alternatives
(see Theme 1), it should be noted that it does appear sensible for Member States with
large samples to adopt a labour-efficient approach to data collection such as via
accountants (Type 3: C-AF), although this approach relies on accounts being required for
taxation purposes. Poland, Italy and Greece stand out as Member States with large
49 Because these are all Member States with large populations it follows that their labour costs will be heavily
reflected in the EU-28 figures so it is expected that labour costs are not substantial different from this average.

Study on cost of and good practices for FADN data collection
86
samples which do not fall into this grouping, but it should be noted that Poland, and to a
lesser extent Greece, have relatively low labour costs. This is not the case in Italy.
Member States may benefit from a trade-off between data collection costs and the
provision of advice. For example, relatively high unit costs in Member States using public
advisory services to collect data may consider this worthwhile given the greater ability to
provide advice linked to the data provided and thereby to achieve impact from the
information generated at public cost. In other words, the rationale for a data collection
system can be seen as part of a cost-benefit relationship rather than simply as a cost50.
For example, in Poland, while most data are collected by advisors (Type 2: C-AS), a
small number of data collectors are dedicated to this activity and do not provide advice.
These are considered more efficient at data collection, but clearly less able to deliver
benefits to farmers.
The analysis of adjusted data collection costs also provides a guide to the future
development of the costs of the FADN system. There are still differences in unit costs
after adjustments have been made, with labour intensive systems appearing more
expensive, and this reveals underlying differences in productivity51. Where labour is
inexpensive it is possible to have labour-demanding data collection systems without
excessive cost. Where labour is more expensive then it is substituted (to varying extents
and according to technical possibility) by capital in the form of greater use of secondary
data and IT solutions (for example, in the Netherlands). As the costs of labour increase
it will become increasingly sensible for Member States with labour intensive systems to
use less of it. That said, the use of accounts as the basis for FADN requires as a
prerequisite that accounts have to be produced. It is expected that Member States will
increasingly consider labour efficient solutions as labour costs rise, although wholesale
changes in approach are likely to be difficult to enact, at least in the short-term.
50 Although, as noted above, there is a risk that this leads to a biased sample, especially where sample turnover
is low. 51 There will also be differences in labour requirements for data validation which will also impact on cost, but
these will be more marginal.

Study on cost of and good practices for FADN data collection
87
Figure 6.7: Adjusted average total cost per completed Farm Return vs national sample (2012-14 average)
Source: Agra CEAS Consulting calculations based on online survey and Eurostat.
0
2,000
4,000
6,000
8,000
10,000
12,000
14,000
0 50 100 150 200 250 300
Nat
ional
sam
ple
siz
e
Index of adjusted cost per holding (labour and sample size) and showing data collection typology (EU weighted average =100)
HR
UK (E, S & W)
PL
ES
MT
FR
DE IT
DK
EL
HU
UK
RO
BG
NO
CH
PT AT
UK (NI)
CZ LT BE
NL
LV
CY
SE FI
SK EE
IE SI
LU
EU weighted average (100)
EU unweighted average (115)
Average sample size: 3,090
Public advisory services (weighted average)
Accounting firms (weighted average)
Liaison Agencies (weighted average)

Study on cost of and good practices for FADN data collection
88
6.4. Costs of change or adaptation
The FADN evolves with changing policy needs and marginal adjustments to its coverage
are sometimes required. An indication of the costs involved in changing or adapting the
data collection process is possible based on our analysis of the collection systems found
in Member States, but it is first necessary to consider the nature of the adaptations
required. Changes under consideration have to be relatively minor and feasible within
the present collection architecture. This would rule out from our coverage shifts in the
main methods of data collection (such as towards the use of data taken from accounts
prepared for taxation purposes where this is not currently done; changes of this nature
would involve transition costs and hiatuses in the supply of data). It would also exclude
certain methodological harmonisations that could carry implications for the quality of
results, but which would represent major change, such as requiring all recruits to be
selected at random from the entire population of farms (while some Member States
attempt to do this, others currently recruit from existing clients of data collecting
agencies, which makes the task considerably easier and less costly, though possibly
introducing a degree of selection bias).
From our review of the literature, the evidence gathered from our online survey and case
studies and consultation with our team of experts, the most likely forms of change to
which national farm accounts surveys may be expected to adapt are:
a) Changes to the scope of EU-FADN questions (such as the addition of questions on
the other incomes accruing to the operators of farm businesses, disaggregation of
variable inputs to allow the calculation of gross margins at the enterprise level,
and on metrics of sustainability and the environment). The evolving focus of the
CAP inevitably means that the data required from EU-FADN has to develop, with
its main response being in the form of questions added; without this, EU-FADN
runs the danger of obsolescence and disuse by policymakers at EU level. While
reductions in the number of variables required by EU-FADN (in the form of
simplification) is also possible, these face less constraints than do increases.
b) Changes in the number of completed Farm Returns required by EU-FADN. While
reductions linked to, for example, increases in the size threshold for inclusion, are
the more likely, nevertheless a greater policy attention to the incomes of the
operators of farms (in contrast to the present focus on production and area of
land used) may require EU-FADN to extend its coverage into smaller farm size
group and thereby increase total numbers (although the long-term trend towards
fewer and larger farms will work in the opposite direction).
We consider the feasibility and costliness of adaptations to these changes in this section.
In addition, implementation of many of the ‘best practices’ we identify under Theme 4
(Chapter 8) below imply change which is minor rather than major, and their feasibility is
indicated at that stage in our report.
6.4.1. Changing the scope of variables collected for EU-FADN
The feasibility and costliness of extending the scope of variables will depend on the
nature of these variables and will vary between Member States. Already over half of EU
countries collect more than is needed for EU-FADN (16) in the online survey), but the
nature of this additional material is not known in detail. Extending coverage where the
data are already collected would not appear to be costly, though there would be issues
over the exact nature of the variables’ specification. Our case studies and the literature
indicates that the main additional areas covered were greater detail for variables covered
by the EU-FADN Farm Return and, outside the Farm Return, household income variables
and environmental/sustainability variables. An analysis of what potential new EU-FADN
variables are already covered would require a detailed scrutiny of each Member State’s

Study on cost of and good practices for FADN data collection
89
national questionnaire, an activity that is beyond the scope of the present study.
However, it is known from the literature and our case studies that coverage of household
income in the national farm accounts survey is a regular feature of Member States across
all three data collection types: Austria, Denmark, Finland, Germany, Italy, the
Netherlands, Sweden (formerly), and the UK, though there are known to be differences
in the nature of the information (for example, the UK uses ranges for off-farm income in
order to provide an indication of the relative importance of these other sources of income
without placing an undue burden on the respondent farmer or appearing too intrusive,
whereas some other countries may use exact figures). Some other Member States
include these questions periodically or arrange links with external data sources (Ireland
and France).
However, perhaps as a general principle, data should be collected only in as much detail
and precision as is needed to meet the analytical requirement (for example, by using
ranges rather than seeking exact figures where there is a desire only to form an
impression of the order of magnitude of an issue such as off-farm income that might
warrant further investigation while wishing to minimise the burden on both the data
collector and the data provider). In addition, there are benefits in maintaining as much
flexibility as possible in the scope of the variables collected so that the national survey
can be adapted without too much trouble to meet occasional or ad hoc needs and
address issues which arise or to provide information that might not be needed on a
continuous/annual basis.
An extension of questions by Member States which do not already cover this basic
material is more problematic. Sometimes that data may exist in administrative sources
(for example, the detail of subsidies) so the feasibility of securing this information may
depend on obtaining access (consent by farmers to this is best practice) and of ensuring
correct matching between units. Costs may be small once the initial investment of set up
is made. For additional data that can only be obtained by direct collection from farms,
there are no doubt real costs, both to the agency that collects the data and to the farmer
in the time used to supply it. This is particularly the case where the additional material is
not part of the normal financial accounting framework, such as some environmental
indicators. However, it must be recognised that collecting this additional information will
be marginal to the basic collection infrastructure and might be justified in view of
changing policy priorities.
It must also be recognised that a move to collect additional data in many Member States
involves transactions costs. New or changed contracts with data collection agencies may
be required which involves negotiation costs. Sometime the additional material disturbs
the established relationship between the collector and the farmer (questions on income
from outside the farm were initially resisted by some UK universities because of the fear
(proved to be largely unfounded) that these might lead to a sharp drop in participation).
However, senior DG AGRI staff noted that it may be possible to use some of the already
existing additional information for groups of Member States which already collect it, even
though a full EU picture could not be presented.
Reductions in the EU-FADN requirements, such as from simplification, while superficially
feasible and not involving extra cost, are unlikely to lead to substantial savings. The
point has been made in the case studies that, where the current scope is broader than
that required by EU-FADN, reducing the coverage to that level would not necessarily save
resources (various estimates ranged from zero to 20%). Some Member States might
also prefer to continue collecting the data for national purposes.

Study on cost of and good practices for FADN data collection
90
6.4.2. Changing the number of EU-FADN completed Farm Returns
A similar set of arguments surround changes in the number of EU-FADN holdings. Some
Member States already collect data from substantially more holdings for national
purposes; in some, and across all data collection types (Finland, Germany and Italy for
example), some of these are below the EU-FADN size threshold. Depending on the
nature of the extra sample required by EU-FADN, in such countries enlarging the sample
might not involve collecting from any more farms than at present. However, in other
countries more would have to be recruited and data collected; costs would depend on the
present costs of recruitment and the data collection system employed. Average costs
would not necessarily be an adequate guide; what would be needed would be information
on the marginal cost of collecting data from additional holdings (at least up to the point
where changes in the fixed costs might prove necessary). Within Type 3: C-AF, Germany
provides an example where already there is a nationwide system of fees paid to
accounting firms for the supply of data, with one level (€250) for holdings that already
keep accounts with the firms and a higher fee (€660) for farms that do not keep
accounts52. Though these fees are set rather than negotiated with each firm,
accountants seem broadly content to operate with them, so they represent the marginal
cost of expanding the size of the survey under the economic and technical conditions
found in Germany. These figures are rather lower than the fees paid in France which are
€450 per holding where accounts are kept and €1,100 where they are not. It is not clear
why there is such a difference in this cost. Comparable data are not available where data
collection is via Liaison Agencies (Type 1: C-LA) or via public advisory services (Type 2:
C-AS).
Similarly, reductions in the size of EU-FADN samples, while saving some costs, would not
be expected to lower them by the average cost. There would not be savings in the fixed
costs of central administration, but only in the marginal costs of collection.
In summary, analyses of change are properly required to be undertaken at Member State
level, with adequate information on fixed and variable costs so that an assessment of the
marginalities can be made. It must also be recognised that there will usually be
transactions and transitional costs and non-financial aspects to adjustments. This does
not necessarily mean that such adjustments should be avoided.
52 According to our estimates, the average total costs per case of the national farm survey (i.e. dividing the
total cost by the national sample) for Germany was €464.
Study on cost of and good practices for FADN data collection
91
7. THE BENEFITS OBTAINED FROM FADN DATA TO MEMBER STATES
The benefits that are the focus of this study and reported in this section are only those
accruing to Member States. The implication is that benefits to EU institutions and,
through them, to EU policies and activities and wider benefits to the international
community outside the EU are not covered here. Some consideration has already been
given to uses as revealed by requests to the Commission’s FADN unit (see section 2.6
above) and in discussions with senior staff in the European Commission and other
organisations, but this was primarily to place FADN within its broader policy context.
This means that the benefits considered at this point are only partial and will thus be an
underestimate of the totality. This important point should be noted.
7.1. Key issues
Our third study Theme is concerned with the benefits obtained from FADN data by
Member States.
7.1.1. Benefits to actors in the data supply chain
Data systems, of which EU-FADN is an important agricultural example, form only part of
the overall information system (see Fig. 2.1 of Hill 2012). For data to be turned into
information, they need interpretation and analysis (which form part of the role of
professional statisticians and other analysts), and to be put in the hands of decision
makers who are in positions to make use of the information. By having this information
decisions can be reached that in some way are superior to those that would be reached
in its absence. Thus the benefit from information coming from EU-FADN and national
farm accounts surveys is dependent on the impact it makes on decisions by users
compared to the outcomes that would occur without it. If this information is unused or
ignored, there is no benefit. It follows that key to detecting the presence of benefits
flowing from FADN data (and that from national accounts surveys where these have
greater scope than is required by EU-FADN), and where possible their measurement, is
the identification of users and their uses of the output of the farm accounts data system.
Our analysis of the data supply chain has identified a range of actors, starting from the
individual farm (a private sector institution), through collecting organisations (which,
depending on which Member State is considered, may be private sector bodies or public
sector institutions), through Liaison Agencies (universally public sector, but taking
various forms such as government departments or institutes), to, finally, the transfer of
data to the Commission (RICA-1). When considering the use of data and the benefits
this brings, the notion of the chain can be put into reverse. The institutions at the fount-
head of the information system, which at Member State level will be the national
governments and their statistical authorities, can use it for improved policy decisions.
Organisations that interact with farmers can use it (for example as inputs when providing
advice). Farmers can use it to improve their individual farm performances. While
individual farmers may make direct use of economic results, often this comes via
extension agents (including ones supported under Pillar 2 of the CAP) who facilitate
knowledge transfer and provide management advice to farmers, including benchmarking
based on information generated by national farm accounts surveys. In some Member
States the organisations that collect data from farmers also provide management advice,
though more often advisors are separate but with good knowledge of what results are
available through the national farm accounts survey.
Our research for this project has involved an inventory of the uses made of the results of
national farm accounts surveys, and this is reported below.

Study on cost of and good practices for FADN data collection
92
7.1.2. Estimating the benefits
The benefits obtained from making use of farm accounts survey information take two
main economic forms. First, there are the private benefits, of which the main example
will be those accruing to farm businesses in the form of increased competitiveness,
higher farm incomes, more stable incomes, greater business resilience and enhanced
viability and so on. Benefits accrue not only to those farmers that take part in farm
accounts surveys and who receive feedback as part of the package of involvement, but
also to the much larger numbers of non-participants who can apply the lessons learned
from the information generated by the survey, such as the factors that distinguish high
performance from low performance. A secondary example will be private extension
agents who use the results as a tool in their professional work. In principle the value of
these are measurable, though a recurring problem with evaluations of the impact of
advice and knowledge transfer is to establish the counter-factual.
Recent experience in Wales (see Hill, Bradley and Williams, 2015) suggests that, while
farmers may declare that advice and better information has had an impact (the
conventional method for assessing impact in evaluations), this is not necessarily a
reliable guide to the actual impact. The innovation chain that starts with awareness,
moves through intention to change to, finally, actual implementation, contains several
links before impacts are delivered in terms of changed farm practice and income levels.
In the Welsh example, a quasi-experimental approach using samples of participants and
non-participants could not detect a significant difference in actual farmer behaviour,
which suggests a considerable bias in the perception of reporting impacts, possibly linked
to the need of farmers to justify to themselves the time spent in participating in advice
and knowledge transfer activities and their desire to give a positive picture of advisory
systems provided currently at public expense.
A problem with valuing the private value of information derived from farm accounts
survey data is that frequently this is delivered as part of an extension package which also
includes economic, technical and other information taken from a range of other sources.
Separating the impact made by the farm accounts component may be not only infeasible
from a practical standpoint, but indefensible from a theoretical perspective where
individual causality cannot be assigned. In addition there are other potential impacts at
farm level of a non-financial nature, such as improved environmental performance, which
the valuation of impacts should embrace.
Second there are the public benefits. The history of development of national farm
accounts surveys emerging from our online survey, the case studies and literature review
suggests that the driving force in countries that set them up before the start of EU-FADN
was to serve national policy purposes; in these countries they are still seen as
contributing to this end. While a list of uses has been built up, and is presented below,
measuring the benefit arising from the information in a quantitative fashion is highly
problematic. While some decisions could be made that are cost-saving as a result of the
information, others will be more strategic. Some uses of farm accounts results will be to
assess the potential impacts of policy options or stances in CAP negotiations or to confirm
decisions made primarily for political reasons. The rationale for spending public money
on farm accounts surveys will bear a close relationship to those for maintaining public
statistics of any type; while there may be closely argued cases for extending coverage in
certain areas to reflect emerging policy needs, and this may involve retrenchment
elsewhere, this does not mean that there is well-supported evidence of the overall
benefits of the complete system. This makes the measurement of public benefits very
difficult beyond the identifying and listing of uses.
Beyond these benefits, results from farm accounts surveys bring benefits to a range of
users less intimately connected to the data supply chain. For example, the research

Study on cost of and good practices for FADN data collection
93
community makes use of them, which brings both private benefits to the direct users and
public benefits though their research output. The results are published widely, mostly
without charge, and are thus in the nature of a public good, in common with official
statistics on agriculture. While an attempt can be made to assess the volume of such
communications (for example, numbers of hits on websites containing the results),
measuring the impact in terms of private and public benefits is far more difficult.
7.1.3. The approach taken here
The first step to assessing the benefits of EU-FADN is to identify the pattern of uses of
national farm accounts surveys found in EU-28. As is described below, this is well
supported by our online survey, is augmented by our nine Member State case studies
and backed up by our literature review. An analysis by data collection typology was
carried out, but there appears to be no clear relationship between this and the uses to
which data are put, as might be expected logically. There are occasional exceptions
which are highlighted where appropriate. A separate typology of uses is considered in
section 7.3.1.
The second step is to consider the extent to which uses are dependent on the core FADN
variables and to what extent this reflects the broader scope found in some countries.
Thirdly, an attempt has been made to measure the extent of the benefit at Member State
level by posing a set of questions to the government department responsible for its
funding within the context of our case studies. These are designed to establish:
a) whether Member States have at any time evaluated the benefits resulting from
their spending on the national accounts surveys. Where such evaluations can be
found, these will be the most authentic valuations;
b) the current perceived value to the government in relation to the current cost of
their farm accounts survey; and,
c) what governments of Member States would do if they no longer were required by
EU legislation to conduct a survey to service FADN.
7.2. Publication of results at Member State level
Before moving to uses it is necessary to consider the form in which data from national
farm accounts surveys and results based on them are made available outside the
confines of the data system. Only Malta and Slovenia appear not to publish national
results from their national farm accounts surveys (Table 7.1); of course the EU-FADN
publications and its associated public database contain contributions from these two
countries, along with equivalent results from all other Member States.
Publication is sometimes both in hard copy and in an online version. There appears to be
a preference for electronic publication, with the Liaison Agencies of 12 countries (not
including those that do not publish) indicating in their replies to the online survey that
they no longer produce standard results in hard copy. Among the case study countries,
in Germany the federal structure means that publication are issued at Länder level by
the government agency responsible for the national farm accounts survey there; in the
examples visited (Bavaria and Sachsen-Anhalt) hard copy was produced. In the UK
electronic publication takes place in all four countries but hard copy now only in two
(Wales and Northern Ireland). Also emerging from the case studies is that publication
can come in a variety of forms; while results can be issued in publications devoted
exclusively to this source, or parts of it (such as for single farming types, or those
operating particular systems such as organics or in areas of natural handicap), they can
also appear in more general publications on the state of agriculture and its development

Study on cost of and good practices for FADN data collection
94
over time. The answer to interpreting such diversity seems to lie in the clear
identification of the national farm accounts survey as the data source.
According to the online survey, public databases are available in 15 countries; this should
greatly facilitate access, though quite what this gives access to varies. For example, in
Austria the database is in Access and does not appear to be online. Among the case
studies some sophisticated examples were found. In the UK (England) the ‘Data
Builder’ is an online tool that allows interrogation of the basic individual farm anonymised
data to produce aggregated results for the England part of the Farm Business Survey.
The Netherlands has a tool (agrofoodportal.com) that, while not giving access to
individual farm data, draws on other statistics sources to provide a comprehensive online
public resource. Italy has a tool (cruscotto aziendale) which allows online consultation
by surveyed farmers of the farm balance sheet and of techno-economic indicators
benchmarked against those of groups of comparable farms. Poland and Sweden have
a national farm survey database similar to the FADN database on the DG AGRI website.
Finland (not a case study) is known to have ‘EconomyDoctor’ which presents both results
for that country and for other Member States.
In all Member States which said that they have an online database, access is free, but in
Denmark, Germany and Greece users must be approved. Liaison Agencies were asked
whether access to specific variables is restricted. Most interpreted this question as
referring to data rather than variables and explained that access to individual data is not
permitted. However, in Belgium and the UK access to location variables is restricted. In
France results below the NUTS 2 level are not made available and in Ireland the county
code and spousal income variable are restricted. The rationale for the restrictions was
always confidentiality. Access to spousal income variables in Ireland is restricted
because this is not related to farm income; an agreement was reached historically with
the Farmer Organisation that these data can be collected, but not published.
Access to farm-level data obviously adds greatly to its value as a research tool. The
general principle of maintaining confidentiality has already been mentioned. However,
there are circumstances in which access is possible, and our case study countries
illustrate this. Firstly, research may be carried out by organisations that collect the data
which will obviously have access, though clearly steps are necessary within these
organisations to maintain confidentiality. In the UK the universities in England and
Wales that collect farm data also use it, as does the collecting institute in the
Netherlands (Landbouw Economisch Instituut, LEI). Second, researchers can be given
access to farm-level data (with identifying elements removed) upon application and
approval or provided with extracted data (France, Poland, Slovenia and the UK provide
examples). Third, access can be given via a dedicated terminal in the Liaison Agency,
with suitable safeguards to maintain security (Germany and Poland).
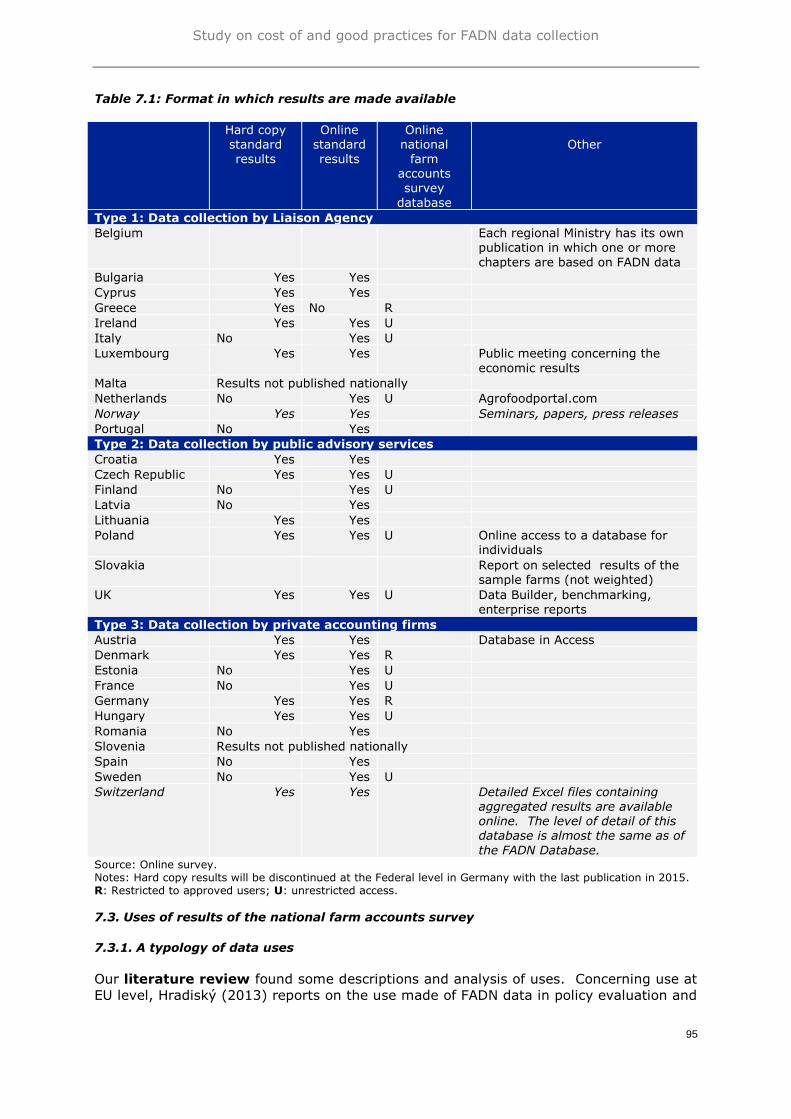
Study on cost of and good practices for FADN data collection
95
Table 7.1: Format in which results are made available
Hard copy standard results
Online standard results
Online national
farm accounts survey
database
Other
Type 1: Data collection by Liaison Agency
Belgium Each regional Ministry has its own publication in which one or more
chapters are based on FADN data
Bulgaria Yes Yes
Cyprus Yes Yes
Greece Yes No R
Ireland Yes Yes U
Italy No Yes U
Luxembourg Yes Yes Public meeting concerning the
economic results
Malta Results not published nationally
Netherlands No Yes U Agrofoodportal.com
Norway Yes Yes Seminars, papers, press releases
Portugal No Yes
Type 2: Data collection by public advisory services
Croatia Yes Yes
Czech Republic Yes Yes U
Finland No Yes U
Latvia No Yes
Lithuania Yes Yes
Poland Yes Yes U Online access to a database for individuals
Slovakia Report on selected results of the sample farms (not weighted)
UK Yes Yes U Data Builder, benchmarking, enterprise reports
Type 3: Data collection by private accounting firms
Austria Yes Yes Database in Access
Denmark Yes Yes R
Estonia No Yes U
France No Yes U
Germany Yes Yes R
Hungary Yes Yes U
Romania No Yes
Slovenia Results not published nationally
Spain No Yes
Sweden No Yes U
Switzerland Yes Yes Detailed Excel files containing aggregated results are available online. The level of detail of this database is almost the same as of
the FADN Database. Source: Online survey. Notes: Hard copy results will be discontinued at the Federal level in Germany with the last publication in 2015. R: Restricted to approved users; U: unrestricted access.
7.3. Uses of results of the national farm accounts survey
7.3.1. A typology of data uses
Our literature review found some descriptions and analysis of uses. Concerning use at
EU level, Hradiský (2013) reports on the use made of FADN data in policy evaluation and

Study on cost of and good practices for FADN data collection
96
analysis and in negotiation on CAP reform. The European Commission (2014a) has
provided us with an analysis of the types of organisation from which requests for analysis
of FADN data have emanated (principally the EU Institutions, research institutes and
universities) and the purpose of such data uses. Types of use are reviewed (see section
2.6 above). Uses associated with JRC initiatives are also evidenced (Espinosa et al.,
2011), including FADNTOOL53. The OECD’s farm-level analysis network, founded in 2008
and which meets twice a year, includes 21 Member States and provides another example
of use at the supra-national level (Moreddu, 2015). A report on high-value datasets from
EU institutions awarded FADN publications two stars (out of five using Tim Berners-Lee’s
5-Star Schema of Linked Open Data) for value and the FADN database three stars
(European Commission, 2014n). However, all these supra-national uses are beyond our
research focus.
Our concern here is specifically the use made of FADN by Member States at the national
level. There is a plethora of papers which report their use of FADN data. A significant
number of very specific uses are set out in the series of papers from the Pacioli
workshops which have taken place annually since 1995. These cover a wide range of
current uses, uses in development and potential future uses. Some of the papers report
on the conclusions of investigations of certain topics, while others are more
methodological in nature. However, in this context it is the type of use that is important,
not the specifics. Drawing on Pacioli papers and information generated by FADN
missions by staff of the European Commission to selected Member States, the literature
review contains some evidence on uses from 24 EU countries (the exceptions being
Estonia, Spain, Latvia and Austria).
Some papers relating to general issues are worth noting. Del'Homme and Aamisep
(2009) explain that it takes time for Member States to understand the data use
possibilities of FADN; as a result, the uses to which FADN data are put nationally can be
expected to be more limited amongst those Member States with shorter involvement in
FADN. Vrolijk (2012) considered possible future users of FADN in the context of the
increasing need to demonstrate value for money; these included uses by the agricultural
industry, bankers and advisory services. The author also noted that FADN could be used
more by farmers if the value to them could be better communicated. Van Lierde and
Taragola (2000) point to the increasing demand for environmental data and the potential
for FADN to supply this and the software needed; made with reference to the situation in
Belgium, a similar point about broadening environmental use is made for the Netherlands
(Ministry of Economic Affairs, 2015). The supply of environmental data (for Life Cycle
Assessments) was also highlighted by Poppe and Meensen (2000).
Our literature review provided sufficient information from both generic studies and those
for individual countries to enable a general framework of uses to be developed that
proved valuable in the construction of our online survey and the topics to be discussed in
missions to the nine countries selected as case studies. While the literature did not cover
uses in all Member States and to the same level within them, the survey and case studies
were designed to take a more uniform approach, leaving no major gaps.
According to the literature, types of use to which FADN can be put can be broken down
into a number of categories and sub-categories. A broad typology of uses is as follows:
53 FADNTOOL (Integrating Econometric and Mathematical Programming Models into an Amendable Policy and
Market Analysis Tool using FADN Database) is a 3-year project (April 2011 to March 2014) co-funded by the
European Commission under the Framework Programme 7 (FP7), addressing the Strategic theme:
KBBE.2010.1.4-02 "Development of modelling tools based on Farm Accountancy Data Network data adapted to
assess the dynamic impacts of the Common Agricultural Policy" - Call: FP7-KBBE-2010-4.

Study on cost of and good practices for FADN data collection
97
1. Government:
monitoring farmers’ incomes;
analysis of European policies (especially the CAP’s agricultural and rural
development elements) – including modelling and forecasting;
developing national policies that have connection with farming (economic,
environmental, social etc., including ex-ante evaluations);
monitoring impacts of policies (including on-going and ex-post evaluations);
informing government of impact of changes in policy (national and EU);
negotiation of EU legislation;
negotiation in WTO;
agricultural and national statistics;
assessing production costs (for use in policy analysis); and,
contribution to the work of OECD and other international organisations.
2. Other public sector:
farm planning and budgeting services to agriculture;
technical articles for the farming industry;
programme development for extension services;
updating knowledge of extension and advisory staff and industry personnel;
developing farm plans for farmers;
benchmarking farm performance;
PhD studies and other research (such as modelling) with public good output;
and,
teaching institutions, especially those in agricultural education.
3. Private sector
consultancy provision of advice to farming;
use by farmer unions and other stakeholders;
direct use by some farmers in planning/benchmarking; and,
commercial firms supplying or buying from agriculture.
7.3.2. The uniqueness of farm accounts survey data
The uses of farm accounts survey results are intimately connected with their nature as
being microeconomic. For some purposes alternative sources of information exist, such
as developments of income from agricultural production over time, which can be
observed not only in farm level results, but also by using aggregate income indicators
developed from the Economic Accounts for Agriculture (EU or national). However, for
other purposes only data taken from observation at farm business (or household) level
will suffice. At Member State level the national farm accounts survey is usually the only
source of microeconomic data. Indeed, senior DG AGRI staff outside the FADN unit
consider the microeconomic nature of FADN its main advantage.
The uniqueness of this source of information was confirmed by almost all of our nine
case studies, (in Italy the discussion did not deal with this issue explicitly, but literature
implies currently a similar situation) with usually no other existing data system being
capable of generating it. UK (England) went as far as indicating that, if it were not to
exist, then bespoke surveys would be needed to tackle specific issues, but these would
not provide the time series available from the present farm accounts system. Similarly,
interviewees in Poland pointed to the limitations of small-scale university research

Study on cost of and good practices for FADN data collection
98
projects as an alternative source of farm level data. In UK (Wales) we were told that
the survey is a relatively rare example of high quality (agricultural) data and is therefore
invaluable to that part of the UK. Interviewees in the Netherlands cited alternative
ways of collecting the data, but the concept of a single survey to collect a wide range of
economic and other data was deeply embedded there and accepted by the government
as a cost-efficient way of meeting multiple needs and which respected national aims,
such as minimising the burden on farmers. In Germany the farming unions have their
own survey, which sometimes has a sample larger than the TBN, but the scope is not as
comprehensive and the published results, which can differ from those from the TBN,
must be seen in the context of the interests of the unions.
Only in Sweden was the impression of uniqueness significantly challenged, with other
sources (such as the business register) potentially capable of generating some of the
information contained in the farm accounts survey. But even there actual replacement
was regarded as being ‘difficult’, lacking the same depth of information; the data could
not be used to investigate the agricultural sector in any detail. Another source of
information in Sweden is derived from a database of between 16,000 and 20,000
holdings maintained by the farming union LRF-Konsult (the main data collector for
FADN). Information is provided from accounts produced by this organisation and is
supported by analysis. This database is used by LRF-Konsult to produce an early
estimate of profitability in the sector and for lobbying purposes. This is not as
comprehensive in coverage as FADN. Although the Board of Agriculture and academic
researchers do not make substantial use of this database, it is considered to be useful for
farms which fall below the FADN size threshold and for which there would otherwise be
no available information. This database is used in the production of the Economic
Accounts for Agriculture because it is more representative of the sector as a whole given
the inclusion of small farms.
7.3.3. Use by national or regional governments of Member States
It is clear from the evidence gathered from our three main sources that, in addition to its
use at EU and international level in the form of FADN, the data collected by national farm
accounts surveys are widely used by the national (and where appropriate regional)
governments of Member States. According to senior DG AGRI staff, FADN has utility in
being an accepted source of data from which the Commission, European Parliament and
Member States can build positions without the need for the underlying data to be
questioned. In case study countries where the national survey has a broader scope than
EU-FADN, the pattern of use reflects this wider coverage; this is most noticeable in the
Netherlands where, in the opinion of interviewees, core EU-FADN data alone probably
would not be used much and where the additional material collected in combination with
the core EU-FADN data is what makes it really useful. A similar but less extreme
situation was found in Italy, Germany, and the UK where coverage is also wider.
As noted above, in general there seems to be no link between the typology of data
collection systems this research has developed (see Theme 1) and the pattern of uses,
nor is there any strong rationale as to why there should be such a link. The exception is
in the provision of advice to farmers and benchmarking, where the data collectors may
also provide these services; this issue is explored below.
Our online survey of Liaison Agencies in Member States asked about such uses of the
national farm accounts survey data and results; respondents were not generally in a
position to answer for the data required by EU-FADN alone. Uses were identified by
means of a predetermined list, which included categories related to policy making and
forecasting (including in CAP negotiations), to acting as a source of data for aggregate
accounting and statistics, to drawing comparisons between regions and countries, to
estimating costs of production and margins, and to providing a source of information for

Study on cost of and good practices for FADN data collection
99
extension purposes. As Liaison Agencies are responsible for FADN in their respective
Member State this study anticipated that the respondent would have a good knowledge
of how their national results were used. This was borne out by the completeness of
answers. However, it must be recognised that, in Member States where the Liaison
Agency was not the government department responsible for agricultural policy, there
may have been some gaps in detailed knowledge. In case study countries this could be
offset by direct questioning of the respective ministry. The literature review was also
helpful in this regard with, for example, establishing evidence for particular uses that had
been missed by respondents to the survey.
Table 7.2 presents a consolidated version of the online survey results. Analysis is
provided in the following sub-sections.

Study on cost of and good practices for FADN data collection
100
Table 7.2: Use made of national farm accounts data by national/regional governments
Policy use Forecasts Use in
accounts
Economic/
statistical
publications
Measures of
productivity
To inform
CAP
negotiations
Farmer
extension
and advice
Public
database
Comparisons
Type 1: Data collection by Liaison Agency
Belgium F, E X m, N X P, SO X X MS
Bulgaria F, A, E X P, SO R, MS
Cyprus F, E X M, N X SO R, MS, S
Greece E m X SO X
Ireland F, A, E X N P, GM, SO X X X R, MS, non-
EU
Italy F, A, E X M P, SO X X X R
Luxembourg F, E X M, N X P, GM, SO X X MS, non-EU,
S
Malta F, E M X SO X
Netherlands F, A, E X m, N X P, GM, SO X X X R, MS, non-
EU, S
Portugal F, A, E X m X P, GM, SO X X R, MS
Norway F, A, E X m X P, SO X X R, MS, non-
EU, S
Type 2: Data collection by public advisory services
Croatia P X R, MS
Czech
Republic
F, A, E (X) m X GM, SO X X X MS
Finland F, A, E X m, N X P X X X R, MS, S
Latvia F, A, E X M, N X P, SO X X R, MS
Lithuania F, A, E X m, (N) X P, SO X MS
Poland F, A, E X m X P, SO X X X R, MS
Slovakia F, A, E X SO X
UK F, A, E X M, N X P, GM, SO X X X R, MS, non-
EU, S
Type 3: Data collection by private accounting firms
Austria F, A, E M, N X X X R, MS
Denmark F, A, E X M X P, GM, SO X X MS, non-EU,
S
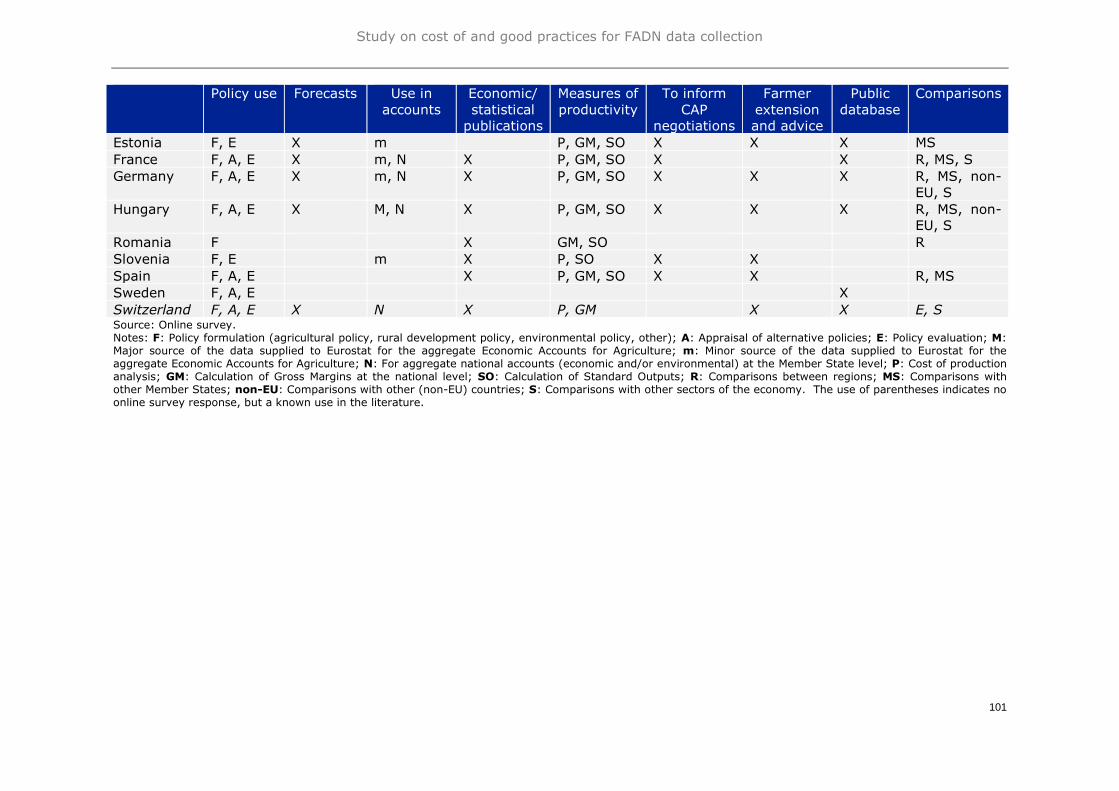
Study on cost of and good practices for FADN data collection
101
Policy use Forecasts Use in
accounts
Economic/
statistical
publications
Measures of
productivity
To inform
CAP
negotiations
Farmer
extension
and advice
Public
database
Comparisons
Estonia F, E X m P, GM, SO X X X MS
France F, A, E X m, N X P, GM, SO X X R, MS, S
Germany F, A, E X m, N X P, GM, SO X X X R, MS, non-
EU, S
Hungary F, A, E X M, N X P, GM, SO X X X R, MS, non-
EU, S
Romania F X GM, SO R
Slovenia F, E m X P, SO X X
Spain F, A, E X P, GM, SO X X R, MS
Sweden F, A, E X
Switzerland F, A, E X N X P, GM X X E, S Source: Online survey. Notes: F: Policy formulation (agricultural policy, rural development policy, environmental policy, other); A: Appraisal of alternative policies; E: Policy evaluation; M: Major source of the data supplied to Eurostat for the aggregate Economic Accounts for Agriculture; m: Minor source of the data supplied to Eurostat for the aggregate Economic Accounts for Agriculture; N: For aggregate national accounts (economic and/or environmental) at the Member State level; P: Cost of production analysis; GM: Calculation of Gross Margins at the national level; SO: Calculation of Standard Outputs; R: Comparisons between regions; MS: Comparisons with other Member States; non-EU: Comparisons with other (non-EU) countries; S: Comparisons with other sectors of the economy. The use of parentheses indicates no online survey response, but a known use in the literature.

Study on cost of and good practices for FADN data collection
102
7.3.3.1. Policy analysis
It is clear that the national farm accounts survey is a resource heavily used by
governments, irrespective of data collection typology. Respondents to the online
survey indicated that it was almost universally used in policy formulation (agricultural
policy, rural development policy, environmental policy, or other); 26 Member States
indicated this use, though it should be noted that in Belgium there is no use of data at
the national level, and responses related to regional level. The only examples of non-use
in the online survey were Croatia, where the explanation is probably that of lack of
experience so far in having this sort of information, and Greece. Although the Literature
Review suggested that Malta does not use FADN for policy analysis, the online survey
suggests that this is now the case. Some 26 Member States used the data for policy
evaluation (Croatia and Romania being the exceptions) and 19 countries used it for the
appraisal of alternative policies. Some 19 reported that the data informed CAP
negotiations; among EU-15 the exceptions were Austria, Greece and Sweden. Nineteen
Member States also used the results within forecasting, and Austria, Greece, Spain and
Sweden were EU-15 exceptions. However, it seems highly likely that there is interest in
forecasts in all four, so there may be some under-reporting.
Among the case study countries the additional information revealed an apparent lack of
use for forecasting in Sweden; this may reflect the way in which policy issues are
explored there where the Ministry does not use the data directly, but makes requests to
the Board of Agriculture which then carries out analysis on its behalf.
Among the other case studies the information gathered is in line with what was reported
in the online survey. In Bulgaria the main uses of FADN data by government are
related to policy planning and evaluations. The agency for direct payments makes use of
the data in its calculation of subsidies, as does the agency for rural development.
France uses the data to formulate and evaluate policies, in forecasts and to implement
economic models. Ministries may use their own expertise when using EU-FADN or
national farm accounts survey data (for example the Ministry of Agriculture in its study
Prospective Agriculture Energie 2030) or contract researchers; in general the reports
from these appear in the series Notes et Etudes Socio-Economiques. Some use the EU-
FADN results while others adopt the somewhat more detailed national survey (where
there is more information on, for example, energy). Examples concern the possibility of
reducing pesticide use, and the performance of organic farming (for details of these and
others see the case studies). In Germany, in addition to federal uses for policy design
and implementation purposes, the Länder Ministries make use of the larger-than-FADN
sample54 to investigate issues of regional interest (such as types of farming that are
important locally). In Lithuania the case study interviews revealed multiple uses
beyond general policy analysis and evaluations, including justification for voluntary
coupled support for the livestock and crop sectors, differentiation of support for organic
producers, calculation of payments for farming in areas with natural handicaps; these
specific operational uses are likely to be common among Member States though rarely
surface in discussions.
In the Netherlands the extended coverage of the national farm accounts survey into
variables not required by EU-FADN (especially those concerned with sustainability)
means that it is used to meet a wide range of statutory tasks under EU and national
obligations (of which derogation under the Nitrates Directive is of particular importance).
The case study material sets out a list of policy analysis articulated in detail (including
CAP impact analysis and position determination, manure policies, crisis resilience analysis
and calculation of compensation for animals slaughtered in disease outbreaks, trade-off
54 Regional samples are also often larger than required under the national farm accounts survey which itself
exceeds FADN.
Study on cost of and good practices for FADN data collection
103
between policies that affect sustainability, such as the economic impact of animal welfare
policies, animal health policies, environmental policies), together with uses for foresight
studies, risk management etc.
Again, other Member States may replicate such uses within the narrower constraints of
their national accounts surveys. A particular use mentioned in Italy, the Netherlands
and Poland is to answer questions raised in their national parliaments on many topics
related to agriculture and its support; again this form of use is likely to be widely
experienced. A reminder from the Poland case study is that the farm accounts survey is
also drawn upon to inform national (as opposed to EU) agricultural policy; for example it
is used in connection with the income safety net under national legislation. In the UK
(England) a detailed list of uses by the government is available which, in addition to
similar analysis in other countries, covers the impact of grants on farm economic
performance and of a range of management practices using additional information
collected using modules added to the basic national questionnaire.
There is a clear link between the organisation of the data supply chain and way in which
national farm accounts data are used for the purpose of policy analysis, and the case
studies can be used to illustrate this. The key to understanding this seems to be the
relationship between government and the organisation that collects and processes the
data, which are mostly separate. At one extreme is the situation in which the
government has direct access to farm-level data. In Northern Ireland (UK) the data
are collected by civil servants who are employees of the devolved government, which
gives it direct access for the purpose of policy-related analysis. In the remainder of the
UK data are collected by universities/colleges under contract to the government; these
pass data to EU-FADN, but also provide it in a raw form to the respective government
departments for use in its own analysis for its own purposes (in England and Wales the
collecting bodies also perform some analysis, but in Scotland this is less evident as the
data are treated as the property of the government department). Nevertheless,
confidentiality of results is respected, and apparently information which would allow
individual farms to be identified is removed when data are made available to
governments.
At the other extreme is where governments do not have direct access to raw data, but
where requests for analysis have to be processed via the independent
institute/organisation responsible for the farm accounts survey55. In Sweden the
national farm accounts survey is part of Official Statistics, and therefore is subject to
robust confidentiality requirements. Where a Ministry inquiry requires the use of raw or
micro-data, a request must be made to the Board of Agriculture’s Statistical Unit and the
data are then produced where this is possible (even if the analysis required is complex).
However, it is not always possible to do this because of disclosure issues. The fact that
the Ministry and researchers cannot use the raw data themselves is considered an
irritation.
Most other case studies appear to fall between these two positions, but generally nearer
the second. In the Netherlands the close relationship between the LEI (the Liaison
Agency and also the data collector and processor) and its funding government
department (Ministry of Economic Affairs) means that the required analysis is developed
in collaboration; it is perhaps significant that there is no Ministry of Agriculture in the
Netherlands.
In Poland requests by the Ministry for analysis that goes beyond standard aggregated
results are made to the Liaison Agency (IAFE-NRI) which processes data, but does not
55 Access to data is also problematic for the OECD which has to use a network of national experts to provide
analysis rather than being able to access data directly via the Commission’s FADN unit.

Study on cost of and good practices for FADN data collection
104
collect it (this is the task of the Agricultural Advisory Centres). Similarly in Lithuania
requests from the Ministry beyond the standard published results which require data
access are responded to by the Institute of Agricultural Economics (LIAE, the Liaison
Agency and responsible for data processing, but which is not the main data collector,
which is the Lithuanian Agricultural Advisory Service). The Ministry explicitly does not
have access to the raw data. In Italy requests by the Ministry for additional information
are handled by INEA56. In Germany the Federal Ministry (BMEL) has access to the raw
data but only occasionally carries out its own analysis; mostly this is done by the Thünen
Institute (the Liaison Agency) to which the data are passed, using the German variables
(which are more extensive than those of EU-FADN). At the State level, the State
ministries of agriculture do not have access to raw data, but analyses of regional
importance is carried out by their agencies that are responsible for the TBN in their Länd;
again these are at arm’s length from the State ministry and also do not themselves
collect data (which is done by private accountancy firms).
There is no evidence that direct access to raw data by government departments
responsible for agriculture (UK devolved administrations, the BMEL in Germany and
Ministries of Agriculture and of Environment in France) leads to a different pattern of use.
However, this carries a potential disadvantage of a lack of trust by participating farmers
in the confidentiality of farm-level data (because it is available to the authorities), though
these countries have for many years managed to maintain systems without, it appears,
compromising their positions.
7.3.3.2. Economic accounts and statistics
According to the online survey, results from the national farm accounts survey are a
significant source for the drawing up of aggregate Economic Accounts for Agriculture
(EAA). Within EU-28 only six countries did not mention this survey either as a source of
data supplied to Eurostat for the EAA or for similar accounts at the national level. There
were more countries in which it was a minor source of EAA data (12 Member States) than
where it was a major source (nine examples). The exceptions were Bulgaria, Croatia,
Romania, Slovakia, Spain and Sweden. Reasons are not apparent, but in the case study
example of Sweden there are clearly alternative sources of information available which
may prove preferable. Ireland claimed that its results contribute to national accounts,
but not to Eurostat’s EAA, which is possible, but unlikely. Contributions to other
economic and/or statistical publications were reported by 22 Member States; of the six
exceptions Ireland, Italy and Sweden were of the EU-15 group and Croatia, Estonia and
Slovakia were EU-N13. There is no relationship with data collection typology.
In the case study countries the discussions did not reveal details of uses within statistics
additional to those given in the online survey. In the Netherlands it emerged that their
use within EAA and the national economic accounting is minor, but they are occasionally
useful in responding to parliamentary questions on issues such as trade balances. In the
UK costs taken from farm accounts feed into the national calculation of aggregate
income. However, in all case study countries the use of results from the farm accounts
survey within aggregate accounting received far less attention than their uses for
purposes to which their microeconomic nature are uniquely suited.
Similarly, the literature review is quite reticent on this area of use. Only in three
countries (Italy, Ireland, and Hungary) could specific mention of the use within national
accounting be found, with the Czech Republic also alluding to their uses within other
statistics.
56 Now merged to form the CREA – Consilio per la recerca in agricoltura e l’analisi dell’economica agrarian.
Study on cost of and good practices for FADN data collection
105
Despite the lack of attention generated by the use of farm accounts statistics in
aggregate accounting, personal experience (reported in Hill, 2012) of working with
Eurostat’s EAA methodology, in particular its inventories of detailed items in the
accounts, suggests that this may be an understatement of their importance. While the
EAA may mainly depend on industry-level information (such as volumes of output and
prices to calculate the value of production), on the costs side there are often gaps in the
detailed information that can only be met by microeconomic sources, including data from
the national farm accounts surveys. This is an example of a use that is important yet
attracts little attention.
7.3.3.3. Difference between regions and countries
Drawing comparisons between regions or between countries was a strongly reported
group of uses, with 23 Member States indicating one or both in our online survey. The
only exceptions were Greece, Malta, Slovenia, Slovakia and Sweden. It would seem
highly likely that international comparisons would draw on EU level FADN results
published by the Commission rather than national farm accounts surveys, though within-
country comparisons could use either depending on the purpose and coverage of
variables required.
7.3.3.4. Costs of production, gross margins and other indicators
Estimating costs of production is clearly another common use. It was cited in the online
survey as a use by government in 20 Member States. However, cost of production
analysis by other organisations was cited in Cyprus and in 15 other countries where it
overlaps with government activity. As these other organisations are likely to belong to
the public sector, again it is probably appropriate to aggregate the responses. Similarly,
the case study for France revealed work on the costs of production in dairy farms,
undertaken by the livestock institute and sponsored by government ministries. The
calculation of Standard Output was reported by 24 Member State governments,
exceptions being Austria, Croatia, Finland and Sweden.
The calculation of gross margins using the survey was only undertaken by 13 countries.
There was some ambiguity concerning whether this referred to gross margins at the farm
level (which standard EU-FADN variables should provide) or gross margins of individual
types of crop and livestock (enterprise gross margins), which requires a deeper level of
information to allow variable inputs to be allocated. This implies a positive response to
the online survey question on the scope of questions being larger than needed for EU-
FADN, though this was not necessarily the only reason for this difference. Among case
study countries the UK has had the additional information to calculate enterprise gross
margins for about a decade (and now net ones too).
Net margins are just one example of the use of other indicators that are of national
interest among case study countries. The Netherlands has a range of additional
indicators that cover sustainability. Italy uses additional variables to produce indicators
of national interest, as does Germany (where there are 7,000 variables in the national
survey, of which 2,500 are subsequently transmitted to EU-FADN). In contrast, in
Bulgaria and France the close correspondence between variables collected and those
required for EU-FADN suggest that additional indicators are not produced.
However, in France the national farm accounts survey has proved very useful in terms
of merging with other databases. The French case study found that the national farm
account survey was being merged with data from the French social fund (Mutualité
Sociale Agricole, MSA) for the purpose of considering reforms on farm taxation. Merging
with tax records (carried out in 1991, 1997, 2003 and 2010) had made it possible to
assess the extent of off-farm revenues. Other examples are the merging with the

Study on cost of and good practices for FADN data collection
106
Census for some studies, and with the plot-level database “Crop practices” (“Pratiques
Culturales”). (References to these studies are given in the French case study.)
7.3.3.5. Extension, advice, feedback and benchmarking
In terms of the government providing extension and advice to farmers, in our online
survey 20 Member States cited this as a use for data from the farm accounts survey. All
Member States collecting data via public advisory services (Type 2: C-AS) use data in
this way. The exceptions comprised Member States collecting data from Liaison Agencies
(Type 1: C-LA): Bulgaria, Cyprus, Greece and Malta and those using accounting firms
(Type 3: C-AF): Denmark, France, Romania and Sweden. Caution has to be exercised
before drawing premature conclusions from the online survey about this sort of use; for
example, in Sweden there is use of the data by farm advisors and the farmers
themselves, but the former may not be part of the government service. This applies in
particular to benchmarking, which is listed among the uses made by other organisations
rather than by the government as part of advice.
The implication is that, when looking at the benefits received by farmers, attention has to
be paid to users other than national or regional government. In 12 Member States non-
governmental organisations use farm accounts data to provide extension services and
advice. For benchmarking, which can be considered a specialist form of advice, 18
Member States provide this by non-government organisations (see Table 7.3 in section
7.3.3.6).
Among case study countries use for advice and for feedback to participating farmers is
universal, though the mechanisms differ.
In the Netherlands LEI uses the data for benchmarking and feedback reports to
farmers which includes a sustainability report.
In Germany extension advisors make use of the data when providing specific
advice. The accountancy offices (the data collectors) also use national farm
accounts survey results for feedback to farmers on performance. Feedback
systems to cooperating farmers vary between Länder. Bavaria has a unique web-
based comparison of farm accounts, and there is a web-based database for
specific groups to which agricultural advisors and teachers/lecturers can have
access. In Sachsen-Anhalt feedback to participating farmers is seen as a
necessary additional incentive to cooperation, as the payment to farmers is not a
sufficient inducement. Also in this Länd the agency responsible for the national
farm accounts survey also includes units that provide extension services.
Italy has a sophisticated tool (cruscotto aziendale) which allows online
consultation by surveyed farmers of the farm balance sheet and of techno-
economic indicators benchmarked against those of groups of comparable farms.
However, in Poland a range of situations is experienced; while some farmers are
keen to understand their relative performance and changes over time, others are
less interested (reflecting the point made earlier that availability does not
necessary imply use and/or impact). Moreover, while a farmer’s own results are
provided and explained by the Agricultural Advisory Centre (ACC) staff (who
collect the data), the dynamic and comparative reports are available only on
request and after choices by the farmer of indicator and comparator group. The
AAC staff can be somewhat reluctant to tell farmers about these possibilities
because their use implies some additional work by the AAC staff in providing
explanations.
In Lithuania results are fed back to participating farmers though the Liaison
Agency, a service seen as being in lieu of payment (as used in some other
Member States) and by the Lithuanian Agricultural Advisory Service (LAAS –

Study on cost of and good practices for FADN data collection
107
which is also the main data collector) which uses both personal information and
benchmarking data to provide business advice.
In Sweden the Board of Agriculture provides feedback reports to the farmers
from which it collects data (100) using a reporting format which requires
substantial transformation of data. Statistics Sweden provides feedback reports
to the farmers from which it and LRF-Konsult collect data; these reports present
the data in the form it is collected and are therefore cheaper to produce.
The literature review provides support for much of these findings, but what it contains
may be out of date. According to the review, Malta and Romania do not provide
feedback to participating farmers, while in Spain there was little feedback to farmers
(such as benchmarking) and little perceived interest among farmers in receiving this sort
of information. One explanation offered for the apparent lack of national use was
unsatisfactory data quality, although data should be considered to be of acceptable
quality if they pass RICA-1 checks. However, quality interpreted in this way does not
address issues relating to sample selection, coverage, etc. which can also be considered
to be quality issues. Portugal provides feedback and benchmarking, Slovenia’s feedback
tends to be provided rather late. Greece also provides feedback, as does Croatia (with
benchmarking on request).
An issue of importance to this report is whether the structure and organisation of the
data supply chain has an impact on this group of particular uses (covering the provision
of extension, advice, feedback and benchmarking). The most likely circumstances to
foster this use might be anticipated to be where the same organisation not only collects
farm accounts data but also provides advice. However, the high (almost universal) use
of this information found in Member States for extension and advice does not suggest
that the other arrangements hamper its use to an extent that can be detected. Again,
feedback to participating farmers is very normal, with benchmarking only a little less so
(though there occasionally impediments are found, such as the requirement for resources
to discuss results with farmers and the need to specially request benchmarking, which
also seems to be linked to resource adequacy).
What may be more significant is the impact on participating farms that a combined
approach to data collection and the provision of advice may give rise to, where there is
opportunity to discuss the potential and realised impacts of actions by the farmer based
on information coming from the farm accounts survey in general and the result of the
individual farm in particular. Advisors may also be more adept at the first round of
informal validation by speedily recognising inappropriate data. The combined approach
may also open up the opportunity to collect data on the impact of changes made after
adopting advice though, as noted above, this advice may be drawn in part from sources
other than the farm accounts survey.
Two case study countries (Lithuania and Poland) combine, in some way, data collection
and the provision of advice (Type 2: data collection via public advisory services). In both
cases this arrangement appears to have been chosen because of the previous existence
of the advisory organisations at the time that collecting data for EU-FADN became a
requirement, and they were perceived as the most appropriate vehicle. The Lithuanian
Agricultural Advisory Service (LAAS) also acts as an accounting firm and prepares
accounts for farmers for taxation purposes for a fee (some 90% of non-corporate farms
have such accounts drawn up). The individual advisors spend approximately some 30%
of their time on farm accounts survey data collection; the remainder is on providing
advice (both to farms in the survey and others). The view in Lithuania is that trust
between farmers and data collectors is very important. This is important both to the
reliability of results and to the ability to recruit existing clients into the survey.
Study on cost of and good practices for FADN data collection
108
In Poland the Agricultural Advisory Centres collect farm accounts survey data. Unlike in
Lithuania there is no taxation reason for keeping accounts, and farmers are provided with
sets of accounts without charge (participating farmers also receive a fee). In contrast
with the norm in Lithuania, where staff combine data collection with extension activities,
the latter are marginal. However, the AACs work with about 60% of all the farmers
receiving subsidies in Poland, so many are known to the organisation and this facilitates
recruitment.
While this close relationship between extension and advice provision and data collection
is conducive to the impact of the results on farm management, we have not been
provided with empirical evidence. Nor have we encountered evidence on the downside of
using data collectors who also provide advice; at least in theory there could be some loss
of efficiency in attempting to fulfil both roles. An obvious concern is that in collecting
data from farmers receiving advice, in part derived from the data provided, the results
may not be reflective of the typical farmer. This may be of particular concern where
farms remain in the farm accounts survey for long periods57.
7.3.3.6. Uses by other organisations (other than advice and benchmarking)
Another general finding is the widespread use of farm accounts survey data by
organisation outside the national and regional governments. In the online survey, almost
all Member States reported them to be using the results. A distinction should be made
between drawing on published results (as noted above, publication at national level is
almost universal, with Malta and Slovenia the only exceptions) and more in-depth
analysis using them or by accessing databases. A minority of Member States (11)
referred to the use of results specifically for independent policy analysis and rather fewer
(7) to the production of forecasts by non-government organisations (Table 7.3). This is
likely to be an underestimate because of the difficult demarcation between these
activities and research. Use for research purposes outside the government is extremely
common; some 22 Member States pointed out that research is carried out by other
institutions which are not part of the data supply chain, and additional literature suggests
that this is an underestimate when external bodies such as research institutes and
universities are included.
57 Only Cyprus now has restrictions on how long a farm can stay in the sample (Denmark and Italy have
aspirations which can be relaxed if no alternative farms are found). Our literature review shows that Finland
even has prizes for farms that stay in its survey for many years, with awards extending to periods of 100 years
(two farms have remained in the sample since its introduction in 1912).

Study on cost of and good practices for FADN data collection
109
Table 7.3: Use by other organisations and farmers involved in the national farm accounts survey system
Research
projects
Source
of data
for
public
database
Cost of
production
analysis
Farmer
extension
and
advice
Independent
policy
analysis
Benchmarking Production
of
forecasts
Lobbying If you
selected
"other",
please
specify
Type 1: Data collection by Liaison Agency
Belgium X
Bulgaria X X X X
Cyprus X X X X
Greece X X
Ireland X X X X X F
Italy X X X X X X
Luxembourg
Malta
Netherlands X X X X X X X F, O Sector
covenants;
strategic
planning,
business
plans,
agricultural
papers/press
Norway X X X X X X X F, O
Portugal X X X X
Type 2: Data collection by public advisory services
Croatia X X X
Czech
Republic
X
Finland (X) X X X X X F, O
Latvia X X
Lithuania X X (X) X (X)
Poland X X X X X X X Typology of
farms
Slovakia X X

Study on cost of and good practices for FADN data collection
110
Research
projects
Source
of data
for
public
database
Cost of
production
analysis
Farmer
extension
and
advice
Independent
policy
analysis
Benchmarking Production
of
forecasts
Lobbying If you
selected
"other",
please
specify
UK X X X X X X X
Type 3: Data collection by private accounting firms
Austria X X X X F, O
Denmark X (X) X F
Estonia X X X X X F, O
France X X (X) F
Germany (X) X X
Hungary X X X
Romania
Slovenia X X X X F
Spain X X X
Sweden X X
Switzerland X X X X X Source: Online survey. Notes: F: Lobbying by farmer organisations; O: Lobbying by other organisations. (X) indicates a response provided during case study or from the literature in the case of the Czech Republic.

Study on cost of and good practices for FADN data collection
111
7.3.3.7. Uses by farmers
Much of the use by farmers of results from national farm accounts surveys for
management purposes and benchmarking will be in association with public extension
services and/or private consultants and is therefore covered by earlier sections58.
However, for completeness some reference must be made to the use of this material by
the farmers themselves, using material produced in completing the FADN Farm Return
(accounts where not already available), material published by the surveys or reported by
newspapers and other media. This present research did not involve primary data
collection from farm businesses or farm operators, so reliance has to be placed on
literature and elements emerging from case studies.
It is not appropriate to include here a major review of the way in which farmers access
information, only a small proportion of which may be in the form of financial results
based on national farm accounts surveys. However, an example based on analysis of
data from supplementary questions added to the Farm Business Survey in England
(which contributes to EU-FADN) may be informative (Defra 2013). Key points of
relevance here (together with our added comments) are:
Nearly 80% of UK (England) farm businesses in the Farm Business Survey (FBS)
undertook one or more of the following activities: business planning,
benchmarking and management accounting (suggesting that the farming
community, or at least that part of it represented by the national farm accounts
survey, contains many willing users of results).
The most common sources of advice on business management and technical
issues were the farming media, advice supplied freely (rather than paid for from
consultants) and through talking to other farmers. (This shows the importance of
an effective publications and communications policy for disseminating results from
farm accounts surveys.)
Smaller farms and older farmers were less likely to access business management
advice. (The links found between different channels of communication and
farmer/farm characteristics also indicate that care has to be taken to employ a
range of methods appropriate to the target group of farmers.)
Nearly half of England’s FBS farm businesses did not wish to know any more
about key business management areas. This response was more likely from older
farmers, small farms and owner-occupied farms. (Other literature suggests that
information is more keenly taken up where it can be demonstrated that this leads
to an improved financial performance.)
There may be benefits that extend beyond better farm performance. Our Germany case
study indicated that, where accounts are provided for farmers who are not legally
required to keep them, these can be used as evidence to obtain bank loans and as a
useful template if a farmer’s tax situation changes and accounts have to be submitted.
Such farmers are also able to use the accounts for management purposes. Finally, it
should be noted that in some Member States farmers participating in national surveys
that contribute to EU-FADN have their accounts completed as a priority; again this will
have an intangible benefit to the farmer.
58 It should be noted that the Commission-funded PRO AKIS project (Prospectives for Agricultural Knowledge
and Innovation Systems) has just been completed (May 2015). This includes national reports on advisory
support in individual Member States.

Study on cost of and good practices for FADN data collection
112
Box 7.1: Case Study of USDA’s ARMS: Uses of data
The Agricultural Resource Management Survey (ARMS) is the primary source of
information to the US Department of Agriculture and the public on production practices,
resource use of America's farm businesses, costs, the economic well-being of America’s
farm households and the farm sector’s financial conditions. The ARMS is the only source
of information available for objective evaluation of many critical issues related to
agriculture and the rural economy and therefore provides a set of unique data in a similar
manner to EU-FADN. Farm organisations, commodity groups, agribusiness, Congress
and the USDA use information from ARMS to evaluate the financial performance of farm
businesses and to make policy decisions affecting agriculture. The Bureau of Economic
Analysis (BEA) uses ARMS data to calculate the farm sector portion of the Gross
Domestic Product (GDP) for the nation. In addition to statistical uses, which implies
public benefit, in general ARMS data are seen to benefit farmers indirectly (that is, to
provide some private benefits) through contact with extension advisors, in reports issued
by USDA-ERS, USDA-NASS, State colleges and universities, etc.. Participating farmers
used to be provided with feedback (some benchmarking data) as a marketing tool.
However, there was little apparent use made of the information and this was
discontinued. In addition, the Interviewers Manual for 2013 contains descriptions of over
40 recent research projects and policy analyses that use ARMS data.
7.4. Valuing the benefits from use of the national accounts survey data and results
No estimations of the value of the benefit of FADN at the national level have been
identified in the literature. This is probably partly a function of the general difficulty in
valuing the utility of public statistics, partly the general difficulty in observing impacts of
change and assigning causality to specific information/actions, and partly the
contributory role that FADN information plays, complemented by other data sources, in
the context of wider support and advice delivery.
Our approach to valuing the benefits at Member State level of the availability and use of
data has been to request information from case study countries on what estimates have
been made of the value of such benefits. No Member State apart from the Netherlands
had made an estimate of the value of its farm accounts survey (see Table 7.4). The
evaluation for the Netherlands (Ministry of Economic Affairs, 2015) lists the multiple uses
of the data (which corresponds closely to those cited in our case study for this Member
State), but does not provide any calculation of benefits; its only observation based on
quantitative information is to compare the costs of the national farm accounts survey
with the value of CAP subsidies paid to agriculture in the Netherlands (about €1 billion),
leading to the comment that “This means that the costs of monitoring to assess the
effectiveness of the policy are less than 0.7% of the support provided. Given the
multitude of objectives of the data collection, the actual percentage to be attributed to
the monitoring of the CAP is even lower” (translated from the Dutch original). It follows
that there is no evidence in official sources of the value in quantitative terms of the
benefits provided by national farm accounts surveys in any of the case study countries
that responded to our questions.
In the absence of work of this nature, a set of contingency questions were posed to
government departments responsible for funding the national farm accounts survey to
establish the level of present benefits in relation to the known costs. First, it was asked
whether, if there was no EU requirement to produce data for FADN, the government
would still operate the national farm accounts survey; various degrees of response were
allowed. Changes in terms of scope in such circumstances were explored. Government
representatives were also asked to rank given types of beneficiary according to those
that received the greatest benefit. Finally, questions were posed on how the perceived
benefits at Member State level from using the national farm accounts survey compared
Study on cost of and good practices for FADN data collection
113
with the costs, expressed as several different degrees of value for money. In the
absence of explicit estimates of the benefits, and of the complex range of uses and
potential benefits to many actors, it was considered that the government was in the best
position to judge the national interest, which would embrace both public benefit and the
perception by the government of the national worth of private benefits bestowed on
particular groups, especially to farmers.
In terms of the ranking of types of beneficiary, national or regional government was
ranked first or second in six out of seven case study Member States (Table 7.5). By
simple summing of scores, governmental use was clearly seen to be the principal
beneficiary. Academic institutions and research bodies came next, followed by farmers
through advisors and extension activities. Farmers benefitting directly and farmers’
lobby groups were seen as benefitting the least.
There was a wide range of responses to the perception of the benefits as compared with
the total cost, from ‘lower’ in Sweden and the UK (England and Scotland) to ‘much
higher’ in Germany and Poland. It should be borne in mind that countries have
different levels of costs, so that the benefits of a given absolute size would appear
relatively smaller in a high cost country such as the UK. When compared to the national
cost (that is, after taking into account the fee paid by the Commission) the UK still
considered the benefits to be lower, but other countries perceived them as higher.
If there were no longer a requirement to provide data to EU-FADN, Bulgaria, the
Netherlands, Sweden and the UK (England and Scotland) were each uncertain
whether the national survey would continue. Factors behind this view differ by country,
but include resource constraints, the availability of alternative data sources and the
perceived value of the EU-FADN variables. In contrast, for Germany, Lithuania and
Poland the answer was definitely yes, though in all three there was a suggestion that
the scope, amount of detail or coverage of farms would be adjusted. Overall, Bulgaria,
Germany, the Netherlands and Poland regarded their farm accounts surveys as
representing good value for money, and the UK (England) reasonable value. The UK
(Scotland) considered the survey to represent reasonable/poor value for money when
considered against the other surveys operated in the sector.
Though far from perfect, and with not all case study countries represented, this approach
does suggest that the perceived value of benefits relate to costs in a way that would
cause Member States to at least consider continuing with them in the absence of a
requirement to supply EU-FADN with data. But the bigger benefits are the public ones to
government rather than the private ones accruing to farmers.
It was pointed out by one respondent that as supplying data to EU-FADN is a
requirement of EU membership, not providing it would incur a fine. The difference
between the size of the fine and the costs of supplying the data could be thought of as
the value of the benefit provided, although this is not of course the line of thinking
behind this question.

Study on cost of and good practices for FADN data collection
114
Table 7.4: Responses to questions on the perceived value of benefits from national farm accounts surveys
Type 1: C-LA Type 2: C-AS Type 3: C-AF
BG IT NL UK
(NI)
LT PL UK DE FR SE
Has any
estimate been
made of the
value of the
benefits of the
national farm
accounts
survey in your
Member State?
No Yes No No No E: No
S: No
No No
Perception of
the value of the
benefits to the
Member State
of the national
farm accounts
survey with
respect to the
TOTAL cost of
operating it.
Higher Higher Higher Approx.
equal
Much
higher
E: Lower
S: Lower
Much
higher
Lower
Perception of
the value of the
benefits to the
Member State
of the national
farm accounts
survey with
respect to only
the NATIONAL
cost of the
survey.
Higher Higher Higher Approx.
equal
Much
higher
E: Lower
S: Lower
Much
higher
Lower
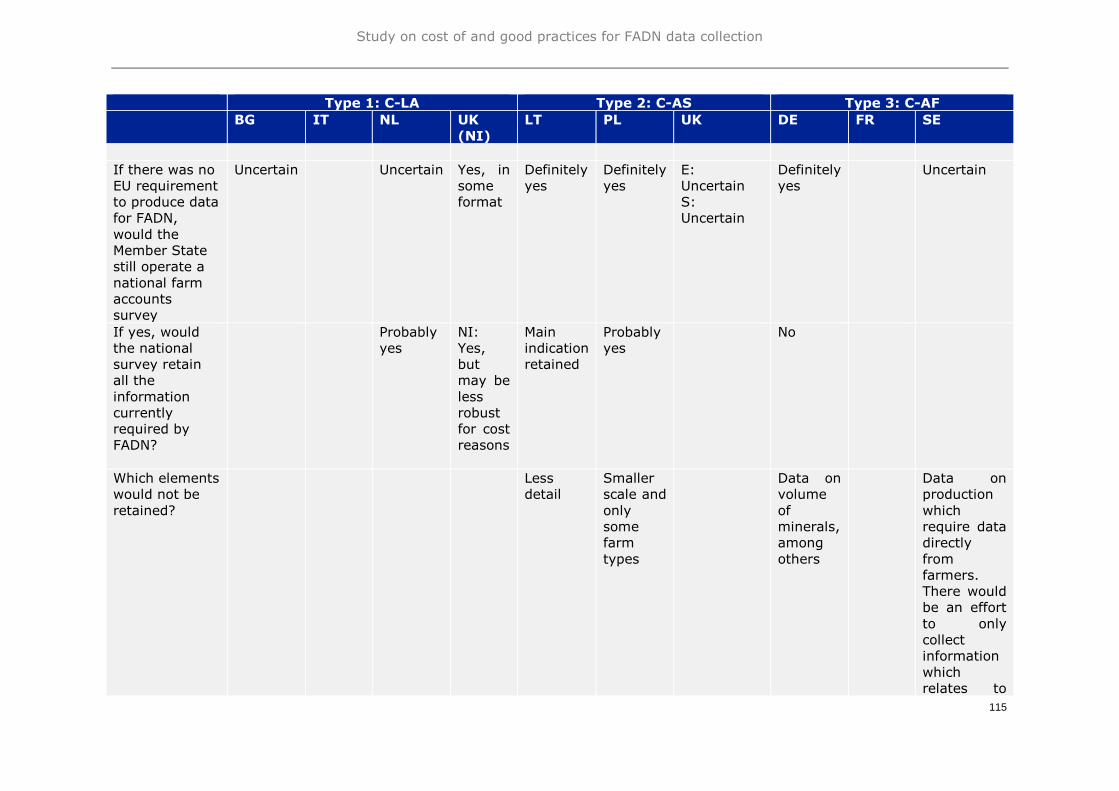
Study on cost of and good practices for FADN data collection
115
Type 1: C-LA Type 2: C-AS Type 3: C-AF
BG IT NL UK
(NI)
LT PL UK DE FR SE
If there was no
EU requirement
to produce data
for FADN,
would the
Member State
still operate a
national farm
accounts
survey
Uncertain Uncertain Yes, in
some
format
Definitely
yes
Definitely
yes
E:
Uncertain
S:
Uncertain
Definitely
yes
Uncertain
If yes, would
the national
survey retain
all the
information
currently
required by
FADN?
Probably
yes
NI:
Yes,
but
may be
less
robust
for cost
reasons
Main
indication
retained
Probably
yes
No
Which elements
would not be
retained?
Less
detail
Smaller
scale and
only
some
farm
types
Data on
volume
of
minerals,
among
others
Data on
production
which
require data
directly
from
farmers.
There would
be an effort
to only
collect
information
which
relates to

Study on cost of and good practices for FADN data collection
116
Type 1: C-LA Type 2: C-AS Type 3: C-AF
BG IT NL UK
(NI)
LT PL UK DE FR SE
EU-
legislation.
Perception of
value for
money of
benefits from
using the
results
Good Good Good Good E:
Reasonable
S:
Reasonable/
poor
Good Not
answered,
but the farm
accounts
survey was
to be
discontinued
in the mid-
1990s prior
to EU
accession. Source: Additional questions put to national Ministries.
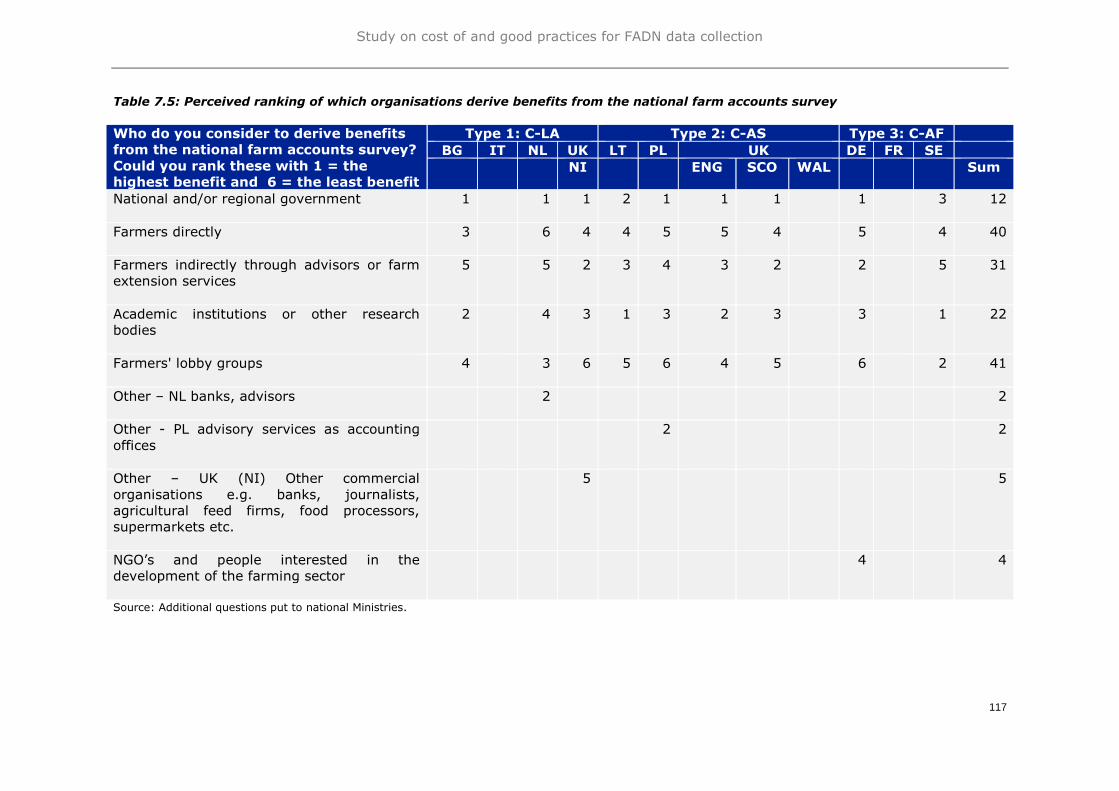
Study on cost of and good practices for FADN data collection
117
Table 7.5: Perceived ranking of which organisations derive benefits from the national farm accounts survey
Who do you consider to derive benefits
from the national farm accounts survey?
Could you rank these with 1 = the
highest benefit and 6 = the least benefit
Type 1: C-LA Type 2: C-AS Type 3: C-AF
BG IT NL UK LT PL UK DE FR SE
NI ENG SCO WAL Sum
National and/or regional government
1 1 1 2 1 1 1 1 3 12
Farmers directly
3 6 4 4 5 5 4 5 4 40
Farmers indirectly through advisors or farm
extension services
5 5 2 3 4 3 2 2 5 31
Academic institutions or other research
bodies
2 4 3 1 3 2 3 3 1 22
Farmers' lobby groups
4 3 6 5 6 4 5 6 2 41
Other – NL banks, advisors
2 2
Other - PL advisory services as accounting
offices
2 2
Other – UK (NI) Other commercial
organisations e.g. banks, journalists,
agricultural feed firms, food processors,
supermarkets etc.
5 5
NGO’s and people interested in the
development of the farming sector
4 4
Source: Additional questions put to national Ministries.

Study on cost of and good practices for FADN data collection
118
8. BEST PRACTICES IN FADN DATA COLLECTION AND USE THAT CAN BE
SHARED AMONG MEMBER STATES
8.1. Key issues
Best practice forms the fourth of the Themes of this study. A key issue is how the term
‘best practice’ is to be interpreted. This is not purely one of semantics, but impacts on
the objective of the analysis and the way in which information is assembled and
interpreted. ‘Best’ practice can imply actions and processes that are at the leading edge,
and among Member States there will be a single country whose methods are superior to
all the others in terms of one or more criteria. Those mentioned by the European
Commission in the tendering process for this study included practices that help improve
sustainability and performance of EU-FADN by, for example, reducing costs, increasing
benefits, improving the ratio between benefits and costs, enhancing data quality and
timeliness, and reducing the burden on farmers (such as by using administrative data
where available and/or adopting the principle of asking an individual holding for a
particular piece of information only once). In contrast, another interpretation is that a
best practice is a method or technique that has consistently shown results superior to
those achieved with other means, and that is used as a benchmark. Perhaps ‘good
practice’ would be a more accurate description as this implies that these actions and
processes that, while not being unique, stand out as providing an advantage. We use
‘best practice’ in the second, broader sense.
We also put the emphasis on best practice that can be adopted by Member States in
which it is currently not employed. Thus a practice that depends on the particular and
unique conditions found in a single Member State would not be covered. For example, in
the Netherlands the centralised system of recording and paying invoices (EDI-CIRCLE),
while not confined to agriculture, seems to be unique to this country59. This system
accumulates much of the data needed to construct accounts, and LEI has access to it for
cooperating farmers, thereby minimising the time required in direct contact between data
collectors and farmers, enhancing data quality and promoting timelines. However, this
not a system that it is within the control of the farm accounting surveys of Member
States to initiate; it is therefore beyond our coverage.
A much more pertinent issue is that of the legal requirement for farmers to keep
accounts. This is strongly linked to the national taxation system, in particular whether
private farmers are taxed on an accounted income basis or on some flat rate that does
not require bookkeeping (legal entities are taxed on an accounting basis). Evidence from
the case studies and the literature review finds that some countries tax entirely on an
accounted income basis and thereby require all individual farmers to keep income and
expenditure accounts, others entirely tax on a flat rate basis so accounts are not
required, while others have mixtures, usually applying a threshold above which account
keeping is mandatory. The importance to this study is that, where accounts are kept,
these are a basis for extracting data for the national farm accounts survey. Data may or
may not be taken from accounts drawn up for taxation purposes; the important point is
that the activity of drawing up accounts involves the systematic assembly of information
which then can be used for national farm surveys among a range of other purposes.
However, the choice of the national taxation system and therefore the requirement to
keep accounts, is beyond our coverage. Consequently, our approach to best practice
must accept the existing pattern, which implies that best practice may have to be
brigaded into circumstances in which accounting is normal and where it is not.
59 A system with some similarities exists in Germany whereby data companies bring together information which
accountants can purchase to facilitate the process of producing accounts. This is not though used universally
and there are multiple companies offering this service.

Study on cost of and good practices for FADN data collection
119
The literature review found little explicit material on best practice at the stage of data
collection or dissemination, though there was consideration of collection when applied to
farm household incomes and wealth (which, of course, EU-FADN does not currently
cover) and of software solutions in individual countries and at EU level. The online
survey was not considered an appropriate vehicle for the identification of best practice
and therefore our methodology comprised two approaches. The first is the response in
case study countries to what the Liaison Agency considers is best practice (or at least
good practice). The second is the evidence gathered on the criteria mentioned above
and assessed by the research team, including our expert advisors, and drawing on our
literature review where appropriate. In reality, the latter is the dominant provider of
useful information.
8.2. Case study responses on best practice
Interviews in case study countries contained, at several points in the discussion (on the
conclusion of sections on organisation, on data collection mechanisms and on use),
questions on aspects of best practice. When it came to best practice on uses, this
engendered such inadequate results that formal analysis is not worthwhile. Even on
matters of organisation and data collection, with which interviewees could be expected to
be more familiar, staff were surprisingly reticent on the issue of best practice. Possibly
this was because they often lacked experience of systems other than their own and
hence could not easily identify what was ‘best’. There seemed to be a tendency for
respondents to cite what they feel may be unique to their situation, an interpretation that
approaches the ‘narrow’ view of what is ‘best’ outlined earlier.
In addition there was a question on which aspects of the present data collection system
would be changed if it were to be designed from first principles; this can also throw light
on what is seen as the preferred ways of doing things.
What emerges is a mix of what is best, ranging across organisation, data collection and
uses; some suggestions are mainly specific to single Member States though others
suggest a more common recognition of general principles. Among the latter several
mention the importance of a stable staff and the need for Continuous Professional
Development of data collection staff; the benefits of involving data collectors with the use
of results for advice and research (Italy and the Netherlands (Type 1: C-LA) and
Poland (Type 2: C-AS)); the combining of extension and data collection also assists with
recruitment, though Poland recognises that there may be drawbacks too60. Good
collaboration between institutions was mentioned by more than one country, as was the
use of administrative data in producing the Farm Returns.
However, some suggestions, while being unique, may have applications elsewhere. For
example, the ‘Data Builder’ tool used in UK (England), whereby access to (anonymised)
data of individual businesses can be given to external users for the purposes of
interrogation (with appropriate safeguards on security and confidentiality) appears to be
possible elsewhere and is superior to access via a single dedicated terminal in an institute
or to feeding requests via administrators. In Sweden the use of three separate channels
for collecting data (though one predominates) offers an opportunity for administrative
monitoring of performance (and cost) of the system and enables farmers to exercise a
choice in the collectors with which they interface. It is suspected that some of the points
made by individual Member States are already in common use, for example the linking of
data over time mentioned by Bulgaria, easy access to (standard) results mentioned by
France, and the flexibility of national farm accounts surveys to reflect evolving policy
issues mentioned in the Netherlands.
60 For example, a decrease in data collection efficiency.
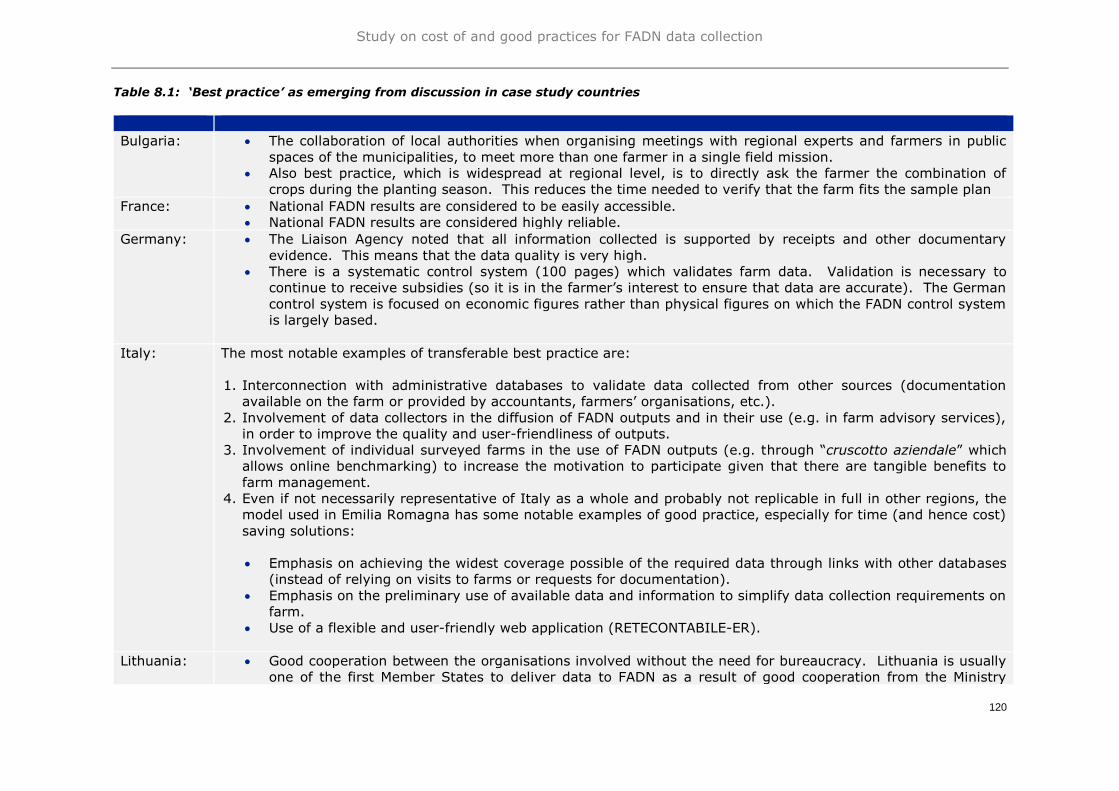
Study on cost of and good practices for FADN data collection
120
Table 8.1: ‘Best practice’ as emerging from discussion in case study countries
Bulgaria: The collaboration of local authorities when organising meetings with regional experts and farmers in public
spaces of the municipalities, to meet more than one farmer in a single field mission.
Also best practice, which is widespread at regional level, is to directly ask the farmer the combination of
crops during the planting season. This reduces the time needed to verify that the farm fits the sample plan
France: National FADN results are considered to be easily accessible.
National FADN results are considered highly reliable.
Germany: The Liaison Agency noted that all information collected is supported by receipts and other documentary
evidence. This means that the data quality is very high.
There is a systematic control system (100 pages) which validates farm data. Validation is necessary to
continue to receive subsidies (so it is in the farmer’s interest to ensure that data are accurate). The German
control system is focused on economic figures rather than physical figures on which the FADN control system
is largely based.
Italy: The most notable examples of transferable best practice are:
1. Interconnection with administrative databases to validate data collected from other sources (documentation
available on the farm or provided by accountants, farmers’ organisations, etc.).
2. Involvement of data collectors in the diffusion of FADN outputs and in their use (e.g. in farm advisory services),
in order to improve the quality and user-friendliness of outputs.
3. Involvement of individual surveyed farms in the use of FADN outputs (e.g. through “cruscotto aziendale” which
allows online benchmarking) to increase the motivation to participate given that there are tangible benefits to
farm management.
4. Even if not necessarily representative of Italy as a whole and probably not replicable in full in other regions, the
model used in Emilia Romagna has some notable examples of good practice, especially for time (and hence cost)
saving solutions:
Emphasis on achieving the widest coverage possible of the required data through links with other databases
(instead of relying on visits to farms or requests for documentation).
Emphasis on the preliminary use of available data and information to simplify data collection requirements on
farm.
Use of a flexible and user-friendly web application (RETECONTABILE-ER).
Lithuania: Good cooperation between the organisations involved without the need for bureaucracy. Lithuania is usually
one of the first Member States to deliver data to FADN as a result of good cooperation from the Ministry

Study on cost of and good practices for FADN data collection
121
downwards. The Ministry is very helpful. For example, census data are provided before they are officially
published. Subsidies are paid on time and the payments agency makes data available to the LIAE very early.
Farmers validating the data and signing to say that they are accurate is a useful means of ensuring that they
pay attention to quality.
Netherlands: The strong link between data collection and research, so that collectors can see how their data are used and
researchers can use the knowledge of data collectors.
The benefits of the data are already highly valued. There is also the principle that what is collected has to
adapt to the emerging needs of policy.
Poland: Combining the knowledge held by the extension officers about individual farms with the collection of data is
considered to be an example of good practice. This allows the collector to identify values which seem
incorrect which reduces the possibility of error and the need for subsequent data validation. This is especially
important because farmers do not generally consider the FADN results useful and this means that they do not
pay as much attention to data quality as they might otherwise do.
The information provided for FADN is a useful input into the advice provided and, where farmers value this
advice, they will understand the importance of providing accurate data. Joining the data collection and
extension functions therefore increases the data quality.
There are advantages and disadvantages of the current mix of extension and FADN data collection. The main
advantage is the agricultural knowledge which helps make data collection easier and more accurate. Where
staff focus only on data collection they become very good at it.
The independence that the system has from taxation, subsidies, etc. ensures that the results accurately
reflect the situation.
The research access provided to individual data is considered to be best practice. Also considered good
practice is the fact that there is no charge for data.
Sweden: The involvement of the Board of Agriculture and Statistics Sweden in data collection (in addition to the main
data collector, LRF-Konsult) is considered good practice in that new methods of data collection, validation
and processing can be developed independently. This arrangement also provides farmers a choice of data
collecting organisation so that they do not have to use LRF-Konsult to compile their accounts.
An advantage of using farm accountants to collect data is that they know the farms and have a good
reputation in the industry. This is considered to result in more straightforward recruitment and sample
retention. On the other hand, there will always be some farmers who do not want to use LRF-Konsult, hence
the alternatives offered by the Board of Agriculture and Statistics Sweden.
Another advantage of the involvement of the Board of Agriculture is its ability to easily cooperate with
colleagues in different departments when additional topics are investigated and other data sources are
required (fertiliser use, for example).

Study on cost of and good practices for FADN data collection
122
Farmers are keen to only provide data once and housing the farm survey within the official statistics allows
this by permitting the use of other registers.
Data delivery over a period of time could be considered best practice as it reduces the potential for
bottlenecks both at LRF-Konsult and Statistics Sweden. Continuous validation is also an example of good
practice for the same reason.
The collecting of data from a limited number of holdings by Statistics Sweden and the Board of Agriculture is
considered best practice in that this provides a check on the data collection process undertaken by LRF-
Konsult and provides objective evidence on the time and resource requirements; downward pressure on the
LRF-Konsult price can therefore be exerted.
UK: The Data Builder tool (England) is an example of best practice in that it allows far greater interrogation of the
data by researchers and other interested parties than is possible using only aggregated data.
Source: Case studies.
Study on cost of and good practices for FADN data collection
123
Responses to questions on how things might be altered if the systems were designed
from first principle gave an indication of what were seen as improvements to present
practice, and by implication what is considered good practice. A common response
across the three data collection typologies related to more or better use of existing
administrative data. This was mentioned in Germany, together with greater use of
electronic data collection and transmission. Lithuania also mentioned the greater use of
administrative data, though there were technical problems in doing so, a point also made
by the UK (England). Interviewees in the Netherlands cited increasing its use still
further. Interviewees in Bulgaria cited the need for software to validate at the stage of
data entry (the German Winplausi system provides an example where this approach is
used). The UK (Northern Ireland) would replace the use of paper forms to collect data
by electronic entry, whereas in England there was an indication that a re-engineered
approach in which farmers (or farm secretaries) entered data directly (rather than ex-
post collection by university researchers) might be worth considering, though it carries
issues (not least that of management). Interviewees in Sweden looked to a way to
improve the validation process to apply EU rules at the national level (and thereby
reduce the number of queries raised by RICA-1).
Overall, there was little surprising in the responses to the specific questions on best
practice and to alternative designs of the present data collection systems.
8.3. Assessment of best practice by the research team and its expert advisors
While direct questions to organisations in Member States on best practice can provide
some insights, the greater contribution to the identification of best practices and their
assessment is likely to come from being able to take an overview in which practices in
individual countries are put into a broader perspective. The various bodies of evidence
(online survey, case studies and the literature review) were reviewed by the immediate
project researchers and by the team of experts that supported them.
However, fundamental to improving performance of national farm accounts surveys is
the periodic carrying out of evaluation with associated monitoring exercises. Few recent
examples of formal monitoring and evaluation systems have been identified in the course
of this study61. It would be best practice for all Member States to introduce
appropriate systems to examine both the costs of data collection and analysis,
the variability within this, and the reasons for this, and the uses to which the
results are put. Collaboration at the EU level to introduce a common and consistent
framework would be appropriate. It should be noted that a similar proposal to
introducing benchmarking between national farm accounts surveys supplying FADN was
raised by Poppe, et al. (1997), but apparently not acted upon.
Earlier in this section (8.1 Key issues) a number of criteria were mentioned by which best
practice could be identified. In the following sections these are considered in turn.
8.3.1. Reducing costs
The levels of cost of national farm accounts survey have been considered extensively in
earlier analysis (Theme 2, Chapter 6). From this it is clear in broad terms that there is a
61 According to the Dutch case study, in the Netherlands the national farm survey is subject to an annual
evaluation and 5-yearly evaluations linked to the renewal of the contract issued to the Liaison Agency by the
Ministry of Economic Affairs. In the UK (England) formerly there was a contract for quality assessment, but this
was discontinued in 2011 due to budgetary pressure. However, some changes were made in line with
recommendations, such as improving feedback. In Italy, a Commission within the Ministry of Agriculture
evaluates INEA’s annual plan for FADN activities, and this constitutes de facto an assessment of the overall
performance of INEA in carrying out FADN activities. Sweden and France mentioned some ad hoc methods of
assessment.
Study on cost of and good practices for FADN data collection
124
link between the costs per completed Farm Return and the collecting system employed.
Lower costs are associated with the provision of data from accountants who draw up
accounts for the private use of farms in meeting national taxation requirements. In
essence, part of the monetary cost of providing survey data is thus borne by the farmers,
the cost to public funds being only the extraction process, the collection of data not
contained in financial accounts (such as some physical variables and further details not
required for taxation purposes) and data validation and processing. Thus a distinction
has to be made between the cost to public budgets and the total resource costs, which
would include both public and private costs. For the purposes of analysis in this section
we will confine our consideration to public costs to national governments, private costs
being placed in the section below on the burden to farmers. Public costs should be first
considered gross and later net of the fee paid by the EU per holding accepted by EU-
FADN (in most Member States this fee is only a contribution to national budgetary costs).
An example of best practice, from this costs standpoint, is to make use of data
already in accounts where these have to be kept for taxation purposes. Where
this is not currently done, although accounts are required (as in the UK), there may be
offsetting factors (such as the desire to construct accounts that are fully reconciled with
bank statements and hence be of high quality, and the wish to avoid bias in accounts to
serve tax requirements rather than for more neutral management ends). However, the
national political system might well wish to examine whether the higher costs resulting
are in the interest of the country as a whole. Certainly a large number of Member States
manage to use extraction from farm accounts, drawn up primarily for tax purposes, as a
basis for supplying EU-FADN without raising issues of quality or bias that lead to their
rejection by RICA-1. Liaison Agencies seem adept at making appropriate adjustments
where taxation and FADN regimes differ (as may happen with provisions for
depreciation/capital consumption).
A similar situation pertains to the use of administrative data (physical or financial). A
majority of Member States (21) in the online survey reported the extraction of data from
such secondary sources. Where countries had made recent changes to their data
collection methods, a common feature was the greater use of administrative data.
However, this change was only seen for Member States collecting data via the Liaison
Agency (Type 1: C-LA: Greece, Ireland, Italy and Luxembourg) and via accounting firms
(Type 3: C-AF: Denmark and Estonia). This was not a recent change made by any
Member States collecting data via public advisory services (Type 2: C-AS); a possible
explanation is that this is not seen as a means of saving cost given that advisors are in
frequent contact with farmers anyway. The issue is not that this form of information is
used at all (data collectors will usually have this information in paper or electronic form
as part of the farm records), but whether these are used direct from the sources (IACS,
etc.). Again, some Member States have direct access for completing part of the national
Farm Return while others use such access to check the data collected from the farmers62.
Undoubtedly there are technical issues in making sure that the production unit in the
administrative source corresponds fully with that in the farm accounts survey (a farm
business may comprise more than one holding), but clearly some countries have
managed to clarify such situations.
Where there are legal restrictions on the use of such administrative data, ways to avoid
such problems may be found across our typology which do not test the legal boundaries.
For example, in Lithuania and the Netherlands the permission of each farmer surveyed
is sought to have access to this information (with high rates of consent). Such consent is
seen as a way of reducing the burden on the farmer’s time and of ensuring accuracy.
This is also the case in Germany where farmers have to give their consent for
accountants to use the data held by aggregation companies; failure to provide this
62 It is not always possible to use this information. For example, in Lithuania the IACS crop classification does
not comply with the EU Eurostat classification.

Study on cost of and good practices for FADN data collection
125
consent implies greater time and cost in compiling accounts, so it is in the farmers’
interest to provide it63. Access by consent is seen as an example of best practice.
Already the large majority of Member States have formal agreement with the farmers
that participate in the national farm accounts survey (16) and its modification to include
consent to access would seem to be appropriate (at least for newly recruited farms) in
those Member States that do not currently do this.
A similar situation obtains over the use of private records. In the Netherlands the
access agreements also cover taxation records and bank statements (it is not required
for agricultural census data). While this may not be universally appropriate (taxation
records may not tie up completely for both technical reasons and because of under-
reporting, and banks may not enjoy complete trust) the same access by consent would
seem to be useful to reduce overall costs.
The issue of reducing costs by not paying farmers a fee for their cooperation is
considered in a following section that looks at the benefits/costs ratio.
8.3.2. Increasing benefits
Previous analysis has shown that governments use the results from their national farm
accounts surveys for a wide range of purposes. In general, the public benefits seem to
exceed the public costs (see section 7.3.3.7 above); the European Commission,
European Parliament, international organisations such as the OECD, non-governmental
organisations and the research community also use the results. Historical development
suggests that, in countries that operated national farm accounts surveys before they
were required to supply data to EU-FADN, the initial purpose was to answer policy
questions. The use of the results to inform farm management decisions (and hence
deliver private benefits to farm operators) and to contribute to education, are uses that
were added, albeit at an early stage.
In the UK this process of adding value by expanding services to the farming industry has
continued with the introduction of benchmarking (now a common feature in a number of
Member States and a tool that is recommended by the World Bank in its initiative
Benchmarking the Business of Agriculture for application in a wide range of
circumstances64). There is a substantial literature on techniques behind benchmarking
for farm businesses. Much of this is reviewed in Franks and Collis (2003), where the
essential features of a system of benchmarking are set out, including the need for
accurate data taken from a reliable sample and presented in a form that facilitates
comparisons with individual farms. Clearly results from EU-FADN fit this model well and
its potential use for benchmarking is obvious. However, while the literature states that
the aim is to increase farm profits and competitiveness (and increasingly to improve
environmental practice and animal welfare), there is very little evidence of actual impact
of benchmarking on the incomes and wealth of farm operators that could be interpreted
as private benefits flowing from this use of EU-FADN data.
Nevertheless, it is clear that a good practice is increasing benefits though making
access to results free in electronic form. Where a fee is currently charged,
consideration should be made to removing this, given that the marginal cost of making
this information available to one more user is zero. Whether special analysis that
requires the use of resources by Liaison Agencies or their agencies should be provided
free is not self-evident; where there is private benefit a charge could be justified,
although in Poland the administrative cost involved in raising a charge was considered
disproportionate to the cost of providing the analysis. However, a preferred solution is
63 A time saving of around 20%-25% can be achieved. Consent rates run at around 90% in Bavaria and
Sachsen-Anhalt. 64 http://www.asfg.org.uk/downloads/bba-overview-flyer.pdf
Study on cost of and good practices for FADN data collection
126
that offered by the UK (England) in which access to the basic raw data is provided while
still maintaining safeguards for confidentiality. This may be facilitated more widely in the
EU by international cooperation in the design and use of appropriate software.
Discussions with senior DG AGRI staff and senior staff within the OECD and the UK’s EU
and International Directorate revealed that a closer alignment between the variables
covered in FADN and EU policy objectives would increase the benefits of operating the
system. It was noted that moves to increase the coverage of environmental variables go
some way towards this and will allow future assessments to be made of greening policies
and the impact of policy measures on Carbon sinks. The central tension is between a
data system focused on production and policies increasingly focused on the environment,
rural development and income. Other cited changes which would increase benefits
included the coverage of household income, the treatment of subsidies within FADN to
allow these to be linked to policies, linking investments in innovation to productivity, and
an increased field of observation to allow a better analysis of structural change.
8.3.3. Improving the benefits/costs ratio
Improvements in the benefits/costs ratio will flow from reductions in costs with benefits
unchanged, or from increases in benefits (such as from greater usage) with costs
unaltered. In addition, improvements can flow from situations in which both benefits and
costs rise but the relationship between them improves. An example is the Netherlands
where the farm accounts survey uses a relatively expensive approach, but covers such a
wide range of variables that it serves monitoring functions across multiple policies and
obviates the need to carry out multiple focused surveys. The Ministry of Economic Affairs
(there is no agricultural ministry) regards this arrangement as very satisfactory, implying
it is getting good value for its expenditure.
It is also possible that the value of both benefits and costs could fall and the ratio could
improve. No concrete examples were encountered in case study countries or in the
literature, though in the UK there is at least the technical possibility of a change in
collection methodology which could lower costs, but which might also imply the loss of
some of the current uses (it should be stressed that no move in this direction is currently
planned in the UK).
The key point is that, while there is an obligation for all Member States to supply the
data corresponding with the current FADN Farm Return, the collection of additional
material for national purposes, or the use of a greater sample than is necessary to
provide the required number of completed Farm Returns (including a safety margin),
must be taken in the light of the national additional costs and additional benefits.
One potential change that should be analysed in terms of its marginal benefit to marginal
costs ratio (and which may have an impact on the ratio of the average benefits to
average cost65) concerns the national convention of paying a fee to participating farmers.
According to the online survey, 12 countries make such payments to family farms,
ranging from (on average) less than €75 in Germany, Latvia, Malta, Poland and Slovenia,
to €159 Sweden and €290 in Slovakia66; in this group only Malta collects data via the
Liaison Agency (Type 1: C-LA). The fact that most countries do not make payments to
their farmers raises the question of whether these are necessary to maintain the flow of
65 Although this is effectively a transfer payment, there is an opportunity cost to this use of scarce resources
and the money may be better spent in other areas. There are also transaction costs incurred in making the
payments. 66 Calculated per FADN case submitted the average payments per case are Austria €120; Cyprus €120, Estonia
€100, Germany €72 (the actual payment per farm is €55 but for a larger national sample), Greece €122, Latvia
€73, Malta €58, Poland €57, Slovakia €290, Slovenia €70, Sweden €159. In Lithuania 50 legal entity farms
within the sample receive €160.

Study on cost of and good practices for FADN data collection
127
data. The rationales originally used to justify payments may no longer be valid to
present circumstances; path dependency and an expectation on the part of the farmer
may be the main explanation for current payments. Consequently it would be best
practice to review these payments, examining the possibility of removing them and the
implications (technical, political and economic) for doing so. There may be a relationship
with data collection methodology in that Liaison Agencies (government ministries or
public institutes) do not, Malta excepted, pay farmers. There may be a perception that
payment is necessary when the data collector does not have an ‘official’ status.
Of the case study countries, fees are paid in Germany (€55 per farm in the national
survey) and Poland (PLN 200 ~ €50). In Lithuania, while no fees are paid to family
farm, company farms are paid the same as the national fee received from the
Commission for the work by their accountants in providing the data required by FADN; in
this case there is a clear service associated with the payment, though whether the fee is
appropriate is not self-evident.
In Poland (where accounts are prepared by a publicly-funded organisation at no private
costs to the farmer) farmers benefit from having their accounts delivered and explained
to them, and it is not clear what the farmer does in exchange for the fee other than
agreeing to take part in the survey and making information available. Furthermore,
there is an identifiable public cost in running the system that makes payments to
individual farmers.
In Germany, where farmers bear some of the costs of supplying data through private
accountancy charges, the government payments can be seen as a partial recompense for
providing the additional data required67 (actual charges by accounting firms are in the
order of €2,000 in Bavaria and range from €500 to €12,000 in Sachsen-Anhalt,
depending on scale, so the fee of €55 farmers receive is relatively minor), though there
is no clear link to the additional effort that may be needed to meet the requirements of
the national farm accounts survey. In addition to feedback on their accounts, our
literature review suggested that participating farmers in Germany also receive priority
treatment by the accountancy firms doing their bookkeeping. In short, there appears to
be little fundamental reason for payments to farmers in these countries; other case study
countries manage to secure data without them and there is no evidence that making
payments has an impact on relative sample turnover rates. However, removing a
payment where one exists currently may result in a short-term impact on sample
retention. It would therefore be best practice to periodically review the
necessity of paying these fees in those Member States that currently make these
payments.
8.3.4. Increasing quality and timeliness of databases
A distinction must be drawn between the quality of the databases, which is within the
coverage of this research, and the quality of individual data, which is linked but is
tangential to the main issue. Best practice in actions that increase the quality of the
database will be reflected in a lower number of Farm Returns rejected when submitted to
the Commission’s RICA-1 and fewer queries raised. Quality in databases of national
accounts surveys that have a broader scope than FADN may have additional dimensions
that are not the prime consideration here. The Commission has indicated that quality at
the national level is one of the factors that determine the amount of time it has to spend
communicating with Member States to obtain an acceptable set of completed Farm
Returns. Among case study countries it is evident that steps are being taken to reduce
the number of Farm Returns rejected by RICA-1 by identifying the chief factors linked to
67 The farmer would have to incur the fee for the production of accounts in any case.

Study on cost of and good practices for FADN data collection
128
rejection, and this learning process has been successful, though rejections are not
eliminated completely68.
Best practice concerns the stages at which validation of data is carried out, and the
means by which this is done. Our online survey showed that most countries have
validation procedures before data are entered into the national farm accounts system.
Subject to the avoidance of unnecessary duplication, what appears to be best practice
is to have validation checks at multiple points along the data supply chain; in
Germany the Federal structure leads to validation procedures that can look rather
excessive, though we would not wish to see these reduced if experience has found them
to be justified.
We have found examples of the following best practice:
At the earliest point of data collection we consider it best practice to have access
to the experience and expertise of staff familiar with farming systems and
accounting to detect and eliminate elementary errors and incompatibilities. This
is most easily achieved by data collectors who are also management advisors,
though where data are collected from accounts the bookkeeping staff should also
be encouraged to develop these observatory skills.
Another example of best practice is to use electronic data entry on the farm that
can flag up potential quality issues so that they can be dealt with immediately at
source. Such systems are probably facilitated by online data entry.
In Germany the existence of Winplausi, a dedicated validation system that is
accessible by a wide range of users at different points in the data supply chain, is
an example of best practice that facilitates data quality (similar systems exist
elsewhere, for example in the UK). Winplausi is regularly updated to reflect
changes in Commission requirements (and those of the national farm accounts
survey – TBN) and users receive training.
Linked to Winplausi, but not dependent on it, is a means of categorising data
quality issues into various degrees of seriousness, ranging from the need to check
with the source certain data (that may well be correct but unexpected or an
outlier) to severe and needing the replacement of the entire Farm Return. We
recognise this as an example of best practice.
A related example of best practice is to have a system which learns from past
experience. For example, where suitable clarifications to queries have been provided,
these should remain on record both in case of query in subsequent years and to improve
validation programmes. Elements of this are evident in Germany and Sweden, but may
be less developed in other countries.
Timeliness of results is a factor that affects the ability of decision-makers (both public
and private) to use them, and surveys of farm accounts typically involve delays. Within
the EU, timeliness was acknowledged as something that has limited the utility of FADN
(see for example European Parliament (2015); Hill, 2012; Hill, Bradley and Williams,
2015); this was confirmed more recently by senior DG AGRI staff outside the FADN unit.
Our online survey found delays between the end of data collection and the time at which
national validated results are released ranging from one month to two years. The
publication of results at EU level cannot proceed in a complete form at a pace faster than
the slowest country.
68 The European Court of Auditors has expressed concern that some practices, such as substitution of rejected
cases, carry implications for the representative nature of the FADN sample (ECA, 2004). It is also of concern
that Member States may be focusing on reducing the number of rejections rather than identifying other issues
with data that may not be identified by the RICA-1 checks. As data quality was not a focus of our research we
did not explore these issues with Member States.

Study on cost of and good practices for FADN data collection
129
Timeliness is affected by factors such as the method used for data collection, national
legislation on the ending of financial years (results from Germany are delayed for this
reason), the need to plan and spread staff workloads of data collecting, processing,
sample recruitment, etc. throughout the year (specifically mentioned in the Netherlands
case study), the degree to which internal reconciliation is required, and the resources
that have to be put into following up queries raised at national and EU levels. Within
these constraints a number of best practices have been encountered:
The elimination of various stages in the data supply chain. The most elementary
is the removal of paper entry of data and its replacement by electronic entry.
This eliminates opportunities for errors in transcription though, of course, there is
still the imperative to enter data correctly. Only six Member States in our online
survey did not report paper recording to subsequent electronic data entry at some
point in their systems (Type 1: C-LA : Greece and Ireland; Type 2: C-AS: Croatia,
Finland and Slovakia; Type 3: C-AF: Denmark), though this may have only
applied to part of the survey (such as farms that do not keep accounts). Online
data entry takes this a stage further. In the online survey 14 Member States
reported off-line data entry and 16 online data entry (five reported both).
Extraction from farm-level software packages was reported by 13 Member States
in the online survey. Among Case Study countries such extraction from farm
accounts software packages (or spreadsheets) was encountered for only a small
minority of family farm holdings, though there are complications arising from the
way farmers use them (for example their bundling together of items that need
separation for FADN purposes, and the accuracy of data entry) which restricts the
potential at present.
Among case study countries Germany provides a financial incentive (higher fee
to accountancy firms) for data provided by a deadline one month earlier than the
main deadline. This is considered best practice to both improve timeliness and
smooth out bottlenecks in data processing and generally applies in Member States
basing their Farm Returns on accounts (although the principle could apply more
widely).
In a related point, timeliness could be improved by treating data collection as a
continuous process. In the Netherlands and Germany centralised systems of
data handling (EDI-CIRCLE and data processing companies respectively) that
supply data to the national farm accounts surveys are not confined to an end-of-
year exercise. The UK has also considered a more continuous approach. The
implication is that results could be produced in a more timely way in some other
Member States.
8.3.5. Reducing the burden on farmers
The burden on farmers can be reduced through the increased use of administrative
databases and/or through the principle of asking a particular holding the same thing only
once.
According to the Dutch Liaison Agency (LEI), the Netherlands has as a national
objective the minimising of the administrative burden on farmers and of collecting data
only once, but using it multiple times. Closely allied with this is the aim of using
available (electronic) data as much as possible, the aim of collecting farm level data on a
wide range of sustainability issues to provide policy- and research-relevant data. As a
consequence of the extensive use (with the permission of the farmer) of administrative,
environmental, taxation, banking, commercial data (via EDI-CIRCLE) and other existing
records, the burden on the time of the farmer in responding to questions is reduced to an
average of less than two hours a year for a coverage of topics in excess of those required
by EU-FADN. We consider it best practice for Member States to actively seek to reduce
the burden on farmers, in particular through the multiple use of data sources.
Study on cost of and good practices for FADN data collection
130
It is clear from the responses to the online survey, our case studies and the contents of
the literature review that other countries are tending to move in the same direction in
their use of administrative data. Previously the point was made that such use is
facilitated by asking the permission of farmers to do this, something that avoids the need
to test the strict legislative position. Where this permissive access can be seen as a way
of reducing the burden on their time, farmers appear generally willing to accede to the
request across the data collection typology; in addition to the Netherlands, high levels
of agreement are seen in Germany (in terms of using data processing companies) and
Lithuania.
Clearly, this way of reducing the burden on farmers requires technical difficulties to be
circumvented. There has to be a reliable way of linking data sources (a unique identifier)
and confidence that the units correspond69. Sorting out such problems should be seen as
an investment by the national administration, as the benefits are likely to flow for a
considerable period of operation.
The principle of asking a particular holding for a piece of information only once,
embedded in the Netherlands and another example of best practice, seems to be less
commonly encountered in other Member States. Within the farm accounts surveys it
obviously makes sense to carry data over for individual holdings from one year to the
next where they remain in the sample and where this is appropriate; the relatively low
turnover of sample in national farm accounts surveys and the generally unrestricted time
that farms can remain in them suggests that this is good practice that national farm
accounts surveys may already employ. Pre-filling parts of the Farm Return is facilitated
when this is in electronic form. However, applying this principle more generally implies
reciprocity among databases. Not only would farm accounts surveys draw from
administrative data sources, but other users would be able to draw on data in farm
accounts surveys. There is what appears to be a direct conflict with the assurance of
confidentiality built into the FADN Regulation. We have not been made aware of
situations where data sharing of this nature has taken place and are not in a position to
speculate on the safeguards that might be needed to enable it to happen.
8.4. The applicability of best practice in other Member States
The applicability of best practices clearly has to reflect what is technically possible.
However, this has also to acknowledge that there may be political, social and economic
impediments that may inhibit their use. The point has already been made that, while
data collection that draws on accounts constructed for purposes of submission to taxation
authorities have cost advantages, where farmers do not currently have to submit
accounts it is unrealistic to envisage a change in national taxation system to improve
best practice in FADN data collection.
However, the greater use of existing administrative data appears to offer some cost-
saving possibilities and enhancements to quality. Coupled with seeking the permission to
use the data, and perhaps other datasets, the applicability of their use would seem
widespread, though there are undoubted technical issues that would need investment to
overcome. Even so, some Member States may find this unattractive. Similarly, making
use of accounts already being drawn up for taxation purposes appears to be a potential
cost saving (to national public expenditure), though again there are technical
impediments to overcome. Phasing out fees currently paid to farmers obviously could
only apply where such fees are paid, and individual Member States may still prefer not to
do so, but they should at least examine the issue.
69 In our online survey 20 Member States indicated that they already have a unique identifier that can, in
theory, be used to link data sets.

Study on cost of and good practices for FADN data collection
131
While the use of farm accounts data and the benefits this can bring is widespread, not all
possibilities are fully exploited, and those Member States with further potential should be
encouraged to realise it. Even among countries with a wealth of experience, there are
ways of making more use of the basic data without compromising confidentiality. The
limiting factor seems to be capacity in the software support available.
Disparities have been encountered in the procedures used to collect and validate data.
There seems little reason beyond constraints of financial resources and adequate skilled
professional input why better IT systems should not be applied. There may, of course,
be real limitations, at least in the short-term, but international collaboration should be
able to loosen the constraints.
A somewhat surprising finding among the case study countries is that they each appear
to operate largely in a national silo. While the senior producers of data in Member States
can often attend meetings of the Pacioli network and the EU FADN Committee, and they
may know about what happens in some other countries, this is a step away from
operational collaboration in ways that reduce costs or increase benefits. In our case
studies we explicitly asked if collaboration currently took place, to universally negative
responses70. This is not to overlook the fact that new Member States have in the past
been mentored by countries more experienced with FADN (for example, in the early
stages of setting up its farm accounts survey Lithuania was advised by Denmark, and the
shape of the data collection system there acknowledges the Danish influence), and the
transformation of data from Luxembourg into the EU-FADN Farm Return was, for a time,
carried out in Germany (see the literature review).
Based on the apparent lack of collaboration, there appears to be an information gap
despite the existence of the Pacioli network and the EU FADN committee. Maybe
cooperation between Member States in the practicalities and costs of data collection and
dissemination requires a forum outside the Pacioli network and the main meetings of the
FADN Committee in Brussels. The use of technical groups or task forces might be used
to allow the exchange of experience and information and the exploration of issues in
which both problems and solutions can be aired in a way that does not commit
administrations.
A further surprise was that the software used for validation is apparently specific and
designed only for the individual farm accounts system. While we are not qualified to
make more than an innocent inquiry, it does seem strange that what appear to be
common problems of data quality that need to be tested (by plausibility checks,
incompatibilities of logic, range outliers, etc.) cannot be tackled by common programmes
that share a great deal of similarity, but which can be tailored for the specific
characteristics of each Member State. Direct cooperation between countries, especially
those with similar structures and collecting mechanisms, would seem to be a way to
reduce costs and enhance effectiveness.
Box 8.1: Case Study of USDA’s ARMS: Best practice
Elements of practice in the ARMS process of data collection that might be considered for
application in EU Member States include:
The use of a phased approach with matched methods of data collection. For
gathering information on production practices and cost data for commodities postal
70 Occasionally we heard about specific advice provided from one Liaison Agency to another such as from the
Netherlands to Lithuania on how to deal with exceptional cases on FADN holdings within the weighting system
such as when disease results in the slaughter of livestock on a large farm. Also the German case study
encountered an exchange of information between Brandenburg and Poland.

Study on cost of and good practices for FADN data collection
132
and telephone collection seem to predominate. In the EU the feasibility of doing this
might be considered.
Farmers have the option of entering their replies to postal questionnaires
electronically (electronic data recording – EDR). This is a facility (used in the EU
outside agriculture) that could form part of cost-reducing best practice in the EU-
FADN.
For visits in person, ARMS routinely records the length of interview. This enables a
farmer burden to be established. This is something that national farm accounts
surveys should consider if not already done.
There are several best practices that affect the quality of the results and their usability:
The uniform size threshold for inclusion allows valid comparisons between US States
and regions across the full range of farm sizes. This is a different approach from that
taken in the EU where the focus is on market-oriented holdings and different
economic size thresholds are applied.
The broader scope of questions (such as covering household income and assets)
coupled with the relatively low threshold for inclusion enables a fuller explanation for
economic behaviour and provides information on the income and wealth position of
farmers and their families to be established and compared with the rest of society in
a robust manner (something that is of relevance to the stated aims of the EU’s
Common Agricultural Policy).
A greater statistical robustness flows from the use of a sample that is random.
The combination of coverage and statistical robustness enables the ARMS results to
be used widely within economic statistics to an extent that EU-FADN results
apparently are not, giving them an added value to their use as a tool within the
design and monitoring of agricultural policy.
The use of external assessors of ARMS methodology underpins the quality of its
results in a way that processes in the EU-FADN do not. Improvements in evaluation
of the national farm accounts surveys in Member States and at the EU level would
represent best practice.

Study on cost of and good practices for FADN data collection
133
9. CONCLUSIONS
9.1. Overarching conclusions
Some Member States initiated their national farm accounts surveys prior to the
establishment of FADN, or before their accession to the EU. FADN requirements are set
out in a Regulation, but this does not require specific organisational structures to be used
and there is considerable variation among countries in the organisation of the FADN data
supply chain as a result. There is little evidence that this has any impact on either the
costs of data collection or the uses to which data are put and therefore the benefits
derived. The relative stability in varied organisational structure reinforces this
conclusion, and only minor restructuring has taken place in a small number of Member
States.
The composition and function of national FADN committees varies, although the core
functions are prescribed by the Regulation. There appears to be no discernible impact on
performance of the data supply chain according to either the committee’s composition or
function.
While organisational structure is not likely to have an impact on sample turnover, data
collection methods which imply a low burden on farmers are likely to reduce turnover and
make recruitment easier and less costly as a result. Recruitment from the existing
clients of data collectors has a higher success rate and is therefore cheaper than from
random lists. There is no evidence that paying participating farmers improves sample
retention.
Data collection methods are not specified in the Regulation and Member States employ a
range of methods, use a range of data sources and record data in various ways. The
methods used have an impact on costs, with data collection by accounting firms from
existing completed accounts cheaper than collection using other methods. A key factor
here is that the cost of completing the accounts is not borne by the FADN system where
farm operators are required to produce these by law for taxation purposes. Although the
basic data collection methods used are stable, there is a degree of evolution, with
Member States increasing the use of secondary data and electronic data recording over
time. Data validation takes place at a number of stages in the data supply chain and
some Member States have more sophisticated, IT based approaches than others. While
validation at multiple points will increase costs, this approach may also improve data
quality and reduce the number of queries raised by the Commission’s RICA-1 system.
Because of the different approaches to data collection, the time required to complete
each Farm Return varies considerably between Member States. However, a common
factor is that the data collection activity is the most time consuming element within the
data supply chain. Even after adjustment for different wage levels across Member States
and adjustment where the national sample exceeds the requirements of EU-FADN, there
is still considerable variation in cost. As noted above, a key explanatory factor is the
type of data collection system employed, with the use of accounting firms the most cost
effective method and data collection by public advisory bodies the most expensive
method, although there are additional benefits from this latter approach in terms of the
provision of advice to farmers.
The costs of change or adaptation will be specific to each Member State. However, the
cost of collecting additional information/increasing the sample size would be marginal to
the basic data collection infrastructure in place and would be further reduced where
Member States already collect this additional information for national purposes.
Similarly, savings from a reduction in scope/sample size would also be marginal.

Study on cost of and good practices for FADN data collection
134
The main conclusion concerning the benefits obtained from the FADN system is that it is
hard to quantify these in monetary terms and only one (cursory) attempt had been made
to do this previously by a Member State. That said, there are both private benefits to
participating farmers and public benefits linked to the use of data by governments.
Benefits are contingent upon access to the data and this is generally good in relation to
aggregated results; there are additional benefits associated with access by analysts and
researchers to individual farm data and, though this faces issues of disclosure, there are
examples of such databases at the national level, including ones in the Netherlands and
the UK (England), which allow users to interrogate the raw data, subject to
confidentiality being maintained.
The results from national farm surveys are widely used by the EU, international
organisations and national governments and by other organisations. The high use of the
data suggests that neither the organisational structure or the data collection
methodology impacts on data utility.
Member State governments value the benefits of the FADN system and would certainly
consider continuing data collection in the absence of the EU requirement to do so.
A number of examples of best practice were identified. Fundamental is the principle of
evaluation of performance which appears to be rare in relation to farm accounts surveys.
In terms of the collection of data, best practice would be to make use of existing
information, whether in accounts or administrative databases, shorten and simplify the
data supply chain and to use validation systems that at multiple points along the supply
chain to identify issues in the data as close to source as possible. In terms of data use,
improving access by removing fees where these apply would increase the potential
benefit.
Our conclusions are presented in greater detail and by study Theme in the following sub-
sections.
9.2. Organisation of FADN and methods of collecting the data
Legal framework
The EU-FADN legislation is in the form of a Regulation and therefore applies within each
Member State without the need for national legislation. However, there is additional
national legislation in 16 Member States. As a generality, national legislation is more
common in Member States which joined the EU in 2004 or subsequently. National
legislation in these cases typically established the Liaison Agency and the National FADN
Committee and set up the mandate for a national farm accounts survey in anticipation of
accession. Only five EU-15 Member States have additional national legislation and in
some cases this merely references the EU-FADN Regulations. Our conclusion is that
the prime legal framework is provided by the Regulation (the relevant
legislation for the period covered being Council Regulation (EC) No 1217/2009)
and the presence of national legislation, where it exists, appears largely to
allocate tasks to institutions.
The use of existing administrative records can offer a potential way of reducing costs and
of minimising the burden on farmers. Six Member States reported legal constraints on
the use of administrative records in compiling the FADN Farm Return, although in
practice these do not always constitute practical constraints, with administrative records
used in Germany to check data from farms and administrative data used in the
Netherlands as a data source with the permission of the farmer. The use of taxation
records as a data source is more constrained by legislation (in nine Member States and
Northern Ireland in the UK) or convention, although of course farmers can voluntarily
Study on cost of and good practices for FADN data collection
135
make available to data collectors the same information they have submitted to the tax
authorities. Taxation records themselves are of limited value in compiling the FADN
Farm Return because the information is not usually sufficiently detailed and it may be
costly (especially in terms of time) to link/allocate a household record to a farm
business. It has also been suggested by some observers that taxation records may have
an inbuilt bias towards minimising income subject to taxation, although the implication is
that this is not considered to be a problem by Member States where taxation accounts
are used as a basis for their national farm accounts survey. Our conclusion is that
legal constraints to the use of administrative records do not apply in most
Member States. Even where such restraints are found, access on a permissive
basis often offers a way by which this information can be used.
Legal constraints can also extend to uses of data. The main such constraint is that,
according to the Regulation Preamble and Article 16, farmers must be given the
assurance that data collected for EU-FADN ‘will not be used for taxation purposes or for
purposes other than those provided for in this Regulation or divulged by persons
participating or having participated in the Community farm accountancy data network’.
To maintain confidentiality, access to individual data is not permitted, a restriction that
also applies to aggregated results where the number of farms is small enough to risk
disclosure. In practice, there are some circumstances where anonymised individual data
can be used for research purposes (see Theme 3). Our conclusion is that these legal
restrictions on use do not constrain access to results at the national level in a
way that impacts significantly on the public benefits obtainable (see section 9.4
below).
Establishment of national farm accounts surveys and current rationale
Our finding is that for many Member States the establishment of national farm accounts
surveys predated their requirement to supply data to EU-FADN and was to serve national
purposes. Our conclusion is that, while EU Membership carries the obligation on
all Member States to supply data to EU-FADN, national purposes are often still
relevant and form part of the rationale for national farm accounts survey.
The oldest established national farm accounts survey this study encountered in current
EU Member States was that of Finland (set up in 1912). Farm accounts surveys had
been established in nine Member States prior to the introduction of EU-FADN. In seven
countries national farm accounts surveys were set up immediately prior to accession to
the EU while in another seven Member States farm accounts surveys were established
rather earlier; in the case of Poland a survey was introduced in the 1920s, remodelled in
1956 and later brought in line with EU-FADN requirements prior to accession.
Clearly compliance with the obligations of EU Membership is a key part of the rationale
for conducting national farm accounts surveys. However, in our online survey only eight
Member States did not also cite national purposes as a current rationale.
Status of the Liaison Agencies
Liaison Agencies fall into two main groups: Ministries (12 Member States) and public
research institutions (14 Member States). In Denmark and Sweden the Liaison Agencies
are the government statistical offices. Ministries are more commonly designated as
Liaison Agencies in the EU-15 (53% Ministries c.f. 33% public research institutes) while
the selection of a public research institute is more common in newer Member States
(69% c.f. 31% Ministries).
Our conclusion is that the status of the Liaison Agency is primarily a matter of
administrative convenience and there seems to be no obvious association

Study on cost of and good practices for FADN data collection
136
between this and the functioning of the national farm accounts survey,
including the costs of running it.
Organisation of the FADN supply chain
We find that there is considerable variety in terms of the division of responsibilities along
the FADN supply chain, though with the exception of Finland, funding is always the
responsibility of a government ministry. Our conclusion is that this variety of
organisational structure is explained primarily by history and practical
considerations (21 and 24 Member States respectively). Only in nine Member
States is the organisational structure influenced by budgetary considerations. The
Netherlands and the UK are the only Member States where independence and objectivity
were cited as rationales for the organisational structure (although there is no suggestion
that independence and objectivity are compromised elsewhere).
Organisational structure is stable with significant organisational change in the last
ten years/since accession taking place in only four Member States and only related to
operation/performance in two of them.
National FADN Committees
We observe that the National FADN Committees typically have representation from along
the FADN supply chain and generally Government statistical bodies and farmers’
organisations are also represented. However, the former are not represented in five
Member States and the latter are absent in 11 Member States. We have not been made
aware of problems arising from these gaps in formal representation and expect that
informal consultation takes place.
Many National FADN Committees have additional functions beyond those set out in the
EU-FADN legislation, though these vary by Member State. Two main groups can be
distinguished: those Member States where the Committee plays a major role with
multiple additional functions beyond its legal requirements (seven Member States); and
those where the Committee’s function closely aligns with the minimum legal
requirements (11 Member States). The remaining Member States fall somewhere
between these extremes. Our conclusion is that there is no discernible impact on
performance within these groups.
Regional Committees are only found in Belgium, Germany and Spain.
The sample of the national farm accounts surveys
Several aspects of the sample are reported upon by this study as relating to costs and
best practice.
Representativeness
As currently constituted, agricultural production and area are well represented by the EU-
FADN sample, but this applies far less to the proportion of holdings (and by implication
holders) within the FADN field of observation; several Member States use lower
thresholds for national purposes to increase coverage. In 26 Member States the FADN
field of observation exceeds 90% of Standard Output; in 13 Member States the field of
observation exceeds 90% of Utilised Agricultural Area and in 16 Member States the field
of observation exceeds 75% of Annual Work Units. However, there is a substantial
difference between Member States in terms of the coverage of numbers of holdings in
the Farm Structural Survey (FSS). Less than 60% of holdings in the FSS are covered by
the FADN field of observation in 16 Member States; of these, 12 joined the EU in 2004 or
Study on cost of and good practices for FADN data collection
137
subsequently. Given this divergence, FADN is probably rather better suited for policy
analyses relating to the economics of agricultural production than it is to the more social
aspects of the wellbeing of the wider agricultural population – or at least of those who
occupy the land and derive some part of their livelihood from it. Our conclusion is that
any change in the current EU-FADN sample orientation towards a greater
coverage of holdings (and holders) (for example, for the purposes of the
appraisal of rural development policy) would carry cost implications, but may
also bring additional benefits. We recommend that should any change be made,
the relationship between these costs and benefits should be carefully
considered. These have not been explored in detail, but it is to be noted that there is
evidence that cost per completed Farm Return tends to be lower among smaller farms,
and that the marginal cost of enlarging the sample can be expected to be lower than
average costs.
Sample turnover
Unlike the situation in the USA, where the ARMS sample is, in principle, selected anew
each year, universal practice among EU Member States is to retain the large majority of
the samples in their national farm accounts surveys (and hence among the farms whose
data are sent to EU-FADN) from year to year. Sample turnover is typically 10% or less
and often arises primarily from structural change. While a small number of Member
States have in the past operated a maximum retention period, only Cyprus appears
currently to formally restrict farmer participation over time, though this is considered to
be good statistical practice in Italy. We conclude that there is an implication for the
costs of data collection if turnover were to be increased in that costs would rise.
It is recognised by Member States that replacing participating farmers increases
costs (both of recruitment and through loss of familiarity with the farm and diminishes
benefits (long-term analyses cannot be performed with high turnover rates).
Sample recruitment
Though only a minority of new farms are recruited each year to meet the EU-FADN
obligations, there is substantial variation in the methods used by Member States to add
fresh farms to their national farm accounts survey. For family farms the two main
approaches are: (i) selection at random from a list of farms derived from the Farm
Structure Survey; and, (ii) selection from existing clients of data collectors. The first
approach offers potential statistical superiority, but a lower recruitment rate which may
itself suggest that the sample is not fully representative. The second approach may
introduce selection bias (by focusing on farmers receiving advice), but by building on
existing relationships offers a higher success rate and therefore cheaper recruitment
(which in some countries may be virtually zero). Our conclusion is that the approach
used to recruit farms will carry cost implications, and that there may be a trade-
off with statistical quality, though this is by no means certain.
Farmer participation incentives
Farmers receive something in exchange for participation in their national farm accounts
survey in all Member States with the exception of Denmark, France and Romania.
Farmers receive financial payments (at various rates) in 11 Member States. Payment in
kind, in the form of a set of completed accounts, is provided in 14 Member States. There
is minimal overlap between these groups suggesting that Member States take an
“either/or” approach to compensation. Participating farmers are provided with
benchmarking data in 21 Member States and those in Member States where data are
collected by advisory/extension agents also benefit from specific advice based on their
documented performance (see also section 9.4). In conclusion, participating
farmers receive different incentives, but it is not evident to what extent these

Study on cost of and good practices for FADN data collection
138
are actually required to induce cooperation or to improve sample retention. However, withdrawal of established incentives could be expected to impact on
participation.
Data collection methods and sources used
A main conclusion is that data collection is a complex process with most
Member States (23) indicating more than one ‘main’ method. This reflects the
heterogeneity of the information needed to complete the national questionnaire, the
relationship between farms and their national taxation systems, the diversity of legal
forms that farm businesses can take, and the available sources of data. Even within a
single Member State there may be different methods for small farms who are not obliged
(by national tax legislation) to keep accounts, for larger ones who keep accounts, for
large farms arranged as companies whose staff accountants supply data directly, for
types of information that are not routinely part of accounts drawn up for taxation
purposes (such as some physical information), for existing data that may be extracted
from administrative sources, and so on.
That said, collection from farmers/farm secretaries is considered to be a main data
collection method in all Member States except for Denmark, France and Sweden
(although even where data are taken from accounts, some data need to be derived from
the farmer). Extraction of data by private accounting firms from completed accounts is
the main data collection method in ten Member States (in France and Germany accounts
are drawn up for participating farmers who are not obliged by law to produce accounts).
Data extracted from secondary sources such as registers and administration systems is a
main data collection methodology in 19 Member States.
A related conclusion is that data collection methods used are fairly stable. There
has, however, been a degree of evolution with nine Member States making changes in
the last ten years and a further two making changes from 2015. Generally changes
involved the increased use of administrative data, data from farm-level accountancy
packages and data from banks. Changes were made to either improve the quality of
data or to adopt what Member States perceive of as best practice. A desire to reduce the
burden on farmers was also cited as a rationale for change.
Data recording methods
We conclude that Member States use a range of data recording methods and the
balance between them will have cost implications; many Member States use
more than one method of recording data from the farm. However, the most widely
used method remains paper recording for subsequent electronic entry into national farm
accounts survey databases (22 Member States). Online entry is used in 16 Member
States and offline entry in 14 Member States. Some 13 member States extract data
from farm accounting software packages, though there is evidence that this is does not
necessarily carry advantages because of the way in which these are compiled by farmers.
It is worth noting that in the USA, the ARMS data collection phase most similar to EU-
FADN has until recently depended on paper entry at the farm level, but this is changing
to an online system.
Data validation
Our conclusion is that data are generally validated at national level before entry
to RICA-1, the collection and verification system for the Commission’s EU-FADN
database, and that, for the majority of Member States, this takes place at
multiple points in the data supply chain. A number of techniques are used, ranging
from informal examination to deep scrutiny. Validation is undertaken by people and IT
Study on cost of and good practices for FADN data collection
139
systems. There are three stages when data can be validated before uploading to the
Commission’s RICA-1 (which then generates additional queries). Nine Member States
employ validation when data are (i) collected; (ii) entered into regional databases; and,
(iii) entered into the national farm accounts system. At the other end of the spectrum,
six Member States validate data only on entry into the national system. Information on
the time required within the DG AGRI FADN unit to raise and deal with queries was not
available, but a logical conclusion is that there is a relationship between the number and
quality of validation checks at the national level and the quality of the data delivered to
EU-FADN and hence the number of queries raised by RICA-1.
Typology of national farm accounts surveys
Although it is possible to distinguish groups of Member States with respect to various
metrics, there is little consistency in these groups when different categorisations are
used. The most relevant typology in the context of this study is by data collection
methodology. This reflects organisational structure and is likely to be a key determinant
of cost. Although this division is not always neat, our conclusion is that Member
States can broadly be divided into three types: those where the Liaison Agency
collects data (Type 1: C-LA); those where data collection is carried out by public
advisory services (Type 2: C-AS); and, those which collect data through a
network of accounting firms (Type 3: C-AF).
9.3. The costs of collecting FADN data in Member States
A comparison of resources and costs required to collect data for FADN at the Member
State level needs to bear in mind the different sample sizes and the fact that some
Member States have an additional national sample.
Resource requirements
Resource requirements (labour usage) per completed Farm Return were calculated for
Liaison Agencies and data collecting organisations (where different) for all Member States
for which sufficient data were available (21), covering data collection, data processing
and organisation (including validation). The conclusion is that the number of hours
required by Liaison Agencies and data collectors per completed Farm Return
varied considerably between Member States; for example, they ranged from five in
Germany (adjusted for additional national sample), eight in Sweden and ten in France to
54 in Lithuania (adjusted for the additional national sample), 59 in Poland and 75 in
Belgium.
The data collection process is the most time-intensive activity in the FADN supply chain
accounting for 91% of total time for the EU as a whole. Our conclusion is that the
share taken by this activity tended to be higher where the sample size was
larger (because fixed costs were spread over a larger number of holdings)
and/or where the data collection methodology was more labour intensive.
A more exhaustive coverage of the complete data supply chain, including additional
elements not covered in the above analysis (such as time contributed by the farmer),
was possible for case study countries. All actors and activities were included in these
calculations from the design of the selection plan through to submission of completed
Farm Returns to RICA-1. This again confirmed the wide diversity of labour requirements.
Total time required per completed FADN Farm Return ranged from eight hours in
Germany to 63 in Poland.

Study on cost of and good practices for FADN data collection
140
Monetary costs
A similar conclusion of diversity can be drawn from the analysis of monetary
costs. The total cost for the EU-28, averaged for the 2012-14 period, was just over €58
million. This amounts to a (weighted) average cost at the EU-28 level of €678 per
completed Farm Return. In line with the different time requirements, the monetary cost
of carrying out national farm accounts surveys per Farm Return varied considerably
between Member States. The extremes are illustrated by findings that a completed
FADN Farm Return cost an average (2012-14) of €107 in Bulgaria and €156 in Romania,
but €2,905 in Belgium.
Factors explaining differences in cost
We conclude from our analysis that a number of factors can be identified that
explain, at least in part, the differences observed in monetary costs. Some of
these explanatory factors relate to the structure and nature of the national farm
accounts survey, for example relative scale and scope and different resource
requirements resulting from different data collection methods. Others relate to
external factors such as different wage levels between Member States and different
average farm sizes (although this is partly influenced by the EU-FADN field of
observation).
While it is possible to make adjustments where the national farm accounts survey
exceeds the requirements of FADN in terms of sample size, it is much harder to make
meaningful adjustments with any accuracy where the scope and/or depth of data
collection exceeds FADN requirements; in most cases Liaison Agencies considered
national and FADN data collection requirements to be inseparable, although estimations
of possible savings were attempted by the Liaison Agencies in in Italy and the UK.
As part of our analysis to explore what lay behind different nominal costs per Farm
Return, wage levels were adjusted using an index so that resource costs in high labour
cost countries could be reduced and those in lower labour cost countries increased. The
high cost per completed Farm Return in some Member States, for example, Belgium, is
explained by a combination of the data collection methodology and relatively high labour
rates. In contrast, other Member States with relatively high labour costs, such as
Denmark and Sweden, do not have high costs per completed Farm Return because they
employ more labour-efficient data collection methods.
The cost of completing accounts increases with farm size and therefore the cost of data
collection in Member States where the same data collection methodology is used tends to
be higher in those with larger average farm sizes within the FADN field of observation.
However, unit costs are not influenced by farm size where data are extracted from
existing accounts.
The choice of data collection methodology can therefore offset, at least to some extent,
higher costs arising from greater wage levels and from increased farm scale. We
conclude that the most efficient form of data collection in terms of public cost is
from existing accounts, which have been produced at private cost, (Type 3: C-
AF) and this approach is therefore most suited to Member States with a large
sample, large average farm size or high labour costs or any combination of
these. Of course, not all Member States require the production of accounts for tax
reasons, or at least not for all farms, and so cannot produce national farm accounts
survey data on this basis.
Study on cost of and good practices for FADN data collection
141
Costs of change or adaptation
National farm accounts surveys will be required to adjust the scope or scale periodically
to meet the changing needs of the policymakers who form their main group of clients
(see below). While we conclude that the costs of adaptation will be specific to
each Member State, some general principles are evident. The cost of changing
the variables collected under national farm accounts surveys will be related to
the extent to which Member States are already collecting this information for
national purposes. Some 16 Member States already collect more information than is
required under EU-FADN, although the exact nature of the additional material is not
known and will not be consistent between Member States. However, eight Member
States already collect data on household income as part of the national farm accounts
survey, two investigate this issue periodically and through links with external data
sources and one Member State used to collect this information, so could presumably do
so again. Although extending the collection of any type of data to the Member
States that do not currently collect it would incur costs, these would be
marginal to the basic data collection infrastructure already in place. There may
also be transaction costs from changing contracts with data supply organisations. In
the other direction, savings from reducing the scope of EU-FADN coverage would be
marginal, again as a result of the existing data collection infrastructure. In both cases
changes would have impacts on benefits which would need to be taken into account.
Adjustments to sample size involve similar considerations. Any increase, for example to
increase coverage of farmers or holdings, would incur additional costs, but these would
be marginal rather than average as the existing fixed costs would be spread over a
greater number of Farm Returns. Conversely, a reduction in sample size, while saving
some costs, would not lower the total by the average cost, but rather by the marginal
cost as fixed costs would be spread over fewer Farm Returns.
9.4. The benefits obtained from FADN data to Member States
A main conclusion concerning the benefits obtained from farm accounts survey
data is that these are hard to quantify in monetary terms that might be compared
with the costs of carrying out the surveys. The benefits to Member States from
information coming from EU-FADN and national farm accounts surveys is dependent on
the impact it makes on decisions by users. While a first key step to detecting the
presence of benefits is the identification of users and their uses of the output of the farm
accounts data system, and this study has gathered much information of this sort, the
subsequent stage of attributing monetary value to the impact of this information is much
more problematic.
The benefits obtained from making use of farm accounts survey information take two
main economic forms. First, there are the private benefits, of which the main example
will be those accruing to farm businesses in the form of increased competitiveness, farm
incomes, more stable incomes, greater business resilience and enhanced viability and so
on. These are, in principle, measurable, though there are substantial practical problems
in doing so. Second there are the public benefits linked to the use of the results to assist
in decisions by government on issues of policy; the need for information coming from
national farm accounts surveys was a prime reason why accounts surveys that pre-dated
the requirement to supply data to EU-FADN were originally set up, and for most Member
States this still forms part of the reason for maintaining them (see above). Better policy
decisions should in turn lead to better and more appropriate outcomes. The rationale for
spending public money on farm accounts surveys will be similar to those for maintaining
public statistics of any type. Similarly, the value to research of farm accounts results is
difficult to determine.

Study on cost of and good practices for FADN data collection
142
Access to results and data
The use of results in Member States is dependent on their being made accessible. Our
conclusion is that, with a few exceptions, availability of the results of national
farm accounts survey results is good, although access to farm-level raw data for
research could be improved. Almost all Member States publish results from their
national farm accounts surveys, and these national results will reflect the broader scope
and larger sample where these are employed. Only Malta and Slovenia appear not to so.
Of the other 26 Member States, all provide results in an online electronic form which
implies ready access for users. There appears to be a preference for electronic
publication, with 15 countries indicating in their replies to the online survey that they no
longer produce standard results in hard copy; this does not appear to present a
significant impediment to users. Public databases are available in 15 countries; this
should greatly facilitate access, though quite what this gives access to varies. Of course,
the EU-FADN publications and its associated public database contain contributions from
these countries, along with equivalent results from all other Member States.
In contrast to the availability of standard results, access to farm-level data, a feature
that obviously adds greatly to its value as a research tool, is universally restricted,
respecting the general principle of maintaining confidentiality. However, often there are
circumstances in which this may be relaxed while at the same time safeguarding
precautions are applied, or technical solutions devised that makes access to anonymous
data accessible and costless (for example, remote access to the Netherlands national
farm accounts survey database and the Data Builder tool in England within the UK).
Users and uses
A clear conclusion from the evidence gathered from our three main sources is that, in
addition to its role at EU level in the form of FADN, the data collected by national
farm accounts surveys are widely used by the national (and where appropriate
regional) governments of Member States. The data are almost universally used in
policy formulation and evaluation (agricultural policy, rural development policy,
environmental policy, or other); 26 Member States indicated these uses. The only
examples of non-use in the online survey were Croatia, where the explanation is
probably that of lack of experience so far in having this sort of information, and Greece
for policy formulation and Romania for policy evaluation. The national farm accounts
survey results are also a common source (22 countries) of data supplied to Eurostat for
the Economic Accounts for Agriculture or for similar accounts at national level.
Estimating costs of production is clearly another common use; this was cited in the online
survey as a use by government in 20 Member States.
Another conclusion is that results are widely used as the basis of providing
extension and advice to farmers, though this has to take into account both services
provided by government and by other organisations. In terms of the government, in our
online survey 20 Member States cited this as a use for data from the farm accounts
survey (the exceptions were Bulgaria, Cyprus, Denmark, France, Greece, Malta, Romania
and Sweden). Farm advisors who are not part of the government service may also draw
upon the results, as may the farmers themselves. This applies in particular to
benchmarking, which in our survey is listed more frequently among the uses made by
other organisations than it is by the government.
An issue of importance to this report is whether the structure and organisation of the
data supply chain has an impact on this group of particular uses that lead to private
benefit to farmers (covering the provision of extension, advice, feedback and
benchmarking). The most likely circumstances to foster this use might be anticipated to
be where the same organisation not only collects farm accounts data but also provides
Study on cost of and good practices for FADN data collection
143
advice. However, our conclusion is that the high (almost universal) use of this
information found in Member States for extension and advice does not suggest
that the other arrangements for data collection hamper its use to an extent that
can be detected. What may be more significant is the impact on participating farms
that a combined approach to data collection and the provision of advice may give rise to,
where there is opportunity to discuss the potential and realised impacts of actions by the
farmer based on information coming from the farm accounts survey in general and the
result of the individual farm in particular. Advisors may also be more adept at the first
round of informal validation by speedily recognising inappropriate data.
Valuing the benefits
Mention has already been made of the difficulty of attributing a money value to public
statistics, such as results from national farm accounts surveys. No estimations of the
value of the benefit of FADN at the national level have been identified in the literature
review and the only example emerging from the case studies that ventured into this area
of study (the Netherlands) merely compared the cost of its survey with the value of CAP
subsidies, leading to the comment that the costs of monitoring represented less than
0.7% of the support provided. It follows that there is no evidence in official sources of
the value in quantitative terms of the benefits provided by national farm accounts
surveys in any of the case study countries.
In the absence of work of this nature, a set of contingency questions was put to
government departments in case study countries responsible for funding the national
farm accounts survey to establish the perceived level of present benefits in relation to
the known costs. There was a wide range of responses to the perception of the benefits
as compared with the total cost, from ‘lower’ in the UK (England and Scotland) to ‘much
higher’ in Germany and Poland. Overall, Bulgaria, Germany, the Netherlands and Poland
regarded their farm accounts surveys as representing good value for money, and the UK
(England) reasonable value. The UK (Scotland) considered the survey to represent
reasonable/poor value for money when considered against the other surveys operated in
the sector. In terms of who received the benefits, governmental use was clearly seen to
be the principal beneficiary. Academic institutions and research bodies came next,
followed by farmers through advisors and extension agents. Farmers benefitting directly
and farmers’ lobby groups were seen as benefitting the least. Though far from perfect,
and with not all case study countries represented, this approach leads us to the
conclusion that the perceived value of benefits relative to costs would cause
Member States to at least consider continuing with national farm accounts
surveys in the absence of a requirement to supply EU-FADN with data.
9.5. Best practices in FADN data collection and use that can be shared among Member
States
This study has identified example of best practices in FADN data collection and use that
can be shared among Member States and has considered their applicability in different
Member States/data collection systems. This emphasis on what is appears to be feasible
has automatically ruled out major changes such as the introduction of mandatory
keeping of accounts for taxation systems where farmers were not currently taxed on this
basis.
Within this framework our conclusion is that, based on the types of evidence
available to this study, a number of best practices exist that should be
considered for general adoption among Member States. Without wishing to
duplicate the analysis presented above, it is worth briefly reviewing the principal
examples.

Study on cost of and good practices for FADN data collection
144
Few recent examples of formal monitoring and evaluation systems have been identified
in the course of this study. We recommend that it would be best practice for all Member
States to introduce appropriate systems to examine both the costs of data collection and
analysis, the variability within this, and the reasons for this, and the uses to which the
results are put. Allied to this, we recommend that collaboration at the EU level to
introduce a common and consistent framework would be appropriate.
In terms of the collection of data, there are several specific examples (more are
mentioned in the analysis of Theme 1):
Best practice is to make use of data already in accounts where these have to be
kept for taxation purposes. Though there may be a need to be watchful over bias
in such accounts, a large number of Member States manage to use extraction
from farm accounts as a basis for supplying EU-FADN without raising issues of
quality or bias that lead to their rejection by RICA-1.
Similarly, the use of administrative data (physical or financial) can reduce costs.
Undoubtedly there are technical issues in making sure that the production unit in
the administrative source corresponds fully with that in the farm accounts survey
(a farm business may comprise more than one holding), but clearly some
countries have managed to clarify such situations.
Where there are legal restrictions on the use of administrative data, taxation
records or other commercial sources (such as bank statements), access by
consent may avoid the testing of legal boundaries. Access by consent is seen as
an example of best practice. Already the majority of Member States have formal
agreements with the farmers that participate in the national farm accounts survey
(16) and its modification to include consent to access would seem to be
appropriate (at least for newly recruited farms) in those Member States that do
not currently do this.
The elimination of various stages in the data supply chain can reduce costs,
remove the causes of transcription error, speed the process and assist with
validation. The most elementary is the removal of paper entry of data and its
replacement by electronic entry.
Validation is important to both data quality, costs of collection and timeliness of
results. Best practice concerns the stages at which validation of data is carried
out, and the means by which this is done. The online survey showed that most
countries have validation procedures before data are entered into the national
farm accounts system. Our conclusion is that best practice is to have validation
checks at multiple points along the data supply chain and to have a system that
learns from past experience. A related point is that there may be the opportunity
for international cooperation in the design of programmes for this purpose.
Payments to participating farmers represent a cost to data collection in the 12
Member States that use them; there is also an administrative transaction cost.
We conclude that, in case study countries that make such payments, there
appears to be little fundamental reason for them. Other case study countries
manage to secure data without payment, although usually some form of feedback
is involved. It would therefore be best practice to periodically review the
necessity of paying these fees in those Member States that currently make these
payments.
We have found that results from national farm accounts surveys are widely published and
we conclude that the information is used by almost all Member State
governments in a variety of ways linked to their needs to inform policy and to
assist in the generation of statistics. In addition to these public benefits there are
private benefits to farm operators when the results are used as the basis of advice and
benchmarking, whether these services are provided by the public or private sectors.
However, some two-thirds of Member States collect more information than they are

Study on cost of and good practices for FADN data collection
145
required to submit to EU-FADN (broader scope and/or deeper detail) and their patterns
of national use will reflect more than just the variables collected for EU-FADN. Making
changes to the requirements of EU-FADN would imply adjustments in surveys that would
be less costly in some Member States than in others, depending on what is already
collected for national purposes. However, as pointed out by senior DG AGRI staff, it may
be possible to use some of this additional information for groups of Member States which
already collect it, even though a full EU picture could not be presented.
The relatively low level of sample turnover allows panel data (longitudinal sample) to be
used to investigate issues such as exposure to risk and productivity growth and to
enhance the evaluation of responses to policy interventions. However, the availability of
panel data is currently by accident rather than design and this imposes limits on its
utility. For example, there is no weighting system available to researchers to ensure that
panel data are representative which reduces the benefits of analysis for policy purposes.
We conclude that an explicit longitudinal panel within the overall sample,
suitably weighted, would increase the value of FADN as a research tool as it
would allow the better evaluation of important policy issues such as structural change
and income variability over time.
In terms of encouraging use, we recommend that, where a fee is currently charged,
consideration should be made to removing this, given that the marginal cost of making
this information available to one more user is zero. However, a preferred solution is that
offered by the UK (England) in which access to the basic raw data is provided while still
maintaining safeguards for confidentiality. This may be facilitated by international
cooperation in the design and use of appropriate software.
Finally, given the different practices across Member States, frequent lack of awareness of
what happens in other countries and a silo attitude to some developments (such as in
IT), we conclude that there are currently impediments to the free flow of
information on data collection. We recommend that consideration is given to how
this might be improved and cooperation fostered to reach solutions to common problems.
These may involve building on the existing framework provided by the EU-FADN
Committee and its associated working groups and the Pacioli network, but may also need
to go beyond them to form technical groups or task forces with the specific aim of
sharing information and spreading good practice.

Study on cost of and good practices for FADN data collection
146
10. REFERENCES
Abitabile, C. (1996) The perspectives on the Italian agricultural accountancy network:
needs of innovation. In: Beers, G. (ed.), Poppe, K. J. and Pruis, H. C. (1996)
PACIOLI 3: Need for change. Workshop Report. June 1996. Agricultural Economics
Research Institute (LEI-DLO).
Agra CEAS Consulting (2007) Feasibility Study on the Implementation of Income of
Agricultural Households Sector (IAHS) Statistics. Final Report for European
Commission (Eurostat).
Agreste (2015) RICA France: Présentation des fichiers détails mis en ligne. Agreste,
RICA, fichier des microdonnées, janvier 2015. http://agreste.agriculture.gouv.fr/
Ahearn, M., Barnes, K., Culver, D., Jones, S., Smith, J., Boone, K., Bolliger, F.,
Iwig, B., Leduc, A., McCarthy, J., MacDonald, J., Parsons, J., Poppe, K. and
Ravindra, D. (2011) Complex Agricultural Establishments. Prepared by the Planning
Committee for an International Workshop on Enhancing Data for Complex
Agricultural Establishments, Niagara-on-the-Lake, Ontario, Canada, June 26-28,
2011.
Astorkiza, I. (1996) Possible changes / innovations in the Spanish FADN. In: Beers, G.
(ed.), Poppe, K. J. and Pruis, H. C. (1996) PACIOLI 3: Need for change.
Workshop Report. June 1996. Agricultural Economics Research Institute (LEI-DLO).
Aubert, M. and Enjolras, G. (2014) Between the approved and the actual dose: a
diagnosis of pesticide overdosing in French vineyards. Revue d'Etudes en Agriculture
et Environnement, 95 (3), 327-350.
Barkaszi, L., Keszthelyi, S., Kis Csatári, E. and Pesti, C. (2009) FADN Accountancy
Framework and Cost Definitions. FACEPA Deliverable No. D1.1.1 – July 2009.
Bajek, P. (2015) Impact assessment, budget, trade: overview of uses in DG AGRI.
Conference “EU-FADN – 50 years of providing information for the CAP”. 11 June,
2015. DG AGRI.
Bamière, L., De Cara, S., Pardon, L., Pellerin, S., Samson, E. and Dupraz, P.
(2014) Coûts de transaction privés et adoption de mesures d’atténuation des
émissions de GES. Notes et Etudes Socio-Economiques (NESE), 38, June 2014, 53-
71. http://agreste.agriculture.gouv.fr/IMG/pdf/nese140638A3.pdf
Beers, G., Poppe, K. J. and Leuftink, A. (2001) PACIOLI 8: Innovations in the FADN.
Agricultural Economics Research Institute (LEI), The Hague.
Beers, G. (ed.), Poppe, K. J. and Pruis, H. C. (1996) PACIOLI 3: Need for change.
Workshop Report. June 1996. Agricultural Economics Research Institute (LEI-DLO).
Beers, G., Poppe, K. J. and de Putter, I. (2000) PACIOLI 7: Agenda 2000 and the
FADN agenda. Workshop report. Agricultural Economics Research Institute (LEI,)
The Hague.
Beers, G., Poppe, K. J. and van Rijswijk, M. M. (May 1998) PACIOLI 5: Development
of farm accountancy data networks. Workshop report. May 1998. Agricultural
Economics Research Institute (LEI-DLO).
Study on cost of and good practices for FADN data collection
147
Beers, G. (ed.), Poppe, K. J., Spiering, D. F. and Pruis, H. C. (1995) PACIOLI 1:
Farm accountancy data networks and information analysis. Workshop Report.
August 1995. Agricultural Economics Research Institute (LEI-DLO).
Beers, G., Poppe, K. J. and Teeuwen-Vogelaar, C. (ed.) (2002) PACIOLI 9:
Innovations in the FADN. Agricultural Economics Research Institute (LEI), The
Hague.
BMEL (2014) Buchführung der Testbetriebe. Grundlagen zur BMEL –
Testbetriebsbuchführung. Stand: Mai 2014. BMEL 123.
Bonello Sant, E., Grech, D. and Tanti, R. (2012) FADN Malta.
Boone, K. (2008) Dutch FADN: an overview and recent developments. In: Boone, K.
and Teeuwen, C. (2009) PACIOLI 16: Changing agricultural markets:
Consequences for FADN. LEI Wageningen UR, Den Haag.
Boone, K. and Teeuwen, C. (2009a) PACIOLI 16: Changing agricultural markets:
Consequences for FADN. LEI Wageningen UR, Den Haag.
Boone, K. and Teeuwen, C. (eds) (2009b) PACIOLI 17: Innovation in the management
and use of Micro Economic Databases in Agriculture. LEI Wageningen UR, The
Hague.
Boone, K. and Teeuwen, C. (eds) (2010) PACIOLI 18: Proceedings of the 18th
international workshop on micro-economic databases in agriculture. LEI, part of
Wageningen UR, The Hague.
Bouters, S. (2010) How pleased are farmers with the Flemish FADN? In: Boone, K.
and Teeuwen, C. (eds) (2010) PACIOLI 18: Proceedings of the 18th international
workshop on micro-economic databases in agriculture. LEI, part of Wageningen UR,
The Hague.
Bratka, V. and Prauliņš, A. (2007) “Some issues in valuation and renewal of fixed
assets in Latvian agricultural holdings”. In: Ekonomika ir vadyba: aktualijos ir
perspektyvos. 2007. 1 (8). 37–46.
Broekhoven, E. van (2007) A new farm accountancy data network for Flanders
(Belgium). In: Poppe, K. J., Boone, K. and Teeuwen-Vogelaar, C. (ed.) (2008)
PACIOLI 15 workshop presentations: Integration of farm accounting in research and
statistics. Agricultural Economics Research Institute (LEI), The Hague.
Brown, J. J. (2011) Review of Some Methodological Aspects of the Farm Business
Survey. University of Southampton.
Brun-Schammé, A. (2014) Actual annual working time in France and in Europe in 2013.
Update to the January 2012 study plus new data. Summary of the Working Paper
N.49. Coe-Rexecode, July 2014.
Butault J.-P., Delame, N. and Lerouvillois, P. (2005) Activité extérieure et revenus
des ménages agricoles. Économie Rurale 289-290:75-90.
Butault, J.-P., Delame, N., Jacquet, F. and Zardet, G. (2011) L’utilisation des
pesticides en France : état des lieux et perspectives de réduction. Notes et Etudes
Socio-Economiques (NESE), 35, October, 7-26. http://agriculture.gouv.fr/L-
utilisation-des-pesticides-en

Study on cost of and good practices for FADN data collection
148
Cardillo, C. and Esposito, L. (2009) Survey on economic results of farms in Italy:
Sample design and sampling strategy based on the new typology. In: Boone, K.
and Teeuwen, C. (eds) (2010) PACIOLI 18: Proceedings of the 18th international
workshop on micro-economic databases in agriculture. LEI, part of Wageningen UR,
The Hague.
Cardillo, C., Gioia, M. and Mari, F. (2011) The value of land according to data from the
Italian FADN. In: Vrolijk, H. (ed.) (2012) PACIOLI 19: The role of FADN after the
CAP reform. LEI, part of Wageningen UR, The Hague.
Chantry, E. (2003) Le Réseau d'information comptable agricole (RICA). Un outil unique
de connaissance des agricultures européennes. Notes et études économiques n°18,
April 2003.
Chassard, M. and Chevalier, B. (2007) Un large éventail de revenus agricoles, in
L’agriculture, nouveaux défis - édition 2007. Institut national de la statistique et des
études économiques, Paris.
Chatellier, V. (2006) Le découplage et les droits à paiement unique dans les
exploitations laitières et bovins-viande en France. Cahiers d'Economie et Sociologie
Rurales (78), 2-28.
Chatellier, V., Delattre, F. (2006) Le régime de paiement unique et l'agriculture de
montagne en France. Notes et Etudes Economiques (25), 79-107.
http://prodinra.inra.fr/
Chatellier V., Guyomard H. (2013) The first pillar direct payments in the next CAP
(post 2015), a French point of view. New Medit (Mediterranean Journal of
Economics, Agriculture and Environment), 3, 11-20.
http://www.iamb.it/share/img_new_medit_articoli/947_11chatellier.pdf
Commission of the European Communities (1985) Agricultural incomes in the
Community. Green Europe Newsflash 29. The Commission, Brussels.
Conferenza Stato-Regioni (2012) Protocollo d’Intesa tra il Ministero delle politiche
agricole, alimentari e forestali, l’Istituto Nazionale di Economia Agraria (INEA),
l’Istituto Nazionale di Statistica (ISTAT), le Regioni e le Province Autonome di Trento
e Bolzano per l’effettuazione in forma coordinata dell’indagine RICA e dell’indagine
REA. Repertorio Atti 84/CSR del 4 aprile 2012.
Delame, N. (2009) Evaluation and comparability of EU and member country FADN
databases. In: Boone, K. and Teeuwen, C. (eds) (2010) PACIOLI 18: Proceedings
of the 18th international workshop on micro-economic databases in agriculture. LEI,
part of Wageningen UR, The Hague.
Delame, N. (2015) Les revenus non agricoles réduisent les écarts de revenus entre
foyers d’agriculteurs. Insee Références, February, 31-42.
Delame, N. and Butault, J.-P. (2010) Evaluation and comparability of European Union
and member country FADN databases. FACEPA Deliverable No. 2.1 – January 2010.
Delame, N., Butault, J.-P. and Pollet, P. (2015) L’allocation du travail des ménages
agricoles entre travail agricole, activités de diversification et emplois extérieurs: une
première approche à partir du raccordement RA-RICA-déclarations fiscales de 2010.
Paper presented in SFER seminar in Rennes, France, February 12-13.

Study on cost of and good practices for FADN data collection
149
Del’homme, B. and Aamisepp, M. (2009) Installing an FADN in a new Member State:
some guidelines and principles from several experiences. In: Boone, K. and
Teeuwen, C. (eds) (2009) PACIOLI 17: Innovation in the management and use of
Micro Economic Databases in Agriculture. LEI Wageningen UR, The Hague.
Del’homme, B. and Aamisepp, M. (2010) Applying the European FADN methodology in
a new Member State: principles for statistical choices based on Eastern projects. In:
Boone, K. and Teeuwen, C. (eds) (2010) PACIOLI 18: Proceedings of the 18th
international workshop on micro-economic databases in agriculture. LEI, part of
Wageningen UR, The Hague.
Defra (2013) Business Management Practices on Farm 2011/12, England. Department
for Environment, Food and Rural Affairs, London.
Defra (2014) Farm Business Survey (FBS) How the information is used by Government.
November 2014. Department for Environment, Food and Rural Affairs, London.
Desbois, D., Nefussi, J. (2008) Signes de qualité - Quels résultats économiques pour le
producteur? Déméter 2008, 49-96.
http://www.clubdemeter.com/pdf/ledemeter/2008/signes_de_qualite_quels_resultat
s_economiques_pour_le_producteur_.pdf
Drew Associates (2013) Final draft annual report 2011/12. Farm Business Survey
Quality Assessor. January 2013. Final report to Department for Environment, Food
and Rural Affairs, London.
Dupraz, P., Latruffe, L. (2015) Trends in family labour, hired labour and contract work
on French fieldcrop farms: The role of agricultural policies. Food Policy, 51: 104-
118.
ECA (2004) Measurement of Farm Incomes by the Commission. Special Report No
14/2003, Court of Auditors of the European Communities, Luxembourg [also
appeared as Court of Auditors (2003)].
Espinosa, M., Gomez y Paloma, S. and Ciaian, P. (2011) Policy analysis based on
micro-economic data conducted at JRC-IPTS Agrilife Unit and Future data needs:
selected activities. In: Vrolijk, H. (ed.) (2012) PACIOLI 19: The role of FADN after
the CAP reform. LEI, part of Wageningen UR, The Hague.
Eurofound (2015) Developments in collectively agreed working time 2014.
European Commission (1989) Farm Accountancy Data Network: An A to Z of
methodology. Luxembourg: Office for Official Publications of the European
Communities, 1989. Commission of the European Communities. ISBN 92-826-
0096-3.
European Commission (1991) Measuring farmer’s incomes and business performance.
Green Europe, 3/91, Commission of the European Communities.
European Commission (1996a) Summary of the FADN selection plan for Finland.
Community Committee for the Farm Accountancy Data Network (FADN). RI/CC
1203. Brussels, 12 April, 1996.
European Commission (1996b) Summary of the FADN selection plan for Sweden.
Community Committee for the Farm Accountancy Data Network (FADN). RI/CC
1204. Brussels, 12 April, 1996.
Study on cost of and good practices for FADN data collection
150
European Commission (1996c) Summary of the FADN selection plan for Austria.
Community Committee for the Farm Accountancy Data Network (FADN). RI/CC
1213. Brussels, 8 May, 1996.
European Commission (2001) Risk management tools for EU agriculture, with a special
focus on insurance. Working Document, Agriculture Directorate-General.
Commission of the European Communities.
European Commission (2004a) Description of the Lithuanian selection plan, year 2004.
RI/CC 1403. Brussels, DG AGRI G3 D(2004).
European Commission (2004b) The FADN selection plan for Hungary 2005. RI/CC
1406 rev.1. Brussels, 25/10/2004. DG AGRI G3 D(2004).
European Commission (2004c) The FADN selection plan for Slovak Republic. RI/CC
1407. Brussels, DG AGRI G3 D(2004).
European Commission (2004d) The FADN selection plan for Estonia 2004-2005. RI/CC
1414. Brussels, DG AGRI G3 D(2004).
European Commission (2004e) The FADN selection plan for the Czech Republic. RI/CC
1415. Brussels, DG AGRI G3 D(2004).
European Commission (2004f) The Plan of Selection of a Sample of Agricultural
Holdings under the Polish FADN 2004-2005. RI/CC 1417. Brussels, DG AGRI G3
D(2004).
European Commission (2004g) The FADN selection plan for Malta 2004-2005. RI/CC
1419.
European Commission (2007) The FADN sample for Italy Sample design & sampling
strategy. RI/CC 1473. Bruxelles, 11 June 2007.
European Commission (2008a) Field of observation and sampling in the Dutch FADN.
RI/CC 1501. June 16, 2008.
European Commission (2008b) Impact Assessment [of various Regulations and a
Decision]. COM(2008) 306 final. Commission of the European Communities.
European Commission (2009a) Guidelines for selection plans. 172nd meeting of the
Community Committee for the Farm Accountancy Data Network. RI/CC 1526 rev.1.
Brussels, 21 April 2009. EL D(2009).
European Commission (2009b) Implementation of the New Typology New thresholds.
172nd Meeting of the Community Committee for the Farm Accountancy Data
Network. RI/CC 1524. Brussels, 20 March 2009. Unit L3 D(2009).
European Commission (2009c) Report of the Mission to Prague, Czech Liaison Agency,
Institut of Agriculture Economics and Information 2-3 July, 2014. Brussels, 10 July,
2009. AGRI L.3/SH/EA.
European Commission (2011) Mission report Slovenia- FADN Liaison Agency office.
Brussels, 18 January, 2011. UnitL3/ENARES(2011).
European Commission (2012a) Mission Report: Control Mission to Slovak FADN Unit.
Brussels, 16 January, 201. AGRIL.3.D(2011).
Study on cost of and good practices for FADN data collection
151
European Commission (2012b) Report on the Mission to Malta 17-18 October 2012.
Brussels 2012 (D)EN.
European Commission (2012c) Report Mission to Romania, on 24-27 September 2012,
to analyse operation of FADN in Romania. Brussels, 19 October 2012. L.3/EN/PB
D(2012).
European Commission (2013a) Report: Mission to Germany, on 2-4 December 2013,
to analyse operation of FADN in Germany. Brussels, 29 December, 2013.
L.3/EN/LTB D(2013) 4050460.
European Commission (2013b) Mission Report: FADN Liaison Agency in Denmark, 26-
27 September 2013. Brussels, 3 October 2013.
European Commission (2013c) Mission Report: FADN in Spain: Facts-finding mission –
16-17 October 2013. Brussels, 18 November 2013.
European Commission (2013d) Mission Report: FADN in Greece - 9-10 MAY 2013.
Brussels, 22 May, 2013. RR (2013) 1371392.
European Commission (2013e) Letter to Ministry of Rural Development and Food,
Greece. Brussels, AGRI.L.3/RR/ARES(2013)327624.
European Commission (2013f) Letter to Ministry of Rural Development and Food,
Greece. Brussels, AGRI.DDG2.L.3/RR/cc (2013) 2526572.
European Commission (2014a) Update of fadn data requests. RICC 1722. 193th
FADN Committee Meeting, 5 November 2014.
European Commission (2014b) Letter to Ministerul Agriculturii si Dezvoltarii Rurale,
Romania. Brussels, 18/06/2014. AI/atf agri.ddg2.e.3(2014)2102633.
European Commission (2014c) Conclusions from the EU FADN Facts-Finding Mission to
Spain. Brussels, 16 February, 2014. RR/atf agri.ddg2.e.3(2014)92382.
European Commission (2014d) Follow-up meeting of the EU FADN facts finding mission
to Spain. Brussels, 25 April, 2014. RR/mel agri.ddg2.e.3(2014)1357186.
European Commission (2014e) Mission Report: Meetings with the Greek authorities on
the latest developments in the Farm Accountancy Data Network (FADN) and on
possible integration of statistics and administrative data in Greece – Athens,
11/06/2014. Brussels, 18/06/2014 RR/atf agri.ddg2.e.3(2014)2128894.
European Commission (2014f) Conclusions from the EU FADN audit mission to
Germany and invitation to follow-up meeting. Brussels, 7 February, 2014.
EN/LTB/mel agri.ddg2.e.3 (2014)322013.
European Commission (2014g) Follow-up meeting of the audit mission to Germany on
2-4 December 2013 and the issue of the yearly data delivery deadline. Brussels,
EN/atf agri.ddg2.e.3(2014)1000182 ARES (2014).
European Commission (2014h) Report: audit mission to Bulgaria, 25-27 March 2014 to
analyse the operation of the Bulgarian FADN. Brussels, 11 April, 2014.
E3/EN/PB/apm D(2014) 1193242.
Study on cost of and good practices for FADN data collection
152
European Commission (2014i) Letter to Ministry of Agriculture and Food of the
Republic of Bulgaria. Brussels, 27 May, 2014. PB EN/apm agri.ddg2.e.3(2014)
1792392.
European Commission (2014j) Mission Report: Mission to Croatia, on 24-25 September
2014, to analyse operation of FADN in Croatia. Brussels, 29 October 2014.
European Commission (2014k) Letter to Head of Department of FADN, Croatia.
Brussels, 19/11/2014. AI/atf agri.ddg2.e.3(2014)4174775.
European Commission (2014l) Mission Report: FADN in Ireland: Fact-finding mission–
24-25 November 2014. Brussels, 26 November 2014.
European Commission (2014m) General conclusions and identified areas where
improvements could be envisaged after the fact-finding mission in Ireland. Brussels,
17/12/2014. agri.ddg2.e.3(2014)4659650.
European Commission (2014n) Report on high-value datasets from EU institutions.
SC17DI06692. Date: 16/06/2014.
European Commission (2015a) EU Farm Accountancy Data Network: 50 years of
support for EU agriculture and farmers. DG AGRI.
European Parliament (2013) Semi-subsistence farming: value and directions of
development. Study for the European Parliament. IP/B/AGRI/IC/2012-65, April,
2013. Authors: Davidova, S., Bailey, A., Dwyer, J., Erjavec, E., Gorton, M. and
Thomson, K.
European Parliament (2015) Comparison of farmers’ incomes in the EU Member
States. Study for the European Parliament. IP/B/AGRI/IC/2014_68, June 2015.
Authors: Hill, B. and Bradley, D.
Fais, A. (2003) FADN data to produce indirect statistics on the use of pesticides and to
define the spatial distribution of plant diseases. In: Poppe, K J, Povellate, A., and
Krijgsman, K. (2003) PACIOLI 10: European farmers and the growing of data.
Agricultural Economics Research Institute (LEI), The Hague.
Floriańczyk, Z. (2015) Structure – institutions and bodies involved in Polish FADN.
Agricultural Accountancy Department, IAFE-NRI.
Franks, J. R. and Collis, J. (2003) On-farm benchmarking: How to do it and how to do
it better. Paper to the International Farm Management Congress, 2003.
Giannakopoulou, M. and Ioannou, S. (2012) FADN in Cyprus. Presentation for
meeting with DG AGRI FADN team.
Guyomard, H. (sous la direction de) (2013) Vers des agricultures à hautes
performances. Volume 1. Analyse des performances de l’agriculture biologique.
Inra. 368 pages.
http://www.strategie.gouv.fr/sites/strategie.gouv.fr/files/archives/rapport-INRA-
pour-CGSP-VOLUME-1-web07102013.pdf
Hanibal, J. (2001) FADN in the Czech Republic. In: Beers, G., Poppe, K. J. and
Leuftink, A. (2001) PACIOLI 8: Innovations in the FADN. Agricultural Economics
Research Institute (LEI), The Hague.
Study on cost of and good practices for FADN data collection
153
Hækkerup, D. (2010) Selection and sample size in Danish agricultural account statistics.
In: Boone, K. and Teeuwen, C. (eds) (2010) PACIOLI 18: Proceedings of the 18th
international workshop on micro-economic databases in agriculture. LEI, part of
Wageningen UR, The Hague.
Hennessy, T. (2012) FADN data for policy analysis – measuring sustainability. In:
Vrolijk, H. (ed.) (2013) PACIOLI 20: Complex farms and sustainability in farm level
data collection. LEI Wageningen UR, The Hague.
Hill, B. (1991a) Calculation of Economic Indicators: Making Use of RICA (FADN)
Accountancy Data. Document series, Commission of the EC, Brussels.
Hill, B. (1991b) Measuring Farmers’ Incomes and Business Performance. Green Europe
3/91.
Hill, B. (2012) Farm incomes, wealth and agricultural policy: filling the CAP’s core
information gap. 4th edition. CABI, Wallingford.
Hill, B., Bradley, D. and Williams, E. (2015) Has Farming Connect made an economic
impact on the Welsh agricultural sector? Contributed Paper presented at the 89th
Annual Conference of the Agricultural Economics Society, University of Warwick,
England 13-15 April 2015.
Hill, B. with Cahill, C. (2007) Taxation of European Farmers. In: EuroChoices 6(1) 44.
Himanen, M. (1996) The needs and expectations of the Finnish Ministry of Agriculture
and Forestry with respect to the FADN. In: Beers, G. (ed.), Poppe, K. J. and
Pruis, H. C. (1996) PACIOLI 3: Need for change. Workshop Report. June 1996.
Agricultural Economics Research Institute (LEI-DLO).
Hofer, O. (2011) Farm Accountancy data system in Austria. Presentation and
accompanying handout for meeting with DG AGRI FADN team. 14th of November
2011.
Hradiský, M. (2013) Use of FADN data in policy evaluation. 21 PACIOLI Workshop,
Sweden. September 22-25, 2013.
Hughes, D. and Williams, N. (1996) The commercial exploitation of the FADN in
England opportunities and constraints. In: Beers, G. (ed.), Poppe, K. J. and
Pruis, H. C. (1996) PACIOLI 3: Need for change. Workshop Report. June 1996.
Agricultural Economics Research Institute (LEI-DLO).
Hyvönen, K. (2004) A short history of the FADN and other activities than agriculture.
In: Poppe, K. J. (ed.), PACIOLI 12: Income Issues in Farm Households and the Role
of the FADN, Report 8.04.03. Agricultural Economics Research Institute (LEI), The
Hague.
INEA (no date) RICA Italia the Farm Accountancy Data Network in Italy.
Jelaković, K. (2012) EU conformity of the Croatian FADN. In: Vrolijk, H. (ed.) (2013)
PACIOLI 20: Complex farms and sustainability in farm level data collection. LEI
Wageningen UR, The Hague.
Jelaković, K. (2013) FADN HR: Selection plan 2013, RICC 1668. Brussels, June 10th
2013.
Study on cost of and good practices for FADN data collection
154
Jelaković, K. and Fotak, D. (2013) IT solutions in FADN HRV. 21 PACIOLI Workshop,
Sweden. September 22-25, 2013.
Kalo, A. (2014) Administrative data sources for FADN in Sweden. Brussels, 10
September 2014 RI/CC 1712 – 192th FADN Committee.
Karlsson, A.-M. (2004) Collection of farm income data in Sweden. In: Poppe, K. J.
(2004b) PACIOLI 12: Income issues in Farm Households and the Role of the FADN.
Agricultural Economics Research Institute (LEI), The Hague.
Karlsson, A.-M. (2011) The organisation of FADN in Sweden. RICC 1611. Swedish
Board of Agriculture.
Karlsson, A.-M. (2013) Farm Economic Survey (FADN) in Sweden 1914/15 - ? 21
PACIOLI Workshop, Sweden. September 22-25, 2013.
Karlsson, A.-M. and Larson, G. (2001) FADN as a part of the statistical system - the
case of Sweden. In: Beers, G., Poppe, K. J. and Teeuwen-Vogelaar, C. (ed.)
PACIOLI 9: Innovations in the FADN. Agricultural Economics Research Institute
(LEI), The Hague.
Keszthelyi, S. (2012) Farm Accountancy Data Network in Hungary: Promoting decision-
making with FADN. FADN Committee, November 23rd, 2012.
Keszthelyi, S. and Pesti, C. (2009) Standardised method for credit rating of
agricultural holdings - an alternative utilisation of FADN data. In: Boone, K. and
Teeuwen, C. (eds) (2009) PACIOLI 17: Innovation in the management and use of
Micro Economic Databases in Agriculture. LEI Wageningen UR, The Hague.
Kjesbu, E., Øvren, E. and Haukås, T. (2008) Exchange of data for decision making in
Norwegian agriculture and consequences for the Norwegian FADN. In: Boone, K.
and Teeuwen, C. (2009) PACIOLI 16: Changing agricultural markets:
Consequences for FADN. LEI Wageningen UR, Den Haag.
Kimura, S., Antón. J. and LeThi, C. (2010) Farm Level Analysis of Risk and Risk
Management Strategies and Policies: Cross Country Analysis. OECD Food,
Agriculture and Fisheries Papers, No. 26, OECD Publishing.
http://dx.doi.org/10.1787/5kmd6b5rl5kd-en
Kimura, S. (2011) Farm Characterization and Modelling in Risk Management: Case of
Crop Farm Data in Canada. In: Vrolijk, H. (ed.) (2012) PACIOLI 19: The role of
FADN after the CAP reform. LEI, part of Wageningen UR, The Hague.
Kimura, S. and C. Le Thi (2013) Cross country analysis of farm economic performance.
OECD Food, Agriculture and Fisheries Papers, No. 60. OECD Publishing.
http://dx.doi.org/10.1787/5k46ds9ljxkj-en
Kinsella, A. (2004) A review of the collection of Farm Household Income Data in Ireland.
In: Poppe, K. J. (2004a) PACIOLI 11: New roads for farm accounting and FADN.
Agricultural Economics Research Institute (LEI), The Hague.
Kleinhanß, W. (2004) Use of micro data in policy analysis - the case of the 'mid-term
review' of CAP. In: Poppe, K. J. (2004b) PACIOLI 12: Income issues in Farm
Households and the Role of the FADN. Agricultural Economics Research Institute
(LEI), The Hague.

Study on cost of and good practices for FADN data collection
155
Kleinhanss, W. (2012) Organisation of FADN in Germany/use of FADN data in vTI. Rica
Committee Meeting, Brussels 23.11.2012.
Krebs, S. (2005) Pluriactivite et mode de financement des exploitations agricoles.
Economie Rurale (289-290), 91-105.
Latruffe, L., Fogarasi, J.and Desjeux, Y. (2012) Efficiency, productivity and
technology comparison for farms in Central and Western Europe: The case of field
crop and dairy farming in Hungary and France. Economic Systems, 36: 264-278.
Latruffe, L. and Nauges, C. (2014) Technical efficiency and conversion to organic
farming: the case of France. European Review of Agricultural Economics, 41(2):
227-253.
Latruffe, L. and Mann, S. (2015) Is part-time farming less subsidised? The example of
direct payments in France and Switzerland. Cahiers Agricultures, 24(1): 20-27.
Latruffe, L. and Piet, L. (2014) Does land fragmentation affect farm performance? A
case study from Brittany, France. Agricultural Systems, 129: 68-80.
Latukka, A. (no date) FADN in Finland. MTT Economic Research, Finland.
Latvijas Valsts agrārās ekonomikas institūts (2014) Rokasgrāmata. SUDAT. Rīga
2014.
Lecuyer, B., Chatellier, V. and Daniel, K. (2013) Les engrais minéraux dans les
exploitations agricoles françaises et européennes. Economie Rurale (333), 147-157.
Lecuyer B., Chatellier V. and Daniel K. (2014) Analysis of price volatility of mineral
fertilizers: possible issues for European farmers. International Journal of Agricultural
Resources, Governance and Ecology, vol. 1(4), 344-361.
Lekesova, M. (2003) FADN CZ Software in 2002. In: Poppe, K. J., Povellato, A. and
Krijgsman, K. (2003) PACIOLI 10: European farmers and the growing of data.
Agricultural Economics Research Institute (LEI), The Hague.
Martino, M., Scardera, A. and Bodini, A. (2012) IT tools and target users of the
Italian RICA data. In: Vrolijk, H. (ed.) (2013) PACIOLI 20: Complex farms and
sustainability in farm level data collection. LEI Wageningen UR, The Hague.
Matthews, A. (2000) Farm Incomes: Myths and Reality. Cork University Press.
Matveev, E. (2007) Possible effects of CAP on Estonian FADN. In: Poppe, K. J.,
Boone, K. and Teeuwen-Vogelaar, C. (ed.) (2008) PACIOLI 15 workshop
presentations: Integration of farm accounting in research and statistics. Agricultural
Economics Research Institute (LEI), The Hague.
Merino-Pacheco, M. (1996) Determinants and constraints for administrative change in
Spain: Institutional analysis of possible reforms of the Spanish farm accountancy
network. In: Beers, G. (ed.), Poppe, K. J. and Pruis, H. C. (1996) PACIOLI 3:
Need for change. Workshop Report. June 1996. Agricultural Economics Research
Institute (LEI-DLO).
Ministre de l’Agriculture, de l’Agroalimentaire et de la Forêt (2011) Présentation
du Réseau d'information comptable agricole en France. Comité RICA n°178 –
Bruxelles le 1er février 2011.

Study on cost of and good practices for FADN data collection
156
Ministre de l’alimentation, de l’agriculture et de la pêche (2010a) Décret no 2010-
178 du 23 février 2010 relatif à la création d’un réseau de données dénommé réseau
d’information comptable agricole - RICA France.
Ministre de l’alimentation, de l’agriculture et de la pêche (2010b) Arrêté du
ministre de l’alimentation, de l’agriculture et de la pêche du 8 juin 2010 relatif au
traitement automatisé des données recueillies auprès des exploitants agricoles
participant au réseau d’information comptable agricole - RICA France.
Ministre de l’alimentation, de l’agriculture et de la pêche (2013) Arrêté du ministre
de l’agriculture, de l’agroalimentaire et de la forêt du 24 septembre 2013 portant
nomination au comité national du réseau d’information comptable agricole.
Ministère de la Région wallonne (2004) Direction générale de l’Agriculture. Rapport
d’activités 2003. Ministère de la Région wallonne, Direction générale de l’Agriculture.
Ministry of Agriculture and Food of the Republic of Bulgaria (2014) Structure of
FADN in Bulgaria operating activities FADN. Audit mission 25-27 March 2014. Sofia.
Ministry of Economic Affairs (2015) Wettelijke Onderzoekstaak Economische
Informatievoorziening (WOT-EI). Netherlands Ministry of Economic Affairs , DG Agri,
March 2015.
Mora, R., San Juan, C. and de la Torre J. E. (2003) The representativeness of the
1999 Spanish FADN survey. In: Poppe, K. J., Povellato, A. and Krijgsman, K.
(2003) PACIOLI 10: European farmers and the growing of data. Agricultural
Economics Research Institute (LEI), The Hague.
Moreddu, C. (2015) A wider perspective: distribution of support and income in OECD
countries. EU FADN: 50 years informing the CAP and much more, 11 June 2015.
Moran, B. and Connolly, L. (2007) Main issues in the renewal of the IT system of the
Irish FADN. In: Poppe, K. J., Boone, K. and Teeuwen-Vogelaar, C. (ed.) (2008)
PACIOLI 15 workshop presentations: Integration of farm accounting in research and
statistics. Agricultural Economics Research Institute (LEI), The Hague.
Muehlethaler, K. (2007) Results of a survey about methodology in national FADNs. In:
Poppe, K. J., Boone, K. and Teeuwen-Vogelaar, C. (ed.) (2008) PACIOLI 15
workshop presentations: Integration of farm accounting in research and statistics.
Agricultural Economics Research Institute (LEI), The Hague.
National Research Council (2008) Understanding American Agriculture: Challenges for
the Agricultural Resources Management Survey. Panel to Review USDA’s Agricultural
Resource Management Survey. Committee on National Statistics, Division of
Behavioral Social Sciences and Education. Washington, DC: The National Academies
Press.
OECD (2005) Taxation and Social Security in Agriculture. ISBN 92-64-01364-4.
http://www.oecd.org
Offermann, F. and Berner, A. (2010) Estimation of production costs based on the
German FADN. In: Boone, K. and Teeuwen, C. (eds) (2010) PACIOLI 18:
Proceedings of the 18th international workshop on micro-economic databases in
agriculture. LEI, part of Wageningen UR, The Hague.

Study on cost of and good practices for FADN data collection
157
Offermann, F., Forstner, B. and Weiss, M. (2013) Increasing importance of 'new
forms' of agricultural holdings in Germany and its impact on collection of information
for labour use in FADN. 21 PACIOLI Workshop, Sweden. September 22-25, 2013.
Perachino, S. (2000) EC Reg. 1257/99: is it possible to finance farm accountancy? In:
Beers, G., Poppe, K. J. and de Putter, I. (2000) PACIOLI 7: Agenda 2000 and the
FADN agenda. Workshop report. Agricultural Economics Research Institute (LEI,)
The Hague.
Pedersen, H. B. (2008) Agricultural statistics and FADN in Denmark & recent
developments. In: Boone, K. and Teeuwen, C. (2009) PACIOLI 16: Changing
agricultural markets: Consequences for FADN. LEI Wageningen UR, Den Haag.
Perrot, C., Caillaud, D. and Chambaut, H. (2013) Économies d’échelle et économies
de gamme en production laitière - Analyse technico-économique et
environnementale des exploitations de polyculture-élevage. Notes et Etudes Socio-
Economiques (NESE), 37, January-June, 7-32.
http://www.agreste.agriculture.gouv.fr/IMG/pdf/nese130737A1.pdf
Pesti, C. (2012) Open source solutions in Hungarian FADN: data collection and income
modelling. In: Vrolijk, H. (ed.) (2013) PACIOLI 20: Complex farms and
sustainability in farm level data collection. LEI Wageningen UR, The Hague.
Pingault, N. and Desbois D. (2003) Estimation des coûts de production des principaux
produits agricoles à partir du RICA. Notes et études économiques n°19, December
2003.
Piot, F. (2002) Comparaison entre le fichier des bénéfices réels (Bra) et le réseau
d’information comptable (RICA) : bilan d’une décennie d’information sur les
exploitations agricoles au bénéfice réel. Direction des Statistiques d’Entreprises
Département Industrie et Agriculture, n° E2002/16, Paris.
Plees, Y. (2015) FADN data and evaluations. Conference “EU-FADN – 50 years of
providing information for the CAP”. 11 June, 2015. DG AGRI Evaluation and Studies
unit.
Polski FADN (no date) A Glance at the Polish FADN.
Poppe, K. J. (2002) “Approaches to Obtaining Income Data – the Case of the
Netherlands”. Paper Presented at Workshop on the Farm Household-Firm Unit: Its
importance in agriculture and implications for statistics 12-13 April 2002. Wye
Campus, Imperial College, University of London.
Poppe, K. J. (2004a) PACIOLI 11: New roads for farm accounting and FADN.
Agricultural Economics Research Institute (LEI), The Hague.
Poppe, K. J. (2004b) PACIOLI 12: Income issues in Farm Households and the Role of
the FADN. Agricultural Economics Research Institute (LEI), The Hague.
Poppe, K. J. (2005) PACIOLI 13: Microeconomic Data on Farm Diversification, Rural
Businesses and Intra-generational Transfer. Agricultural Economics Research
Institute (LEI), The Hague.
Poppe, K. J. and Beers, G. (1996a) PACIOLI 2: On innovation management in farm
accountancy data networks. Reflection Paper. March 1996. Agricultural Economics
Research Institute (LEI-DLO).

Study on cost of and good practices for FADN data collection
158
Poppe, K. J. and Beers, G. (1996b) Strategic management for a FADN- the case of the
Netherlands. In: Beers, G. (ed.), Poppe, K. J. and Pruis, H. C. (1996) PACIOLI 3:
Need for change. Workshop Report. June 1996. Agricultural Economics Research
Institute (LEI-DLO).
Poppe, K. J., Beers, G., Astorquiza, I., Bonati, G., Florez Robles, L., Öhlmér, B.,
Sirén, Y., Steffe, J. and Williams, N. (1997) PACIOLI 4: Proposals for innovation
of farm accountancy data networks. Final reflection paper. May 1997. Agricultural
Economics Research Institute (LEI-DLO).
Poppe, K. J., Beers, G. and de Putter, I. (1999) PACIOLI 6: Models for data and data
for models. Workshop report. Agricultural Economics Research Institute (LEI), The
Hague.
Poppe, K. J. (ed.), Boone, K. (ed.) and Teeuwen-Vogelaar, C. (ed.) (2007) PACIOLI
14: Changes in farming and the effects on FADNs. Agricultural Economics Research
Institute (LEI), The Hague.
Poppe, K. J., Boone, K. and Teeuwen-Vogelaar, C. (ed.) (2008) PACIOLI 15
workshop presentations: Integration of farm accounting in research and statistics.
Agricultural Economics Research Institute (LEI), The Hague.
Poppe K. J. and Meeusen, M. J. G. (2000) Using a Farm Accountancy Data Network in
data management for LCA. In: Beers, G., Poppe, K. J. and de Putter, I. (200)
PACIOLI 7: Agenda 2000 and the FADN agenda. Workshop report. Agricultural
Economics Research Institute (LEI,) The Hague.
Poppe, K. J., Povellato, A. and Krijgsman, K. (2003) PACIOLI 10: European farmers
and the growing of data. Agricultural Economics Research Institute (LEI), The
Hague.
Puurunen, M. (2005) Comparability of the income concepts according to the agricultural
statistics in Finland. In Poppe, K. J. (ed.) PACIOLI 13: Microeconomic Data on Farm
Diversification, Rural Businesses and Intra-generational Transfer. Agricultural
Economics Research Institute (LEI), The Hague.
Puurunen M. and Seppälä, R. A. (2004) Classification and economic results of part
time and full time farms using taxation data. In: Poppe, K. J. (2004b) PACIOLI 12:
Income issues in Farm Households and the Role of the FADN. Agricultural Economics
Research Institute (LEI), The Hague.
Reinsson, L. (2008) Comparing organic and conventional dairy producers in Sweden
using FADN data. In: Boone, K. and Teeuwen, C. (2009) PACIOLI 16: Changing
agricultural markets: Consequences for FADN. LEI Wageningen UR, Den Haag.
Reinsson, L. (2009) Change of valuation method for buildings in Swedish Farm
Accountancy Data Network, FADN. In: Boone, K. and Teeuwen, C. (eds) (2009)
PACIOLI 17: Innovation in the management and use of Micro Economic Databases in
Agriculture. LEI Wageningen UR, The Hague.
Reuillon, J., Charroin, T. and Perrot, C. (2008) Coût de production du lait. Recherche
d’une méthode de calcul applicable aux exploitations laitières diversifiées Françaises
et utilisable pour des comparaisons internationales. Institut de l’élevage, Paris.
Samson, E., van der Werf, H., Dupraz, P., Ruas, J. F. and Corson, M. (2012)
Estimer les impacts environnementaux des systèmes de production agricole par
Study on cost of and good practices for FADN data collection
159
analyse de cycle de vie avec les données du Réseau d’information comptable agricole
(RICA) français. Cahiers Agricultures, 21(4): 248-257.
Service d’Economie Rurale (no date) FADN in Luxembourg - specifities of FADN in a
small country.
Tacquenier, B. (2009) Datawarehouse. In: Boone, K. and Teeuwen, C. (eds) (2010)
PACIOLI 18: Proceedings of the 18th international workshop on micro-economic
databases in agriculture. LEI, part of Wageningen UR, The Hague.
Taragola, N. (1999) Use of the FADN for modelling relations between management and
firm results at Belgian glasshouse holdings. In: Poppe, K. J., Beers, G. and de
Putter, I. (1999) PACIOLI 6: Models for data and data for models. Workshop
report. Agricultural Economics Research Institute (LEI), The Hague.
Tanton, A. (1996) Annex 1 Farm Business Survey; Collection and Processing of Farm
Accounts Data in the UK. In: Beers, G. (ed.), Poppe, K. J. and Pruis, H. C.
(1996) PACIOLI 3: Need for change. Workshop Report. June 1996. Agricultural
Economics Research Institute (LEI-DLO).
Tommasi, I. and D’Orazio, M. (2014) Controllo e valutazione della qualità dei dati
nell’indagine sui risultati economici delle aziende agricole Rica-Rea.
Agriregionieuropa, anno 10 n°36, Mar 2014.
USDA (2015) ARMS Progress Report USDA’s National Agricultural Statistics Service and
Economic Research Service Response to Recommendations by the Agricultural
Resource Management Survey Review Panel. April 2015.
Vajna, A. (2001) The Hungarian FADN accounting system. In: Beers, G., Poppe, K. J.
and Leuftink, A. (2001) PACIOLI 8: Innovations in the FADN. Agricultural
Economics Research Institute (LEI), The Hague.
van Lierde, D. and Taragola, N. (2000) The Belgian FADN as a data source for
environmental indication. In: Beers, G., Poppe, K. J. and de Putter, I. (2000)
PACIOLI 7: Agenda 2000 and the FADN agenda. Workshop report. Agricultural
Economics Research Institute (LEI,) The Hague.
van Lierde, D., Vandenberghe, A. and Cools, A.-M. (2007) The use of FADN in the
study on the use of plant protection products and nutrients in horticulture in
Flanders. In: Poppe, K. J. (ed.), Boone, K. (ed.) and Teeuwen-Vogelaar, C.
(ed.) (2007) PACIOLI 14: Changes in farming and the effects on FADNs.
Agricultural Economics Research Institute (LEI), The Hague.
Various (2013) PACIOLI 21: International cooperation in FADN. Collection of papers
from the 21 PACIOLI meeting:
http://www.pacioli.org/WorkShopDetails.aspx?WS=25.%20
Various (2014) PACIOLI 22: Innovations in farm level data. Collection of papers from
the 22 PACIOLI meeting: http://www.pacioli.org/WorkShopDetails.aspx?WS=27.
Vrolijk, H. (ed.) (2012) PACIOLI 19: The role of FADN after the CAP reform. LEI, part of
Wageningen UR, The Hague.
Vrolijk, H. (ed.) (2013a) PACIOLI 20: Complex farms and sustainability in farm level
data collection. LEI Wageningen UR, The Hague.

Study on cost of and good practices for FADN data collection
160
Vrolijk, H. (2013b) Sample design and weighting: implications of broadening data
collection. FADN committee meeting, RICC 1688. November 8, 2013.
Wesseler, G. (2015) EU-FADN – 50 years of measuring farm income. Conference “EU-
FADN – 50 years of providing information for the CAP”. 11 June, 2015. DG AGRI
E.3.
Westerhof, E. (2013) Cooperative Software Development Possibilities for FADN? 21
PACIOLI Workshop, Sweden. September 22-25, 2013.
Williams, N., Bailey, A. and Dedman, S. (1995) Information disparities in the
FADN/RICA - causes and consequences. In: Beers, G. (ed.), Poppe, K. J.,
Spiering, D. F. and Pruis, H. C. (1995) PACIOLI 1: Farm accountancy data
networks and information analysis. Workshop Report. August 1995. Agricultural
Economics Research Institute (LEI-DLO).
Woodend, A. (2011) Farm Business Survey. In: Vrolijk, H. (ed.) (2012) PACIOLI 19:
The role of FADN after the CAP reform. LEI, part of Wageningen UR, The Hague.
Woodend, A. (2012) Distribution of farm resources and factors associated with better
efficiency. In Vrolijk, H. (ed.) (2013) PACIOLI 20: Complex farms and sustainability
in farm level data collection. LEI Wageningen UR, The Hague.

161
KF-0
1-1
5-5
05-E
N-N


