1
Doing Business in South African
Ports
– World Bank Study 2015
Prepared by Simone M Smith-Godfrey CSIR/ Built Environment Transport, Systems and Operations Transport and Freight Logistics

2
Contents
1. Introduction and Background
2. Costs of Doing Business in Our Ports
3. Our Ports’ Points of Performance
3
1. Introduction and Background

4
Introduction – What is the Ratio
Decidendi of Ports?
• Ports compete to attract a place in the schedule of the ocean liners.
• Ports compete by investing in new quays, by ensuring good access from the
sea, or by moving new quays closer to the sea.
• Ports try to improve the strategic advantages of ports by improving the
hinterland infrastructure, to ensure that shipments can reach the port and
the hinterland without delay and by ensuring deep-sea access.
• Ports need to decide:
– traditional role of landlord and infrastructure provider
– supply chain perspective by deliberately and pro-actively analyse goods flow developments and adapt an infrastructure with partners in the hinterland and other ports (Notterboom 2004, Robinson 2002)
5
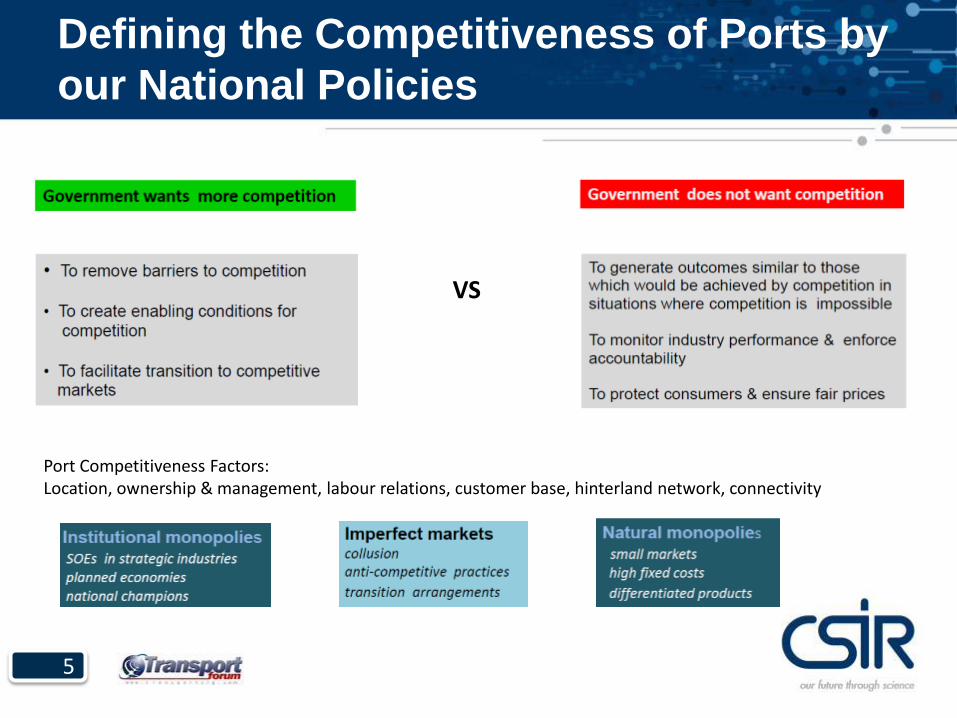
Defining the Competitiveness of Ports by
our National Policies
VS
Port Competitiveness Factors: Location, ownership & management, labour relations, customer base, hinterland network, connectivity
6
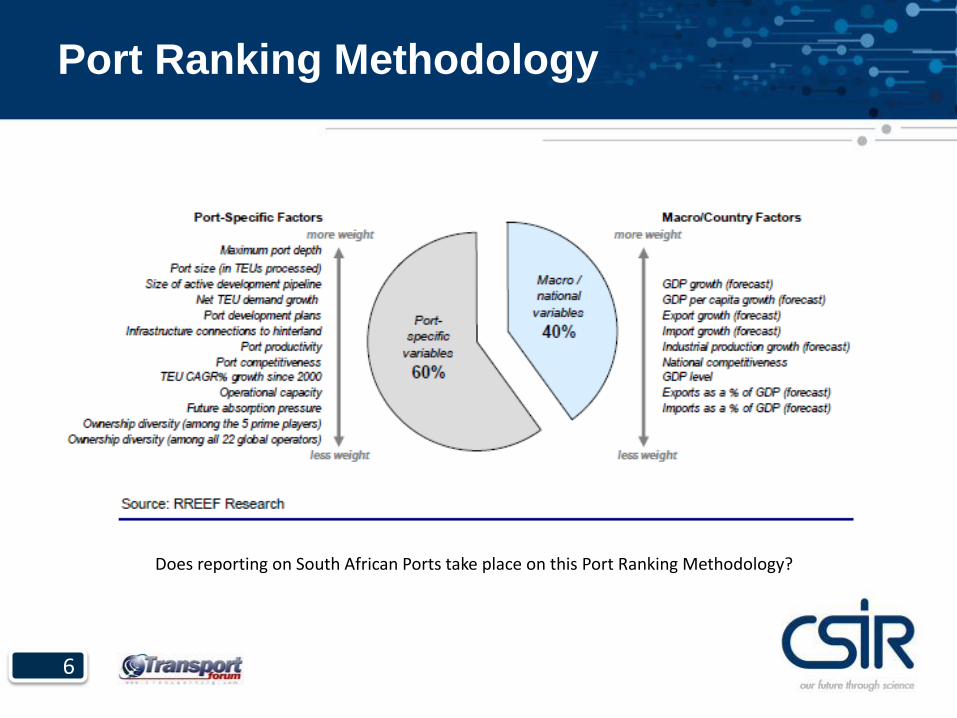
Port Ranking Methodology
Does reporting on South African Ports take place on this Port Ranking Methodology?

7
2. Costs of Doing Business in Our Ports
8
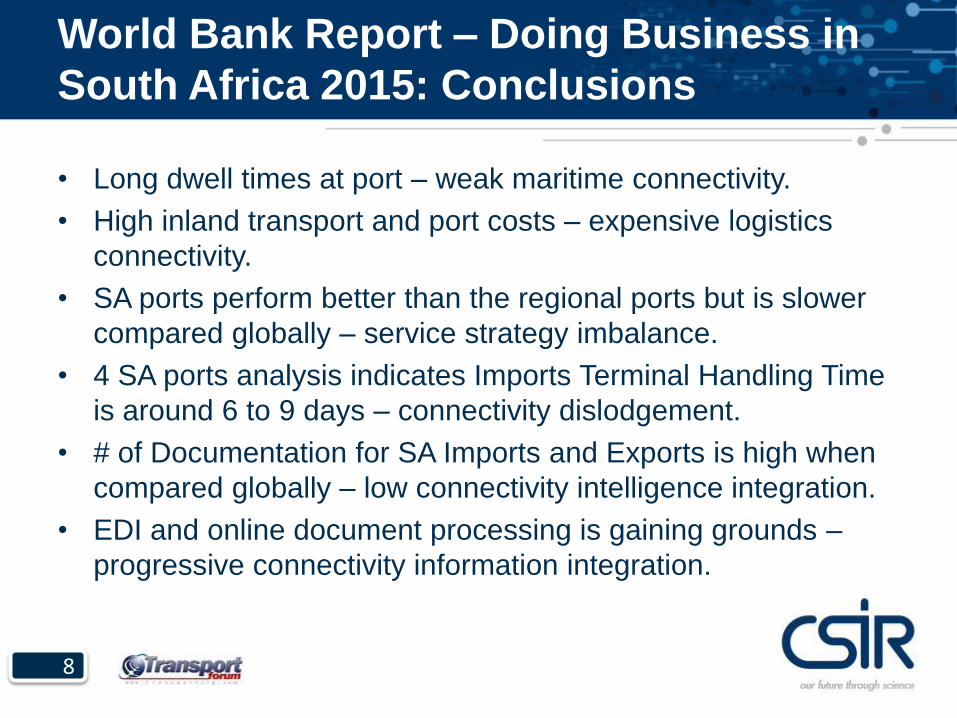
World Bank Report – Doing Business in
South Africa 2015: Conclusions
• Long dwell times at port – weak maritime connectivity.
• High inland transport and port costs – expensive logistics
connectivity.
• SA ports perform better than the regional ports but is slower
compared globally – service strategy imbalance.
• 4 SA ports analysis indicates Imports Terminal Handling Time
is around 6 to 9 days – connectivity dislodgement.
• # of Documentation for SA Imports and Exports is high when
compared globally – low connectivity intelligence integration.
• EDI and online document processing is gaining grounds –
progressive connectivity information integration.

9
SA’s Weak and Expensive Maritime
Connectivity
Figure and Table Referencing used as per Doing Business in South Africa 2015 – The World Bank Report

10
Demonstration SA’s Low Connectivity
Intelligence Integration - Competitiveness

11
SA’s Maritime and Logistics Connectivity
Dislodgement
As these are two separate activities, time spent could be run alongside each other, instead of consecutively
Is this an indication of Pre Clearance not achieving its goal?
Is this an indication of Transport Mode Imbalances?
12
3. Our Ports’ Points of Performance

13
Longstanding Measurement
8
1 3
4
6
5
% Maritime Connectivity – Based on The Victoria Transport Policy Institute definition of Connectivity, this is defined as the density of connections in sea lane networks and the directness of the transhipment links. The more direct sea lane and transhipment routes are, the higher the Connectivity Index of the Port.
% Logistics Connectivity - The Victoria Transport Policy Institute defines Connectivity as the density of connections in transport networks and the directness of the connecting links. The more direct travel and transit routes are, the higher the Connectivity Index of the Transport Sector.
2
Inspection Measurement
Port Intelligence
Measurement
9
7
Linking Ports Costs to Ports Points of
Performance
14
Conclusion – Questions Posed
• Where is South Africa in understanding the impact of its
maritime connectivity to its inland logistics connectivity?
• Where is SA in linking its Port Intelligence to its Ports
Points of Performances?
• Is the Cost of Business in Ports linked to the Points of
Performances in our ports?