

Jarkko Niemi and Jaakko Heikkilä
MTT Agrifood Research Finland
Costs of biosecurity and factors
contributing to biosecurity in Finland
9.5.2014
Nordic-Baltic seminar on Biosecurity: experiences, training, motivation and economic aspects
Johannesberg Castle, Sweden, 6-8 May 2014,
Outline
• Introduction
• Factors contributing to the use of biosecurity
• Producer perceptions and estimates on the costs of
biosecurity
• Are economic incentives an issue?
• Simulation results
• Conclusions
9.5.2014 © MTT Agrifood Research Finland 2
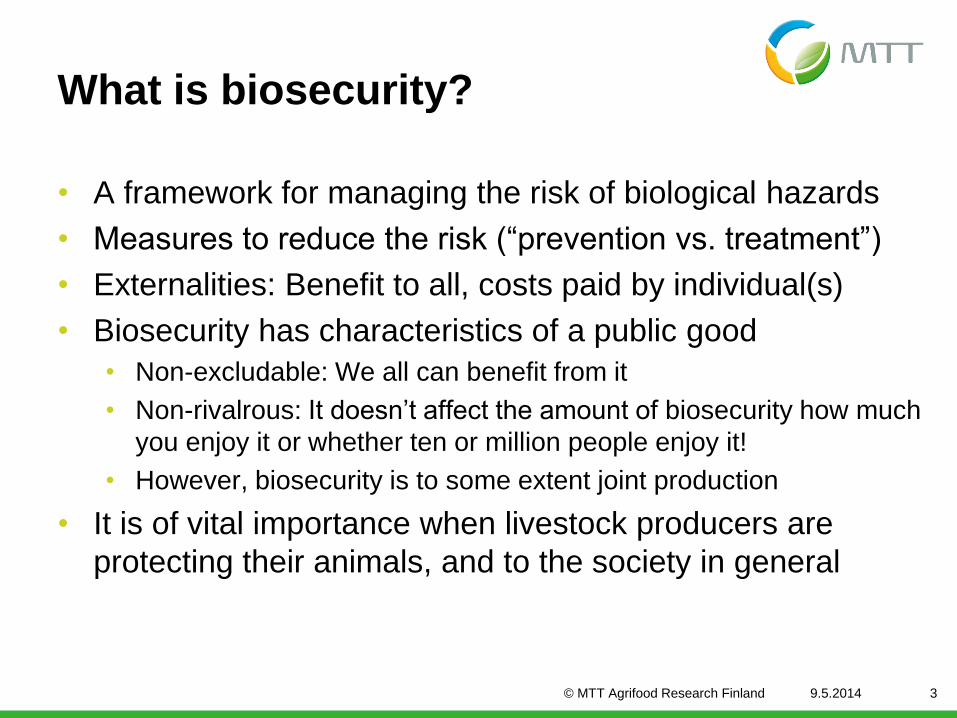
What is biosecurity?
• A framework for managing the risk of biological hazards
• Measures to reduce the risk (“prevention vs. treatment”)
• Externalities: Benefit to all, costs paid by individual(s)
• Biosecurity has characteristics of a public good
• Non-excludable: We all can benefit from it
• Non-rivalrous: It doesn’t affect the amount of biosecurity how much
you enjoy it or whether ten or million people enjoy it!
• However, biosecurity is to some extent joint production
• It is of vital importance when livestock producers are
protecting their animals, and to the society in general
9.5.2014 3 © MTT Agrifood Research Finland

Biosecurity
Food safety
Environmental health
- invasive alien species
(e.g. lupine)
Animal health
- non-zoonotic animal diseases (e.g.
Classical Swine Fever, bluetongue)
Plant health
- plant pests and diseases
(e.g. Colorado potato beetle,
sweetpotato whitefly)
Human health
- foodborne microbes
(e.g. salmonella, E. coli,
Listeria, campylobacter)
- diseases in cooked meat (e.g.
CJD/BSE)
- diseases in uncooked meat (e.g.
Newcastle disease, avian
influenza)
Human health
- non-foodborne zoonotic
diseases (e.g. bubonic plague,
rabies)
Dietary safety
(excessive or exiguous accumulation) Human health
Foodborne accumulating
substances
- fat
- salt
- sugar
Human health
Foodborne accumulating
chemical substances
- dioxin
- acryl amide
- pesticide residue
- heavy metals
- food additives
HUMAN HEALTH
Human health
- sports
- way of life
- stress
ENVIRONMENTAL HEALTH
Human health
- Physical risks (radiation, noise, temperature)
- Chemical non-foodborne risks (environmental pollutants, toxic substances)
SECURITY AND SAFETY
Environmental safety
- Natural forces (flood, drought,
earthquake, tsunami, fire, avalanche)
- Social hazards (terrorism, sabotage,
mass hysteria, violence)
- Multiple hazards (combinations,
infrastructure, large constructions, etc.)
Social health
- various diseases and species
Human health
- food-borne acute chemical substances
- physical safety of food (e.g. radiation,
foreign objects)
Human health
Foodborne substances
acquired in deficient quantities
- vitamins
- minerals
- iron
- etc.
Peltola and Heikkilä

Decision-making & biosecurity
• Decision-maker should have sufficient incentives to take
a biosecurity measure • Farmers may be reluctant to take very costly biosecurity measures
• Poor biosecurity by one stakeholder may frustrate others
• In some cases, it may be more beneficial for a livestock producer to
allow poor biosecurity as s/he may be better off if the animals are culled
• Cognitive dissonance • Low probability-high consequence events may be underestimated
• Decision on biosecurity is state-dependent • The more likely or more severe the threat, the more likely is decision-
maker to take extra measures
• Risk aversion– if the benefits of biosecurity are uncertain, the measures
might not be taken
9.5.2014 © MTT Agrifood Research Finland 5

Costs and benefits of biosecurity
can change over time
9.5.2014 © MTT Agrifood Research Finland 6
Impact
Time
Pre
vention
Era
dic
ation
Conta
inm
ent
Asset
pro
tection

Factors contributing to biosecurity
• Next few slides are based on two different surveys
• Finnish pig and cattle farms (Sahlstöm et al., 2014)
• Finnish pig and poultry farms (Heikkilä and Niemi, 2012)
• We have examined how different factors contribute to
• The use of biosecurity measures among respondents and how
• Farm-specific factors are related to the costs of adopting these
measures
9.5.2014 © MTT Agrifood Research Finland 7

Costs of use affect biosecurity
9.5.2014 © MTT Agrifood Research Finland 8
Wear protective
clothing
Verify health of
incoming animals
Pigfarm + + +Full-time farmer + +Female respondent + +Farm has a production contract + +Farm size increases by one SD +Highly educated +Intentions to expand +Suckler cow farm - - + +Not engaged in continuous training - -Costs increase by one SD - -

Costs and implementation are
linked to each other
5/9/2014 © MTT Agrifood Research Finland 9
0,0
0,2
0,4
0,6
0,8
1,0
Like
liho
od
Verify health
status
Wear protective clothing
Very low costs
per measure
Costs at an
average level
Very high costs
per measure
Pro
bab
ilit
y o
f
au
sin
g t
he m
easu
re

Farms with disease history usually pay
more attention to some measures
9.5.2014 © MTT Agrifood Research Finland 10
0 % 20 % 40 % 60 % 80 % 100 %
Separate loading room
Room cleaned after use
Everybody entering the facility to change boots and clothes
Used protective clothing
Feed storage and equipment cleaned frequently
Feeds purchased from selected partners only
Use carcass container
Participates in training
Pigs, no disease
Pigs, disease
Poultry

The costs of biosecurity measures
9.5.2014 © MTT Agrifood Research Finland 11
Extra labour input
Materials (protective clothing, disinfectants etc.)
Extra services needed (e.g. vets inspecting animals, cleaning, transports)
Impacts on prices of inputs (e.g. certified feed may be more expensive)
Consequential costs due to changes in business management
Other costs

Producers’ perceptions about the costs
9.5.2014 © MTT Agrifood Research Finland 12
In a recent survey pig and cattle producers estimated that the use of protective clothing or boots typically costs 100-200 €/year/farm
The costs of changing clothes always when entering the facility usually range from about 100 € to about 2000
€/farm/year
The costs of verifying the health of animals coming to
the farm was usually less than 2000 €/farm/year
Measures which require investments can cause substantial costs (e.g. compartmentalization, separate loading room)
Measures require different resources

Different background factors contribute
to the perceived costs
Perceived costs usually decreased by
• Previous experience on the measure
• Female respondent
• Newer animal shelter
• Older respondent
• Low education
• Plans to expand
Perceived costs usually increased by
• Larger farm size
• Full-time farmer
• Producer not engaged in continuous training
• Contracts made by the farm
• (Low education)
• (Plans to expand)
9.5.2014 © MTT Agrifood Research Finland 13

Ensuring food safety carries a cost
• In the early 2000’s Kilpeläinen et al. estimated that the
costs of food safety (mitigating zoonotic diseases) at the
farm level costs roughly as follows • Milk 4.38 cents/kg
• Pigmeat 14.9 cents/kg
• Broiler meat 10.51 cents/kg
• Eggs 0.18 cents/kg
9.5.2014 © MTT Agrifood Research Finland 14

The costs of preventive biosecurity
at the poultry farm level
• Siekkinen et al. (2008): Semi-structured phone survey of Finnish broiler producers and hatching egg producers
• Broiler farms • 3,55 euro cent / bird (90% confidence interval 2,56-4,40)
• 2,54 euro cent / kg
• 4,64 euro / m²
• 0,10 euro cent / bird / rearing day
• Hatching egg farms • 75,73 euro cent / bird (90% confidence interval 39,3-115,5)
• 4,19 euro / m²
• 0,27 euro cent / bird / rearing day
• A batch of 75,000 broilers -> total cost 2 700 euro
Siekkinen et al. 2012
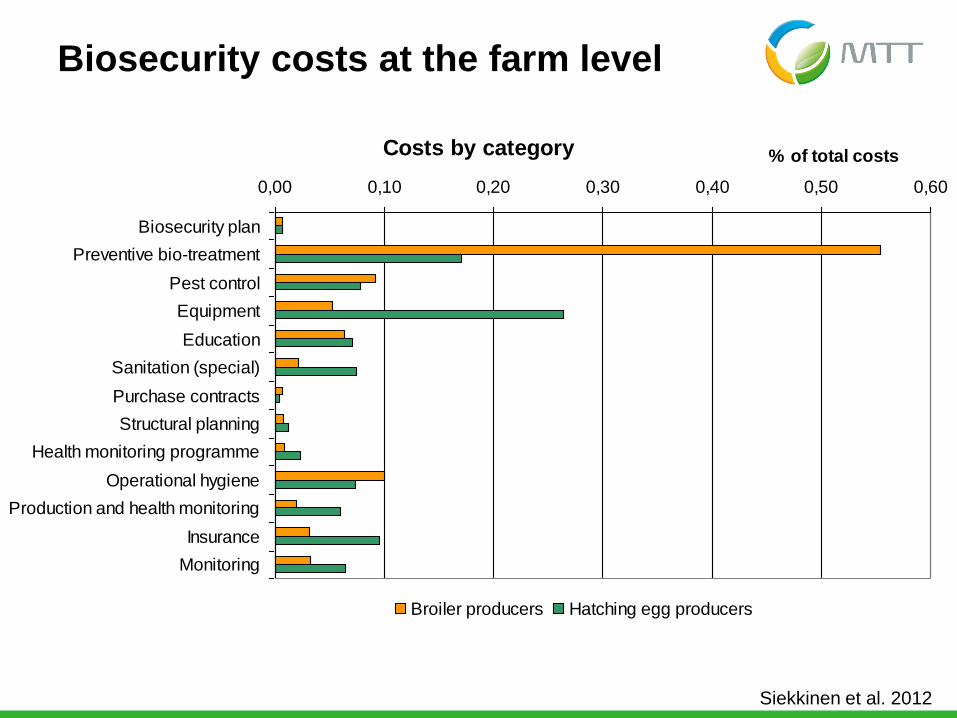
Biosecurity costs at the farm level
Siekkinen et al. 2012
Costs by category
0,00 0,10 0,20 0,30 0,40 0,50 0,60
Biosecurity plan
Preventive bio-treatment
Pest control
Equipment
Education
Sanitation (special)
Purchase contracts
Structural planning
Health monitoring programme
Operational hygiene
Production and health monitoring
Insurance
Monitoring
% of total costs
Broiler producers Hatching egg producers

The costs of preventive biosecurity
at the farm level
• Preventive biosecurity (Siekkinen et al. 2011)
• Approximately 2% of total production costs
• Work time represents some 8% of total work time on
broiler farms and about 5% on broiler breeder farms
• Compare to cost of vaccination
• Organic turkey vaccination against erysipeloid, cost of
vaccination (substance + labour) 0,63–0,68 euro per
bird (Schulman et al. 2014)
• Vaccination against Newcastle Disease in poultry 0.32
euro per bird (Ek-Kommonen et al. 2005)
Siekkinen et al. 2012

How does the cost vary? Regression 1 Regression 2 Regression 3
Dependent variable Total cost per bird Direct cost per bird Labour cost per bird
Intercept 3.673
(p=0.000)
2.417
(p=0.000)
1.256
(p=0.001)
Annual number of birds -0.00000235
(p = 0.004)
-0.0000007353
(p = 0.190)
-0.00000161
(p = 0.031)
Processor B (dummy) 0.945
(p = 0.006)
0.592
(p = 0.025)
0.353
(p = 0.244)
Processor C (dummy) 0.582
(p = 0.028)
0.339
(p = 0.100)
0.243
(0.326)
Female producer 0.528
(p = 0.026)
0.090
(p = 0.606)
0.438
(p = 0.060)
Regression statistics F = 11.437
Sig. = 0.000
R2 = 0.792
F = 2.602
Sig. = 0.089
R2 = 0.465
F = 5.028
Sig. = 0.013
R2 = 0.626
5/9/2014 © MTT Agrifood Research Finland 18 Siekkinen et al. 2012

Restrictive measures upon
a highly contagious animal disease
• An important cost item can be that biosecurity measures can disrupt
the production process (Niemi et al. 2004)
• A producer may be financially better off if the animals are culled and
compensated than if s/he applies stringent biosecurity in the face of
business disruptions
• Potential incentive problem – Is the producer enough motivated to take
care of biosecurity?
19 Time until slaughter if business-as-usual
0
5
10
15
20
25
Five weeks
Three weeks
One week Slaughter day
Loss
€/p
ig s
pac
e u
nit
Culled
Not culled
• Substantial indirect costs
(revenue losses) must be
taken into account

WHAT ABOUT THE BENEFITS
AND PRODUCER’S BEHAVIOUR?
9.5.2014 © MTT Agrifood Research Finland 20

Benefits of biosecurity
• More stable business
• Healthier animals and safer food!
• The benefits of biosecurity are caused by lower costs of
disease – i.e. losses that can be avoided by putting effort
on their prevention
9.5.2014 © MTT Agrifood Research Finland 21

A case-study (simulation) to illustrate
the benefits of improved biosecurity
• Foot and Mouth disease used as an example because the
data were readily available • Simulations based on models represented by Lyytikäinen et al. (2012)
• In the following slide we illustrate how a decrease in the
probability of infection on one farm could decrease losses
• Assume that the probability of infection would decrease either by
25% or by 50 % decrease
Assess how that could affect to the losses caused by the disease
5/9/2014 © MTT Agrifood Research Finland 22
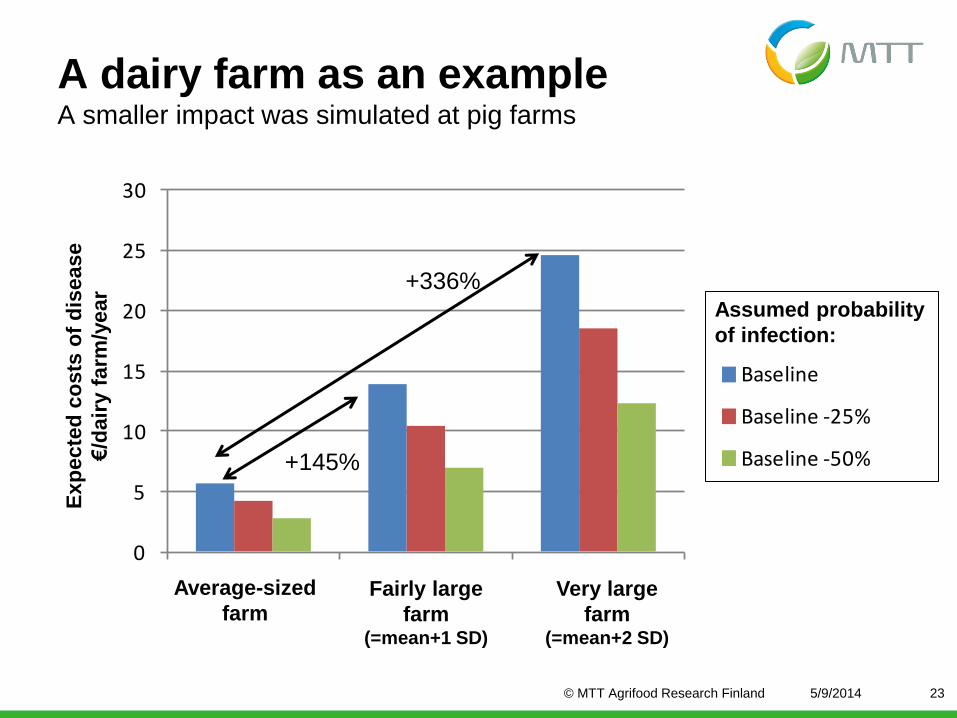
A dairy farm as an example A smaller impact was simulated at pig farms
5/9/2014 © MTT Agrifood Research Finland 23
0
5
10
15
20
25
30
Average size Average+1 standard deviation
Average+2 standard
deviations
€/D
airy
far
m/y
ear
Baseline
Baseline -25%
Baseline -50%+145%
+336% Assumed probability
of infection:
Average-sized
farm Fairly large
farm (=mean+1 SD)
Very large
farm (=mean+2 SD)
Exp
ecte
d c
osts
of
dis
ease
€/d
air
y f
arm
/year
Putting the incentives right
• Many decisions to combat contagious animal diseases are
made by individual producers, without government being
able to control for their decisions
• Instead of choosing actual measures, society can design a
scheme which provides producers with incentives to
choose mitigation actions that benefits society too
• The next slides represent a simulation-based example
about the role of economic incentives
9.5.2014 © MTT Agrifood Research Finland 24

Incentives to voluntarily reduce contacts
between farms during an FMD outbreak
9.5.2014 © MTT Agrifood Research Finland 25
27
28
29
0 500 1000
Co
sts
of F
MD
ou
tbre
ak t
o
soci
ety
mil
lio
€o
n a
vera
ge
Cost of biosecurity EUR/week/farm
Without scheme
With scheme
1. Without any extra incentives
2. With compensations paid only to farms which take measures to
reduce the probability of infection (whether this option is used, is
decided individually by the each farm)
Providing extra incentives
can help to reduce the
costs of disease
Exp
ecte
d c
osts
of
FM
D
€ m
illio
n

0 %
20 %
40 %
60 %
80 %
100 %
week 1 Week 2 Week 3
Co
ve
rag
e in
re
lati
on
to
ze
ro-c
os
t s
ce
na
rio
Period
With scheme
Without
While the costs may decrease a little,
the use of biosecurity may increase a lot
9.5.2014 © MTT Agrifood Research Finland 26
An example on how providing
extra incentives can help to
improve biosecurity
Perc
en
tag
e o
f fa
rms
usin
g
a b
iosecu
rity
measu
re

Conclusions
• Economics of biosecurity is more than cost-benefit analysis
• The costs vary by the type of measure and farm
• Simple practices can be quite inexpensive
• The costs increase by farm size
• The costs per animal seem to be lower on large farms (economies of
scale?)
• Motivation, attitudes and skills matter
• The use of biosecurity depends on farm-specific factors such as
production type and farm size
• High costs and lack of education reduce biosecurity
• Economic incentives matter, because the use of biosecurity is often
decided by the producer
• Compensation and payment policies can promote biosecurity
9.5.2014 © MTT Agrifood Research Finland 27

Thank you for your attention!
This presentation is based on results of research projects carried out by MTT.
The authors gratefully acknowledge fruitful collaboration with Evira, and funding
from the Ministry of Agriculture and Foresty to research in this field. For further
information, please contact: [email protected] or [email protected]
28
NJF seminar: Economics of Animal Health and Welfare 2-3 October 2013, Hämeenlinna, Finland http://www.njf.nu/ => Upcoming seminars
Erasmus-network to enhance the use of
economics in animal health www.neat-network.eu


