

Local Financial Impact Review – Issued January 17, 2017
Costs, Regulation, and Financing of Massachusetts Water Infrastructure: Implications for Municipal
Budgets
State House Room 230 Boston, MA 02133 [email protected] www.mass.gov/auditor

January 17, 2017 His Excellency, Charles D. Baker, Governor The Honorable Karyn E. Polito, Lieutenant Governor The Honorable Stanley C. Rosenberg, President of the Senate The Honorable Robert A. DeLeo, Speaker of the House Honorable Members of the General Court Dear Colleagues: It is my privilege to submit this study of costs, regulation, and financing of Massachusetts water infrastructure—and their implications for local budgets. This study was undertaken pursuant to Section 6B of Chapter 11 of the Massachusetts General Laws, which grants the Office of the State Auditor’s Division of Local Mandates (DLM) authority to review any law or regulation that has a significant financial impact on local government. I would like to offer my sincere appreciation to the hundreds of municipal and water district officials who took time from their other professional obligations to complete the survey. Their generosity in devoting time and energy to this survey is yet another example of the service they provide daily to their fellow citizens. Most of us take our water systems for granted; the hard work of these public employees makes it possible for us to do so. I hope the information contained in this report will assist you in enhancing state law, policies, and procedures that directly affect the resources and revenues of the local governments and regional agencies that oversee the infrastructure that ensures the quality, abundance, and sustainability of our commonwealth’s precious water resources. Copies of the report are available on OSA’s website, www.mass.gov/auditor, or by calling DLM at (617) 727-0025. Please don’t hesitate to reach out to my office with any questions or comments. As always, thank you for your continued support of our shared effort to improve the success, accountability, transparency and efficiency of Massachusetts state government. Sincerely,
Suzanne M. Bump Auditor of the Commonwealth

Costs, Regulation, and Financing of Massachusetts Water Infrastructure: Implications for Municipal Budgets Table of Contents
i
TABLE OF CONTENTS
LIST OF ABBREVIATIONS ........................................................................................................................................ II
ABOUT THE DIVISION OF LOCAL MANDATES ........................................................................................................ III
EXECUTIVE SUMMARY ........................................................................................................................................... 1
SITUATIONAL ANALYSIS ......................................................................................................................................... 5
FINDINGS AND POLICY RECOMMENDATIONS ...................................................................................................... 25
APPENDIX A ......................................................................................................................................................... 38
APPENDIX B ......................................................................................................................................................... 50

Costs, Regulation, and Financing of Massachusetts Water Infrastructure: Implications for Municipal Budgets List of Abbreviations
ii
LIST OF ABBREVIATIONS
CWT Massachusetts Clean Water Trust
CSO Combined Sewer Outfall DCAMM Massachusetts Division of Capital Asset Management and Maintenance DCR Massachusetts Department of Conservation and Recreation DEP Massachusetts Department of Environmental Protection DFG Massachusetts Department of Fish and Game DBE Disadvantaged Business Enterprises DLM Division of Local Mandates EEA Massachusetts Executive Office of Energy and Environmental Affairs EPA United States Environmental Protection Agency FY Fiscal Year MassCEC Massachusetts Clean Energy Center MFN Mansfield-Foxborough-Norton Regional Wastewater District MMA Massachusetts Municipal Association MS4 Municipal Separate Storm Sewer System MWRA Massachusetts Water Resources Authority MWWA Massachusetts Water Works Association NPDES National Pollutant Discharge Elimination System OSA Office of the Massachusetts State Auditor OSD Massachusetts Operational Services Division P3 Public Private Partnership SCADA Supervisory Control and Data Acquisition SRF State Revolving Fund SWMI Sustainable Water Management Initiative USDA United States Department of Agriculture USDM United States Drought Monitor WMA Water Management Act

Costs, Regulation, and Financing of Massachusetts Water Infrastructure: Implications for Municipal Budgets About the Division of Local Mandates
iii
ABOUT THE DIVISION OF LOCAL MANDATES
The Division of Local Mandates (DLM) was established by Proposition 2½, an initiative to limit property
tax increases, in order to determine the financial impacts of proposed or existing state laws, regulations,
and rules on cities and towns. Proposition 2½ limits a city or town’s authority to raise real estate and
personal property taxes. Under the strict limits on taxing authority set by Proposition 2½, cities and towns
could no longer simply raise property taxes to fund state-mandated programs. Thus, DLM was created to
respond to municipal petitions to determine whether a state mandate falls within the purview of the Local
Mandate Law.
The Local Mandate Law, Section 27C of Chapter 29 of the Massachusetts General Laws, generally provides
that post-1980 laws, regulations, or rules that impose service or cost obligations on cities, towns, regional
school districts, or educational collaboratives and meet certain thresholds shall be effective only if locally
accepted or fully funded by the Commonwealth. Any protected party aggrieved by such a law, regulation,
or rule may petition DLM for a determination of whether the law, regulation, or rule constitutes a mandate
and to make a cost determination of the state funding necessary to sustain a mandate.
In 1984, the Massachusetts General Court expanded DLM’s powers of review by authorizing DLM to
examine any state law or regulation that has a significant local cost impact, regardless of whether it
satisfies the more technical standards under the Local Mandate Law. This statute is codified as Section 6B
of Chapter 11 of the Massachusetts General Laws. As a result of this law, DLM releases reports known as
“municipal impact studies” or “6B reports” examining various aspects of state law that may impact
municipalities.
Through these functions, DLM works to ensure that state policy is sensitive to local fiscal realities so that
cities and towns can maintain autonomy in setting municipal budget priorities.

Costs, Regulation, and Financing of Massachusetts Water Infrastructure: Implications for Municipal Budgets Executive Summary
1
EXECUTIVE SUMMARY
In Massachusetts, water infrastructure of all kinds—drinking water, wastewater, and stormwater
systems—is primarily a local responsibility. The Division of Local Mandates (DLM) within the Office of the
State Auditor (OSA) has undertaken this Municipal Impact Study to examine the financial impact on local
governments of infrastructure costs associated with water systems, supplies, and quality. This study is
based on an extensive survey of Massachusetts’s municipalities concerning their experience of costs
associated with state and federal regulation of locally-owned and operated water infrastructure systems.
The survey also inquired about municipal utilization of state and federal loan and grant programs, and
sought estimates of the impacts of newly implemented regulatory frameworks associated with the federal
government’s Municipal Separate Storm Sewer System (MS4) permits.
The findings suggest that state government can create a more stable, holistic approach to water
infrastructure, giving municipalities greater levels of confidence and encouragement to invest in water
infrastructure improvements. Some of these involve additional investment at the state level so that
municipalities do not bear the entire burden. Other reforms are regulatory, since a predictable, consistent,
and collaborative regulatory framework will encourage municipalities to commit more resources to much-
needed water system improvements.
A legislatively mandated 2012 study by the Massachusetts Water Infrastructure Finance Commission
estimated that, at that time, there was a $20.4 billion gap in water infrastructure funding, which is largely
the responsibility of local governments. The Commission Report made a series of recommendations
concerning potential strategies for closing the gap, including a larger role for state dollars. The
Commission also called for policies at the state level that would offer financial incentives and regulatory
flexibility in order to encourage greater adoption of regional solutions, technological innovation, and
public-private partnerships.
Four years later, and in light of the significant local cost implications of municipal water infrastructure,
DLM decided to revisit and supplement the findings contained in the Commission Report with a fresh
study. In addition, DLM wanted to obtain data about how the Commonwealth might best encourage
enhanced local investment in water quality, supplies, and systems by fostering a more stable regulatory
and fiscal environment.

Costs, Regulation, and Financing of Massachusetts Water Infrastructure: Implications for Municipal Budgets Executive Summary
2
To accomplish this task, DLM invited all 351 cities and towns in Massachusetts to participate in a survey
on local water system investments and funding sources. A total of 146 cities and towns submitted
completed surveys, representing 42% of the state’s municipalities. Respondents include 88% of all cities
and towns with populations greater than 50,000.
Below is a summary of our findings and recommendations, with links to each page listed.
Finding 1 Page 25
Massachusetts communities have combined water system spending needs in excess of $17 billion, including $7.24 billion for clean water delivery, $8.99 billion for wastewater treatment and handling, and $1.58 billion for stormwater management.
Recommendation Page 28
Given the continuing decline of overall state aid as a share of local budgets, the Legislature should expand the State Revolving Fund (SRF) as administered by the Clean Water Trust to provide full grants in addition to its current practices of low-interest loans and limited principal forgiveness for cities and towns undertaking water system repairs and enhancements. This finding also supports a recommendation contained in the Massachusetts Water Infrastructure Commission report that the Commonwealth establish a new Trust Fund for water infrastructure to provide at least $50 million annually for the next ten years in direct state aid for local water infrastructure projects. This funding should be provided in addition to, and run concurrent with, current loan and grant programs, and should focus entirely on grants for eligible water infrastructure projects. In addition—and as an incentive designed to respond to Finding 3 of this study (below)—priority in allocating these funds should be given to municipalities and regional entities seeking supports for projects and programs that enhance water infrastructure regionalization.
Finding 2 Page 28
Over the next twenty years, municipalities foresee significant increases in capital, operating, and staffing costs—$1.58 billion statewide, including $240 million in additional personnel costs—for implementation of new federal stormwater management regulations.
Recommendation Page 29
To provide additional funding for stormwater-related capital and operating requirements, Massachusetts municipalities should consider the creation of dedicated stormwater enterprises similar to local water and sewer enterprises in structure, operation, and fee-based revenue streams.
Finding 3 Page 29
For most municipalities, regional collaboration on water infrastructure remains a goal rather than a reality; only 36% of survey respondents reported that they are members of regional collaborations on water infrastructure planning and management.
Recommendations Page 29
1. The Legislature should approve legislation designed to promote municipal collaboration and regionalization throughout the Commonwealth by simplifying the process of creating regional public entities that have the power to operate facilities as well as to plan across multiple municipal jurisdictions.
2. As noted in the Recommendation under Finding 1, above, a special state trust fund for water infrastructure should give priority in allocating grants to municipalities and regional entities seeking support for projects and programs that enhance water infrastructure regionalization.

Costs, Regulation, and Financing of Massachusetts Water Infrastructure: Implications for Municipal Budgets Executive Summary
3
Finding 4 Page 30
Municipalities may not be taking full advantage of current loan and grant programs; only 42% of responding communities have received water infrastructure grants or loans from Massachusetts or the federal government in the past 10 years.
Recommendation Page 31
The Commonwealth should work to enhance municipal eligibility for state loans and grants by reviewing repayment options and further expanding the capacity of state agencies to reduce or forgive interest and / or principal repayments for smaller projects. At the same time, the Commonwealth should consider additional funding in the DEP budget for expanded outreach in order to educate municipalities about the availability, terms, and benefits for current and future water infrastructure loan and grant resources.
Finding 5 Page 31
The likely impact of climate change on vulnerable water infrastructure is not receiving the attention it deserves; only 6% of survey respondents indicated that they developed any formal climate change plans or policies that affect water infrastructure systems.
Recommendation Page 32
In following up on the stated goals of its recently promulgated executive order on climate change preparedness, the Baker-Polito Administration should, by July 1, 2017, convene a statewide summit on climate change implications for municipal water infrastructure systems, especially in coastal and riverine flood plain zones. In addition, the Legislature should consider the authorization of designated funds for the purpose of providing municipalities with expert assistance in developing and implementing water infrastructure resiliency and capital investment plans related to climate change impacts.
Finding 6 Page 32
Municipalities reported a low rate of adoption for innovative technologies with the potential to reduce cost and increase efficiency in municipal water systems.
Recommendations Page 33
The Commonwealth should consider additional incentives and support in this area, including:
1. a requirement that the Operational Services Division (OSD) and the Division of Capital Asset Management and Maintenance (DCAMM) undertake comprehensive reviews of their regulations and practices in order to develop proposed changes to liability standards and procurement requirements to support easier adoption of innovative technologies to improve performance and reduce costs in water infrastructure facilities.
2. adoption of legislation that would create an “innovative communities office” within the Executive Office of Housing and Economic Development to coordinate “the introduction of cutting-edge technologies into the marketplace and incentivize the adoption of these technologies by municipalities.”
3. adoption of legislation designed to encourage local governments to explore opportunities for public-private partnerships (P3).
Finding 7 Page 34
Municipalities favor state administration of stormwater permits, with 75 (51%) of all 146 responding municipalities—and 90% of the 84 communities expressing a preference—indicating that they would rather have DEP administer the MS4 stormwater permit program.

Costs, Regulation, and Financing of Massachusetts Water Infrastructure: Implications for Municipal Budgets Executive Summary
4
Recommendations Page 36
1. The Legislature should approve legislation allowing DEP to assume responsibility for issuing MS4 stormwater permits under EPA’s National Pollutant Discharge Elimination System regulatory standards but mandate that funding for the change come from a combination of sources, including not only the state’s general appropriations but also a user fee modeled on DEP’s current Section 70 drinking water assessment and a fee paid by major point industrial and commercial sources based on impervious area or discharge flow rates, thereby minimizing cost impacts on any one state, local, or private sector source.
2. With this additional authority and the additional funding incentives outlined in Recommendations 1 and 3, above, DEP should work with municipalities to develop 10-year rolling capital investment compacts for water infrastructure in order to provide greater stability and predictability to communities in allocating water system dollars.

Costs, Regulation, and Financing of Massachusetts Water Infrastructure: Implications for Municipal Budgets Situational Analysis
5
SITUATIONAL ANALYSIS
Existing Government Infrastructure
Massachusetts’s water infrastructure systems1 are generally the
responsibility of municipal governments and local water
districts. This is not uniformly the case: There are several large-
scale examples of regional approaches to providing water
systems infrastructure in Massachusetts, notably the
Massachusetts Water Resources Authority (MWRA) and the
Cape Cod Commission. In addition, there are a number of
regional planning groups with advisory and coordinating roles in
water systems planning and management, including such
organizations as the Metropolitan Area Planning Council and
Central Massachusetts Regional Stormwater Coalition. For the
most part, however, water delivery, treatment, and
management systems are the province of individual local
governments and water districts.2
Regulation of these water systems is the responsibility of federal
and state governments. Through enforcement of the U.S. Clean
Water Act3 and several water-related state laws,4 the
Massachusetts Department of Environmental Protection (DEP)
maintains standards for water quality and water treatment.
Separately, the U.S. Environmental Protection Agency (EPA)
maintains and enforces stormwater discharge permits under the
1 For the purpose of this study, “water infrastructure” includes publicly-owned transport, treatment and discharge facilities including, pipelines, tanks, sewers, and integrated power generation sources, for clean water, wastewater, and stormwater. 2 There are also several private water supply companies in Massachusetts that provide water supplies to municipal clients. (A partial list is available from the New England Chapter of the National association of Water Companies, http://www.nawc.org/membership/chapters-and-related-groups/new-england.aspx) 3 33 U.S.C. §1251 et seq. (1972) http://www.epw.senate.gov/water.pdf 4 The Massachusetts Rivers Protection Act (Ch. 258 of the Acts of 1996); the Water Management Act (M.G.L. c. 21G); and the Wetlands Protection Act (M.G.L. c. 131, § 40)
Basic Types of Municipal Water
Infrastructure All water systems are interconnected: the
quality of drinking water that flows into a
community is directly affected by the
quality of water that reenters the
surrounding reservoirs, aquifers and
watersheds after use or runoff. In
general, however, municipal water
systems take three different forms: Potable Water Systems that
deliver tap water for drinking,
bathing, cooking etc.
Wastewater Systems that
include sanitary sewers, waste
treatment facilities, and storage
and discharge systems
Stormwater Systems to manage
storm runoff from streets,
driveways, roofs, and other
impervious surfaces.
Stormwater systems are
designed to control flooding and
may include gutters, catch-
basins, storage tanks, transport
lines, and designated zones for
filtration and reabsorption of
runoff.
Where elements of the waste- and
stormwater systems are combined (as
they still are in at least 24
Massachusetts communities),
stormwater flooding can overwhelm
treatment facilities and can result in
untreated wastewater passing directly
into rivers and coastal waters. (Citations listed as endnotes,)

Costs, Regulation, and Financing of Massachusetts Water Infrastructure: Implications for Municipal Budgets Situational Analysis
6
National Pollution Discharge Elimination System (NPDES).5 In order to ensure that municipalities are
meeting regulatory requirements, DEP and EPA may require them to make investments in new or
upgraded facilities in all areas of water infrastructure.6
Previous Recommendations—Water Infrastructure Finance Commission
In February 2012, the Water Infrastructure Finance Commission of the Commonwealth of Massachusetts
produced a landmark report entitled Massachusetts’s Water Infrastructure: Toward Financial
Sustainability.7 The commission—a bipartisan, blue-ribbon panel created by the legislature under Section
145 of Chapter 27 of the Acts of 20098—concluded that “the Commonwealth conservatively faces a $10.2
billion gap in resources for drinking water and an $11.2 billion gap in resources for clean water
(wastewater) projects over the next 20 years” while also noting that “$18 billion in stormwater investment
may be required over the next 20 years depending on federal regulatory requirements.”9
To help close these investment gaps, the Commission made specific recommendations, including:
a significant increase in state spending above then-current levels, notably “the establishment
of a new Trust Fund, to be funded annually at $200 million and used for a mixed program of
direct payments to cities and towns, low interest loans, and grants”10
assistance to municipalities, districts, and authorities in retiring existing debt through “a
newly structured debt assistance program funded at $50 – $60 million annually through the
General Fund
5 EPA, Stormwater Phase II Final Rule (revised June 2012) https://www3.epa.gov/npdes/pubs/fact2-1.pdf 6 Since its creation, DLM has received 18 requests for mandate determinations arising from water infrastructure regulation. Because state authority to regulate water quality was well-established prior to 1981, and because federal regulatory requirements are specifically exempted from Section 27C of Chapter 29 of the General Laws, DLM has never considered requirements to upgrade or enhance water infrastructure to be unfunded mandates. 7 Water Infrastructure Finance Commission, Massachusetts’s Water Infrastructure: Toward Financial Sustainability (2012) http://www.mapc.org/sites/default/files/WIFC%20Report%20Final%20.pdf 8 St. 2009, c. 27, § 145, available at https://malegislature.gov/Laws/SessionLaws/Acts/2009/Chapter27 9 Water Infrastructure Finance Commission, op. cit., p. 4 10 Water Infrastructure Finance Commission, op. cit., p. 10

Costs, Regulation, and Financing of Massachusetts Water Infrastructure: Implications for Municipal Budgets Situational Analysis
7
incentives for municipalities, districts, and authorities to use best management practices,
including enterprise funds for stormwater mitigation
incentives to encourage a more regional approach, including pooled resources and,
potentially, system integration to achieve better-scaled, cleaner, more efficient systems and
supply
encouragement of innovative technologies, energy efficiency sustainable practices, and
conservation
“Increased regulatory flexibility to better direct funding to projects that deliver the highest
public benefit,”11 including reducing regulatory barriers to innovative practices and
technologies
support for appropriate public-private partnerships in water infrastructure12
In further elaborating on its recommendations about regulation, the Commission also noted that
policymakers:
[N]eed to look at regulation more holistically so that we are purposeful in funding projects
to give us the highest public benefit. A municipality, watershed or region should be
encouraged to build infrastructure that is selected, sequenced, and phased to optimize the
use of resources. It should be encouraged to use scarce resources in the most efficient way
possible rather than be required to meet compartmentalized rigid requirements.13
Legislative Response to the 2012 Commission Report
In the wake of the Commission Report, the Massachusetts legislature debated several bills designed to
implement various aspects of the Commission’s recommendations. Two of these bills were passed in July
2014 and were signed into law in August 2014:
11 Water Infrastructure Finance Commission, op. cit., p. 12 12 ibid., pp. 10-13 13 ibid., pg. 87

Costs, Regulation, and Financing of Massachusetts Water Infrastructure: Implications for Municipal Budgets Situational Analysis
8
“An Act improving drinking water and wastewater infrastructure” 14 made a number of changes
to the administration of the State Revolving Fund (SRF), a source of low-interest bonds for
Massachusetts municipalities seeking financing for water infrastructure improvements. Among its
key provisions are:
o re-designating the “Water Pollution Abatement Trust” as the “Clean Water Trust”
o providing an additional $50 million in the State Revolving Fund program capital and an
increase in the cap on the dollar value of approved bonds from $88 million to $138 million
per fiscal year, as well as a direction to distribute 80% of that amount annually
o flexibility to reduce loan interest rates below the older statutory standard of two percent
and forgive interest or principal entirely based on need once the Massachusetts
Department of Environmental Protection (DEP) develops regulatory standards for this
purpose
o creation of a Water Infrastructure Advisory Committee to monitor the progress of closing
the gap in funding
o reimbursement to MWRA for the inflow/infiltration program for their member
communities (subject to appropriation)
o a one-to-one match for the cost of municipal entry fees to MWRA or another regional
water or wastewater system (subject to appropriation)
o authorization for municipal governments to assess property tax surcharges of up to 3%
for water infrastructure15
o $1.5 million for a technology innovation grant program to be administered by the
Massachusetts Clean Energy Center
14 https://malegislature.gov/Laws/SessionLaws/Acts/2014/Chapter259 15 This change is modeled on the Community Preservation Act. See https://www.mma.org/public-works-energy-a-utilities/13660-gov-signs-water-infrastructure-finance-bill

Costs, Regulation, and Financing of Massachusetts Water Infrastructure: Implications for Municipal Budgets Situational Analysis
9
"An Act Providing for the Preservation and Improvement of Land, Parks and Clean Energy in the
Commonwealth" was a four-year, $2.2 billion bond bill that also provided funds for water-related
capital projects, including $49 million for repair or removal of municipal dams and would invest
$120 million in coastal infrastructure, including seawalls. 16
Significant Developments since the Commission Report
Since the Commission Report was issued in May of 2012, a number of significant developments in state-
level analysis and policy-making have brought additional attention—and information—to the question of
how to foster and enhance water infrastructure investment. These include:
1. EPA MS4 Stormwater Regulations and Permitting Authority
One key issue that received considerable
attention in the 2015-2016 Legislative
Session was a proposal from Governor
Baker that the Commonwealth join forty-
six other U.S. states in directly
administering municipal stormwater
permits.
The U.S. Environmental Protection Agency
(EPA) regulates public stormwater
systems in all fifty states through National
Pollutant Discharge Elimination System (NPDES) standards first promulgated in 1972. To operate a
stormwater system, state and local governments must obtain Sewer System (MS4) permits.17
Communities that do not own and operate sewer or runoff collection systems—81 of the
Commonwealth’s 351 cities and towns—need not obtain MS4 permits.
16 https://malegislature.gov/Bills/188/House/H4375; Rothe, Amy http://blog.crwa.org/blog/legislature-enacts-2.2-billion-environmental-bond-bill-passes-water-infrastructure-bill 17 https://www3.epa.gov/npdes/pubs/fact2-1.pdf
Figure 1 - Rain gardens, such as this installation at the Mace Public Housing Project in Chelsea, help to reduce flooding and water pollution by collecting, storing, and naturally filtering stormwater runoff before it enters sewer systems. Source: City of Chelsea Dept. of Public Works

Costs, Regulation, and Financing of Massachusetts Water Infrastructure: Implications for Municipal Budgets Situational Analysis
10
In 46 states, the permit process is managed to federal standards and with federal oversight by state
environmental agencies. In four states—Idaho, Massachusetts, New Hampshire, and New Mexico—EPA
issues the permits directly, although DEP, a Massachusetts state agency, administers other federal water
quality regulations and standards, including those for water quality and wastewater treatment.
A 2014 Draft Massachusetts Small MS4 General Permit was released for public comment on September
30, 2014 and the comment period ended February 27, 2015. Final permit regulations covering
approximately 260 municipalities were issued by EPA in April 2016 to become effective on July 1, 2017.18
As part of its review of the costs required for municipalities to comply with the new permits, EPA
commissioned an analysis that developed a range (low to high) of cost parameters for rural, suburban and
urban communities but made no attempt to aggregate these range estimates into a statewide total cost
impact.19
On April 29, 2016, the Baker administration filed legislation to allow DEP to assume control of issuing MS4
permits on behalf of EPA. The proposed bill20 was reviewed by the Joint Committee on Environment,
Natural Resources and Agriculture, and was
sent to a study order, which effectively
removes the bill from consideration during
that session. The proposal is likely to be
taken up again in the 2017-2018 Legislative
Session.
2. A Sharper Focus on Climate
Change
The Commission Report cited climate
change as an “emerging concern” for local
18 https://www3.epa.gov/region1/npdes/stormwater/ma/2016fpd/final-2016-ma-sms4-gp.pdf 19 https://www3.epa.gov/region1/npdes/stormwater/ma/ma-stormwater-program-cost-evaluation.pdf 20 “An Act to enable the Commonwealth’s administration of the Massachusetts Pollutant Discharge Elimination System” https://malegislature.gov/Bills/189/House/H4254; https://www.bostonglobe.com/metro/2016/03/27/state-seeks-take-over-pollution-controls-from-federal-government/iwXuRG56OFHYB6FhDpPs5N/story.html#comments; “Lawmakers question state's capacity to take on water quality plan” http://www.tauntongazette.com/article/20160517/NEWS/160516100
Figure 2: Projected Increase in Precipitation Intensity in New England Source: Institute for the Study of Earth, Oceans and Space, University of New Hampshire

Costs, Regulation, and Financing of Massachusetts Water Infrastructure: Implications for Municipal Budgets Situational Analysis
11
governments, but did not specifically address climate change impacts in determining future water
infrastructure cost requirements for cities and towns. Continuing study of regional climate change effects
have, however, brought these issues into sharper relief.
For example, a June 2014 presentation at an MIT-sponsored conference entitled “Sustaining Coastal
Cities” noted that, within 50 years, most of Massachusetts will be experiencing 11 or more additional
“precipitation events” per decade that exceed 4 inches of rainfall within 48 hours. Several major urban
areas, including Boston, Worcester, and Springfield, are projected to experience additional precipitation
events on this scale at a rate of up 19 additional events per decade.21 (According to data from the
Northeast Regional Climate Center, communities in Massachusetts experienced a total of 12 such events
in 2015 and 8 in 2015.22) Even a modest projected increase in the amount of very heavy rainfall events
will, unless accommodated by new stormwater runoff strategies and systems, lead to massive flooding of
paved urban environments and regional flood plains on a scale not previously experienced.
At the same time, rising sea levels and
increased storm surges will inundate much
of the Commonwealth’s low-lying water
infrastructure facilities. For example,
MWRA Executive Director Frederick A.
Laskey noted in a 2013 presentation that
21 of MWRA’s coastal sewer facilities are
within 15 feet of mean sea level.23 By
comparison, storm surge in New York for
Hurricane Sandy was in the range of 11.5
feet above mean sea level.24
21 https://seagrant.mit.edu/conferences/CCS2014/presentations/222/Cameron_Wake.pdf 22 Northeast Regional Data Center At Cornell University: Custom Data from Community Collaborative Rain, Hail and Snow Network, “2-Day Total Precipitation in Massachusetts 2014-2016,” Dataset produced on request, 12/12/16 23 http://www.abettercity.org/docs/sustainability/Building%20A%20Resilient%20City%204-25-13.pdf (Laskey noted that some key facilities, including the Deer Island treatment plant and the Nut Island headworks in Quincy have been protected against wave levels of up to 14 feet, storm surges in the range New York experienced in Hurricane Sandy and a permanent sea level rise of up to 1.9 feet.) 24 https://seagrant.mit.edu/conferences/CCS2014/presentations/199/Jeff_Donnelly.pdf
Figure 3 - Projected Atlantic Sea Level Rise

Costs, Regulation, and Financing of Massachusetts Water Infrastructure: Implications for Municipal Budgets Situational Analysis
12
In the years following the 2012 Commission Report, climate scientists have reported mounting evidence
that sea levels along the North Atlantic coast are rising three to four times faster than levels elsewhere in
the world, a trend that supports increased investment to protect New England and Northeast coastal
water infrastructure from flooding.25
On September 16, 2016, Governor Baker issued Executive Order No. 569, Establishing an Integrated
Climate Change Strategy for the Commonwealth, which noted that “our state agencies and
authorities, as well as our cities and towns, must prepare for the impacts of climate change by
assessing vulnerability and adopting strategies to increase the adaptive capacity and resiliency of
infrastructure and other assets.”26 Governor Baker’s order requires that “The Secretary of Energy and
Environmental Affairs and the Secretary of Public Safety shall coordinate efforts across the
Commonwealth to strengthen the resilience of our communities, prepare for the impacts of climate
change, and to prepare for and mitigate damage from extreme weather events.” By September 2017,
the Governor’s order requires the Secretaries to “establish a framework for each City and Town in the
Commonwealth to assess its vulnerability to climate change and extreme weather events, and to
identify adaptation options for its assets; provide technical assistance to Cities and Towns to complete
vulnerability assessments, identify adaptation strategies, and begin implementation of these
strategies; implement the Climate Adaptation Plan upon its completion; and update the Climate
Adaptation Plan at least every five years, incorporating information learned from implementing the
Plan and the experiences of agencies, and Cities and Towns in assessing and responding to climate
change vulnerability.”27
3. Sustainable Water Management Initiative (SWMI)
In 2010, the Massachusetts Executive Office of Energy and Environmental Affairs (EEA) created the
Sustainable Water Management Initiative (SWMI) with support from the DEP, the Department of Fish and
Game (DFG), and the Department of Conservation and Recreation (DCR). An Advisory Committee and a
25 Asbury H. Sallenger Jr, et al, Nature Climate Change 2, pp 884–888 (2012) http://www.nature.com/nclimate/journal/v2/n12/full/nclimate1597.html 26 http://www.mass.gov/governor/legislationexecorder/execorders/executive-order-no-569.html 27 Ibid., Section 3, paragraphs c though f.

Costs, Regulation, and Financing of Massachusetts Water Infrastructure: Implications for Municipal Budgets Situational Analysis
13
Technical Subcommittee, comprising a wide range of stakeholders, were established to advise EEA and its
agencies on sustainable management of water resources that balance human and ecological needs.
Since November 2014, the framework established in the SWMI process has guided DEP’s permitting of
water withdrawals under the Water Management Act (WMA). This final framework summary describes
how DEP will apply these elements to the WMA permitting program.
Key components of the framework include:
1. Safe Yield – Safe Yield establishes the maximum amount of water that a community may
withdraw from its watershed during drought conditions. Safe Yield is calculated both on the basis
of maintaining the natural environment and adequate reserves of water to sustain watersheds
and aquifers as sustainable resources.
2. Seasonal Streamflow Criteria – Streamflow criteria are measurements that guide WMA
permitting decisions on a seasonal and local basis. Based on multiple statistical analyses,
stakeholder input, best professional judgment, and peer review science, these criteria are applied
in determining whether seasonal flow rates and magnitudes within a given watershed are
adequate to support a healthy aquatic environment.
3. Baseline – Baseline is a reference point against which a request to withdraw water will be
compared to determine whether the request represents an increase in withdrawals over historic
levels.28
In July of 2014, the Massachusetts Municipal Association (MMA) submitted comments on the SWMI
framework that expressed concern that the SWMI framework as expressed in DEP’s draft WMA
Regulations (310 CMR 36.00) “would dramatically increase costs associated with permitting and
mandated mitigation measures, reduce revenues needed to fund compliance, and limit economic growth
across the state.” MMA also noted the concerns of its member communities that the “new approach
suggested by the proposed regulations would shift the focus from protecting public health and safety to
28 http://www.mass.gov/eea/agencies/massdep/water/regulations/310-cmr-36-00-the-water-management-act-regulations.html
Costs, Regulation, and Financing of Massachusetts Water Infrastructure: Implications for Municipal Budgets Situational Analysis
14
an over-emphasis on increasing fluvial fish and aquatic life” as well as overlooking “effective and feasible
holistic approaches [to] . . . integrated water management policy for the Commonwealth.”29
One of the ongoing concerns about SWMI standards has been a lack of specific cost estimates. For
example, in their formal response to the Regulatory Review initiated by Governor Baker, the eight
communities of the Ipswich River Basin wrote that:
“The new regulations will require expensive mitigation projects to ‘offset’ increased water
use. This is true even for communities that are well within their current permit limits or
have achieved water use reductions. The mitigation projects, according to [DEP], may
include dam removals and building fish ladders. These expensive capital projects will
cause rate increases on residents and siphon money away from infrastructure projects
that should be strengthening our water systems.”30
As part of its 2014 “Act Providing for the Preservation and Improvement of Land, Parks and Clean
Energy in the Commonwealth,”31 the Legislature mandated that DEP submit a report by July 1,
2017 that provides “a comprehensive review of the impact of [SWMI regulations] on
municipalities and public water systems.” The report must include: “an analysis of those
municipalities and water systems affected by new permit conditions . . . those municipalities and
water systems required to develop minimization, cold water fishery or mitigation plans; and . . .
any rate increases experienced by ratepayers which water system operators attributed to
minimization, cold water fishery or mitigation requirements.”32
4. Community Compact Initiative and Municipal Modernization
Governor Baker has introduced, through executive order, two initiatives that have had a direct impact on
water infrastructure regulations and programs for cities and towns.
29 Beckwith, Geoffrey C. MMA Executive Director, letter to Massachusetts Department of Environmental Protection, Bureau of Resource Protection, July 10, 2014 30 Barth, Stephen, et al, letter to Governor Charles D. Baker RE: Regulatory Review Needed for Water Management Act Regulations, January 27, 2016 http://www.mass.gov/anf/docs/anf/reg-review/eea/ipswich-river-basin-1-27-16.pdf 31 https://malegislature.gov/Laws/SessionLaws/Acts/2014/Chapter286 32 op cit., Section 52

Costs, Regulation, and Financing of Massachusetts Water Infrastructure: Implications for Municipal Budgets Situational Analysis
15
In one of his first official actions after taking office in January 2015, Governor Baker issued Executive Order
No. 554, which created a Community Compact Cabinet “to create more effective, efficient and
accountable governments” at the state and local levels.33 The Governor’s order listed key goals of this new
partnership initiative for municipalities and state secretariats, including:
“To develop, in consultation with cities and towns, mutual standards of best practices for both
the state and municipalities . . .
“To develop ideas to incentivize adoption of best practices . . .
“To review state regulatory burdens on municipalities . . . and recommend reforms to lessen
the burdens on municipalities . . .
“To understand the major cost drivers of municipalities . . . and identify actions that the
Commonwealth [and] municipalities can take to control them;
“To identify and remove barriers to economic development opportunities for cities and
towns; and
“To empower cities and towns and school districts by finding new ways for local governments
to leverage state resources and capacity.”34
One of the “best practice areas” under which cities and towns may apply for Community Compact is
“Comprehensive Water Resource Management.” Communities or regional community groups that are
approved for compacts under this best practice area are eligible for “incentives to communities for
entering into a Community Compact, including prioritizing Commonwealth technical assistance resources
to help reach your chosen best practice(s). Extra points on certain grants, and a grant program specifically
for Compact Communities, are also incentives included for participation in the program.” Of the 200
community compact agreements signed between the Commonwealth and Massachusetts communities
as of May 19, 2016, six (Attleboro, Charlton, Eastham, Manchester-by-the-Sea, Salisbury, and Uxbridge)
are focused on water management best practices.
In March 2015, Governor Baker also issued Executive Order No. 562 directing all state agencies “to
promptly undertake a review of each and every regulation currently published in the Code of
Massachusetts Regulations under its jurisdiction” in order to reduce burdensome duplication, adverse
impacts, and obsolescence in state regulations, including those affecting cities and towns.35 As part of that
33 E.O. 554-2015, available at http://www.mass.gov/courts/docs/lawlib/eo500-599/eo554.pdf 34 Ibid, pg. 2 35 E.O. 562-2015, available at http://www.mass.gov/governor/legislationexecorder/execorders/executive-order-no-562.html

Costs, Regulation, and Financing of Massachusetts Water Infrastructure: Implications for Municipal Budgets Situational Analysis
16
review, state officials received a wide range of written comments and public testimony—some of it
specific to water-related regulations—from dozens of local governments, regional organizations and
advocacy groups.36
This review led to Governor Baker’s introduction in December 2015 of a legislative proposal to modernize
state laws and regulations directly affecting municipal governments. Provisions to streamline municipal
borrowing for water improvements and to make other adjustments in water infrastructure financing were
included in the Municipal Modernization Act which was approved by the Legislature on July 31, 2016 and
signed into law by the Governor on August 8, 2016, now known as Chapter 218 of the Acts of 2016.37
Specifically, Section 8 of the new law allows municipalities to “incur debt, by a two-thirds vote, [for
projects costing $50,000 or more] for such purposes as . . . establishing or purchasing a system for
supplying a city, town, or district and its inhabitants with water, for taking or purchasing water
sources, either from public land or private sources, or water or flowage rights, for the purpose of a
public water supply, or for taking or purchasing land for the protection of a water system . . . For
conducting groundwater inventory and analysis of the community water supply, including pump tests
and quality tests relating to the development of using said groundwater as an additional source or a
new source of water supply for any city, town or district . . . For . . .the construction of filter beds,
the construction or reconstruction or making extraordinary repairs to standpipes, buildings for
pumping stations including original pumping station equipment, and buildings for water treatment,
including original equipment therefor, and the acquisition of land or any interest in land necessary in
connection with any of the foregoing . . . For remodeling, reconstructing or making extraordinary
repairs to reservoirs and filter beds . . . For constructing or reconstructing, laying or relaying
aqueducts or water mains or for the extension of water mains, or for lining or relining such mains, and
for the development or construction of additional well fields and for wells . . . For the payment of the
city, town or district share of the cost to increase the storage capacity of any reservoir, including land
acquisition, constructed by the water resources commission for flood prevention or water resources
36 http://www.mass.gov/anf/budget-taxes-and-procurement/regulatory-review/public-comments/ http://www.mass.gov/anf/budget-taxes-and-procurement/regulatory-review/web-comments/ 37 https://malegislature.gov/Laws/SessionLaws/Acts/2016/Chapter218

Costs, Regulation, and Financing of Massachusetts Water Infrastructure: Implications for Municipal Budgets Situational Analysis
17
utilization . . . and for the purchase, replacement or rehabilitation of water departmental
equipment.38
In essence, the new law makes borrowing easier, but—with the modest exception of allowing the
charging of interest on delinquent water and sewer bills—does not provide additional funds or create
new mechanisms for funding of water infrastructure.
5. 2014 Water Economic Development Study
In January 2014, the Collins Center for Public Management and the University of Massachusetts-Boston
published a report commissioned by the MWRA Advisory Board titled, “Study on Investment in Water and
Wastewater Infrastructure and Economic Development.”39 This study collected academic analysis and
Massachusetts-based case studies40 that offer insights into the role that water infrastructure investment
may play in supporting local and regional economic development. The study concluded that:
38 ibid. 39 “Study on Investment in Water and Wastewater Infrastructure and Economic Development, Edward J. Collins, Jr. Center for Public Management, 2014 https://www.umb.edu/editor_uploads/images/centers_institutes/center_collins_mgmt/MWRA_Economic_Development_Report.pdf 40 ibid, pp 3-5. The MWRA Study looked at five case studies, in Boston, Somerville, Stoughton, Taunton, and Weymouth. While providing no overall return-on-investment (ROI) estimates for “the multibillion dollar investment to clean up the harbor, opening up the Boston Seaport District, and other areas, to new investment and development,” the study noted that projected private investment in Boston’s Seaport District alone was
Figure 4- Combined Sewer Outfalls emptying into the Mystic River circa 2011. Source: Support Materials, H.742 “An Act Promoting Awareness for Safe Recreation in Public Waterways,” Office of Representative Denise Provost

Costs, Regulation, and Financing of Massachusetts Water Infrastructure: Implications for Municipal Budgets Situational Analysis
18
“The provision of potable water and wastewater treatment services in Massachusetts is highly
fragmented . . . any comprehensive effort to improve water and wastewater infrastructure
will need to work with multiple providers and take into account the unique circumstances of
each community;
“Municipalities across the state are facing significant challenges with major infrastructure
systems reaching their reasonable useful lifetime at the same time as state and federal
regulatory requirements are becoming increasingly stringent;
“Delayed or stalled economic development projects have a real financial impact on local
communities seeking to increase their commercial property tax base. . . .; and
“[M]ultiple examples can be found today where access to adequate water and wastewater
infrastructure has made the difference between economic development projects that quickly
generate thousands of new jobs and those that have been delayed for years [by a lack of
adequate infrastructure].”41
As with the other post-2012 developments listed here, this economic development study has provided
additional context for municipalities to assess the urgency and impact of water infrastructure investment
and given added impetus to DLM’s survey of the impact of planned or projected investments on local
finances.
Moreover, they suggest that any assessment of water infrastructure cost impacts should be made not
only on the basis of funding but also on the basis of how changes—both actual and proposed—to
regulatory and administrative frameworks might affect the ability and willingness of municipalities to
increase their investments in critical water systems.
expected to reach $8.4 billion. In two of the four additional case studies—Taunton and Stoughton—the study noted that a combined investment of $3.3 million in water infrastructure “unlocked” economic development and private investment that yielded $12.3 million in annual commercial property tax revenues. 41 ibid., pp 155-6

Costs, Regulation, and Financing of Massachusetts Water Infrastructure: Implications for Municipal Budgets Situational Analysis
19
6. Widespread Drought in 2016
Massachusetts began to experience symptoms of drought in the spring and early summer of 2016. By
July, the U.S. Drought Monitor (USDM)42 had designated approximately one third of the state as
experiencing “severe drought” and only Nantucket Island escaping designation as “abnormally dry.”43
By September, much of eastern and central Massachusetts had been rated as experiencing “extreme”
or “severe” drought,44 with USDM defining “extreme” as characterized by “Major crop/pasture losses
[and] widespread water shortages or restrictions.”45
Even with some additional precipitation in the month of October, drought conditions have worsened
across the state. Currently, USDM rates nearly 64 percent of the Commonwealth as experiencing “severe”
to “extreme” drought. (See Figure 5.)
As of
September,
the United
States
Department
of
Agriculture
(USDA)
estimated
drought-
related crop
losses in
42 USDM is a national agency established in 1999 by the National Oceanic and Atmospheric Administration, the U.S. Department of Agriculture, and the National Drought Mitigation Center (NDMC) at the University of Nebraska-Lincoln to track the effects of drought http://droughtmonitor.unl.edu/AboutUSDM/Background.aspx 43 http://droughtmonitor.unl.edu/MapsAndData/MapArchive.aspx 44 http://droughtmonitor.unl.edu/MapsAndData/MapArchive.aspx 45 http://droughtmonitor.unl.edu/AboutUs/ClassificationScheme.aspx
Figure 5: November, 2016 Drought Conditions in Massachusetts.

Costs, Regulation, and Financing of Massachusetts Water Infrastructure: Implications for Municipal Budgets Situational Analysis
20
Massachusetts at approximately $14 million, a three percent loss of the state’s annual agricultural
output.46
The effect on municipal water supplies has been even more dramatic. Restrictions on water usage—some
voluntary but most compulsory—affect communities in every region of the Commonwealth. (See Figure
6.)
Depletion of local water supplies has prompted several municipalities—notably Ashland, Cambridge,
Lynn, and Worcester—to develop agreements with the MWRA to purchase water on an emergency
basis.47 These agreements can place significant pressure on local budgets48 and also represent additional
46 Young, Colin “Mass. crop damage estimated at $14 Mil, aid available in four counties,” State House News Service 9/6/16 http://wwlp.com/2016/09/06/mass-crop-damage-estimated-at-14-mil-aid-available-in-four-counties/ 47 Laskey, op. cit, page 1 48 Kotsopoulos, N., “Drought forcing Worcester to buy water indefinitely” 10/3/16 http://www.telegram.com/news/20161003/drought-forcing-worcester-to-buy-water-indefinitely Rocheleau, Matt “Communities scramble to find emergency water sources,” 9/15/16 https://www.bostonglobe.com/metro/2016/09/14/reservoirs/qqc4NSXGye23330h1BsTVN/story.html
Figure 6: Current Water Use Restrictions in Massachusetts (5 communities have delcared water emergencies.) Source:
Mass DEP

Costs, Regulation, and Financing of Massachusetts Water Infrastructure: Implications for Municipal Budgets Situational Analysis
21
demand on the MWRA’s supplies at a time when many of the Authority’s regular clients have also
increased their usage.49 As a result, the MWRA’s Quabbin Reservoir, which normally holds 412 billion
gallons, has fallen below 80 percent of capacity for the first time since 2002, although MWRA managers
believe that the Authority could continue to meet current levels of demand from all users—including
emergency purchasers—even if the drought continues for “several more years.” 50
Toward a “Holistic” Approach
The Water Infrastructure Commission’s call in 2012 for a more “holistic,” integrated approach to both
financing and regulation has been echoed repeatedly in subsequent years by stakeholders in the public
sector and across the advocacy community.
As noted in the SWMI discussion above, the MMA has, in advocating for its member municipalities, called
on DEP to develop coordinated policies that would “facilitate the good work of cities and towns so
communities can maintain and expand” their “innovative strategies to conserve water and manage their
water use.”51
In calling for further study of Governor Baker’s proposal that DEP assume MS4 permitting authority from
the federal government—and in raising serious reservations about specific aspects of the current
version—Representative (and Water Infrastructure Finance Commission member) Carolyn Dykema
observed that “More comprehensive and integrated planning is expected to be an important potential
benefit of delegation which may help optimize infrastructure investments . . . Understanding the extent
to which delegation may facilitate implementation of more innovative or ‘green’ water management
approaches would also be beneficial.”52
49 Laskey, op. cit, page 5 50 Rocheleau, Matt, “Amid drought, Quabbin Reservoir now below normal level,” 11/15/16, https://www.bostonglobe.com/metro/2016/11/15/state-largest-reservoir-falls-below-normal-for-first-time-years-drought-persists/FHZMN88TwUgZGC41pdJddM/story.html Laskey, op. cit., page 3 51 Beckwith, Geoffrey C. MMA Executive Director, letter to Massachusetts Department of Environmental Protection, Bureau of Resource Protection, July 10, 2014, pg. 3 52 Dykema, Carolyn, State Representative, letter to Joint Committee on the Environment, Natural Resources and Agriculture June 16, 2016, pg. 3

Costs, Regulation, and Financing of Massachusetts Water Infrastructure: Implications for Municipal Budgets Situational Analysis
22
The theory of a need for—and the benefits of—a “holistic” approach was summarized in a May, 2016
letter from Massachusetts Water Works Association Executive Director Jennifer A. Pederson to the
Legislature’s Joint Committee on the Environment, Natural Resources and Agriculture. Writing on behalf
of a membership composed primarily of local water system officials throughout the Commonwealth, Ms.
Pederson explained that:
Communities across the nation are beginning to recognize that regulations within the
historically isolated water resource “sectors” (i.e. drinking water, wastewater and
stormwater) are becoming increasingly interrelated. As such, more progressive
communities are already beginning to think about how they could manage these systems
in a more economically viable and integrated way. In Massachusetts, the need for
integrated water resource planning will be further highlighted when communities begin
to respond to recently promulgated changes to the Water Management Act regulations,
specifically informed by the Commonwealth’s Sustainable Water Management Initiative
(SWMI). Ironically, any system or community interested in pursuing the merits of an
Integrated Water Management Plan have been thwarted due to the permitting “silos”
administered under separate regulatory authorities (drinking water, wastewater and
stormwater programs). Communities must deal with all of these regulatory programs
simultaneously regardless of what is considered to be most convenient for the regulators.
Unlike the regulators, they do not have the luxury of only concentrating on each program
one at a time. Integrated planning is not cheap or easy, but if done effectively, can help
communities prioritize water resource needs, investments, and benefits—including
infrastructure and the environment.53
Surveying Municipal Cost Impacts and Concerns
Collectively, these post-2012 developments also point to the value of updating and enhancing basic data
on municipal costs for maintaining and enhancing water infrastructure. Better understanding of these
costs is especially important in the context of the continuing trend since Fiscal Year 2003 for state aid to
53 Pederson, Jennifer, letter to Joint Committee on the Environment, Natural Resources and Agriculture, May 27, 2016, pp. 1-2
Costs, Regulation, and Financing of Massachusetts Water Infrastructure: Implications for Municipal Budgets Situational Analysis
23
account for declining shares of annual local expenses.54 To provide additional data on this topic, DLM
began in November 2015 to survey cities and towns directly concerning:
their planned expenditures for water infrastructure of all kinds;
their sources of funding;
their knowledge and experience of state and federal funding sources;
their strategies for and experience with the adoption of technological and managerial
innovation in water infrastructure;
their specific initiatives to address climate change impacts on water infrastructure; and
their views on state and federal regulation frameworks.
The 2012 State Water Infrastructure Commission Report had been based on careful estimates of water
infrastructure needs. By contrast, the DLM survey was intended to quantify known and documented
expenditures using figures supplied directly by local governments and to begin collection of stormwater
cost data.
Methodology
DLM used a hosted, online survey tool to
generate emailed invitations to all 351 cities
and towns.55 (See Appendix A for invitations
and survey format.)
Survey invitations were emailed to heads of
municipal governments in November 2015 and
were followed up with phone calls and additional emails in January, February and March of 2016. The
54 http://www.mass.gov/auditor/docs/dlm-mandate/2016/040616-5-year-fiscal-impact-report-2011-2015.pdf, p.3 “Specifically, in FY03, tax levies accounted for 50.79% of total municipal revenue and state aid accounted for 27.08% of total municipal revenue. FY15, tax levies increased to account for 57.58% of total municipal revenue and state aid dropped to 20.22% of total municipal revenue.” 55 With the assistance of the Massachusetts Water Works Association, DLM also provided survey invitations to local independent water districts, although data submitted by these organizations was aggregated by municipality.
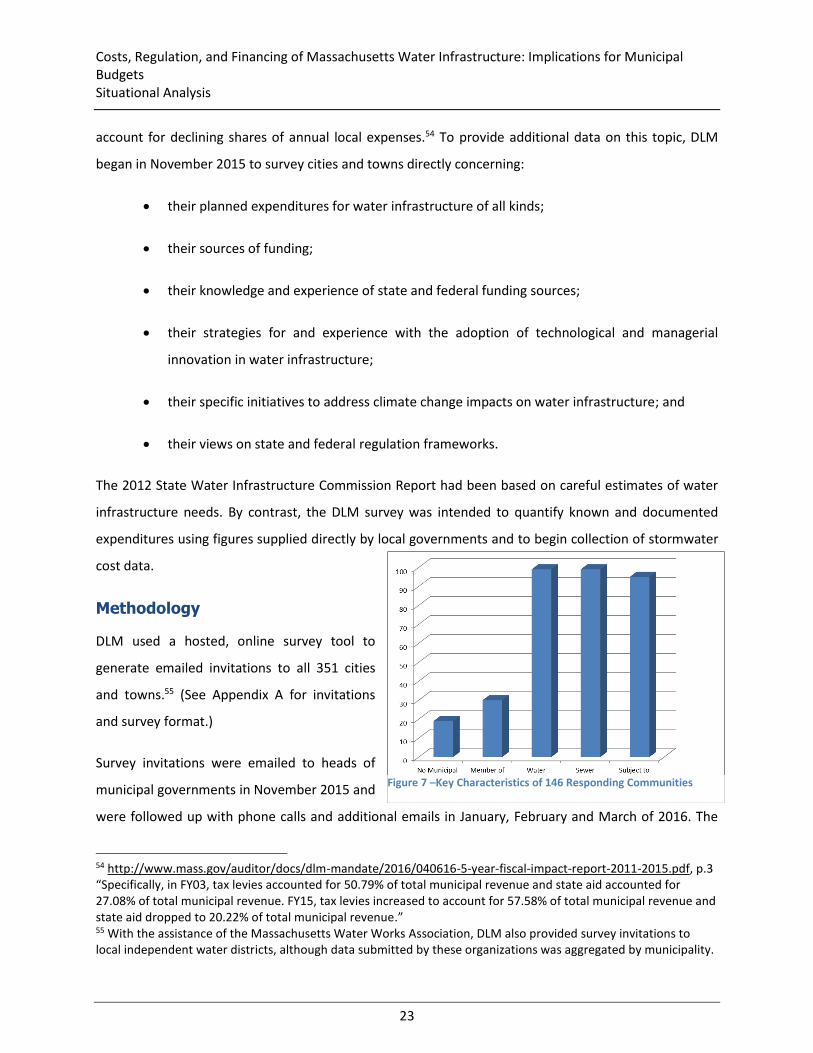
Figure 7 –Key Characteristics of 146 Responding Communities

Costs, Regulation, and Financing of Massachusetts Water Infrastructure: Implications for Municipal Budgets Situational Analysis
24
survey was closed on April 12, 2016. Respondents were encouraged to complete the survey online
although responses were also accepted by email, postal mail and fax.
Respondent Characteristics
A total of 146 cities and towns submitted completed surveys. Of these:
19 (13%) reported that they owned no municipal water systems;
30 (20%) reported that they were MWRA members;56
99 (68%) reported that they had a dedicated enterprise fund for drinking water delivery;
99 (68%) reported that they had a dedicated enterprise fund for waste water management;
and
95 (65%) reported that they were subject to the MS4 process
The 146 respondents represented 42% of the state’s 351 municipalities but included 88% of all cities and
towns with populations greater than 50,000. The sample therefore included almost all of the state’s large
urban communities. Responding communities contained 64% of the total state population. To model
statewide estimates using the responses obtained in the survey, DLM therefore used a multiplier of 1.36
on the actual figures provided.
56 Of the state’s 351 municipalities, MWRA serves a total of 61, or 17.4%.

Costs, Regulation, and Financing of Massachusetts Water Infrastructure: Implications for Municipal Budgets Findings and Policy Recommendations
25
FINDINGS AND POLICY RECOMMENDATIONS
1. Massachusetts communities have combined water system spending needs in excess of $17 billion
Based on survey data,
Massachusetts municipalities
can conservatively anticipate at
least $17.8 billion in water
infrastructure expenditures
over the next 20 years. This
includes an estimated $7.24
billion for clean water delivery,
$8.99 billion for wastewater
treatment and handling, and
$1.58 billion for stormwater
management.57
During the 10-year period covered by the survey, the Department of Environmental Protection’s (DEP)
Division of Municipal Services has approved over $1 billion in municipal water infrastructure projects for
low-interest loans from the State Revolving Fund (SRF).58 These loans can result in substantial savings for
municipalities, although they come with requirements to use American-made iron and steel that may
undercut the reduction in interest. Repayment of SRF loans is made in twice-yearly debt service
remittances to the state. Local aid payments may be garnished in the event of non-payment, although
such action is rarely needed. 59
57 Several communities indicated that they were still preparing capital plans and cost estimates for stormwater management costs. Most communities that have developed specific cost estimates have done so on the basis of five or ten year capital plans, another reason that the total cost figure provided here is conservative. To compensate for the fact the cost estimates supplied by municipalities account for 64 percent of the state’s population (although the sample is broadly representative on both a demographic and a geographic basis), the estimates in this study have been adjusted upward. Thus, although using a different methodology, these estimates are therefore comparable in overall magnitude to those in the 2012 Water Infrastructure Commission analysis. 58 Source: Mass DEP Division of Municipal Services. 59 ibid.
Figure 8 - Cost Estimates Derived from DLM Survey

Costs, Regulation, and Financing of Massachusetts Water Infrastructure: Implications for Municipal Budgets Findings and Policy Recommendations
26
The state announced in January 2016 that it was authorizing cities and towns to borrow up to $538 million
at interest rates of two percent or lower, but this increase—though it may provide significant savings on
interest payments—does not mean the state is boosting direct aid to municipalities. A guaranteed loan
rate is useful but the accompanying requirements to use U.S.-sourced materials may also increase the
capital cost of water infrastructure projects. These changes may, in some cases, reduce the overall benefit
of a lower interest rate.
The State Qualified Bond program60 provides another means for municipalities to borrow for various
purposes, including water infrastructure projects. Municipalities that issue bonds through the State
Qualified Bond program benefit from the strength of the state’s credit rating, because the state pays the
debt service directly from the municipality’s local aid. The security provided by the State Qualified Bond
program improves the bonds’ marketability, and in turn, municipalities often benefit from lower interest
rates on the debt issuance. Nevertheless, while municipalities may benefit from lower interest rates by
bonding for water infrastructure projects through the State Qualified Bond program, municipalities are
still paying for these projects with their own resources61.
Smaller municipalities that do not receive sufficient local aid to cover the debt service amounts are,
regardless of need, ineligible to participate in the State Qualified Bond program. The way in which both
the SRF and State Qualified Bond programs are administered therefore restricts access by smaller
communities with limited ability to repay loans through local aid—even loans offered at lower interest
rates guaranteed through the state. In some other New England states, smaller communities are given
special consideration through grant programs designed to address water infrastructure projects with
significant public impact.62
In Maine for example, the Small Community Grant Program is available to municipalities and water
districts that do not have municipal sewer systems but face wastewater disposal and pollution problems.63
60 The program is administered by the Municipal Finance Oversight Board, which is chaired by State Auditor and consists of the State Treasurer (or designee), Attorney General (or designee), and the Director of Accounts for the State Department of Revenue.
61 “Understanding Municipal Debt,” Massachusetts State Department of Revenue, Division of Local Services, May, 2016, pg. 2 http://www.mass.gov/dor/docs/dls/mdmstuf/technical-assistance/best-practices/understandingmunicipaldebt.pdf 62 https://www3.epa.gov/region1/eco/drinkwater/pdfs/waterfundletterweb.pdf 63 http://legislature.maine.gov/statutes/38/title38sec411.html; http://www.maine.gov/dep/water/grants/scg/scgfaq.pdf
Costs, Regulation, and Financing of Massachusetts Water Infrastructure: Implications for Municipal Budgets Findings and Policy Recommendations
27
In Connecticut, the state offers large-scale capital grants as well as loans for water infrastructure projects
in eligible local communities: In 2015, the state’s Bond Commission authorized general obligation bonding
that would underwrite not only $370 million in loans for local and regional wastewater improvement
projects but also an additional $110 million in grants that cover anywhere from 20 to 50 percent of project
costs for participating communities.64
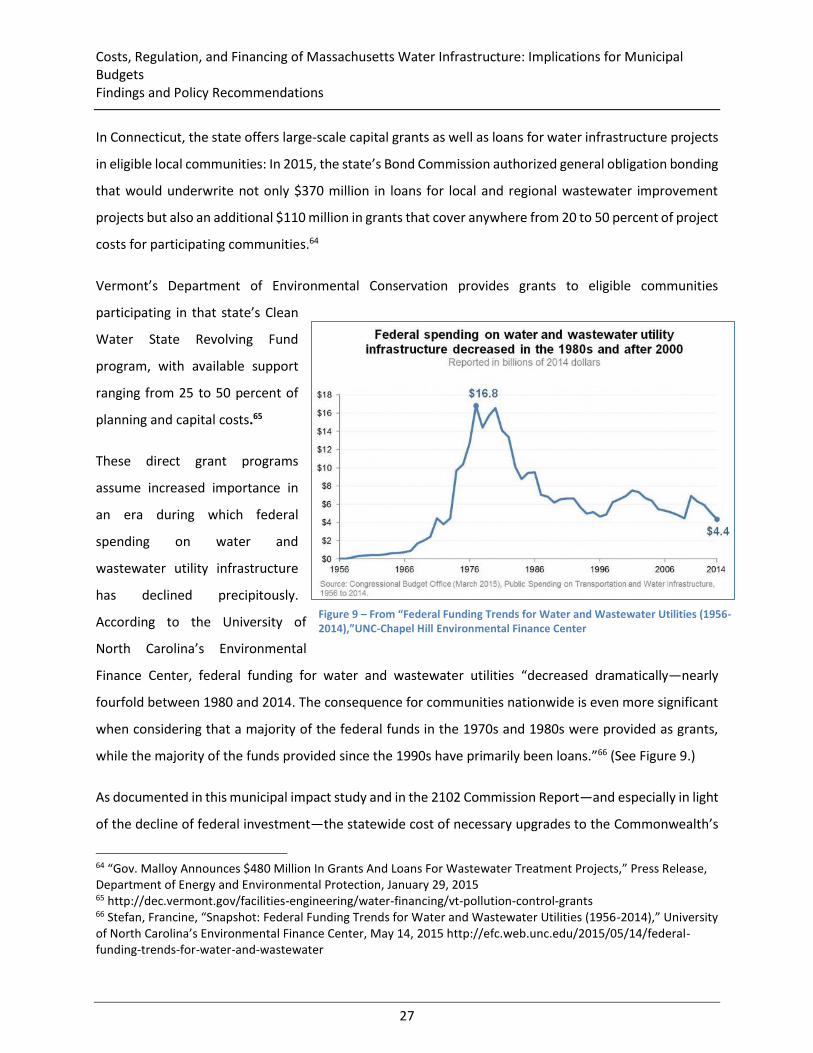
Vermont’s Department of Environmental Conservation provides grants to eligible communities
participating in that state’s Clean
Water State Revolving Fund
program, with available support
ranging from 25 to 50 percent of
planning and capital costs.65
These direct grant programs
assume increased importance in
an era during which federal
spending on water and
wastewater utility infrastructure
has declined precipitously.
According to the University of
North Carolina’s Environmental
Finance Center, federal funding for water and wastewater utilities “decreased dramatically—nearly
fourfold between 1980 and 2014. The consequence for communities nationwide is even more significant
when considering that a majority of the federal funds in the 1970s and 1980s were provided as grants,
while the majority of the funds provided since the 1990s have primarily been loans.”66 (See Figure 9.)
As documented in this municipal impact study and in the 2102 Commission Report—and especially in light
of the decline of federal investment—the statewide cost of necessary upgrades to the Commonwealth’s
64 “Gov. Malloy Announces $480 Million In Grants And Loans For Wastewater Treatment Projects,” Press Release, Department of Energy and Environmental Protection, January 29, 2015 65 http://dec.vermont.gov/facilities-engineering/water-financing/vt-pollution-control-grants 66 Stefan, Francine, “Snapshot: Federal Funding Trends for Water and Wastewater Utilities (1956-2014),” University of North Carolina’s Environmental Finance Center, May 14, 2015 http://efc.web.unc.edu/2015/05/14/federal-funding-trends-for-water-and-wastewater
Figure 9 – From “Federal Funding Trends for Water and Wastewater Utilities (1956-2014),”UNC-Chapel Hill Environmental Finance Center
Costs, Regulation, and Financing of Massachusetts Water Infrastructure: Implications for Municipal Budgets Findings and Policy Recommendations
28
water infrastructure is likely to exceed the ability of municipalities to pay the bill—with or without access
to lower-cost, state-backed loans.
Recommendation
Given the continuing decline of overall state aid as a share of local budgets, the Legislature should expand
the State Revolving Fund (SRF) as administered by the Clean Water Trust to provide full grants in addition
to its current practices of low-interest loans and limited principal forgiveness for cities and towns
undertaking water system repairs and enhancements. This finding also supports a recommendation
contained in the Massachusetts Water Infrastructure Commission report that the Commonwealth
establish a new Trust Fund for water infrastructure to provide at least $50 million annually for the next
ten years in direct state aid for local water infrastructure projects.67 This funding should be provided in
addition to, and run concurrent with, current loan and grant programs, and should focus entirely on grants
for eligible water infrastructure projects. In addition—and as an incentive designed to respond to Finding
3 of this study68—priority in allocating these funds should be given to municipalities and regional entities
seeking supports for projects and programs that enhance water infrastructure regionalization.
2. Municipalities foresee significant increases in capital, operating, and staffing costs for implementation of new federal stormwater management regulations.
Asked directly whether they would face higher annual operating costs as a result of EPA’s Municipal
Separate Storm Sewer (MS4) Permit requirements issued in April of 2016 (effective July 1, 2017), 65
percent of survey respondents indicated that they were affected by the new permit requirements.
Responding communities cited projected spending increases over the next twenty years of more than $1
billion, including $160 million in staffing costs alone. Population-based modelling of stormwater-related
costs for municipalities yields a statewide total of $1.58 billion over the next 20 years, including $240
million in additional personnel costs.
67 Water Infrastructure Finance Commission, op. cit., p. 10 68 See Page 31

Costs, Regulation, and Financing of Massachusetts Water Infrastructure: Implications for Municipal Budgets Findings and Policy Recommendations
29
Recommendation
To provide additional funding for water infrastructure investment, Massachusetts municipalities should
consider the creation of dedicated stormwater enterprises similar to local water and sewer enterprises in
structure, operation, and fee-based revenue streams. 69
3. For most municipalities, regional collaboration on water infrastructure remains a goal rather than a reality
Only 36% of survey respondents reported that
they are members of regional collaborations
on water infrastructure planning and
management. Of these, only five municipalities
reported that they belonged to organizations
that had spending/purchasing authority.70
Recommendation
1. Streamline start-up requirements and regulations to allow municipalities to pool resources more
easily and achieve greater efficiencies of scale in watersheds and water systems that extend across
multiple municipal boundaries. In addition to the recently enacted municipal modernization law,
which prioritizes state grants for communities that present regional approaches for eligible projects
69 Another related bill currently under legislative review, H657, would explicitly authorize municipalities and other public operators of water infrastructure systems to charge a separate user fee to support the creation and use of “Sustainable Water Resource Funds.” The funds could be used “exclusively for measures to remedy and offset the impacts on the natural environment of new and/or increased water withdrawals, sewering, wastewater discharges, stormwater discharges, or impairment of recharge of groundwater through depletion of ground or surface waters, and to sustain the quantity, quality, and ecological health, of waters of the commonwealth. https://malegislature.gov/Bills/189/House/H657 70 94 Massachusetts municipalities have joined forces to establish six regional stormwater coalitions throughout the state. While they do not own or operate facilities, these coalitions do share planning resources and information in order to coordinate watershed-based approaches to stormwater management. The six current coalitions are: the Central Massachusetts Regional Stormwater Coalition, the Connecticut River Stormwater Collaborative (Pioneer Valley Planning Commission), the Northern Middlesex Stormwater Collaborative, the Neponset Stormwater Partnership, the Merrimack Valley Planning Commission, and the Southeast Regional Services Collaborative’s Stormwater Group. Earlier this year, these organizations established a Statewide Municipal Stormwater Coalition to provide a framework for sharing cost information, technical products, field procedures, public education tools, documentation, and training opportunities. Source: http://www.mma.org/statewide-coalition-forms-share-stormwater-resources
Figure 10 - The MFN Regional Wastewater Facility in Norton is managed by a regional entity that took six years to create.

Costs, Regulation, and Financing of Massachusetts Water Infrastructure: Implications for Municipal Budgets Findings and Policy Recommendations
30
and programs, the Legislature should also approve legislation designed to promote municipal
collaboration and regionalization throughout the Commonwealth by simplifying the process of
creating regional public entities that have the power to operate facilities as well as to plan across
multiple municipal jurisdictions.71
2. As noted in in the recommendation under Finding 1,72 a special state trust fund for water
infrastructure should give priority in allocating grants to municipalities and regional entities seeking
support for projects and programs that enhance water infrastructure regionalization.
4. Municipalities may not be taking full advantage of current loan and grant programs
Through its Division of Municipal
Services, DEP already provides
annual outreach and education
efforts to Massachusetts
communities on the topics of
Clean Water Trust and State Revolving Fund program eligibility, financial benefits, and application
procedures. Each year, DEP holds regional training sessions, meets with local officials on an ad hoc basis,
and provides an extensive online library of materials for potential borrowers. Yet only 42% of communities
responding to the DLM survey reported that they have received water infrastructure grants or loans from
Massachusetts or the federal government in the past 10 years—and only 38% indicated familiarity with
legislative changes to loan availability and terms in 2014, which were specifically designed to expand
eligibility for loans and increase the scale of benefits for municipal borrowers.73
71 https://malegislature.gov/Bills/189/House/H4419/History https://malegislature.gov/Bills/189/Senate/S1077 72 See Page 28 73 https://malegislature.gov/Bills/188/Senate/S2342/History
Figure 11 - DEP's Division of Municipal Services uses this table to demonstrate the potential cost savings (depending on project size and current market interest rates) for cities and towns using the SRF loan program. Source: DEP

Costs, Regulation, and Financing of Massachusetts Water Infrastructure: Implications for Municipal Budgets Findings and Policy Recommendations
31
This response suggests that eligibility requirements and a lack of awareness about available resources
may continue to impede the ability of communities to invest in necessary water infrastructure. As noted
in the recommendations associated with Finding 1, above, the Commonwealth’s existing water
infrastructure loan programs are insufficient to meet the need for necessary investment in maintenance
and expansion. Yet, even these current programs remain under-utilized resources that could be deployed
by more communities if they had additional information and incentives.
Recommendation
The Commonwealth should work to enhance municipal eligibility for state loans and grants by reviewing
repayment options and further expanding the capacity of state agencies to reduce or forgive interest
and/or principal repayments for smaller projects. At the same time, the Commonwealth should consider
additional funding in the DEP budget for expanded outreach in order to educate municipalities about the
availability, terms, and benefits for current and future water infrastructure loan and grant resources—
including and especially the long-term advantages of borrowing in the near term when both state-
sponsored and private interest rates remain near historic lows.
5. Municipalities are not focused on the likely effect of climate change on vulnerable water infrastructure.
Only 6% of survey respondents indicated that they developed any formal climate change plans or policies
that affect water infrastructure systems. This data suggests that, despite guidance offered in
comprehensive state-level reviews, such as the Massachusetts Climate Change Adaptation Report issued
in September 2011 by the Executive Office of Energy and Environmental Affairs, and despite recent
advances in understanding of the scope and speed of climate change impacts, many Massachusetts cities
and towns have not yet integrated climate change impacts into their long-term water infrastructure plans.
This is a serious issue, as the effects of climate change should be factored into location, replacement and
capacity of water systems.
Governor Baker’s recently-promulgated Executive Order No. 569, Establishing an Integrated Climate
Change Strategy for the Commonwealth,74 calls for a statewide planning process for developing standards
and strategies for preserving or relocating vulnerable water infrastructure, but it does not include any
74 http://www.mass.gov/governor/legislationexecorder/execorders/executive-order-no-569.html

Costs, Regulation, and Financing of Massachusetts Water Infrastructure: Implications for Municipal Budgets Findings and Policy Recommendations
32
initiatives to raise the public profile of this vital aspect of climate change preparation, nor does it suggest
new funds or funding sources for this purpose. The Executive Order directs the Secretary of Energy and
Environmental Affairs and Secretary of Public Safety to “provide technical assistance to Cities and Towns
to complete vulnerability assessments, identify adaptation strategies, and begin implementation of these
strategies.”75 However, the Executive Order does not specify how those resources will be provided—or in
what quantity—to communities that lack the staff or funds to develop and implement climate change
resiliency plans for their vulnerable infrastructure.
Recommendation
In following up on the stated goals of its recently promulgated executive order on climate change
preparedness, the Baker-Polito Administration should, by July 1, 2017, convene a statewide summit on
climate change implications for municipal water infrastructure systems, especially in coastal and riverine
flood plain zones. In addition, the Legislature should consider the authorization of designated funds for
the purpose of providing municipalities with expert assistance in developing and implementing water
infrastructure resiliency and capital investment plans related to climate change impacts.
6. Municipalities reported a low rate of adoption for innovative technologies
with the potential to reduce cost and increase efficiency in municipal water
systems.
There is a long list of new and innovative technologies for water infrastructure that includes solar energy
arrays, trenchless pipe rehabilitation (coatings and linings), SCADA (supervisory control and data
acquisition) remote control systems (see Figure 12), tree pits, and rain gardens for stormwater
management. Innovative and alternative technologies can offer potential cost savings and/or
performance improvements, yet many communities are reluctant to assume the potential risk and liability
for adopting technologies and management systems. Through the Massachusetts Clean Energy Center,
the Commonwealth has taken important steps to promote new technologies and best practices in water
infrastructure with initiatives such as the Catalyst program and DeployMass. Through the Water
Innovation Trust, DEP provided $800,000 in Fiscal Year 2016 for direct funding of water system innovation.
Yet only 18% of survey respondents indicated that they had adopted any innovative or alternative
75 ibid., section 3, paragraph d.

Costs, Regulation, and Financing of Massachusetts Water Infrastructure: Implications for Municipal Budgets Findings and Policy Recommendations
33
technologies to achieve cost savings, enhanced
capacity or improved performance in any aspect of
their water infrastructure.
Recommendation
The Commonwealth should consider additional
incentives and support in this area, including:
a requirement that the Operational Services Division (OSD) and the Division of Capital Asset Management and Maintenance (DCAMM) undertake comprehensive reviews of their regulations and practices in order to develop proposed changes to liability standards and procurement requirements that would encourage easier adoption of innovative technologies that could improve performance and reduce costs in water infrastructure facilities.
adoption of legislation that would create an “innovative communities office” within the Executive Office of Housing and Economic Development to coordinate “the introduction of cutting-edge technologies into the marketplace and incentivize the adoption of these technologies by municipalities.”76
creation of legislation that would provide interest rate and/or principal forgiveness on projects that may require additional investment if innovative technologies do meet performance standards.
if the Commonwealth assumes responsibility for municipal stormwater permitting (See finding 7, below), the adoption of regulatory flexibility for communities that adopt and deploy innovative solutions that may need extra time to achieve full compliance with applicable standards.
adoption of legislation to encourage local governments to explore opportunities for public-private partnerships (P3).77
76 https://malegislature.gov/Bills/189/Senate/S1986 77 https://malegislature.gov/Bills/189/Senate/S1722 For more information on P3s in water infrastructure projects and facilities, see also http://knowledge.wharton.upenn.edu/article/making-the-most-of-public-private-partnerships/, http://www.pewtrusts.org/en/research-and-analysis/blogs/stateline/2016/03/30/as-water-infrastructure-crumbles-many-cities-seek-private-help
Figure 12 - As shown in this screen capture Foxborough's SCADA system gives managers easy-to-use, real-time data on key performance metrics. (Source: Town of Foxborough Water Dept.)

Costs, Regulation, and Financing of Massachusetts Water Infrastructure: Implications for Municipal Budgets Findings and Policy Recommendations
34
7. Municipalities favor state administration of stormwater permits
Municipalities favor state administration
of stormwater permits, with 75 (51%) of
all 146 responding municipalities—and
90% of the 84 communities expressing a
preference—indicating that they would
rather have DEP administer the MS4
stormwater permit program. Only 9%
indicated a preference for EPA to
continue direct administration of the
program.
Assumption of operational responsibility for the MS4 permit program would make DEP a “one-stop
shop” for water system regulations in Massachusetts. This change has financial implications for the
state: DEP estimated in 2013 that the cost of assuming responsibility for issuing and enforcing MS4
permits would be in the range of $9 to $10 million annually.78 In actually proposing the change earlier
this year, DEP noted that integration and automation of water quality data-gathering and analysis
would reduce this cost to $4.325 million per year.79
In response to an inquiry from the Legislature’s Joint Committee on the Environment, Natural
Resources and Agriculture, DEP officials indicated that it investigated the possibility of funding the
change through an assessment on users but that they rejected the idea, preferring to have the
Legislature direct that the program be funded through a line-item in the DEP budget. In its written
comments to the Joint Legislative Committee, DEP noted that, “[o]ne of the downsides of the
assessment approach is that as program costs increase each year, the assessment would have to be
re-evaluated and adjusted; a process that could be time intensive and potentially uncertain to
complete on an annual basis.”80
78 “Massachusetts Department of Environmental Protection Report to the General Court of the Commonwealth on the Topic of NPDES Authorization,” 07/01/2013, pg. 4 79 “MassDEP Responses to June 16, 2016 Memo from Representative Dykema,” 06/27/2016, pg. 1 80 Ibid.
Figure 13 -Responses to: "Would your municipality prefer to have Mass DEP issue MS4 permits or have US EPA retain this role?"

Costs, Regulation, and Financing of Massachusetts Water Infrastructure: Implications for Municipal Budgets Findings and Policy Recommendations
35
DEP discussed this funding issue at greater length in its 2013 report to the Legislature, noting that
possible sources included not only general appropriations but also permit fees for commercial users
and a wastewater assessment fee. Observing that the “wastewater assessment fee would be the most
significant and reliable source of funding,” the report concluded that “a combination of these funding
sources would likely be necessary.”81
The proposal to have the DEP assume administrative control of the MS4 stormwater permit program
has placed renewed focus on the idea of a “unified” or “holistic” regulatory system. Some
stakeholders believe that such an approach might lead to a weakening of current standards and
enforcement due to lack of staffing and resources at the DEP, leading to “a backlog in issuing water
supply permits and conducting five-year permit reviews; multi-year delays in monitoring, assessing
and reporting on water quality around the state; discontinued developing pollution control plans; and
inconsistently enforced water protection rules.”82
By contrast, advocates argue that a consolidated regulatory framework—especially when coupled
with additional financial incentives—would provide more certainty to municipalities about:
where, when and how to make water infrastructure investments;
embarking on long-term regionalization plans; and
embracing innovation and best practices.
For example, in his written testimony in support of DEP’s assumption of the MS4 administrative role,
Northborough Town Administrator John W. Coderre noted that “MassDEP ownership of the program
would provide greater opportunity for municipalities to successfully implement integrated water
resources planning and address multiple regulatory requirements and community infrastructure needs,
all while maintaining affordable water and sewer rates.”83
81 “Massachusetts Department of Environmental Protection Report to the General Court of the Commonwealth on the Topic of NPDES Authorization,” op. cit. 82 Blatt, Julia, Letter to the Joint Committee on Environment, Natural Resources, and Agriculture, May 5, 2016, Pg. 2 83 Letter, Town of Northborough town Administrator to Joint Committee on Environment, Natural Resources and Agriculture, 06/28/2016, pg. 2

Costs, Regulation, and Financing of Massachusetts Water Infrastructure: Implications for Municipal Budgets Findings and Policy Recommendations
36
DEP’s response to the Joint Committee made a similar point: “MassDEP would work with [communities]
and other stakeholders to identify the long term needs within the municipal wastewater, stormwater and
water supply infrastructure. Based on environmental and public health impacts, municipal priorities and
associated costs, projects would be prioritized in order to develop a master plan for the long term
management of all wastewater, stormwater, and water supply infrastructure within the municipality.”84
Some environmental advocates have expressed concern that state officials would be less rigorous in
enforcement of federal rules than the EPA has been. There is relatively little scholarly literature examining
the effect of delegation on the rigor of enforcement, but a 2007 doctoral dissertation by Northeastern
University’s David L. Whelpley focused on precisely this question. Comparing federal Clean Water Act
regulatory enforcement and water quality outcomes in Boston Harbor and San Diego Harbor, Whelpley
concluded that “[t]he evidence in this study suggests that the EPA, even when policy responsibility is
delegated to the states, maintains an active role in enforcing the Clean Water Act.” Evaluating the results,
he found that no erosion or mitigation of enforcement in California, where state officials applied the
federal standards.85
Recommendation
The Legislature should approve legislation to allow DEP to assume responsibility for issuing MS4
stormwater permits under EPA’s NPDES regulatory standards but mandate that funding for the change
come from a combination of sources, including not only the state’s general fund but also:
a user fee modeled on DEP’s current Section 70 drinking water assessment and
a fee paid by major point industrial and commercial sources based on impervious area or
discharge flow rates.
In this way, cost impacts on any one state, local, or private sector source can be minimized.86
84 Ibid., pg. 6 85 Whelpley, David L., The State and Municipal Effect: Enforcing the Clean Water Act in Massachusetts/California – Boston/San Diego, Northeastern University, Boston, 2007, pp. 166-7 86 “Massachusetts Department of Environmental Protection Report to the General Court of the Commonwealth on the Topic of NPDES Authorization,” 07/01/2013, pg. 4, pp. 38-39, pg. 43

Costs, Regulation, and Financing of Massachusetts Water Infrastructure: Implications for Municipal Budgets Findings and Policy Recommendations
37
With this additional authority and the additional funding incentives outlined in Recommendations 1 and
3, DEP should work with municipalities to develop 10-year rolling capital investment compacts for water
infrastructure in order to provide greater stability and predictability to communities in allocating water
system dollars.

Costs, Regulation, and Financing of Massachusetts Water Infrastructure: Implications for Municipal Budgets Appendix A: Invitation and Online Survey Form
38
APPENDIX A
DLM Survey: Local Cost Impacts of Required Water Systems Maintenance, Upgrade and Innovation – Invitation and Online Form

Costs, Regulation, and Financing of Massachusetts Water Infrastructure: Implications for Municipal Budgets Appendix A: Invitation and Online Survey Form
39
From: Thomas Champion Sent: Monday, November 09, 2015 3:08 PM
To:
Subject: State Auditor Suzanne M. Bump Seeks Your Participation in Water Infrastructure Cost Survey
Dear Municipal Executive: The Division of Local Mandates (DLM) – a unit within the Office of State Auditor Suzanne M. Bump – is asking your assistance with a project of direct and vital significance to every community in the commonwealth. Whether the topic is drinking water, wastewater or stormwater, the challenge posed by aging, obsolete and, in some cases, inadequate water infrastructure constitutes a serious threat to the long-term economic and physical health of communities across Massachusetts. In 2012, the Massachusetts Water Infrastructure Commission cited a statewide, 20-year funding gap of $21.4 billion between currently planned public investment and the actual funding necessary to maintain capacity, ensure quality and meet future demand in our state’s water systems. That estimate did not, however, take account of new regulatory requirements at the federal level (such as the EPA’s recently promulgated Municipal Separate Storm Sewer System permit regulations, aka MS4) and at the state level (notably the Sustainable Water Management Initiative, or SWMI). The Commission’s 2012 estimate also did not include potential infrastructure costs resulting from sea and river level increases or increased storm intensity and runoff amounts due to climate change. Many local governments have already indicated that these new costs have not been adequately analyzed – and that they will add greatly to the fiscal burdens of cities and towns across the commonwealth. While DLM may be best-known as the agency responsible for determining whether a state statute, regulation or policy imposes an unfunded mandate under the state’s local mandate law (M. G. L. c. 29, s. 27C), it is also empowered to review any law or regulation that has a significant impact on local government (M.G.L. c. 11, s. 6B). Given the enormous potential impact of state regulations and policies on the water infrastructure costs confronting Massachusetts cities and towns, DLM is therefore undertaking a Municipal Impact Study to update the estimate of water infrastructure investment gap and to examine potential best practices, regulatory strategies and funding mechanisms designed to help close that gap. A crucial first step in developing this study is to ask cities and towns to share their own best estimates of costs and resources – as well as to solicit local input on the current use of various funding sources and the embrace of new water system strategies and technologies designed to improve efficiency and manage costs. DLM is therefore seeking your assistance in fast-tracking the online survey you will find at this link Click here. Please note that some questions require only a yes-or-no response. Some require a monetary figure. (Please use numbers, not words; i.e., “1,000,000” not “one million” and do not insert dollar signs.) Some questions require a narrative text response; if you need more space than has been provided, please send me an email at [email protected] with the text of your full replies. Please also feel free to call or email me (see contact info below) if you have questions or concerns.

Costs, Regulation, and Financing of Massachusetts Water Infrastructure: Implications for Municipal Budgets Appendix A: Invitation and Online Survey Form
40
This is a substantial request, but we hope you will agree that this survey can provide both context and an added sense of urgency to state and local efforts to address one of the greatest challenges to the continued health, economic vitality and quality of life of communities throughout Massachusetts. Please respond as quickly as you can – and thank you in advance for your invaluable assistance. Thomas P. Champion Policy Research Analyst Office of the State Auditor, Suzanne M. Bump Division of Local Mandates One Winter Street - 9th Floor Boston, MA 02108 Direct Tel: 857-242-5427 Office: 617-727-0025 ext. 5427 [email protected] =================================== Unsubscribe from this list Our mailing address is: Commonwealth of MA, Office of the State Auditor One Ashburton Place Room 1819 Boston, MA 02108 United States

Costs, Regulation, and Financing of Massachusetts Water Infrastructure: Implications for Municipal Budgets Appendix A: Invitation and Online Survey Form
41

Costs, Regulation, and Financing of Massachusetts Water Infrastructure: Implications for Municipal Budgets Appendix A: Invitation and Online Survey Form
42

Costs, Regulation, and Financing of Massachusetts Water Infrastructure: Implications for Municipal Budgets Appendix A: Invitation and Online Survey Form
43

Costs, Regulation, and Financing of Massachusetts Water Infrastructure: Implications for Municipal Budgets Appendix A: Invitation and Online Survey Form
44

Costs, Regulation, and Financing of Massachusetts Water Infrastructure: Implications for Municipal Budgets Appendix A: Invitation and Online Survey Form
45

Costs, Regulation, and Financing of Massachusetts Water Infrastructure: Implications for Municipal Budgets Appendix A: Invitation and Online Survey Form
46
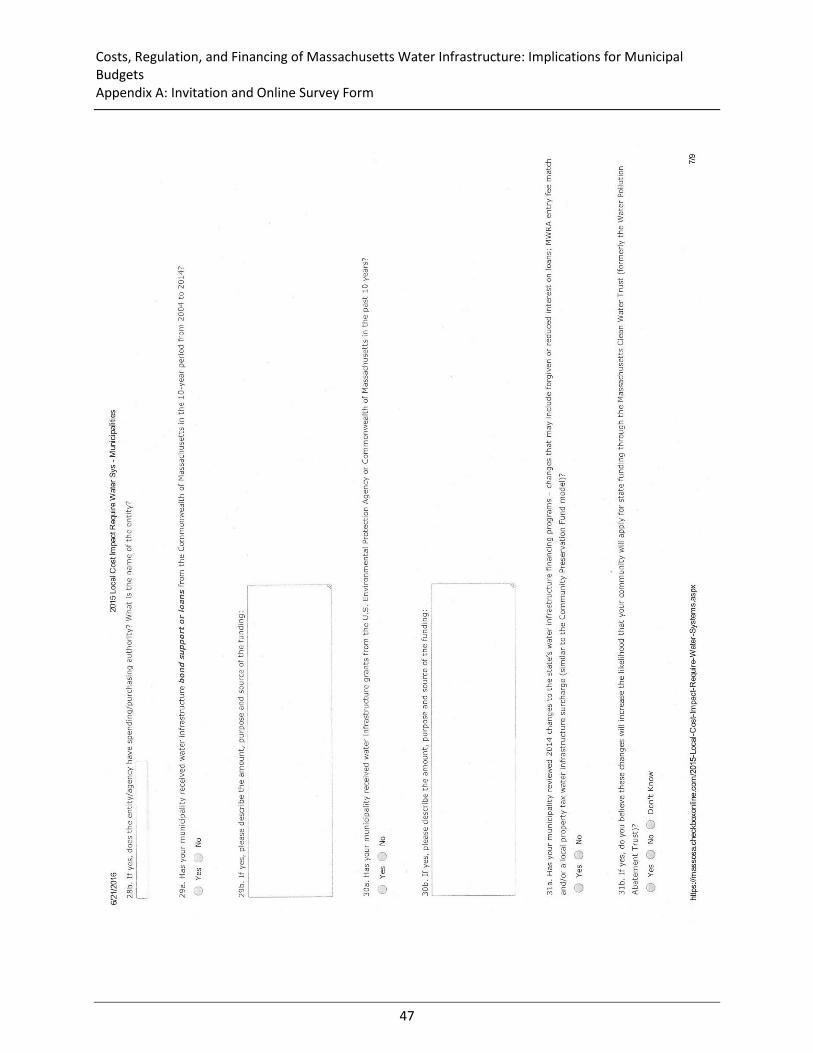
Costs, Regulation, and Financing of Massachusetts Water Infrastructure: Implications for Municipal Budgets Appendix A: Invitation and Online Survey Form
47

Costs, Regulation, and Financing of Massachusetts Water Infrastructure: Implications for Municipal Budgets Appendix A: Invitation and Online Survey Form
48

Costs, Regulation, and Financing of Massachusetts Water Infrastructure: Implications for Municipal Budgets Appendix A: Invitation and Online Survey Form
49

Summary of Responses Appendix B: Summary of Responses
50
APPENDIX B
Summary of Responses

Summary of Responses Appendix B: Summary of Responses
51
DLM Survey: Local Cost Impacts of Required Water Systems Maintenance,
Upgrade, and Innovation Total municipalities responding: 146
Total municipalities without public water system infrastructure (wells/septic-tanks only): 19
Total municipalities reporting public water systems: 127
State population living in responding municipalities (2010 Census): 4,205,959 (64% total state pop.)
Section 1: Drinking Water Funding and Improvement Programs 1a. Is your municipality a Massachusetts Water Resources Authority customer?
Yes 30 (20%) No 116 (80%)
1b. If yes, what MWRA services does your community use?
Water 22 Partial Water 5 Emergency Back-up Only 4
2. Does your municipality currently have a dedicated enterprise fund set up for your water system?
Yes 99 (68%) No 47 (32%)
3. How does your municipality assess drinking water rates?
Fixed Fee: 11 Block Rate: 71 Blend of Fixed, Block, Tier, or Other: 17
4. If a fixed fee, what is the amount charged? [Responding communities only]
City/Town Reply Bellingham $290
Beverly $3.56
Blackstone $60.00 per 10,000 gallons
Bolton $0
Charlton N/A
Gloucester $7.00
Hinsdale $460 annual
Hubbardston $0
Ipswich $8.01
Lakeville $0
Lancaster $48.75
Lawrence $3.10
Marlborough $6.89
North Attleborough $28.16
Norwood $2.68
Orleans $88.95
Pittsfield $181.80
Reading $0
Royalston $0
Salisbury $4.16
Topsfield $22.50
Wenham $32.50

Summary of Responses Appendix B: Summary of Responses
52
5. If a block rate, what is the water rate per 100 cubic feet (ccf) or 1000 gallons? [Responding
communities only]
City/Town: Unit and Rate
Abington $3.75 per 100 cubic foot unit (ccf)
Acton 4.3 cents [no unit provided]
Agawam $1.90 per ccf up to 4000 cubic feet > 4000 cubic feet at $2.38 per ccf
Amesbury $8.10 per ccf
Arlington 0-15 ccfs at $4.75 per ccf, 15-30 ccfs at $5.08 per ccf, 30 or more ccfs at $6.16 per unit
Attleboro $4.47 [no unit provided]
Barnstable $2.3637 per ccf
Bellingham $3.95 [no unit provided]
Belmont $6.06 per ccf
Boston 7.46 per 1000-gallon unit
Brockton 2.99 - 6.11 [no unit provided]
Brookline Blk 1: $1.85 Blk 2: $5.50
Canton 0-15 $3.44, 16-40 $6.10, 40-100 $10.07, 100+ $12.79
Chatham $4.90 [no unit provided]
Chelmsford 1000 gallons [no rate provided]
Chelsea 1-1000 cubic feet: $4.26 per ccf; 1,001-2,500 cubic feet: $5.19 per ccf; over 2,500 cubic feet: $6.21 per ccf
Chicopee $3.24 up to 1000 cubic feet, then $3.60 at greater than 1000 cubic feet
Concord $4.77 [no unit provided]
Danvers 100 cubic feet [no rate provided]
Dover $5.20 per thousand
East Longmeadow $2.95 [no unit provided]
Edgartown 1 - 50,000 gal = $2.00/1,000 gal. >50,000 gal. = $2.25 / 1,000 gal.
Everett $2.08
Fall River $2.65 per ccf
Fitchburg $3.16 [no unit provided]
Framingham $5.69-$10.50
Gardner $4.86 per ccf
Great Barrington $36.57 per billing includes 3,750 gals.; $1.37/1000 gals. - 3,750 - 7,500 gals.; $1.42/1000 gals. - 7,500 - 11,250 gals.; $1.47/1000 gals. - 11,250-22,500 gals.; $1.49/1000 gals.22,501+ gals.
Greenfield $2.67 per ccf
Groton $4 up to 40 units; $5 41-80 units; $6 81 units and over
Halifax 0 to 50,000 gallons - $3.45 per thousand gallons; over 50,000 gallon, $5.50 per thousand gallons
Hanover “varies depending on usage” [no unit or rate provided]
Harwich $1.29 per 0-15000, $2.65 per 15001-30000, $3.95 per 30001-70000, $5.72 per 70000+

Summary of Responses Appendix B: Summary of Responses
53
Haverhill $2.78 per ccf
Holliston 5.6 [no unit or rate provided]
Holyoke 4.509 [no unit or rate provided]
Hudson $3.67/1400CF 4.19/next 1400cf 4.26/ next2200cf 4.33/ next 5000 4.41/ balance
Huntington 4.50 per 1000 gallons; over 18000 5.50 per 1000 gallons
Lexington 7.09[no unit or rate provided]
Littleton [By separate email, Littleton provided a detailed rate structure that is appended at the end of this table]*
Lowell 51-100 $2.451 ccf
Medford 6.07 [no unit or rate provided]
Methuen varies
Milford $4.095/$6.143 [no unit provided]
New Bedford $2.17/ CCF
Newton 6.1
North Andover $3.80/100 cubic feet
North Attleborough 2.59
Northbridge 4.2389
North Reading 8.08/100 gal up to 10,000 gal; 11.85/1000 gal 10,000-22500 gal; 16.16/1000 gal >22,500 gal
Norton $3,37 $5.25
Norwood 2-steps - see item #9b
Orleans 0-15000 $1.88, 15001-30000 $4.64, 30001-50000 $5.97, over 50000 $7.23
Peabody 2.44, 2.66, 2.90 per 100 cubic ft
Pittsfield $1.31 per ccf
Provincetown varies, seasonal rate structure
Quincy 5.92/100 cu ft
Reading $8.83/ 100 cubic feet
Rockland 3.75 per 100 cubic feet
Rowley <3000g - $20.13/1000gal, 3001-20,000g - $24.18/1000g, >30,000 - $26.88/1000g
Sandwich Inclining $1 $2 and $3 / 1000 gal
Saugus Various
Scituate $1.16 per 100 cubic feet up to 1,200; $5.04 to 3,400 and $8.19 over 3,000 plus $61.75 per quarter meter charge
Shrewsbury Residential - $21 + $3.40-10/1000 gal, Commercial $36 + $2.80-3.80/1000 gal
Somerville Tiered
South Hadley (Town)
$4.80
South Hadley (Water District 1)
3.77/100 cu.ft.
Southwick 4.75

Summary of Responses Appendix B: Summary of Responses
54
Spencer 13.6
Stockbridge 3.95 per 100 cuft
Sturbridge $6.43 per 100 c-f
Topsfield $7.50 per 1000 gal 0-12, 8.85 per thousand 12-24, 12.50 per thousand 24+ per quarter
Ware $3.73 [no unit provided]
Wellesley Winter Block 1-5 CCF/month @ $2.99, additional CCF @$3.51; Summer block 6-12 CCF @$3.51, 13-24 CCF @$5.57, 25-36 CCF @ $7.21, Additional @ $9.18
Wenham $2.40/gallon for 5001-15000 gallons; $4.90/gallon for 15001-25000 gallons; $8.25/gallon over 25000 gallons
West Bridgewater 5.53 per 100 cu ft
West Newbury $9.68/1000 (0-35k) $12.31/1000(35<)
West Springfield 2 [no unit rate provided]
Weston 0-500 HCF = $1.35 & 500 + HCF = $5.10
Westport $8.80/100 cu ft
Whitman 7.25[no unit provided]
Yarmouth $1.68/1000 gallons
* Littleton: Base charge of $20.00 per customer per quarter and debt service charge of $1.40 per hundred cubic
feet per quarter, plus:
Hundred Cubic Feet per Quarter Dollars per Hundred Cubic Feet
Residential Level 1 0-25 $ 3.84
Residential Level 2 25-50 $ 3.94
Residential Level 3 50-75 $ 4.70
Residential Level 4 75-100 $ 4.82
Residential Level 5 Greater than 100 $ 4.92
Commercial & Industrial All $ 4.82
6. How much aggregate revenue did responding municipalities receive from this source in the following
fiscal years?
Total amount for all reporting communities:
FY2014: $677,867,833.66
FY2015: $713,746,070.20
7. Does your municipality have a drinking water system master plan (or water utility capital
improvement plan)?
Yes # 86 (59%) No # 60 (41%)
8. What is the total cost estimate to address the needs described in the water system master plan?
Total amount for all reporting communities:
$4,634,041,720 [$7.24 Billion statewide estimate based on population factors]

Summary of Responses Appendix B: Summary of Responses
55
9a. Does your municipality have a proposed implementation schedule in the master plan and does it
include projected impacts to the water rates?
Yes # 47 (32%) No # 99 (68%)
9b. What are the projected impacts? [Responding communities only]
City/Town: Projected Impacts
Acton Will require an approximate 5% increase in three year increments.
Agawam Currently reviewing projects and implementation schedule. Once complete, a rate analysis will be done to accommodate the project schedule.
Amesbury Fire protection is lacking selected areas of town, increasing insurance rates and hindering development. Water quality issues persist in several areas. Service interruptions are frequent in areas with older mains.
Arlington Our costs to maintain the system and construct the required capital improvements requires an approximate 4% rate increase per year
Barnstable Increase in water rates. 6% per year
Bellingham A capital fee was added to the fixed fee portion of the bill in 2014. The average rate payer pays $210 per year which generates $1,000,000 per year for capital projects. Sort of a forty year plans. To reduce the plan would require almost $400 per year per customer.
Belmont 5% or less
Blackstone We are up to date with the Corrosion Control Mandates
Boston Increase in debt service and increase in rate revenue projects
Brookline Proposed improvements to the Singletree Storage Tank through FY22
Cambridge Dropping debt service has allowed for no water rate increases in the last five years. Water debt service to drop to zero in two years. Pay as you go capital will be used to support master plan.
Charlton Currently we are a water customer of a neighbor town, the cost to become our own water supplier and service provider are prohibitive. The debt already incurred, presents a large potential impact on the entire town at least to the amounts owed $6,500,000
Chatham No increases anticipated at this time to existing water rates structure.
Chelsea Over the next 5 years almost $6M in water work is programmed into the City of Chelsea's CIP, currently based on water sold a cost of nine cents additional on the average water rate to raise $100K. Each $1M borrowed over a 10 year period of borrowing roughly costs $100K a year. The impact of borrowing $6M million over five years would cause a minimum of a fifty-four cents in water rates over five years of the work.
Chicopee Water rate increases are anticipated during the expected implementation of the master plan. The rate increases range from an estimated 10% in year FY 2017, then fluctuating between 3% and 5% in subsequent years.
Concord 4% rate increase annually in 1st step up to 2400 cubic feet bimonthly through 2026
Danvers The projected rate impact has not been determined. Retained earnings are utilized to fund capital improvement projects to avoid financing and/or bonding.

Summary of Responses Appendix B: Summary of Responses
56
Deerfield Impacts of what? do you mean improved piping and equipment, or do you mean improved availability and quality?
East Longmeadow
Rates would need to rise to 4.122 by 2031
Eastham The town wide system is under construction and expected to be complete by 2024. The town currently has no municipal water system.
Edgartown (Consolidated)
Meter replacement is included in the Operating Budget. This line item is for meter replacement only, not new installs. Based on our customer base, all meters will have a service life of no more than 20 years
Fitchburg Only most critical projects are being considered due to funding constraints - fully funding a "proper" capital improvement plan would be devastating in terms of rate increases to water system customers. The estimate of $100 million in needed improvements, etc. is work that is needed but not realistic in terms of funding - too much work has been put off over the decades and it is now beginning to "snowball" in terms of cost/extent to "catch up".
Foxborough Relining 21 miles of A/C pipe; Building a third green sand filtration plant at Station #1, Adding a chlorine Contact Chamber at Station #2; Rehabilitation of wells #1, #2 and #3; adding a valve maintenance and rehabilitation program; adding a meter replacement program and remote reading capability throughout the system; improving the IT capabilities of the system; replacing 25 miles of ancient undersized water main; adding a new water tank at Dudley Hill; extending and looping of poorly planned mains;
Framingham TBD
Georgetown Implementation and rate impact is still being developed.
Grafton 3% per year increase over the next 8 years
Great Barrington
The traffic flow will be the only thing impacted.
Greenfield yes we are planning on a 5% annual increase for the next 4 to 5 years
Groton The implementation was projected over the next 10 years; however, projected impacts to water rates have not been assessed.
Hanover We have recently completed a draft of the Water CIP - the impact includes budgetary increases for main replacement and an addition to our debt commitment for capital improvements to the three water treatment plants. The capital needs of the water infrastructure have been long neglected to keep rates low. We are committed to reversing this troubling trend.
Harwich The master plan does have an implementation plan but no projected fee structure., The implementation plan does not include rate impacts
Haverhill Rates are projected to increase 50% in year 2021. We do not project rates beyond 5 years. Beyond 5 years we expect rates will continue to increase significantly to continue to fund system improvements.
Hinsdale water meter replacement
Holliston The Town of Holliston has imposed a quarterly water infrastructure fee of $75 per quarter per customer to finance infrastructure improvements. Anticipated revenue is approximately 1.4 million per year. Holliston has approximately 100 miles of water main of which 60 miles are AC (transite) water main and are in need of immediate replacement. The infrastructure fee is not the complete funding answer
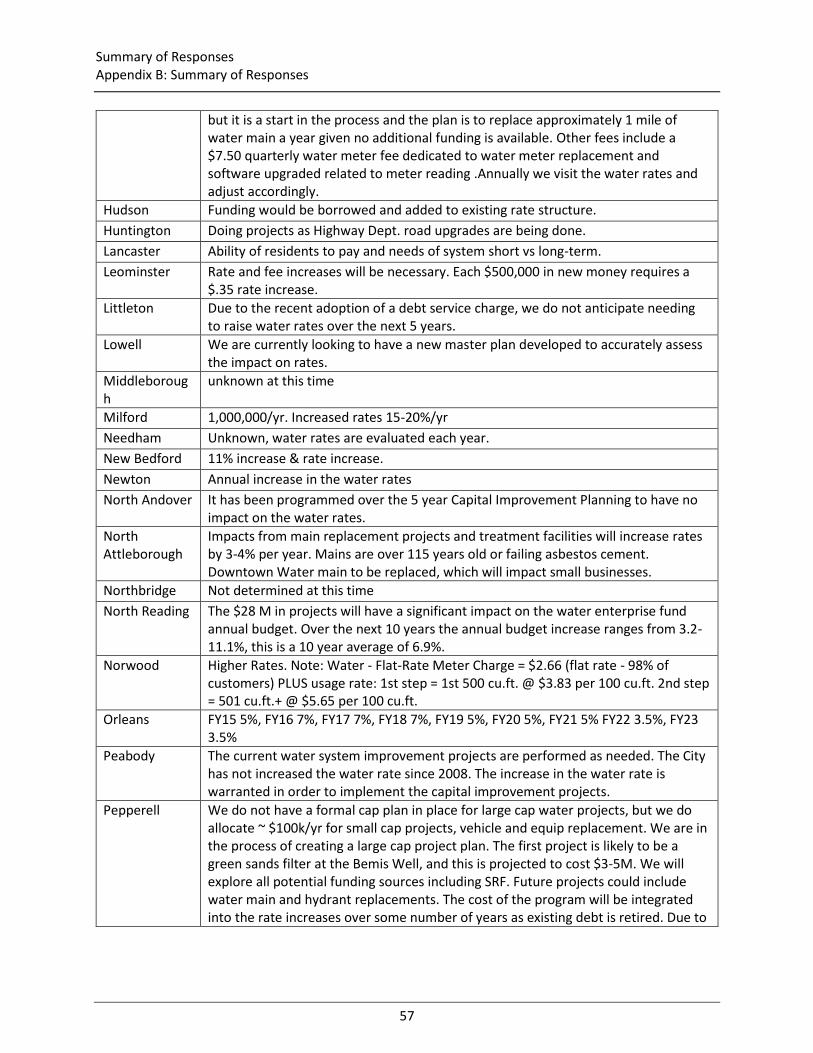
Summary of Responses Appendix B: Summary of Responses
57
but it is a start in the process and the plan is to replace approximately 1 mile of water main a year given no additional funding is available. Other fees include a $7.50 quarterly water meter fee dedicated to water meter replacement and software upgraded related to meter reading .Annually we visit the water rates and adjust accordingly.
Hudson Funding would be borrowed and added to existing rate structure.
Huntington Doing projects as Highway Dept. road upgrades are being done.
Lancaster Ability of residents to pay and needs of system short vs long-term.
Leominster Rate and fee increases will be necessary. Each $500,000 in new money requires a $.35 rate increase.
Littleton Due to the recent adoption of a debt service charge, we do not anticipate needing to raise water rates over the next 5 years.
Lowell We are currently looking to have a new master plan developed to accurately assess the impact on rates.
Middleborough
unknown at this time
Milford 1,000,000/yr. Increased rates 15-20%/yr
Needham Unknown, water rates are evaluated each year.
New Bedford 11% increase & rate increase.
Newton Annual increase in the water rates
North Andover It has been programmed over the 5 year Capital Improvement Planning to have no impact on the water rates.
North Attleborough
Impacts from main replacement projects and treatment facilities will increase rates by 3-4% per year. Mains are over 115 years old or failing asbestos cement. Downtown Water main to be replaced, which will impact small businesses.
Northbridge Not determined at this time
North Reading The $28 M in projects will have a significant impact on the water enterprise fund annual budget. Over the next 10 years the annual budget increase ranges from 3.2-11.1%, this is a 10 year average of 6.9%.
Norwood Higher Rates. Note: Water - Flat-Rate Meter Charge = $2.66 (flat rate - 98% of customers) PLUS usage rate: 1st step = 1st 500 cu.ft. @ $3.83 per 100 cu.ft. 2nd step = 501 cu.ft.+ @ $5.65 per 100 cu.ft.
Orleans FY15 5%, FY16 7%, FY17 7%, FY18 7%, FY19 5%, FY20 5%, FY21 5% FY22 3.5%, FY23 3.5%
Peabody The current water system improvement projects are performed as needed. The City has not increased the water rate since 2008. The increase in the water rate is warranted in order to implement the capital improvement projects.
Pepperell We do not have a formal cap plan in place for large cap water projects, but we do allocate ~ $100k/yr for small cap projects, vehicle and equip replacement. We are in the process of creating a large cap project plan. The first project is likely to be a green sands filter at the Bemis Well, and this is projected to cost $3-5M. We will explore all potential funding sources including SRF. Future projects could include water main and hydrant replacements. The cost of the program will be integrated into the rate increases over some number of years as existing debt is retired. Due to

Summary of Responses Appendix B: Summary of Responses
58
the very preliminary state of the large cap project program, the actual % increases have not yet been determined.
Pittsfield By the year 2025, the water rates would increase at least 100% in order to pay the debt service attributed to the water CIP.
Reading Debt payments to increase and use of MWRA Pipeline Assistance grant loans, and will most likely be offset by rate increases
Salisbury Water Rates increased on 1-1-2015 for 5 years.
Sandwich (Consolidated)
There is currently a Capitol needs plan commissioned for the Sandwich Water District a Special District that provides water for approximately 75% of the town of Sandwich. The rest of the Town is currently on private wells.
Scituate $22M water pipe replacement project approved November 2013 (included in #8) - approx. 21 miles of cast iron pipes replaced over 3 phases. Phase I complete, Phase II ongoing & Phase III in 2016. FY14 rates increased 10%, FY15 rates increased 19.2% and FY16 rates increased 19.5%.
Shrewsbury There will be increases to the water rates as needed to support necessary capital projects.
Somerville Anticipated impacts:2% increase per year
Springfield substantial rate increases
Sturbridge Whittemore Road Booster Station Replacement, Water Main & Hydrant Replacement, Storage Tank Painting, Perchlorate Study, EPA & MADEP mandates, Other. Impact to small customer base is unaffordable as water rates are already very high due to recent capital improvements and system mandates.
Topsfield Replacement of distribution mains, tanks, wells, and station upgrades.
Truro Truro does not own or operate water infrastructure. Areas of North Truro that are served by town water is managed and operated by Provincetown.
Waltham Projects are scheduled in a manner to have minimal impacts on rates
Wellesley Built into overall rates (see #10)
West Bridgewater
We recently completed several capital projects. We painted and rehabbed two water tanks, built a 1 million gallon tank, ran new water mains to it, replaced water meters town wide, replace fire hydrants, built a treatment plant. This is about to increase our water rates 45%
West Newbury Water supply ($4,685,000) Storage/Transmission ($2,039,000) High/low service area ($2,095,000) Secondary transmission ($777,000) Restrictions (fire flow) ($1,336,000)
Whitman We have been systematically replacing water mains as we are able to fund the improvements. While there is no master plan in place, much of the old cast iron and asbestos pipes have been replaced or are being done so in our current construction project.
Worcester for 5-year capital improvement plan water rates would increase by $0.45 per hcf ($0.09 per year)
Yarmouth Projects can be done within available funds.
10. What is the average percentage by which rates would be required to increase in order complete the
required water treatment system improvements (include both O&M costs and bond repayment)?
[Responding communities only]

Summary of Responses Appendix B: Summary of Responses
59
City/Town Projected Rate Increase
Abington 58
Acton 5 percent per 3 yrs
Agawam TBD
Amesbury 60%
Barnstable 6%
Bellingham 45% estimated
Belmont 5%
Beverly 100%
Bolton $0
Boston 2.83%
Brockton 30% +
Brookline <1%
Cambridge 0 to 3%
Chatham 0%
Chelmsford pending permit conditions
Chelsea 2% per annum
Chicopee range of 3% to 5% annually
Clarksburg 250
Concord 4%
Danvers 18%
Deerfield 300%
East Longmeadow
65%
Eastham Tax rate increase is projected to be 30% or $800 for the average home in a single year.
Edgartown Depending on how we plan our capital needs will dictate the rate structure. A 10% increase would provide the revenue for near distant needs, but we must work within reasonable needs.
Falmouth Doing a study
Fitchburg 300%
Foxborough 15-25%
Framingham TBD
Georgetown 80-100% (rough estimate)
Gloucester >20%
Grafton 15%
Great Barrington Without knowing what the costs associated with materials is I cannot say if an increase to water rates would be implemented.
Greenfield 25 -30

Summary of Responses Appendix B: Summary of Responses
60
Groton unknown
Hanover At least 10%
Harwich 5-6%, 5-6%
Haverhill See 9b above
Hawley 0
Holliston more than rate payers could absorb
Hudson 5-10%
Huntington 50%
Lancaster 60
Leominster $5 MM @ 2% is about $350,000/yr. $.24 or 7%
Lexington no water treatment
Littleton 0
Middleborough under review
Middleton 8
Milford 50-80
Needham Unknown
New Bedford 11% per year for 3 years
Newton 4
North Andover 0%
North Attleborough
20
Northbridge Not determined at this time
North Reading over 70% increase over 10 years
Norwood 15%-20%
Orleans 35%
Paxton 50% each year
Peabody 10% per year for 10 years
Pittsfield 100% by 2025
Quincy unknown
Reading 10%
Rockland 50
Salisbury 33%
Saugus 300
Scituate at minimum, another 19-20%
Shrewsbury Depends on implementation structure
South Hadley (Town)
100%
South Hadley (Water District 1)
10%-15%
Springfield unknown at this time

Summary of Responses Appendix B: Summary of Responses
61
Sturbridge Unknown
Topsfield ~100%
Waltham See 9b
Wareham 700
Wellesley Average 6.2% increase per year
West Bridgewater
45
West Newbury 50%
West Springfield 100
Weston N / A - No treatment in community
Whitman 0.5
Worcester 12%
Section 2: Wastewater Funding and Improvement Programs
11. Does your municipality currently have a dedicated enterprise fund set up for your sanitary sewer and
treatment system?
Yes # 69 (47%) No/No answer # 77 (53%)
12a. How does your municipality assess sewer rates?
Fixed Fee: 15
Block Rate: 47
Blended Fixed + Block, Tier or Other: 24
No fees charged/left blank: 60
12b. If a fixed fee, what is the amount charged? [Responding communities only]
City/Town Amount
Bellingham $170.00
Beverly $5.61
Blackstone 100.00 per 10,000 gallons
Bolton $0.00
Charlton $70 per bedroom
Chicopee $0.00
Concord $10.86
Falmouth $6.10
Gloucester $13.80
Great Barrington $460.00
Hinsdale 100.00,210.00 & 230.00
Hubbardston $0.00
Lakeville $0.00

Summary of Responses Appendix B: Summary of Responses
62
Lawrence $3.35
Lowell $3.42
Marlborough $7.11
North Attleborough $61.36
Palmer $460.00
Pittsfield $151.20
Reading $0.00
Royalston $390.00
Salisbury $40.00
Wareham $695.00
12c. If a block rate, what is the rate?
City/Town: Block Rate
Agawam 3.04/ccf
Amesbury 6.75
Attleboro 9.1
Barnstable 4.42 per ccf
Bellingham 9.25
Belmont $11.81
Bolton $0
Boston $9.89
Brookline $3.90
Canton 0-15 7.77, 16-40 8.79, 40-100 11.61, 100- 14.88
Charlton $0.08 per cubic foot
Chatham $7.35
Chelsea $8.11
Chicopee 6.79
Danvers 6.6
East Longmeadow
2.8
Essex 20.88
Everett $5.68
Fall River 4.29 per ccf
Fitchburg $7.30
Framingham $7.07
Gardner $4.50
Haverhill 4.12
Holyoke 5.4
Hubbardston 0
Hudson $5.29/100cf based upon water consumption
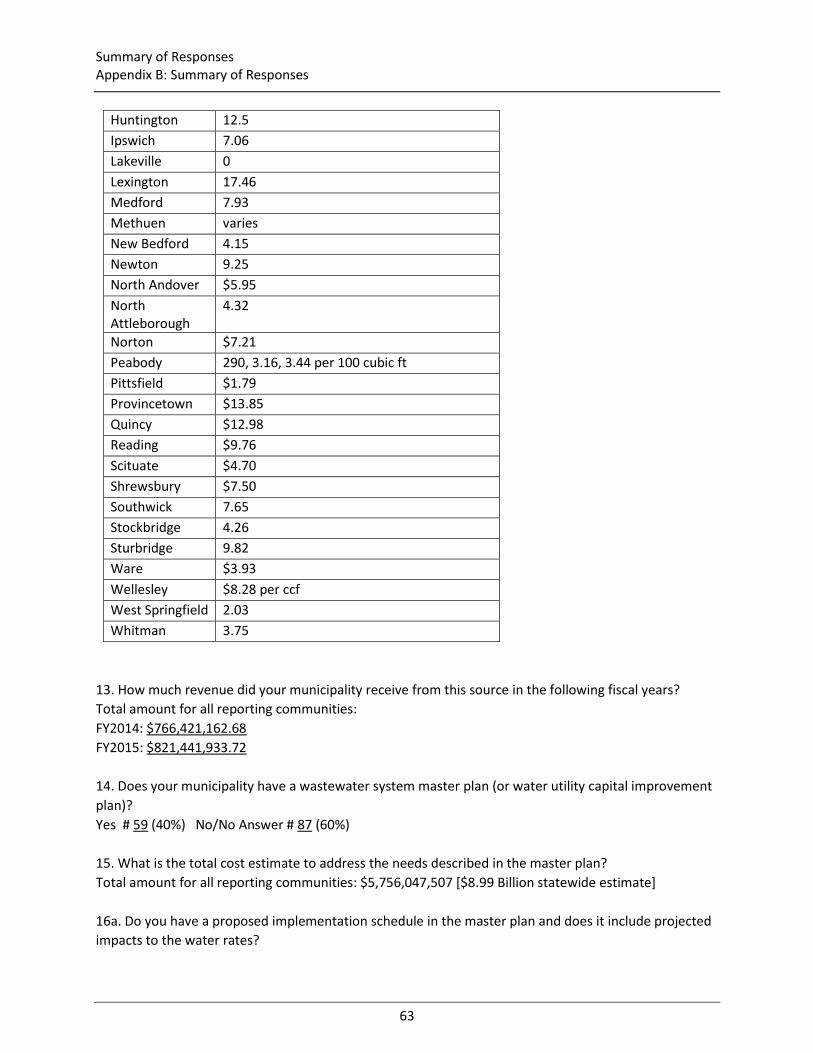
Summary of Responses Appendix B: Summary of Responses
63
Huntington 12.5
Ipswich 7.06
Lakeville 0
Lexington 17.46
Medford 7.93
Methuen varies
New Bedford 4.15
Newton 9.25
North Andover $5.95
North Attleborough
4.32
Norton $7.21
Peabody 290, 3.16, 3.44 per 100 cubic ft
Pittsfield $1.79
Provincetown $13.85
Quincy $12.98
Reading $9.76
Scituate $4.70
Shrewsbury $7.50
Southwick 7.65
Stockbridge 4.26
Sturbridge 9.82
Ware $3.93
Wellesley $8.28 per ccf
West Springfield 2.03
Whitman 3.75
13. How much revenue did your municipality receive from this source in the following fiscal years?
Total amount for all reporting communities:
FY2014: $766,421,162.68
FY2015: $821,441,933.72
14. Does your municipality have a wastewater system master plan (or water utility capital improvement
plan)?
Yes # 59 (40%) No/No Answer # 87 (60%)
15. What is the total cost estimate to address the needs described in the master plan?
Total amount for all reporting communities: $5,756,047,507 [$8.99 Billion statewide estimate]
16a. Do you have a proposed implementation schedule in the master plan and does it include projected
impacts to the water rates?

Summary of Responses Appendix B: Summary of Responses
64
Yes # 35 (24%) No/No Answer # 111 (76%)
16b. What are the projected impacts? [Responding communities only]
City /Town Projected impacts
Agawam Currently reviewing projects and implementation schedule. Once complete, a rate analysis will be done to accommodate the project schedule.
Amesbury Minimal in the near future. Long term the Inflow and Infiltration will hinder development or force a treatment plant upgrade costing millions.
Arlington Our costs to maintain the system and construct the required capital improvements requires an approximate 4% rate increase per year
Barnstable Increase in rates.
Bellingham Treatment plant upgrade capital costs have driven a 20% rate increase applied 12/1/2016.
Boston Increase in debt service and increase in rate revenue projects
Brookline 12-Year Sanitary Sewer CIP focusing removal of Inflow and Infiltration
Cambridge We have $150M budgeted over the next 5 years, but the budget need is significantly greater (3x).
Charlton Currently the annual budget is managing the expenses and capitalization needed
Chatham Impacts to rates are unknown at this time.
Chelsea Over the next 5 years almost $7.5M in water work is programmed into the City of Chelsea's CIP, currently based on water sold a cost of nine cents additional on the average sewer rate to raise $100K. Each $1M borrowed over a 10 year period of borrowing roughly costs $100K a year. The impact of borrowing $6M million over five years would cause a minimum of a sixty-seven cents in water rates over five years of the work.
Chicopee Sewer rate increases are anticipated during the expected implementation of the master plan. The rate increases range from an estimated 35% in year FY 2017, then fluctuating between 20% and decreasing to 6% in subsequent years.
Concord 3% per year rate increase through 2026
Conway undetermined
Danvers The projected rate impact has not been determined. Retained earnings are utilized to fund capital improvement projects to avoid financing and to bonds where possible.
Fall River Residential Indicator (% of median household income) would increase from 0.84% to 2.66% in the first 20 years of implementation.
Falmouth Minimal. Plan increases user base with limited added operational costs
Fitchburg Rate impacts not yet known. In FY17 the Wastewater Enterprise Fund will be undertaking a rate study and affordability analysis and initiating an asset management system and fiscal sustainability plan in accordance with CWSRF 2016 requirements.
Foxborough Adding additional mains to serve failing septic areas in town; future treatment plant additions due to new mandates.

Summary of Responses Appendix B: Summary of Responses
65
Framingham TBD
Greenfield Increases to the sewer rate for the next two years of 5%
Haverhill Rates are projected to increase 48% in year 2021. We do not project rates beyond 5 years. However, based on the additional capital needs beyond 5 years, we expect rates will continue to increase significantly to continue to fund system improvements.
Holliston Holliston does not have a residential municipal waste water system
Hudson Funding would be borrowed and added to rate structure.
Huntington No data available
Lancaster South Lancaster is under a separate Sewer District. North Lancaster does not have sewer infrastructure in place, but the town is discussing the need as that is the location of the most commercial development potential (700 acres!)
Leominster Sewer rates will need an additional $.45 beginning in FY'21.
Lowell Master Plan and CIP are being updated in 2016 to assess impacts.
Mashpee Mashpee currently has no public wastewater treatment works. The new master plan addresses the wastewater management needs for the Town and includes traditional and non-traditional approaches. The development of a finance plan is still pending so no decisions have been made about cost allocation and rate impacts.
Needham Unknown sewer rates are evaluated each year.
New Bedford NPDES Violations, CSO Violations, MS-4 Violations, CMOM Violations
Newton Annual increase to the sewer use charge
North Andover It has been programed over the 5 year Capital Improvement Planning to have no impact on the water rates.
North Attleborough
Sewer Lining and removal of infiltration and inflow.
Northbridge TBD
Norwood Higher Rates. Note: No min. charge. Sewer Use = 60% of metered water use in cu.ft. Usage rate: 1st step = 1st 300 cu.ft. @ $7.86 per 100 cu.ft. 2nd step = 301+ cu.ft. @ $15.17 per 100 cu.ft. Norwood's Sewer System dates pre-1920's and has major infiltration problems. In addition, the Sewer System in older parts of the community were laid with under-drains, meant to siphon off groundwater before it infiltrated the sewers. The under-drains in turn feed into the storm drainage system and ultimately into local water-ways. However, the clay pipes used in that era tended to leak, causing exfiltration of sewage into the under-drains and then into the storm drainage system and local water-ways.
Peabody The City's capital plan identifies $11 million worth of projects over the next 5 years. The sewer rate has not adjusted since 2008. The increase is the sewer rate is warranted in order to implement the capital improvement projects.
Pepperell We do not have a formal cap plan in place for large cap sewer projects, but we do allocate ~ $100k/yr for small cap projects, vehicle and equip replacement. We are in the process of creating a large cap project plan. The first project is likely to be a WWTF upgrade to meet the requirements of the pending NPDES Discharge

Summary of Responses Appendix B: Summary of Responses
66
Permit, and this is projected to cost $4-5M. We will explore all potential funding sources including SRF. Future projects would likely include wide scale collection system repairs. The cost of the program will be integrated into the rate increases over some number of years as existing debt is retired. Due to the very preliminary state of the large cap project program, the actual % increases have not yet been determined.
Pittsfield By the year 2025, the sewer rates would increase at least 160% in order to pay the debt service attributed to the sewer CIP.
Reading Debt payments to increase and use of MWRA I/I grant loan assistance, and will most likely be offset by rate increases
Revere Maximum of 2% of mean household income
Salisbury Raised the sewer rates as part of the Towns 5 year capital improvement plan in the amount of $10/EQR. [Equivalent Residential Unit] The old rate was $30/EQR. Effective January 1, 2015 it went up to $40/EQR.
Sandwich (Consolidated)
Currently in process of developing a CWRMP-Comprehensive Water Resource Management Plan. Impacts are nitrogen impacts on embayments and groundwater protection. No cost has been established at this time.
Scituate Expansion of system has been and would be financed by betterments.
Shrewsbury There will need to be increases in the sewer rates depending on project implementation.
Somerville 5% increase per year
Spencer This is not my department. I am not going to be able to answer these questions.
Springfield significant impacts to traffic and services, potential finance issues
Sturbridge Sewer main / Manhole Replacement, Pump Station Upgrades, Improved Sewer Service Area Coverage. Impact to small customer base is unaffordable as sewer rates are already very high due to recent capital improvements and system mandates.
Waltham Projects are scheduled in a manner to have a minimal impact on rates
Wareham The rates will increase yearly
Wellesley Built into overall rates (see #17)
Whitman The Town of Whitman is connected to the City of Brockton Sewer treatment plant and pays the City of Brockton based on flow.
Worcester For 5-year capital improvement plan rates would increase by $1.10 per hcf ($0.22 per year)
Yarmouth Sewer rates to be established in the future.
17. What percent increase to water rates would be required to complete the required water treatment
system improvements (include both O&M costs and bond repayment)? [Responding communities only]
City/Town: Estimated Percentage Increase
Agawam TBD
Amesbury 30%
Barnstable 3% increase per year
Bellingham That was done on 12/1/2016 - 20% increase
Beverly 110%

Summary of Responses Appendix B: Summary of Responses
67
Bolton $0
Boston 4.70 % annually
Brockton 15%
Brookline 2.5% +/-
Cambridge 7.5 to 8.5%
Charlton Estimating an 8 percent
Chatham None anticipated at this time
Chelsea 1.5% per annually for the proposed five year program
Chicopee Range from 20% to 6% annually
Clarksburg 10
Concord 3%
Danvers The Town of Danvers received an SRF Loan for the rehabilitation of the Water Treatment Plant. The principal and interest payment for FY 2015 is $1,294,023 which represents approximately 16.4% of the budget.
Eastham n/a The town does not have any sewer systems. we are working with the regional planning agency to participate in regional watershed protection plans.
Fall River Annual revenue requirement increases from $17,097,344 in FY16 to $65,729,250 in FY36.
Falmouth 0
Fitchburg Not yet known, wastewater rate study will be completed in FY17.
Foxborough Unknown
Framingham TBD
Greenfield 10 to15%
Haverhill See 16b above
Hudson 10-15%
Huntington No data available
Lancaster need to establish rates for any new system in north Lancaster.
Leominster 11-12%
Lexington no waste treatment sent to MWRA
Mashpee see above
Methuen 10% for the next 4 years
Milford Plan to implement without increasing rates
Needham Unknown sewer rates are evaluated each year.
New Bedford 11% per year for 3 years until 2020
Newton +/-4%
North Andover 0%
North Attleborough
10%
Northbridge TBD
Norwood annual 8%-10% increase, compounded.
Peabody unknown
Pittsfield Poorly drafted question.

Summary of Responses Appendix B: Summary of Responses
68
Quincy unknown
Reading 5%
Salisbury 30% increase as part of the Town's 5 year capital improvement plan.
Saugus 300
Scituate Expansion of system has been and would be financed by betterments.
Shrewsbury Depends on yearly scheduling of capital improvements.
Southwick Currently evaluating an increase up to $9.00/1,000 gallons to offset increase in treatment costs (through Westfield WWTP) and in-Town pump station upgrades, grinder pump maintenance, and other costs.
Springfield rate increase between 5-15% every year
Sturbridge Unknown
Waltham See 16b
Wareham 200% over 20 years
Wellesley Average 5.2% increase per year
West Springfield 100
Whitman Undetermined.
Worcester 17% for our planned CIP. That figure could increase dramatically if EPA issues new permits for stormwater, cso control and wastewater treatment for the regional wastewater treatment facility.
Section 3: Stormwater Compliance and Capacity Programs
18. Is your municipality subject to the exiting MS4 permit?
Yes # 95 (65%) No/No Answer # 51 (35%)
19. How are necessary funds currently obtained for MS4 permit compliance?
Local property taxes/Operating Budget: 62
User Fees/Enterprise Fund: 12
Water and/or sewer rates: 6
State Grants, Multiple Sources, Other (Describe):16
Not Subject to stormwater permit or no answer: 50
20. Is your municipality:
Located within the Charles River watershed?
Yes 14 No/No answer 132
Contain a lake/pond watershed with an approved Total Maximum Daily Load (TMDL) for phosphorus?
Yes 18 No/No answer 128
Contain a water body with an approved TMDL for bacteria or pathogens?
Yes 32 No/No answer 114
Located within the Cape Cod or Buzzards Bay watersheds?
Yes 17 No/No answer 129
Located within the Assabet River watershed?

Summary of Responses Appendix B: Summary of Responses
69
Yes 5 No/No answer 141
Located within the watershed of Long Island Sound?
Yes 12 No/No answer 134
21. Does your municipality discharge into other out of state water bodies with approved TMDLs?
Yes 8 No/No answer 138
22. Aggregate current annual expenditures for stormwater systems?
$57,456,957.00
23. Projected aggregate annual expenditures for stormwater compliance over the next 20 years?
$1,009,494,219.00 [$1.58 Billion statewide estimate] [$50,474,710 annually or statewide estimate of
$78.9 million annually]
24a. Does your municipality anticipate a need to hire additional staff to ensure compliance with the new
MS4 permit?
Yes # 62 (42%) No/No Answer # 84 (58%)
24b. Aggregate additional employees?
130 [Statewide estimate: 203]
24c. Aggregate additional annual cost?
$8,076,000.00 [$12.6 Million statewide estimate]
Section 4: Additional Questions for all Communities
25. What new requirements is your municipality subject to relating to the treatment of drinking water,
wastewater, or stormwater over the next 5 years? (Disinfectants and Disinfection Byproducts; increased
Infiltration and Inflow correction, MS4, Nitrogen or Phosphorus removal, etc.) [Responding communities
only]
Abington Disinfection Byproducts. Possibly Manganese removal
Acton Water Management Act Permit renewal, Abatement of industrial contamination from two EPA Superfund sites specifically 1,4-Dioxane (Emerging Contaminant) removal
Agawam Water Management Act Permits, Disinfection and Disinfection Byproducts, Increased Infiltration and inflow correction, MS4
Amesbury All of them?
Arlington II correction, MS4, Phosphorous reduction, Sewer System overflow elimination
Attleboro All listed above.
Barnstable All the above and: 208 plan, CEC, UCMR3, watershed permits, etc.
Bellingham Charles River MS4 TMDL (Phosphorus), Enhanced Sewer I&I, Drinking water we just completed 15.4 Million filtration plant construction project
Belmont all of the above.
Beverly DEP, WMA, I/I, MS4, TMDL (bacteria)
Blackstone CLEAN BASINS AND FIXING OUTFALLS AND WATER SAMPLING.

Summary of Responses Appendix B: Summary of Responses
70
Bolton None
Boston Phosphorus removal and removal of illegal sanitary connections
Bourne The Town of Bourne has three separate Water Districts. None of the three are affiliated with the Town of Bourne Municipal operations.
Brockton DEP, Water Management Act Permits, Disinfectants and Disinfection Byproducts; increased Infiltration and Inflow correction; MS4;NPDES, Lead and Copper; CMOM
Brookline MS4; Nitrogen & Phosphorous removal
Cambridge non anticipated for drinking water. Stormwater: MS4 changes, Phosphorous TMDL, Bacteria TMDL, sodium restrictions, infiltration and inflow corrections
Charlton Our treatment plant permit is currently being reviewed, it is not known what new requirements will have to be faced. The last Permit required a plant upgrade costing $1,800,000. Water recently required addition to the current water lines $1,855,000
Chatham Treatment for Manganese; ground water discharge permit; water withdrawal permit; & water management act
Chelmsford The Chelmsford Water District currently has concerns over the flowing regulations and the costs associated with them: WMA permits and requirements, DBPR2 compliance in combination with ground Water Rule Compliance, Iron and Manganese Residual disposal.
Chelsea All drinking water supplied by the City of Chelsea is provided by the Massachusetts Water Resources Authority. All sanitary sewer flows collected by the City of Chelsea are treated by the MWRA. As such, the impact of regulatory requirements is mostly felt financially by increases in the wholesale rates for water and sewer from the MWRA. Since the city still contains many streets with combined sewers, the city is approaching I&I correction typically by the wholesale replacement and separation of combined sewers through both self funding by borrowing and by application of grant receipts for the projects. Standard operating procedures in the City of Chelsea such as bi-weekly sweeping of each side of each street from March 1 through December 31 each calendar year, programmed catch basin cleaning where one third of all catch basins are cleaned each calendar as well as a lack of TMDL for the receiving waters of Chelsea and Mystic Rivers and low count of public stormwater outfalls (24), the small size of the city help the city efforts to comply with the MS4 program requirements. The amount of impervious surface (77%) and impermeable soils in the city make some aspects of compliance difficult.
Chicopee Currently: MS4, I/I correction, NPDES for wastewater, Consent Decree, Lead and Copper removal.
Clarksburg Our greater concern is that our Residents on the east side of Town, run by a co-op are experiencing frequent water outages, and capacity problems (failure to meet). There needs to be significant investments in water line replacements that neither the Town nor Co-op has.
Concord Water Management Act Permitting MS4 compliance and NPDES Wastewater Permitting
Danvers Danvers is most concerned about the impacts of WMA Permit Renewal and SWMI Regulations. Initial data provided by MADEP indicates that the Town's Water Withdrawal permit will be reduced by 10%. Second is the cost implications, staffing requirements, new stormwater permitting of local discharges, IDDE Investigations, funding source and other permit requirements under the NPDES Phase II

Summary of Responses Appendix B: Summary of Responses
71
Stormwater Program. Next is the cost implication (rate Increases) to meet the New State Sewer Regulations in 2017 with the permit & reporting requirements, mandatory I&I removal requirements.
Dartmouth All of the above and THM's [Trihalomethanes] & HAA's [Haloacetic acids]
Deerfield The Federal government, (EPA) is continually inventing new and challenging hoops to jump through, with increased testing and more stringent levels which are acceptable being enacted, the state level (DEP) has no other option to accept the EPA requirements. Right now it is the Total Coliform Rule, following in the near future will be Iron and Manganese rules and testing, it just never stops.
Dover MS4
Duxbury Drinking water will most likely require filtration and disinfection. We will most certainly require inflow correction to the collection system.
East Longmeadow
Disinfectants and Disinfection Byproducts; increased Infiltration and Inflow correction; MS4
Eastham n/a
Edgartown (Consolidated)
Based on the iron and manganese regulations, we may have a non compliant source in the near future. We are presently looking into other sources and increasing the yield on another source. It is unclear if there will be costs associated with permitting, as the process has not yet been finalized.
Egremont DEP, Water Management Act Permits
Essex DEP and EPA requirements and permits.
Everett Increased reduction of Infiltration and Inflow
Fall River Federal Sewage SIudge Incinerator regulations: shutting down our sludge incinerator increasing sludge trucking costs by $1,500,000/year; NPDES nitrogen removal requirements expecting to cost $88,000,000; CSO Project Completion projected to cost $113,700,000; SSO resolutions projected to cost $57,300,000; Disinfectant Byproducts potentially costing $25,000,000; this is all in addition to our needs to replace aged infrastructure.
Falmouth Disinfection Byproducts, Nitrogen TMDLs at WW plant, Water Management Act Permit mitigation requirements.
Fitchburg Water Management Act Permits, Disinfectants and Disinfection Byproducts, new MS4 permits, stipulations in Wastewater Consent Decree with US EPA and MA DEP (multi-faceted).
Foxborough Unknown
Framingham MS4 permit
Gardner Water- Water Management Act. Sewer-Nitrogen and Phosphorous Removal MS4 Sampling and Treatment expenses
Georgetown DRINKING WATER: Disinfection Byproducts was added a few years ago, but Georgetown has maintained compliance consistently. No additional treatment seems needed. Manganese was recently added, but Georgetown already has a water treatment plant designed to remove iron and manganese. WASTEWATER: Georgetown does not have a municipal sewer system. STORMWATER: New MS4 testing requirements to be determined.
Gloucester MS4 and denial of our 301(H) waiver for primary treatment
Granville N/A

Summary of Responses Appendix B: Summary of Responses
72
Great Barrington
PHOSPHORUS / NITROGEN LIMITS
Greenfield We are not sure. Our NPDES permit is under review and we have not heard about MS4 permit.
Groton Disinfectants and Disinfection Byproducts
Halifax DEP, Water Management Act, MS4 and while the new requirements are not connected with water quality at Monponsett Pond, that remains the Town's number one environmental concern because the City of Brockton has failed to maintain the water quality of the Pond as required under the 1964 legislation permitting them to divert water from the Pond for the City's water supply.
Hanover Disinfection byproducts - spending $1.4 million next year
Harwich none in next 5 years
Haverhill DEP regulations, Water Management Act Permits, Disinfectants and Disinfection Byproducts; increased Infiltration and Inflow correction; MS4; new NPDES permit requirements from EPA (Nitrogen or Phosphorus removal, etc.); combined sewer overflows; sanitary sewer overflows; operator licensing requirements;
Hudson Water Management Act Permit, NPDES Permit, MS4
Huntington Nitrogen or Phosphorus removal, Infiltration and Inflow correction as road work permits.
Ipswich UCMR3 Testing, Groundwater Rule Compliance, Chemical Safety Control Strategy Compliance, WMA Permit Renewal, Manganese advisory management, New Wastewater NPDES Permit - Increased Testing, I/I Removal
Kingston New MS4, TMDL's
Lakeville MS4
Lancaster Disinfectants
Lawrence Disinfectants and Disinfection Byproducts; increased Infiltration and Inflow correction; MS4
Leominster MS4, Inflow/Infiltration correction,
Lexington MS4 permit - phosphorus removal 1/1
Littleton MassDEP Revised Water Management Act with SWMI provisions New EPA MS4 Permit
Lowell MS4 Permit; Lead and phosphorus limits in NPDES permit
Malden Revised total coliform rule. Anticipated lead & copper rule change
Marlborough I & I DEP Sewer regulations, water and sewer master plan, MS4, phosphorous limits-winter sewer side.
Mashpee Nitrogen removal is the major concern confronting the Town right now. Nitrogen management and restoration of water quality is the largest challenge we face and the most expensive problem on our agenda. Stormwater is not a major concern in Mashpee and we have been making improvements in concert with road upgrades for years. Mashpee has no public water supply system; that is managed by the Mashpee Water District so the Town budget is not impacted by water supply related issues.
Medford Increased Infiltration and Inflow correction, bacteria removal from the Mystic River.
Methuen DEP, MWA permit, MS4

Summary of Responses Appendix B: Summary of Responses
73
Middleborough
Total coliform rule starting April 2016
Middleton Water Management Act Permit, Disinfectants and Disinfection Byproducts, MS4
Milford MS4,P removal
Needham Infiltration, Inflow corrects, MSR4- Phosphorus Removal - TMDLs
New Bedford SWMI Regulations, Replacing lead service lines, UCMR Testing, & Ground water discharge permit.; Administrative order with EPA, Combine Sewer outfall; SSO
Newton Increase Infiltration & Inflow, MS4 compliance
North Andover Water Management Act Permits, Disinfectants and Disinfection Byproducts, increased Infiltration and Inflow correction, MS4
North Attleborough
Water Management Act Permit withdrawal limits. NPDES Wastewater Discharge Permit reduction of Nitrogen discharge, MS4.
Northbridge CMWP planning effort underway to address these
North Reading Disinfectants and Disinfection Byproducts; MS4, Nitrogen & Phosphorus removal from stormwater
Norwood Continuing Infiltration/Inflow corrections; MS-4 Storm-water Requirements. Note: MS-4 Permit has not yet been issued to MWRA communities.
Orleans Water Management Act Permits, Manganese removal
Palmer Awaiting the new MS4 permit and NPDES permit
Peabody Water Management Act Permits, Disinfectants and Disinfection Byproducts, Nitrogen and Phosphorus levels.
Pepperell Water: WMA, SWMI, DEP SMCL (Fe, Mn) Sewer: NPDES Discharge Permit (Ph, Cu), CMOM Stormwater: NPDES MS4
Pittsfield Wastewater: NPDES permit requirements for aluminum and phosphorous
Quincy MS4
Reading Unknown at this time
Revere Illicit Discharge Detection and Elimination
Rockland Disinfection Byproducts. Possibly Manganese Removal
Salisbury MS4 permit, Administrative Order to remove nitrogen and copper.
Sandwich (Consolidated)
Reduction of existing water management permitted withdrawals is a concern. Please be advised the Sandwich Water District is a separate entity from The Town of Sandwich that provides water to approximately 75% of the Town.
Saugus I/I, MS4, Drinking Water, WMA, DPR,
Scituate Drinking water = manganese reduction; Wastewater = copper reduction; Stormwater = TSS
Shrewsbury MS4 - Entire town located with regulated area (2-different watersheds). Water Management Act Permit - Town recently received new water withdrawal permit largely based upon SWMI. Due to potential changes to manganese limits, modifications to water treatment plant required. Potential changes to metal discharges and lowering of other nutrient levels from wastewater treatment plant may require additional upgrades (just finished construction on last upgrade) with no potential for increased discharge volumes.
Somerville I/I, MS4
South Hadley Disinfection By products and lack of funding for infrastructure improvements

Summary of Responses Appendix B: Summary of Responses
74
Southwick Water Management Act - 310 CMR 22.11B- PWS Certified Operator Staffing Requirement: Currently, Southwick uses only disinfection for treatment and is permitted to operate the water system under a D-2 license. Under the proposed regulations, Southwick would be required to operate the water system under a D-2 license, plus a T-1 license. None of the Town’s operators possess a T-1 license. Should the new rating system for classification of Public Water Systems result in a reclassification to a higher grade, MassDEP should grandfather the operators working in that system and not require them to receive a different or higher grade license. MS4 - The requirements in the draft permit are quite burdensome and will require the Town to expend additional resources to meet the requirements. Further, the fact that the permit has not been released created a burden on communities to have to plan accordingly for when the permit is expected to be in effect on July 2016. Southwick is near the end of the budgeting circle, and any new changes to the permit that has not been released in prior versions could impact how Town and Cities plan the FY17 budgets.
Springfield All water, wastewater, and stormwater regulations are applicable and impact master plans, long term finance, and rates
Stockbridge possible waste water phosphorous limits being lowered. Our biggest expense is the replacement of our 125 year old sewer and water infrastructure.
Sturbridge Water Management Act Permit, MS4,Watch Phosphorus & Zinc Removal Limits
Topsfield We are subject to DEP, Water Management Permits, MS4. We are currently designing a $7 million drinking water treatment facility to remove manganese in order to comply with new DEP regulations.
Waltham Unsure - rely on MWRA water system
Ware All of these items listed above may present funding related problems in the next five years.
Wareham Water Management Act permit - Daily withdrawals are possibly being reduced due to the involvement of DCR. Wastewater is CMOM CAPACITY, MANAGEMENT, OPERATION, AND MAINTENANCE) Clean Water Act related to Inflow and infiltration removal. We have a 4 ppm nitrogen load to the river and a 1 ppm phosphorus load to the river. The MS4 program and nitrogen discharge to the water body. All these concerns need to be addressed with limited funds and increased burden to tax/rate payers
Wellesley UCMR4; Mass Water Management Act
Wellfleet Update the master plan and obtain voter's authorization to borrow funds to expand the water system,
Wenham Water Management Act permits; increased biological testing mandates, regulation of manganese in drinking water
West Bridgewater
Possible treating with disinfectants, Possible treating for Manganese
West Springfield
Creation of a Combined Utility (Water , Sewer and Storm Water)
Weston Stormwater (MS4)
Westport MS4 and Nitrogen removal
Whitman Storm water management plan is being prepared by Public Works. Impact is unknown at this time

Summary of Responses Appendix B: Summary of Responses
75
Worcester MS4, CSO CONTROL VIA NPDES, I/I REMOVAL UNDER NEW DEP REGS, NITROGEN AND PHOSPHORUS REDUCTION AT REGIONAL WASTEWATER TREATMENT PLANT WHICH WORCESTER FUNDS 85%, WATER TREATMENT PLANT NPDES DISCHARGE PERMIT FOR FILTER BACKWASH, WATER MANAGEMENT ACT PERMIT
Yarmouth Water Management Act, and MS4
26a. Has your municipality adopted innovative or alternative technologies to achieve cost savings,
enhanced capacity or improved performance in any aspect of its water infrastructure?
Yes # 45 (31%) No/No Answer # 101 (69%)
26b. If yes, please describe the technology and its impact [responding communities only]:
Arlington automatic meter reading system. has allowed us to redirect staff resources away from reading meters and to maintaining the infrastructure
Barnstable Installed PV, wind turbines, and energy efficiency units. Lower energy use and generated energy to lower system costs.
Beverly trench-less technologies - Cement Lining
Blackstone WE HAVE AECOM COME AND DO YEARLY INSPECTIONS AND PROVIDE REPORTS
Brockton State of the art WWTP technology, alt energy supply - solar
Cambridge Water infrastructure: Solar on roof of Water Treatment Plant ~2% of electrical demand 5 million dollar pumping systems enhancement project underway to improve pumping efficiency, VFDs [Variable Frequency Drive pumps], new control valves to improve hydraulic, etc. Pursuing in conduit hydro power based on previous feasibility study.
Chatham Solar- PV-Wastewater Treatment Plant; Cap Landfill; Police Station; Town Annex & Proposed Water Treatment Plant LED-Street Lights
Chelmsford The CWD took advantage of the ARRA to build a 0.5 MW Solar Array that ties directly into the Crooked Spring WTP. The CWD operates and controls the array and its credits. This has allowed the District to both significant energy cost and retain the annual values for the REC credits. Continuing in that vein, the CWD has availed itself of a net metering arrangement to further reduce energy costs. Operational, the District has employed solar power Storage Tank mixers in an effort to reduce water age in distribution, thereby reducing THM [trihalomethanes] production. The District has employed smart metering in a successful effort to combat unaccounted water loss. In another effort to help with water taker's understanding and as part of a coordinated outreach program, the District uses a full range weather station to better explain water restriction needs and to double check the solar array.
Chelsea The City of Chelsea has implemented two green infrastructure projects. Four stormwater tree pits have been implemented on Chester Avenue and Mace Rain Garden has been constructed on Crescent Avenue. The city hopes to install additional green infrastructure over time.
Chicopee Aeration/Oxygenation improvements at the Wastewater Treatment plant reduces energy demands. Rainwater reuse/capture is purposed for cleaning of chlorine

Summary of Responses Appendix B: Summary of Responses
76
contact tanks reduces City water usage. The City has a complete Integrated Management Plan (IMP) for management and improvements of City infrastructure and utilities. Infiltration basins are utilized for recharge of groundwater and allows for enhanced capacity of sewer systems. Redundant Water line is being established for purposes of enhanced capacity and reliability of the drinking water system. Tree Planting program to reduce burden of outfalls of storm water discharge.
Concord CoMag Phosphorus Removal, Water Treatment Technologies including DAF, Dual Filter Media and stormwater LID
Deerfield Energy efficient pump, attempting to get a Solar installation installed, trying to address any item which could save the District and its customers' money, which could be used to do improvements. Electricity is a big issue, with the four bills we receive each month doubling in one month, doubling with no explained or obvious reason.
Eastham IA systems are required by the board of Health in environmentally sensitive areas.
Edgartown (Consolidated)
Wastewater: Energy upgrades including photovoltaic array. Resulted in 18% decrease in usage and about $45,000 per year savings. Carbon emissions reduced 18,600 lbs/years.
Egremont Installed solar panels 2015
Falmouth Town is constructing new water treatment plant to address TTHM issues.
Fitchburg Wastewater - chemically enhanced primary treatment at WWTF to enhance treatment performance in wet-weather events.
Foxborough SCADA control of system - reduced overtime costs. Hydraulic System Model - greatly improved flushing program, reduced or eliminated black water complaints, identified low fire pressure areas and created upsizing needs plan. Remote Meter Reading (partial, not fully completed) - reduced meter reading costs, improved ability to assess accurate rates.
Gloucester West Gloucester Water Treatment Plant filter backwash recycling that saves 30-80 million gallons per year. This volume is also not discharged to the POTW.
Greenfield Pipe lining, and we are in the process of installing a fixed network meter system
Hanover No - but we would be interested in learning more.
Harwich Muddy Creek attenuation project- opening up & removing the existing muddy creek culvert to allow the freshwater turnover from 3 days to multiple times a day. Also removing catch basins and installing porous pavement in critical areas near the harbors., Removal of catch basins in the groundwater and replace w porous pavement @ harbors. Also in the process of completing the Muddy Creek Attenuation Project which is designed to increase water turnover from 3 days to 3 hours.
Haverhill We have not identified any alternatives that would apply to our systems.
Holyoke City's contract operator implemented more efficient aeration and sludge dewatering for cost savings. Contractor employs chemicals to enhance treatment and maximize capacity of treatment plant during high stormwater flows.
Lakeville N/A
Lawrence Automated Meter Reading System (+$1.1M); Energy efficient pumps and VFDs (+$5,000); Photovoltaic array (+$120,000)

Summary of Responses Appendix B: Summary of Responses
77
Leominster Clarification and air scour systems were installed for THM and HAA5 [haloacetic acids] compliance for drinking water compliance. A treatment plant went on line in 2011 for surface water treatment. An Actiflo phosphorous treatment system and backup power were installed in 2012 at a cost of $15,000,000. Ongoing wastewater treatment is being finished at a cost of $17.5 million. for enhanced performance and energy reduction.
Lexington We are involving interns to expand our storm water sampling program
Littleton Award-winning source water protection program to minimize the potential for groundwater contamination and maximize groundwater recharge within the aquifer system that our town relies on for drinking water.
Lowell Turbo aeration blowers for cost savings; solar walls and pv panels for cost savings; use of green roofs and pervious pavement for ground water recharge
Mashpee Mashpee has invested heavily in large scale aquaculture as a primary nitrogen management strategy as a means of eliminating the need for excessive infrastructure development, to lower costs and to restore an historic resource.
Medford Medford is investing in WaterSmart, a customer-service engagement program that will help our water customers manage their daily usage. The intent is to find and correct high consumption from such problems like toilet leaks.
New Bedford Solar panel installations: 446,200; CMMS System; Wastewater SLRAT, Digitized and put into GIS, Distribution system mapping; CCTV; CMMS
North Andover We have done an ESCO process to save energy at the Water Treatment Plant.
Norwood Wastewater: Norwood is now lining old clay sewer mains and individual building services along those mains. The ability to line individual small-diameter sewer services is technology that was not in wide use until five years ago.
Provincetown Manganese removal date
Reading Installing a mixer in the water tower; developed a plan to clean/line all cast iron mains. Development of GIS infrastructure of all utilities.
Revere City is in process of installing new, highly efficient and accurate water meters and is schedule to install system leak detection (Permaloggers) in the next 12 months
Salisbury Leak detection (water and waste water), less water is being used or treated. Converted telemetry to SCADA making it easier to more actively monitor the systems.
Shrewsbury Considering biological removal of manganese versus conventional green sand filtration.
Somerville Hydraulic Model that calculates pressure flow and water age (chlorine residual)
South Hadley Implemented SCADA in our system to identify leaks quicker resulting in quicker response
Springfield Water Coagulation Study, Green Infrastructure Groundwater Recharge
Stockbridge Installed open loop (with recycle) water source heat pumps in drinking water treatment plant to replace electric heat.
Waltham Installation of new meters for commercial accounts with an automated reading system. Enhanced ability to measure all water consumption. Enhancements to customer billing and notifications.
Wareham Upgraded the entire pumping system to SCADA (Supervisory Control And Data Acquisition) controls. Add in revenue streams to add in rate stability. We have added a grease process to extract oil to be sold on the open market, reduce solids to

Summary of Responses Appendix B: Summary of Responses
78
be carted from the facility to reduce dewatering expenses with an eye towards digestion to generate fuel for vehicles and heat within plant.
Wenham Installed variable frequency drives on our wells to reduce energy consumption
West Spfld New Water Transmission Main VFD pumps..
Worcester USE OF TABLETS TO FIELD RECORD CATCH BASIN CLEANING AND STORMWATER SAMPLING, SOLAR PV AT WATER TREATMENT PLANT
27. Has your municipality developed any formal climate change plans or policies that affect water
infrastructure systems?
Yes # 9 (6%) No/No Answer # 137 (94%)
27b. If yes, please describe:
Barnstable Resilient methods to harden infrastructure.
Beverly The City is pursuing a vulnerability assessment study though a CZM grant opportunity.
Cambridge Climate Change Vulnerability Assessment FY17 Water budget includes vulnerability and mitigation plan for CWD treatment facilities
Chicopee n/a
Concord Select Board Municipal Sustainability Principles
Edgartown (Consolidated)
The Board of Water Commissioners has voted to implement Voluntary Water Conservation Measures. In doing so, it is not triggered by climate, but by education and conservation minded customers. Wastewater: Hazard mitigation grant program upgrade of primary pump station in the tidal flood zone.
Falmouth Planning Department has CAP.
Lakeville N/A
Lawrence In progress
New Bedford Critical Asset Assessments
Salisbury The Great Marsh Resiliency Municipal Task Force (Ipswich Watershed)- formed a task force with surrounding communities to discuss flood resiliency and solutions.
Scituate We have been studying climate and ocean level rising and the effect on infrastructure.
Wareham With a CZM Grant, we have developed a mitigation plan to address climate change and sea level change
28a. Is your municipality a member of any regional (nonstate, nonfederal) entity or agency that
collaborates on water infrastructure planning and/or management?
Yes # 53 (36%) No # 70 (47%) N/A 25 (17%)
28b. If yes, does the entity/agency have spending/purchasing authority? What is the name of the entity?
Regional entities/agencies included:
Cape Cod Commission, Salem Beverly Water Supply Board, MWRA, Pleasant Bay Alliance, Pioneer Valley
Planning Commission, City of North Adams and the Briggsville Water District, Martha's Vineyard

Summary of Responses Appendix B: Summary of Responses
79
Commission, Central Massachusetts Regional Stormwater Coalition, Merrimack Valley Planning
Commission, Central Plymouth County Water District, Metropolitan Area Planning Council (MAPC), Old
Colony Planning Council (OCPC), Barnstable County Water Utility Association, Southeastern
Massachusetts Stormwater Collaborative, Merrimack Valley Planning Commission
Professional Associations included:
American Water Works Association, Mass Water Works Association, New England Water Works
Association, New England Water Environment Association, New England Public Works Association, Mass
Coalition for Water Stewardship, Plymouth County Water Works Association, Mass Rural Water
Association,
29a. Has your municipality received water infrastructure bond support or loans from the Commonwealth
of Massachusetts in the 10year period from 2004 to 2014?
Yes # 62 (42%) No # 60 (41%) N/A 24 (16%)
29b. If yes, please describe the amount, purpose and source of the funding [responding communities
only]:
Abington 1700000 SRF
Acton 13,500,000 for construction of a water filtration plant from the MA Clean Water Trust through the MA SRF program.
Amesbury SRF funding for WTP upgrade and distribution improvements.
Arlington MWRA zero interest loans in the amount of 800000-100000 per year for the last 5-8 years
Barnstable 1950000 Nutrient Management Planning Project SRF 7205442 Hyannis WPCF Improvement Project SRF 8850000 Route 132 Sewer Force Main Project SRF 3494137 Hyannis Water Improvement Projects SRF 9780000 Sewer Mains & Pump Stations Projects SRF 5828000 Wind Turbine, PV & Energy Eff. Projects SRF 621000 New Hyannis Water Tank(s) Project SRF 1050000 Hyannis Water Improvement Projects SRF 3127185 Hyannis Water Improvement Projects SRF 1556339 Hyannis Water Improvement Projects SRF Total = 43462103@
Bellingham Water Filtration Plant (Greensand) iron and manganese removal 13.1 Million DWSRF loan
Belmont MPAT. approx. $15,000,000
Boston MWRA Water Infrastructure Loans
Brockton Several million for water and sewer. Loans are utilized annually
Cambridge $40M from State Revolving Fund (SRF) for sewer separation and stormwater management projects and >$5M from MWRA Infiltration and Inflow (I/I) removal funds.
Charlton sewer $1,800,000. loans water $8,300,000 loans
Chatham 2012 SRF Loan for Water Treatment Plant
Chelsea MWRA Local Pipeline Assistant Program and MWRA Inflow and Infiltration Removal Grant/Loan Program
Chicopee MWRA has two loans: 1 ) $1,150,000.00 Water Main infrastructure improvement 2) $935,000 Water Main infrastructure improvements; Mass Clean Water Trust has 10

Summary of Responses Appendix B: Summary of Responses
80
permanent loans totaling $101,277,000 for purposes of unfunded mandate of the Sewer Separation Project.
Concord SRF Loan - 13 Million wastewater treatment plant upgrade
Danvers The town received an SRF Loan for the Rehabilitation of the Danvers Water Treatment Plant in the amount of $20,378,277.
Deerfield 875,000 from Mass Water Pollution Abatement Trust or whatever they call themselves now, back in 2009 to do infrastructure improvements such as a new 400,000 gallon Storage Tank, pipeline improvements, and an improved interconnection with a neighboring town. And although the loan was very helpful, the 2% was way offset by the high administrative costs.
Duxbury 2805500 was borrowed through SRF to build an elevated water storage tank and lay water main to create a high pressure zone.
East Longmeadow
Estimated $800,000, stormwater master planning and mapping
Eastham authorized $28 million SRF for water project for FY16
Everett State Revolving Funds, 10000000,
Fall River Drinking Water SRF loans for replacement of old cast iron water mains and treatment facility improvements totaling over $40,000,000. Wastewater CSO Abatement Project SRF loans totaling over $150,000,000.
Falmouth SRF funding in 2014 for Water Treatment Plant - 18600000 also SRF funding for wastewater improvements SRF 3928 @ 32800000
Fitchburg Wastewater - CWSRF loans.
Framingham The Town of Framingham participates in several funding assistance programs provided by the Commonwealth. Our funds distributed for the MWRA’s Local Water System Assistance Program through Feb 2016 are $3,678,500 and $5,874,650 for the I/I Local Financial Assistance Program. We plan to request available funding for appropriated projects: Union Ave./Evergreen Area water and wastewater improvements and the Worcester Road Pump Station project. The Town has also participated in the SRF program: over the last 10 years Framingham has borrowed over $65M to fund eligible projects.
Gardner Snake Pond Well improvements
Georgetown Georgetown Water Department bonded (20-year term) the Commissioners Well Transmission Loop pipeline project in 2007 for $700,000.
Gloucester WPCF: $20,000,000 PWS:$30,000,000 Dams:$1,200,000 CSO: $30,000,000
Groton $1,500,000 loan to construct well and treatment plant
Hanover No - but we intend to apply for MWPAT funds.
Haverhill State revolving fund loans for wastewater, drinking water and landfill closure
Holyoke Mass Water Pollution Abatement Trust -17.9 million - 1.037 million
Ipswich $2,640,413 for 3 water main replacement projects funded through SRF and municipal general obligation bonds
Kingston 2009 CWSRF Loan Stormwater Management Plan ($322,750), Community Septic Management, Drinking Water
Lakeville N/A
Lawrence Various SRF loans totaling over $60M

Summary of Responses Appendix B: Summary of Responses
81
Leominster SRF loans - $19.2 million for water treatment plant construction and rehabilitation. $30.5 million for wastewater treatment plant upgrades.
Lexington loans received by the MWRA
Lowell $75,000,000 in SRF loans - sewer separation and treatment plan upgrades
Malden $20,000,000.00 SRF funds for water improvements and $4,000,000.00 SRF funds for sewer improvements.
Marlborough $37,000,000 SRF Westerly Wastewater Treatment Plant, $57,000,000 SRF Easterly Wastewater Treatment Plant, $6,000,000 Water Treatment Plant. All within last 6 years.
Mashpee Roughly $1,000,000 in SRF planning loan
Medford $956000 for water main and service replacement, funded by MWRA 0% loan. $2,367475 for water main and service replacement, funded by MWRA 0% loan.
Methuen $27,518,551.00 TOTAL 11/6/2005 - $5,786,500.00 WATER TANK, 12/18/2007 - $18,550,000.00 - WATER TREATMENT PLANT, 12/18/2007 - $200,000.00 - STORM WATER, 12/18/2007 - $750,000.00 - WATER TANK , 3/8/2009 - $1,117,204.00 - SEWER REHABILITATION, 7/8/2010 - $12,243.00 - SEWER REHABILITATION, 7/8/2010 - $650,000.00 - SEWER REHABILITATION, 6/3/2012 - $452,604.00 - SEWER REHABILITATION
Needham SRF, MWRA, MWPAT
New Bedford SRFS LOANS: $2,385,454.93 DWSRF0923- QTP Improvements;; $6,000,000 DWSRF1405-TRANSMISSION MAIN; $600,000 CWSRF0428 CSO Control Plan; $6,628,741 CWSRF0912-Grit Removal; $10,409,184 CWSRF0912A- Grit Removal; $2,095,000 CWSRF1304 Admin Order; $8,063,124 CWSRF1419 Coggeshall Street
North Andover Yes, approximately $5M to construct 2 water storage tanks about 8 to 10 years ago.
North Reading $500,000 SRF loan to develop Stormwater Master Plan
Norwood Wastewater: 10-year loans for Sewer lining projects - from the Mass. Clean Water Trust. We have received three-plus loans of approx. $1.2 to $1.8 Million each. Award for $2.7 million pending.
Palmer SRF funding for the Phase 4 CSO Separation Project-5,060,000 and for sewer replacement project in 2014-6,090,000
Pittsfield ARRA
Quincy $9,679,459 MWRA Local Water System Assistance Program
Revere Drinking Water State Revolving Funds utilized for the new water meter program and leak detection installations
Rockland 800000 SRF
Salisbury Water Tank at 91 North End Blvd, SRF Funding in the amount of $3 million.
Saugus SRF
Scituate Received MWPAT (CWT) loans for sewer projects in that period but not drinking water. Sewer projects for that period were for expansion of system - $5,783,959.
Somerville Unsure
South Hadley We received 1.1 million for a treatment plant upgrade from the Water abatement trust
Spencer see your records, mine are in storage
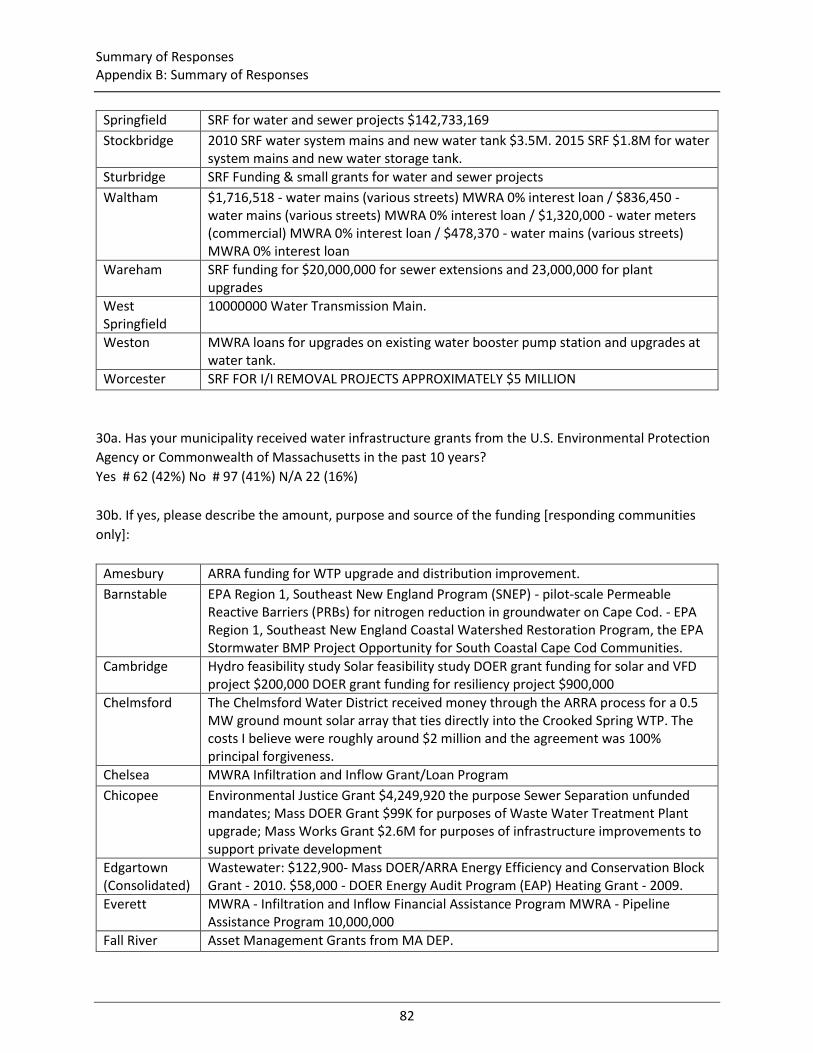
Summary of Responses Appendix B: Summary of Responses
82
Springfield SRF for water and sewer projects $142,733,169
Stockbridge 2010 SRF water system mains and new water tank $3.5M. 2015 SRF $1.8M for water system mains and new water storage tank.
Sturbridge SRF Funding & small grants for water and sewer projects
Waltham $1,716,518 - water mains (various streets) MWRA 0% interest loan / $836,450 - water mains (various streets) MWRA 0% interest loan / $1,320,000 - water meters (commercial) MWRA 0% interest loan / $478,370 - water mains (various streets) MWRA 0% interest loan
Wareham SRF funding for $20,000,000 for sewer extensions and 23,000,000 for plant upgrades
West Springfield
10000000 Water Transmission Main.
Weston MWRA loans for upgrades on existing water booster pump station and upgrades at water tank.
Worcester SRF FOR I/I REMOVAL PROJECTS APPROXIMATELY $5 MILLION
30a. Has your municipality received water infrastructure grants from the U.S. Environmental Protection
Agency or Commonwealth of Massachusetts in the past 10 years?
Yes # 62 (42%) No # 97 (41%) N/A 22 (16%)
30b. If yes, please describe the amount, purpose and source of the funding [responding communities
only]:
Amesbury ARRA funding for WTP upgrade and distribution improvement.
Barnstable EPA Region 1, Southeast New England Program (SNEP) - pilot-scale Permeable Reactive Barriers (PRBs) for nitrogen reduction in groundwater on Cape Cod. - EPA Region 1, Southeast New England Coastal Watershed Restoration Program, the EPA Stormwater BMP Project Opportunity for South Coastal Cape Cod Communities.
Cambridge Hydro feasibility study Solar feasibility study DOER grant funding for solar and VFD project $200,000 DOER grant funding for resiliency project $900,000
Chelmsford The Chelmsford Water District received money through the ARRA process for a 0.5 MW ground mount solar array that ties directly into the Crooked Spring WTP. The costs I believe were roughly around $2 million and the agreement was 100% principal forgiveness.
Chelsea MWRA Infiltration and Inflow Grant/Loan Program
Chicopee Environmental Justice Grant $4,249,920 the purpose Sewer Separation unfunded mandates; Mass DOER Grant $99K for purposes of Waste Water Treatment Plant upgrade; Mass Works Grant $2.6M for purposes of infrastructure improvements to support private development
Edgartown (Consolidated)
Wastewater: $122,900- Mass DOER/ARRA Energy Efficiency and Conservation Block Grant - 2010. $58,000 - DOER Energy Audit Program (EAP) Heating Grant - 2009.
Everett MWRA - Infiltration and Inflow Financial Assistance Program MWRA - Pipeline Assistance Program 10,000,000
Fall River Asset Management Grants from MA DEP.

Summary of Responses Appendix B: Summary of Responses
83
Gloucester ARRA $400,000 PWS EOEA dams $320,000
Harwich A grant was provided to the Town of Harwich & Town of Orleans for leak detection equipment., Water Dept received a grant from the state for the purchase of leak detection equipment for 9,000. The town has received grants from various agencies, USDOI, NOAA, NCWC
Holyoke Congressional earmarks through EPA for CSO abatement. 2005 42,000, 2006 175,000, 2008 385,934, 2009 571,700, 2010 151,063
Kingston s. 319 (2001 Gray's Beach Restoration $300K & 2005 KIS SW Retrofits $152,780(NSRWA)), s. 604b (2003 DKP Estuaries Monitoring $85,240 & 2012 Town Center Water Quality Assessment $48,620), CZM CPR SW Retrofits (2013 $124,495, 2014 $116,627, 2015 $118,262 & 2016, $125,000) , Mass Bays Research & Planning (2012 Kingston Bay & Jones River Estuary SW Assessment Project)
Lakeville N/A
Lowell $6.6 million in ARRA funding in 2009
Malden $1,000,000.00 STAG funds for water improvements
New Bedford American Resource Recovery Act (ARRA) for solar Panels, Water Treatment Plant building improvement. $2,950,000; Water Loss Prevention Grant-$43,000 for leak detection and conservation kits 2006 from MassDEP; Drinking Water Supply Protection grant- $470,000
North Attleborough
Water conservation grants through DEP
Palmer CSO Project- 730,000 for principal forgiveness and 139,000 for principal forgiveness for the sewer replacement project in 2014.
Paxton $1.37 State Revolving Fund Grant of 2% interest for replacing a 50 year old water tank with an elevated tank
Pittsfield Clean Water Projects: ARRA Funding 1. Solar Photovoltaic (PV) Project at WWTP, Project Cost: $7,969,216 100% principal forgiveness, Renewable energy project 2. Combined Heat & Power System at WWTP Project Cost: $2,508,450 100% principal forgiveness, Renewable energy project 3. Aeration System Upgrade Project at WWTP Project Cost: $2,976,956 100% principal forgiveness, Energy conservation project 4. Bar Rack Replacement Project at WWTP, Project Cost: $2,380,400 2% SRF loan on balance, 11.72% principal forgiveness: $278,983 Replaces 1960’s vintage equipment Drinking Water Projects: 1. Coltsville Flow Control Station Replacement Project, Project Cost: $3,542,000 2% SRF loan on balance, 20.18% principal forgiveness: $714,746 Water distribution system project 2. Water and Sewer System SCADA Project, Project Cost: $1,334,450, 2% SRF loan on balance, 20.18% principal forgiveness: $189,258 Replaces existing SCADA system and expands it to Sewer.
Salisbury MassWorks Grant, replaced 3,000 linear feet of water mains, $1,708,789
Saugus SRF
Southwick 2016 - SWMI Grant for WMA Permit Renewal - $113,189
Springfield $6,228,474 in debt forgiveness
Stockbridge water source heat pumps in water treatment plant, $39K
Topsfield We received a grant from the DCR for $50,000 to study whether or not monthly billing encouraged water conservation.

Summary of Responses Appendix B: Summary of Responses
84
Wareham Water Conservation Grant in 2009 to complete a leak detection survey
Worcester DEP WATER SUPPLY PROTECTION GRANTS-LAND ACQUISITION $2.6 MILLION, DRINKING WATER SECURITY GRANT $750,000, ARRA VIA SRF FOR SOLAR PV AT WATER FILTRATION PLANT $1.2 MILLION
31a. Has your municipality reviewed 2014 changes to the state’s water infrastructure financing
programs – changes that may include forgiven or reduced interest on loans; MWRA entry fee match
and/or a local property tax water infrastructure surcharge (similar to the Community Preservation Fund
model)?
Yes # 54 (37%) No/No Answer # 92(63%)
31b. If yes, do you believe these changes will increase the likelihood that your community will apply for
state funding through the Massachusetts Clean Water Trust (formerly the Water Pollution Abatement
Trust)?
Yes # 25 (17%) No # 14 (10%) DK/NA # 117 (73%)
32. On a scale of 1 through 5, where 1 is “very difficult” and 5 is “very easy,” how would your
municipality rate its interactions since 2010 with the U.S. Environmental Protection Agency?
Very Difficult 1- 15 (10%) 2-18 (12%) 3- 42 (29%) 4- 19 (13%) 5- 8 (6%) Very Easy N/A - 44 (30%)
33. On a scale of 1 through 5, where 1 is “very difficult” and 5 is “very easy,” how would your
municipality rate its interactions since 2010 with the Massachusetts Department of Environmental
Protection?
Very Difficult 1- 4 (4%) 2-15 (10%) 3- 44 (30%) 4- 45 (30%) 5- 16 (11%) Very Easy N/A - 22 (15%)
34. Massachusetts is one of four states in the nation in which the U.S. Environmental Protection Agency
(EPA) issues MS4 permits directly. Would your municipality prefer to have the Massachusetts
Department of Environmental Protection (DEP) issue these permits or have the US EPA retain this role?
Prefer US EPA # 9 (6%) Prefer MassDEP # 75 (51%) DK/NA # 62 (43%)


