
Mr. Mark S Turowicz
Country LeaderHoneywell Performance Materials and Technologies Managing DirectorUOP India Pvt Ltd
Based in Gurgaon, Mr. Mark is responsible for local resourcemanagement and operational alignment with the unit’s overallobjectives and worldwide functional organizations.
A graduate chemical engineer, in his 30 + years with UOP, Mr. Mark hasserved in various capacities including field operating services, technicaland continuing service, technology sales support and licensing,ventures and business development and management.
In addition to the US and India, his international work experienceincludes assignments in Europe, North Africa, S. America, and theMiddle East.
Pathways to PetrochemicalsPathways to Petrochemicals
© 2013 UOP LLC. All rights reserved.
Mark Turowicz
UOP India Private Limited -- A Honeywell Company
Mark Turowicz
UOP India Private Limited -- A Honeywell Company
Indian Oil Petrochemical ConclaveMarch 18th, 2013Gurgaon, India
UOP 6012-1
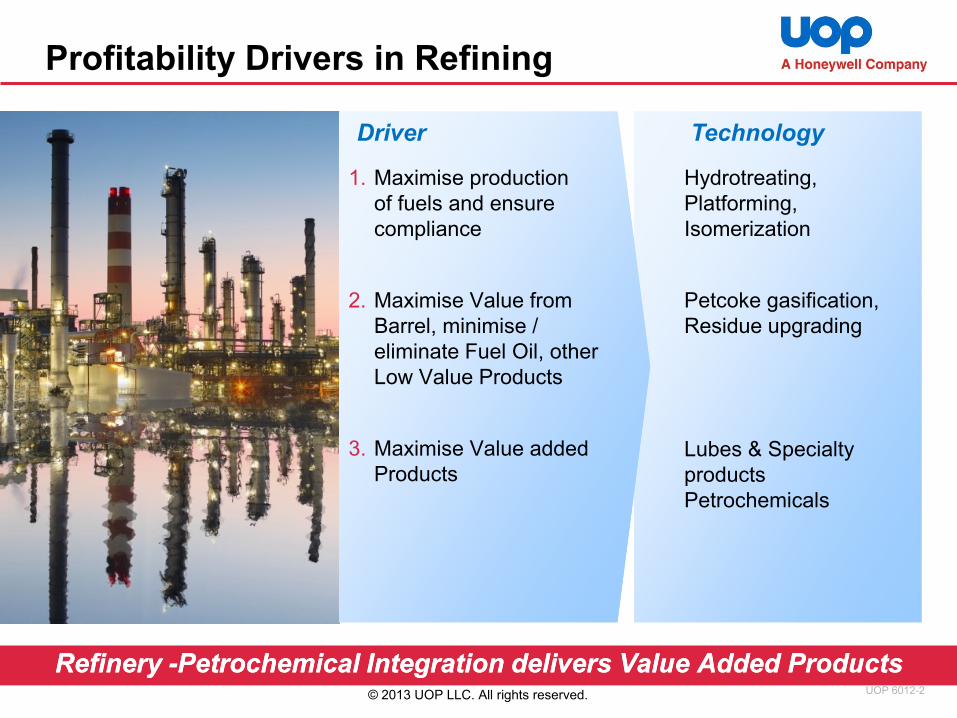
Profitability Drivers in Refining
Refinery Refinery --Petrochemical Integration delivers Value Added Products Petrochemical Integration delivers Value Added Products
1. Maximise production
of fuels and ensure
compliance
2. Maximise Value from
Barrel, minimise /
eliminate Fuel Oil, other
Low Value Products
3. Maximise Value added
Products
Driver Technology
Hydrotreating,
Platforming,
Isomerization
Petcoke gasification,
Residue upgrading
Lubes & Specialty
products
Petrochemicals
UOP 6012-2© 2013 UOP LLC. All rights reserved.

Kerosene
Benzene
N-Paraffin
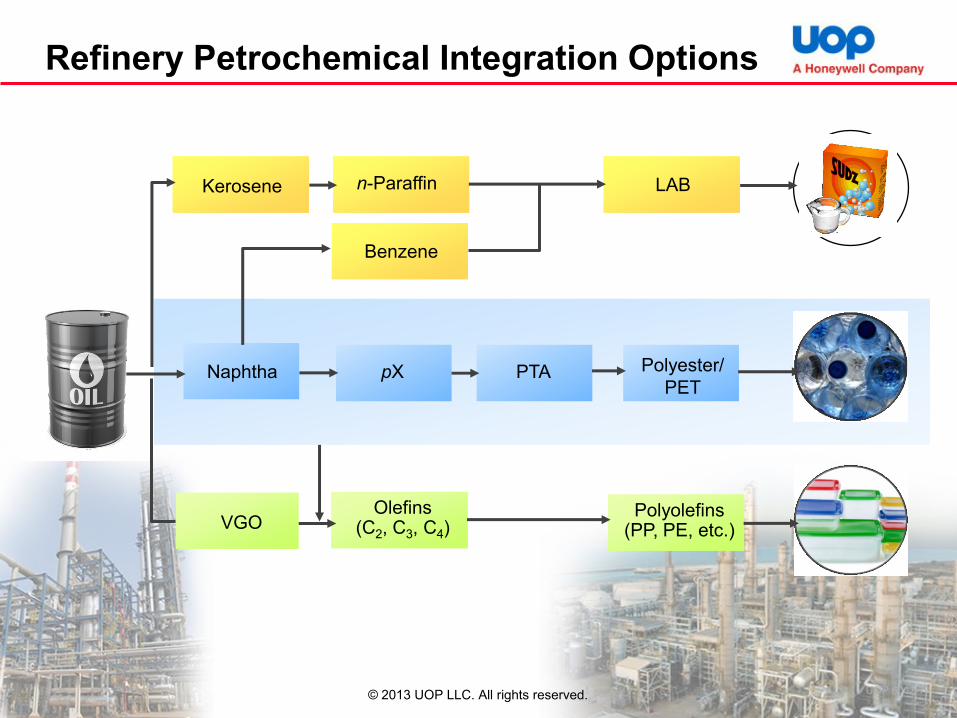
Refinery Petrochemical Integration Options
Kerosene n-Paraffin LAB
Benzene
Naphtha pX PTA Polyester/
PET
Olefins(C2, C3, C4)
Polyolefins(PP, PE, etc.)VGO
UOP 6012-3© 2013 UOP LLC. All rights reserved.
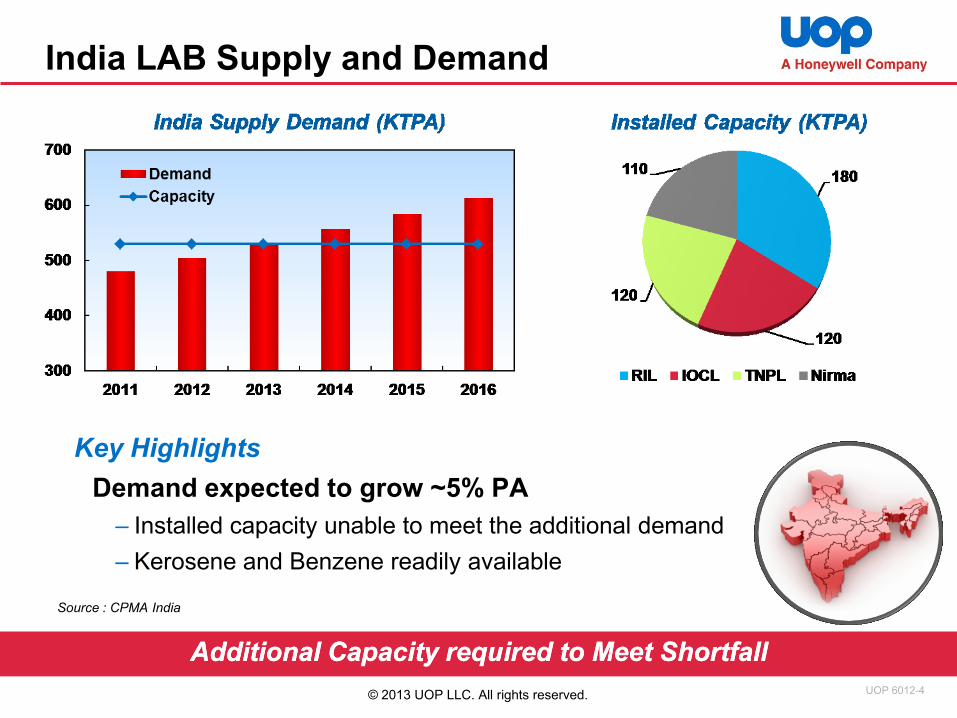
India LAB Supply and Demand
Key Highlights
Demand expected to grow ~5% PA
– Installed capacity unable to meet the additional demand
– Kerosene and Benzene readily available
Source : CPMA India
Additional Capacity required to Meet ShortfallAdditional Capacity required to Meet Shortfall
UOP 6012-4© 2013 UOP LLC. All rights reserved.
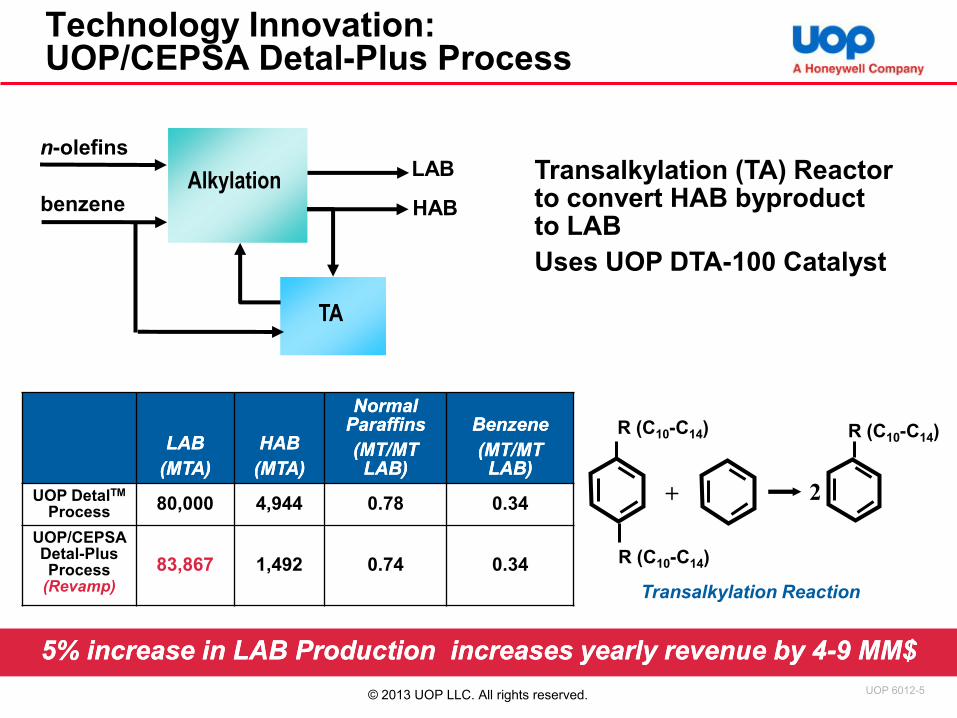
Technology Innovation: UOP/CEPSA Detal-Plus Process
5% increase in LAB Production increases yearly revenue by 45% increase in LAB Production increases yearly revenue by 4--9 MM$9 MM$
Alkylation
TA
HAB
LAB
benzene
n-olefinsTransalkylation (TA) Reactor to convert HAB byproduct to LAB
Uses UOP DTA-100 Catalyst
+
R (C10-C14)
R (C10-C14)
R (C10-C14)
2
LABLAB
(MTA)(MTA)
HABHAB
(MTA)(MTA)
Normal Normal ParaffinsParaffins
(MT/MT (MT/MT LAB)LAB)
BenzeneBenzene
(MT/MT (MT/MT LAB)LAB)
UOP DetalTM
Process 80,000 4,944 0.78 0.34
UOP/CEPSA Detal-Plus Process
(Revamp)
83,867 1,492 0.74 0.34
Transalkylation Reaction
UOP 6012-5© 2013 UOP LLC. All rights reserved.
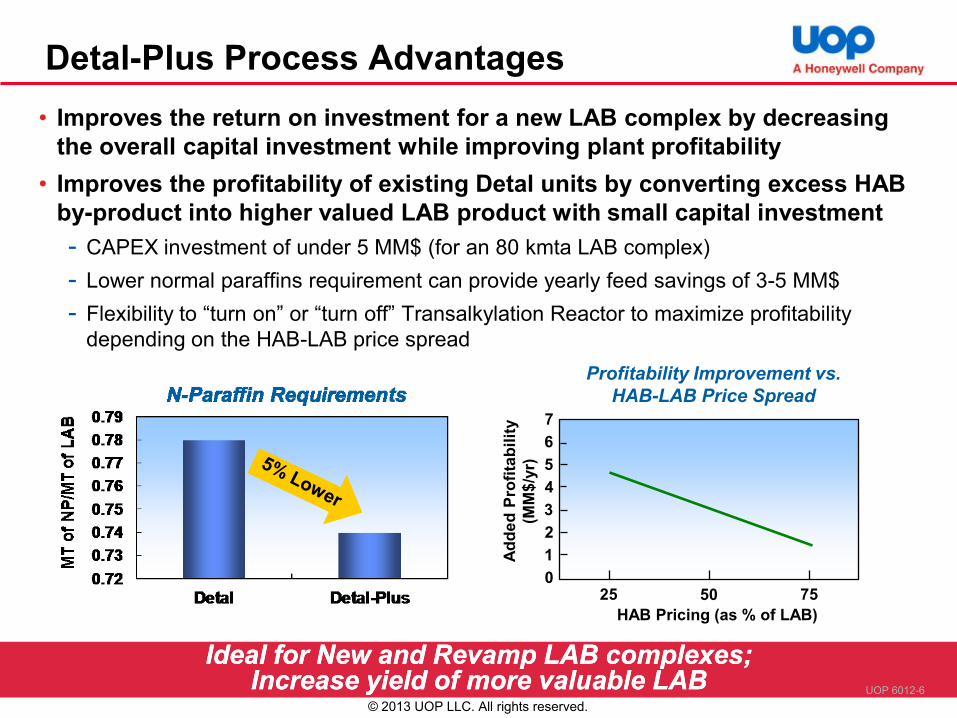
Detal-Plus Process Advantages
• Improves the return on investment for a new LAB complex by decreasing
the overall capital investment while improving plant profitability
• Improves the profitability of existing Detal units by converting excess HAB
by-product into higher valued LAB product with small capital investment
- CAPEX investment of under 5 MM$ (for an 80 kmta LAB complex)
- Lower normal paraffins requirement can provide yearly feed savings of 3-5 MM$
- Flexibility to “turn on” or “turn off” Transalkylation Reactor to maximize profitability
depending on the HAB-LAB price spread
Ideal for New and Revamp LAB complexes; Ideal for New and Revamp LAB complexes; Increase yield of more valuable LAB Increase yield of more valuable LAB
Profitability Improvement vs.
HAB-LAB Price Spread
Ad
de
d P
rofi
tab
ilit
y
(MM
$/y
r)
HAB Pricing (as % of LAB)
25 50 750
1
3
2
4
5
6
7
UOP 6012-6
© 2013 UOP LLC. All rights reserved.
Kerosene
Benzene
N-Paraffin
Refinery Petrochemical Integration Options
Kerosene n-Paraffin LAB
Benzene
Naphtha pX PTA
Olefins(C2, C3, C4)
Polyolefins(PP, PE, etc.)VGO
UOP 6012-7
Polyester/
PET
© 2013 UOP LLC. All rights reserved.
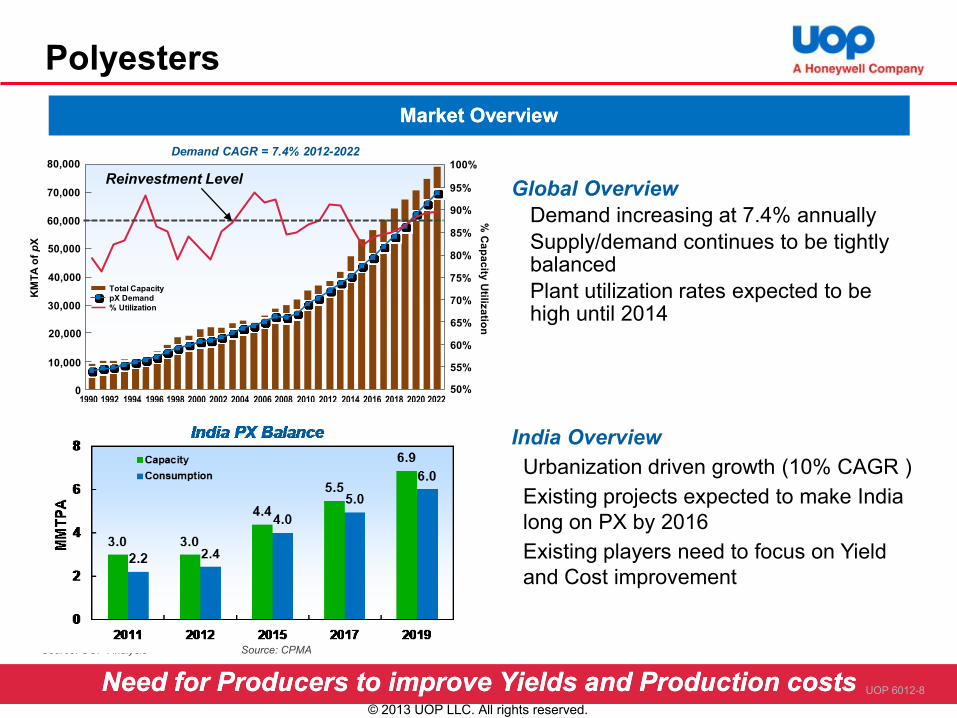
Polyesters
India Overview
Urbanization driven growth (10% CAGR )
Existing projects expected to make India
long on PX by 2016
Existing players need to focus on Yield
and Cost improvement
Market OverviewMarket Overview
Source: UOP Analysis
Source: CPMA IndiaNeed for Producers to improve Yields and Production costsNeed for Producers to improve Yields and Production costs
Source: CPMA
Global Overview
Demand increasing at 7.4% annually
Supply/demand continues to be tightly balanced
Plant utilization rates expected to be high until 2014
80,000
70,000
60,000
50,000
40,000
30,000
20,000
10,000
01990 1992 1994 1996 1998 2000 2002 2004 2006 2008 2010 2012 2014 2016 2018 2020 2022
50%
55%
60%
65%
70%
75%
80%
85%
90%
95%
100%
Demand CAGR = 7.4% 2012-2022
KM
TA
of
pX
% C
ap
ac
ity U
tiliza
tion
Total Capacity
pX Demand
% Utilization
Source: UOP (SBA-CCI & PCI)
Reinvestment Level
UOP 6012-8
© 2013 UOP LLC. All rights reserved.
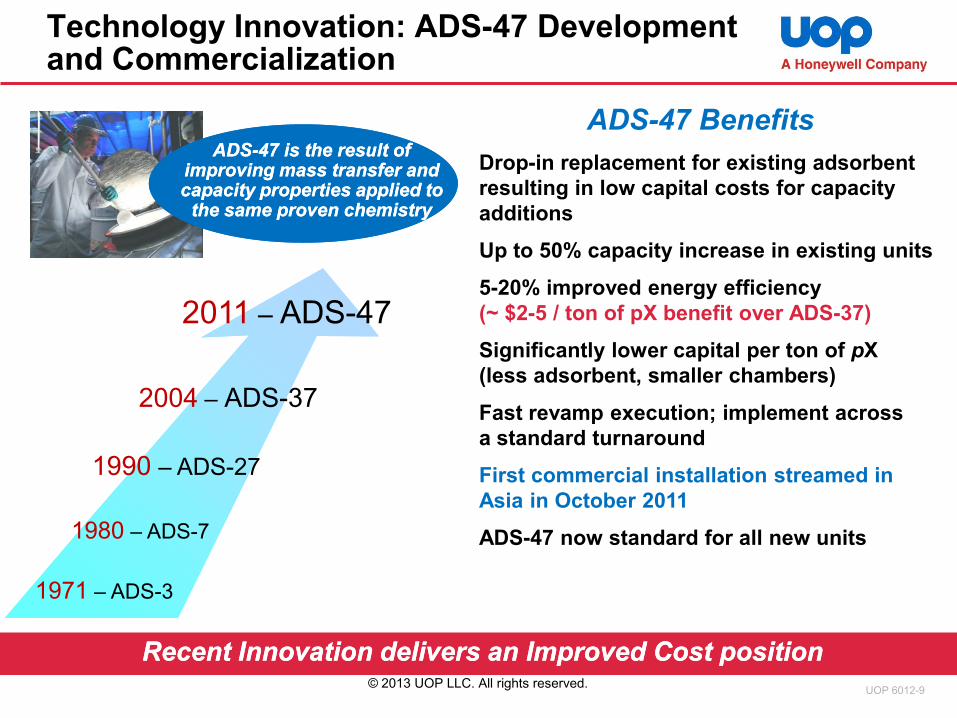
Technology Innovation: ADS-47 Development and Commercialization
Drop-in replacement for existing adsorbent
resulting in low capital costs for capacity
additions
Up to 50% capacity increase in existing units
5-20% improved energy efficiency
(~ $2-5 / ton of pX benefit over ADS-37)
Significantly lower capital per ton of pX
(less adsorbent, smaller chambers)
Fast revamp execution; implement across
a standard turnaround
First commercial installation streamed in
Asia in October 2011
ADS-47 now standard for all new units
ADS-47 Benefits
1971 – ADS-3
1980 – ADS-7
1990 – ADS-27
2004 – ADS-37
2011 – ADS-47
Recent Innovation delivers an Improved Cost positionRecent Innovation delivers an Improved Cost position
ADSADS--47 is the result of 47 is the result of improving mass transfer and improving mass transfer and capacity properties applied to capacity properties applied to
the same proven chemistry the same proven chemistry
UOP 6012-9© 2013 UOP LLC. All rights reserved.

Kerosene
Benzene
N-Paraffin
Refinery Petrochemical Integration Options
Kerosene n-Paraffin LAB
Benzene
Naphtha pX PTA
Olefins(C2, C3, C4)
Polyolefins(PP, PE, etc.)VGO
UOP 6012-10
Polyester/
PET
© 2013 UOP LLC. All rights reserved.
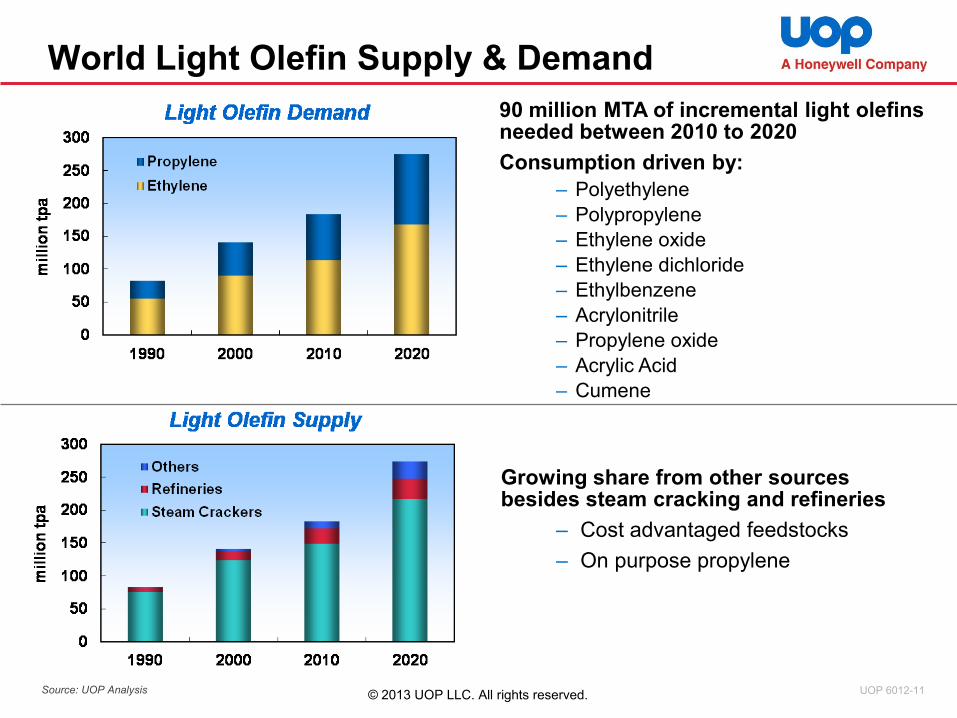
World Light Olefin Supply & Demand
90 million MTA of incremental light olefins needed between 2010 to 2020
Consumption driven by:
– Polyethylene
– Polypropylene
– Ethylene oxide
– Ethylene dichloride
– Ethylbenzene
– Acrylonitrile
– Propylene oxide
– Acrylic Acid
– Cumene
Growing share from other sources besides steam cracking and refineries
– Cost advantaged feedstocks
– On purpose propylene
Source: UOP Analysis UOP 6012-11© 2013 UOP LLC. All rights reserved.
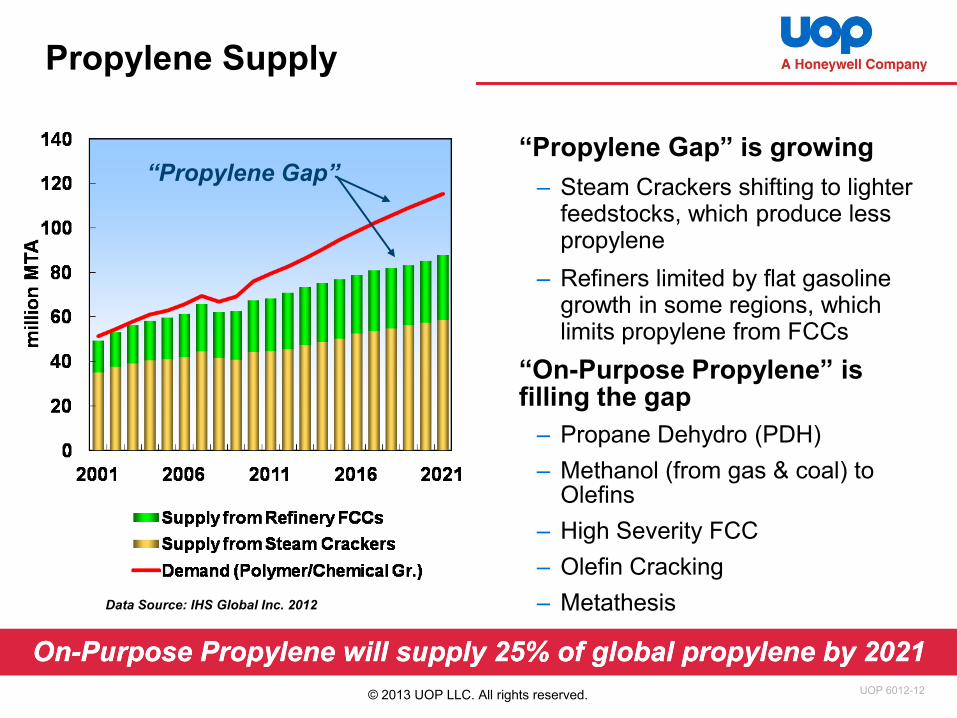
“Propylene Gap” is growing
– Steam Crackers shifting to lighter feedstocks, which produce less propylene
– Refiners limited by flat gasoline growth in some regions, which limits propylene from FCCs
“On-Purpose Propylene” is filling the gap
– Propane Dehydro (PDH)
– Methanol (from gas & coal) to Olefins
– High Severity FCC
– Olefin Cracking
– Metathesis
Propylene Supply
“Propylene Gap”
OnOn--Purpose Propylene will supply 25% of global propylene by 2021Purpose Propylene will supply 25% of global propylene by 2021
Data Source: IHS Global Inc. 2012
UOP 6012-12© 2013 UOP LLC. All rights reserved.

Pathways to Olefins
Naphtha Cracker // Gas Cracker
India is long Naphtha and short on Natural Gas
Naphtha prices linked to Crude –challenging economics
India Relevance Routes
India is short LPG
Most imported LPG allocated for domestic use
Abundant Coal offers opportunities for CTO
Surplus Methanol capacity in Region- potential for MTO
Propane Dehydrogenation
Coal / Methanol to Olefins
Limited by FCC capacityHi severity FCC of VGO
10%
90%
0%
0%
Share of Production in
India
Need for India to explore new pathwaysNeed for India to explore new pathwaysUOP 6012-13
© 2013 UOP LLC. All rights reserved.

7,000
6,000
5,000
4,000
3,000
2,000
1,000
0
100
90
80
70
60
50
40
30
20
10
0
94 93
74
8589
93
8189 89
(„000 t
on
nes
)
2008-2009
2009-2010 E
2010-2011
2011-2012 E
2012-2013 F
2013-2014 F
2014-2015 F
2015-2016 F
2016-2017 F
%
Capacity Consumption Operating Rate (per cent)
Olefins in India
Ethylene Supply / Demand (MMTPA)Ethylene Supply / Demand (MMTPA)
Key HighlightsKey Highlights
High growth expected across all Olefin derivatives– driven by increasing middle class growth and urbanization
Supply gap expected to grow
– Slowdown in FCC investments -
Limited new refining capacities
expected
– Limited new investments in cracking –
driven by high Naphtha prices and
slowdown in domestic gas production
Propylene Supply / Demand (MMTPA)Propylene Supply / Demand (MMTPA)
Potential to meet the gap through alternatives Potential to meet the gap through alternatives –– PDH & MTOPDH & MTOSource: CRISIL Research,2012 UOP 6012-14
5,000
4,500
4,000
3,500
3,000
2,500
2,000
1,500
1,000
500
0
100
90
80
70
60
50
40
30
20
10
0
8388 85
95
79
88 8995 97
(„000 t
on
ne
s)
2008-2009
2009-2010 E
2010-2011
2011-2012 E
2012-2013 F
2013-2014 F
2014-2015 F
2015-2016 F
2016-2017 F
%
Capacity Consumption Operating Rate (per cent)
© 2013 UOP LLC. All rights reserved.

Propane Dehydro with UOP Oleflex Technology
A UOP Oleflex plant converts one feed (C3 LPG) …into one primary product (propylene) …
with the option to export by-product hydrogen
C3 LPG Propylene
Hydrogen
One feed – one productSimple back integrationProven Investment
Low Capital IntensityHighest Yield of PropyleneAttractive Rate of Return
Key Features …
UOP 6012-17© 2013 UOP LLC. All rights reserved.
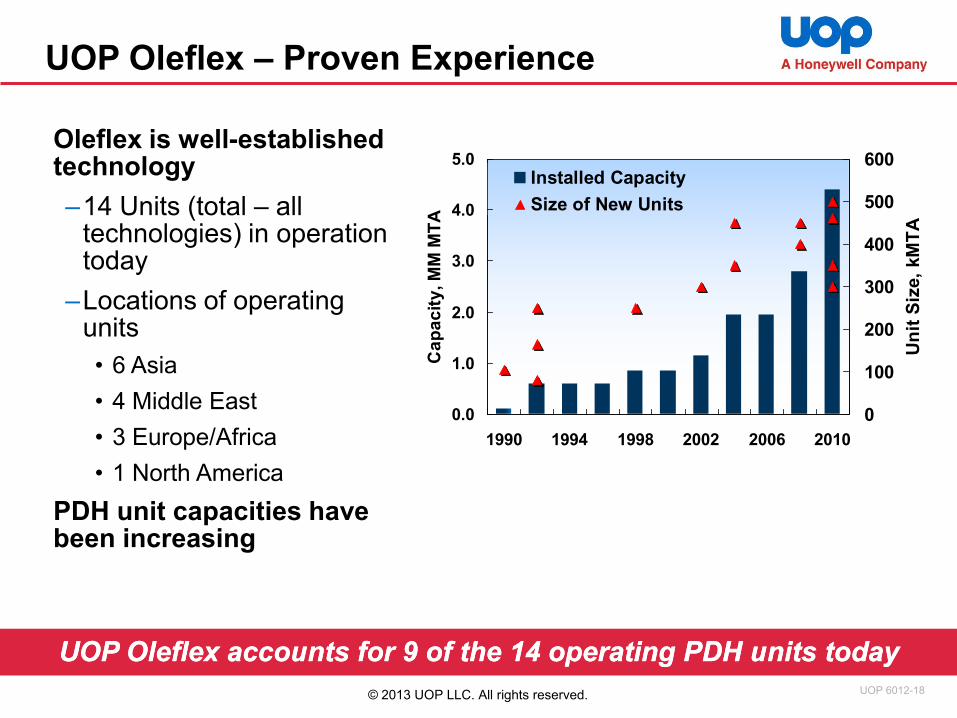
Oleflex is well-established technology
–14 Units (total – all technologies) in operation today
–Locations of operating units
• 6 Asia
• 4 Middle East
• 3 Europe/Africa
• 1 North America
PDH unit capacities have been increasing
UOP Oleflex – Proven Experience
UOP UOP OleflexOleflex accounts for 9 of the 14 operating PDH units todayaccounts for 9 of the 14 operating PDH units today
0.0
1.0
2.0
3.0
4.0
5.0
1990 1994 1998 2002 2006 2010C
ap
ac
ity
, M
M M
TA
0
100
200
300
400
500
600
Un
it S
ize,
kM
TA
Installed Capacity
Size of New Units
UOP 6012-18© 2013 UOP LLC. All rights reserved.
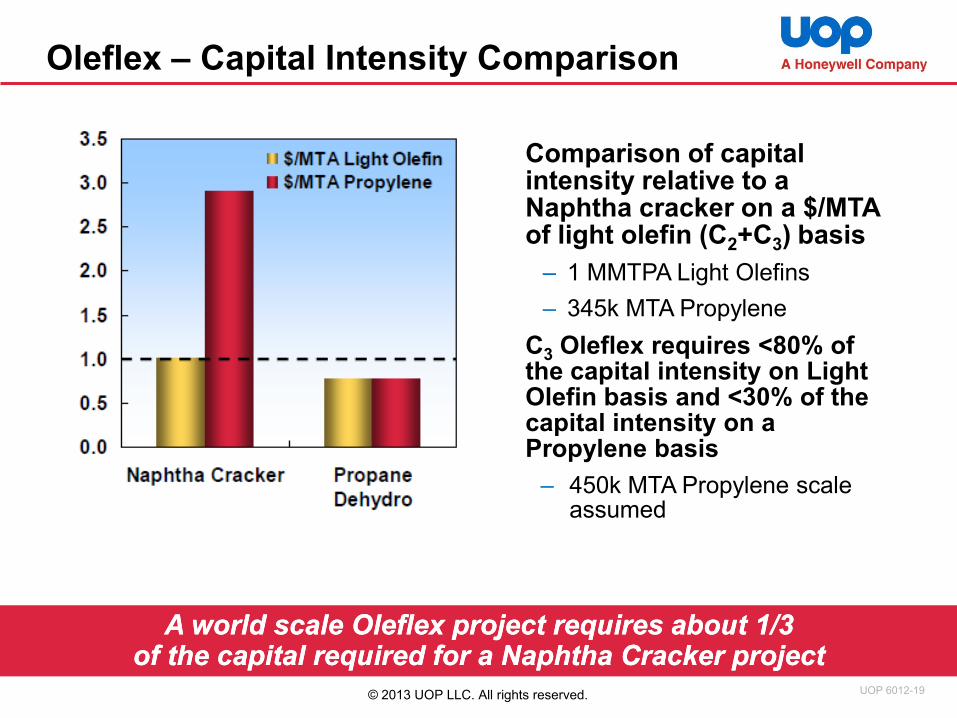
Oleflex – Capital Intensity Comparison
Comparison of capital intensity relative to a Naphtha cracker on a $/MTA of light olefin (C2+C3) basis
– 1 MMTPA Light Olefins
– 345k MTA Propylene
C3 Oleflex requires <80% of the capital intensity on Light Olefin basis and <30% of the capital intensity on a Propylene basis
– 450k MTA Propylene scale assumed
A world scale A world scale OleflexOleflex project requires about 1/3 project requires about 1/3 of the capital required for a Naphtha Cracker projectof the capital required for a Naphtha Cracker project
UOP 6012-19© 2013 UOP LLC. All rights reserved.

0
1,000
2,000
3,000
4,000
5,000
6,000
7,000
8,000
9,000
10,000
Ole
fin
Ca
pa
cit
y,
kM
TA
Award, Design or Construction
Commissioned
iC4 DehydroC3 Dehydro
5units
8units
3 units
C3/iC4 Dehydro
UOP Oleflex Capacity
4 units
1 unit
14units
UOP has been awarded 19 of the last 22 dehydro projects
world-wide since 2011
2 PDH Projects at 750 kmta propylene capacity
UOP 5881-20
High market activity in response to end-product demand and feedstock availability
© 2013 UOP LLC. All rights reserved.

UOP Methanol-to-Olefins (MTO)
EthylenePropylene
UOP MTOMethanol to Olefins
SynGas MethanolReformer Converter
Olefin DerivativeUnits
Methanol
Products (examples)
PolyethylenePolypropyleneEthylene DichlorideEthylene OxideEthyl BenzeneAcrylonitrilePropylene OxideAcrylic AcidOthers
Feedstocks
Natural gas orCoal orPetroleum Coke orBiomass
Commercial Technologies
New Feedstock and Catalyst using Commercially Proven Equipment
Commercial Technologies
(By Others)
UOP 6012-21© 2013 UOP LLC. All rights reserved.
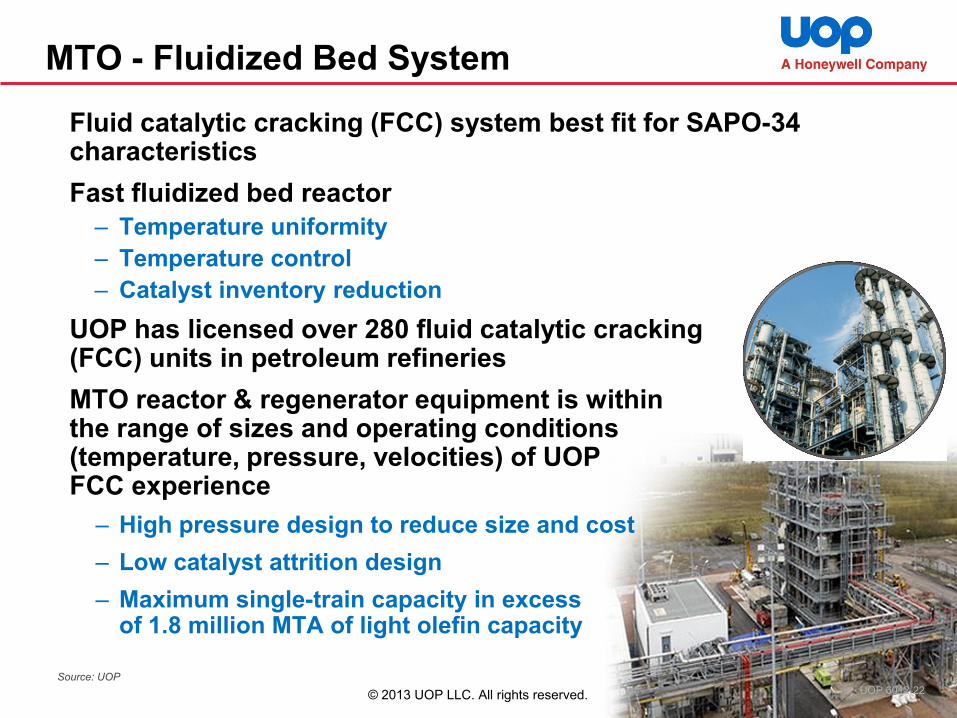
Fluid catalytic cracking (FCC) system best fit for SAPO-34 characteristics
Fast fluidized bed reactor
– Temperature uniformity
– Temperature control
– Catalyst inventory reduction
UOP has licensed over 280 fluid catalytic cracking (FCC) units in petroleum refineries
MTO reactor & regenerator equipment is within the range of sizes and operating conditions (temperature, pressure, velocities) of UOP FCC experience
– High pressure design to reduce size and cost
– Low catalyst attrition design
– Maximum single-train capacity in excess of 1.8 million MTA of light olefin capacity
MTO - Fluidized Bed System
Source: UOP
UOP 6012-22© 2013 UOP LLC. All rights reserved.
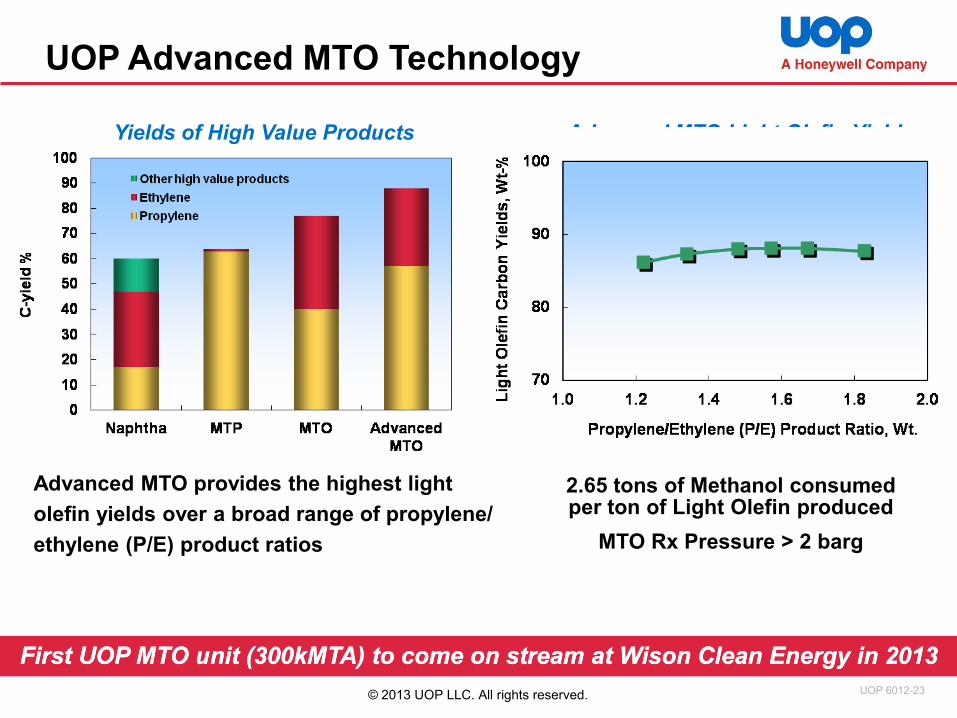
UOP Advanced MTO Technology
Advanced MTO Light Olefin Yields
Advanced MTO provides the highest light
olefin yields over a broad range of propylene/
ethylene (P/E) product ratios
Yields of High Value Products
2.65 tons of Methanol consumed per ton of Light Olefin produced
MTO Rx Pressure > 2 barg
First UOP MTO unit (300kMTA) to come on stream at Wison Clean Energy in 2013First UOP MTO unit (300kMTA) to come on stream at Wison Clean Energy in 2013
UOP 6012-23© 2013 UOP LLC. All rights reserved.

Summary
Petrochemical integration offers a proven route
to enhancing Refinery Profitability over the long
term
Expensive feedstock (Naphtha, India Gas pricing)
represents a challenge to Conventional
petrochemical processes
Novel technologies processing cost advantaged
feedstocks provide a profitable alternative to
traditional Petrochemical integration schemes
UOP 6012-24© 2013 UOP LLC. All rights reserved.
THANK YOU
UOP 6012-25© 2013 UOP LLC. All rights reserved.


