
County of Los Angeles Department of Public Social Services
Philip L. Browning, Director
Statistical Report February 2010
Bureau of Contract and Technical Services

County of Los Angeles
Department of Public Social Services
Statistical Report
This publication was prepared by: Information and Statistical Services Section
Eligibility Systems Division Hayward Gee
Questions regarding this publication may be addressed to: Information and Statistical Services Section
(562) 908-5820
This publication is available on the Los Angeles County Department of Public Social Services web site:
http://www.ladpss.org/dpss/ISS/ISS_Section.cfm
Released 04/05/10

Statistical Report Table of Contents
Charts: Page Aided Caseload
All Aids - Cases, Persons and Expenditures………………………………... 1 Caseload Characteristics……………………………………………………… 2 Cash Aid Programs - Cases Aided by District………………………………. 3 Supplemental Programs - Cases Aided by District…………………………. 4 Cash Aid Programs - Persons Aided by District……………………………. 5 Supplemental Programs - Persons Aided by District………………………. 6 In-Home Supportive Services Caseload by Office…………………………. 7
Application Processing Application Processing Summary…………………………………………….. 8 CalWORKs Application Processing by District……………………………… 9 General Relief Application Processing by District………………………….. 10 Refugee Cash Assistance Application Processing by District……………. 11 Medical Assistance Only (MAO) Application Processing by District……… 12 Food Stamp Application Processing by District…………………………….. 13 In-Home Supportive Services Application Processing by Office.………… 14
Terminations Cash Aid Programs - Terminations by District……………………………… 15 Supplemental Programs - Terminations by District………………………… 16
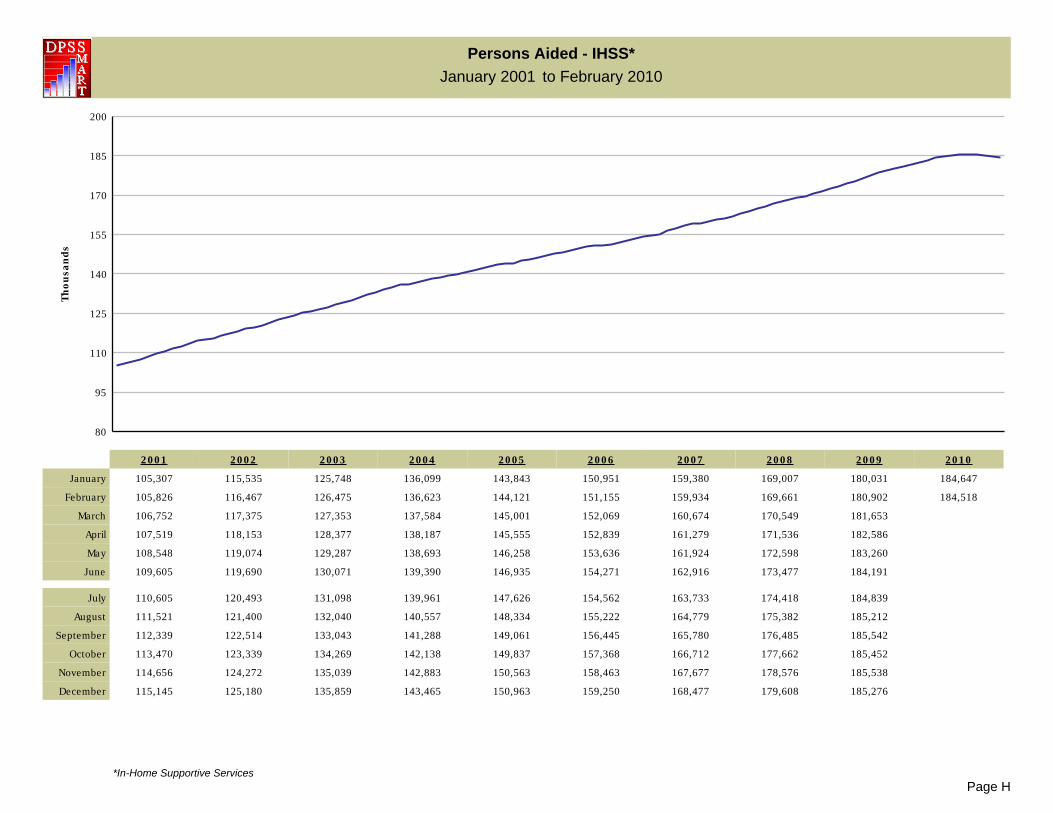
Graphs: Persons Aided - All Aids Combined………………………………………….. A Persons Aided - CalWORKs………………………………………………….. B Persons Aided - General Relief………………………………………………. C Persons Aided - Refugee……………………………………………………… D Persons Aided - CAPI………………………………………………………….. E Persons Aided - Medi-Cal Only………………………………………………. F Persons Aided - Food Stamps……………………………………………….. G Persons Aided - IHSS…………………………………………………….…… H Unemployment Rate - Los Angeles County…………………………………. I
Glossary i

All Aids Cases, Persons and Expenditures
February 2010
CalWORKs General Relief Refugee CAPIMedical Assistance
Only* Food Stamps
In-Home Supportive
Services
Cases 166,880 91,363 1,102 3,139 699,983 397,910 184,518
Persons 412,969 91,999 1,323 3,509 1,656,625 877,708 184,518
Expenditures (millions) $89.10 $19.19 $0.43 $2.74 $132.17 $133.84
Cost Per Case $533.91 $210.08 $385.84 $873.26 $332.15 $725.37
Unduplicated CaseloadAll Aids**
1,291,655
2,306,162
$377.47
$292.24
Comparison with Prior Month
Cases: This Month 166,880 91,363 1,102 3,139 699,983 397,910 184,518
Last Month 167,450 92,465 1,153 3,118 697,748 396,123 184,647
Change -0.3% -1.2% -4.4% 0.7% 0.3% 0.5% -0.1%
Persons: This Month 412,969 91,999 1,323 3,509 1,656,625 877,708 184,518
Last Month 413,178 93,105 1,380 3,485 1,652,545 873,906 184,647
Change -0.1% -1.2% -4.1% 0.7% 0.2% 0.4% -0.1%
Expenditures: (millions) This Month $89.10 $19.19 $0.43 $2.74 $132.17 $133.84
Last Month $88.62 $18.84 $0.44 $2.71 $130.49 $142.17
Change 0.5% 1.9% -3.4% 1.2% 1.3% -5.9%
1,291,655
1,289,807
0.1%
2,306,162
2,303,749
0.1%
$377.47
$383.27
-1.5%
* DPSS Approved Caseload. CalWORKs recipients are automatically eligible for Medi-Cal and are not counted here, except for MAO recipients attached to CalWORKs cases.** These are unduplicated counts of cases and persons that received aid in the month. A family aided in more than one category is counted only once. There is one exception: A few thousand families recieve both
Medi-Cal and Food Stamps under separate case numbers.Page 1

DPSS Caseload CharacteristicsLos Angeles County Totals
February 2010
CalWORKs General Relief
Refugee CAPI Medical Assistance
Only
Food Stamps
In-Home Supportive
Services
Total Aided
Cases 166,880 91,363 1,102 3,139 699,983 397,910 184,518
Persons 412,969 91,999 1,323 3,509 1,656,625 877,708 184,518
Age of Aided Persons
Under 1 18,752 1 55,787 26,506 8
1-2 47,547 1 113,466 75,715 115
3-5 61,689 1 1 146,485 103,256 580
6-12 115,848 2 4 281,491 194,613 3,506
13-15 47,081 1 109,015 74,789 1,833
16-17 29,479 2 72,635 46,142 1,247
18 6,037 2,343 40 42,194 18,663 636
19 4,258 3,254 41 2 36,870 13,819 738
20 4,552 3,058 42 1 31,812 11,576 699
21-59 77,126 78,792 990 410 533,199 291,443 45,584
60-65 546 4,098 146 321 27,551 13,626 17,339
Over 65 54 449 62 2,769 206,120 7,560 112,233
Total 412,969 91,999 1,323 3,509 1,656,625 877,708 184,518
Average Age of Aided Adults
Average Age 31 39 39 71 50 37 68
Gender of Aided Persons
AdultMale 17,983 61,272 642 1,184 262,294 144,785 63,257
Female 68,814 30,722 679 2,319 504,576 211,902 113,972
ChildrenMale 163,198 3 2 4 446,864 261,460 4,774
Female 162,974 2 2 442,891 259,561 2,515
Total 412,969 91,999 1,323 3,509 1,656,625 877,708 184,518
Page 2a
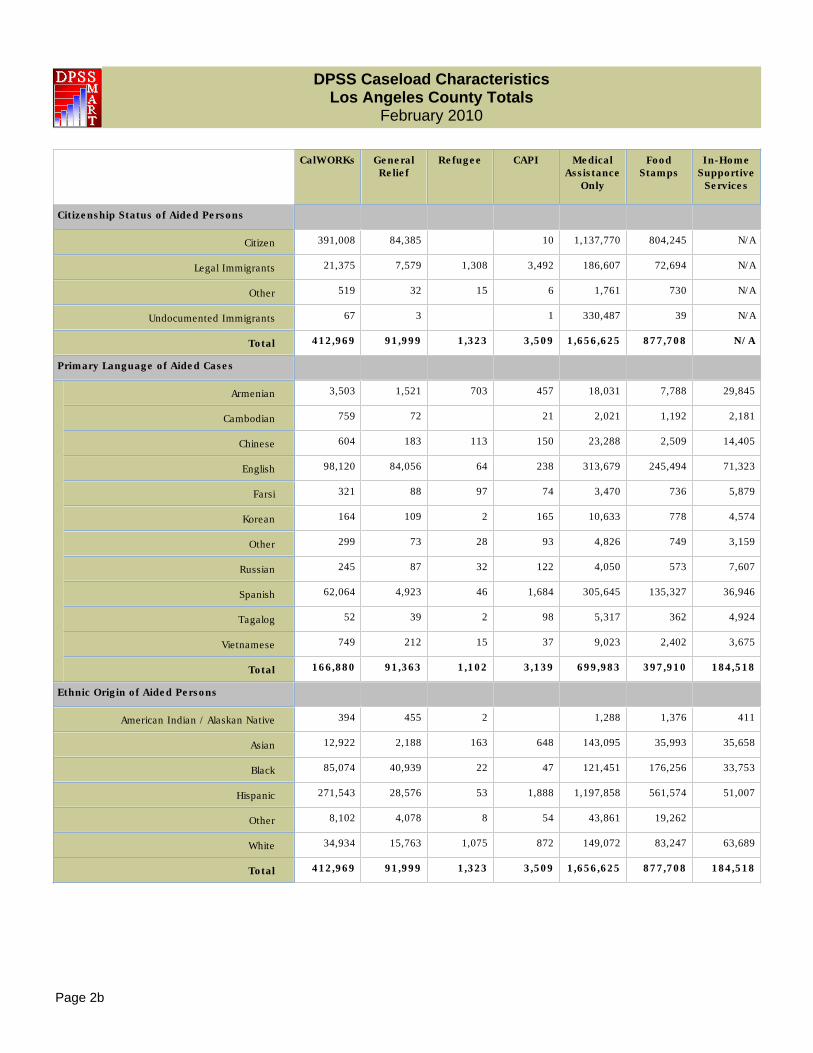
DPSS Caseload CharacteristicsLos Angeles County Totals
February 2010
CalWORKs General Relief
Refugee CAPI Medical Assistance
Only
Food Stamps
In-Home Supportive
Services
Citizenship Status of Aided Persons
Citizen 391,008 84,385 10 1,137,770 804,245 N/A
Legal Immigrants 21,375 7,579 1,308 3,492 186,607 72,694 N/A
Other 519 32 15 6 1,761 730 N/A
Undocumented Immigrants 67 3 1 330,487 39 N/A
Total 412,969 91,999 1,323 3,509 1,656,625 877,708 N/A
Primary Language of Aided Cases
Armenian 3,503 1,521 703 457 18,031 7,788 29,845
Cambodian 759 72 21 2,021 1,192 2,181
Chinese 604 183 113 150 23,288 2,509 14,405
English 98,120 84,056 64 238 313,679 245,494 71,323
Farsi 321 88 97 74 3,470 736 5,879
Korean 164 109 2 165 10,633 778 4,574
Other 299 73 28 93 4,826 749 3,159
Russian 245 87 32 122 4,050 573 7,607
Spanish 62,064 4,923 46 1,684 305,645 135,327 36,946
Tagalog 52 39 2 98 5,317 362 4,924
Vietnamese 749 212 15 37 9,023 2,402 3,675
Total 166,880 91,363 1,102 3,139 699,983 397,910 184,518
Ethnic Origin of Aided Persons
American Indian / Alaskan Native 394 455 2 1,288 1,376 411
Asian 12,922 2,188 163 648 143,095 35,993 35,658
Black 85,074 40,939 22 47 121,451 176,256 33,753
Hispanic 271,543 28,576 53 1,888 1,197,858 561,574 51,007
Other 8,102 4,078 8 54 43,861 19,262
White 34,934 15,763 1,075 872 149,072 83,247 63,689
Total 412,969 91,999 1,323 3,509 1,656,625 877,708 184,518
Page 2b

Cash Aid Programs
Cases Aided by DistrictFebruary 2010
District*
CalWORKs General Relief Refugee CAPI
Total Two Parent** Zero Parent*** All Other**** Total Employable Unemployable Unknown 011 East Valley Main District 9,567 943 4,273 4,351
002 Glendale 6,814 1,971 1,666 3,177 3,945 1,017 2,813 115 843034 Lancaster Main District 10,844 1,120 2,613 7,111 4,630 2,027 2,151 452038 Metro North 9,233 670 5,095 3,468 83203 Pasadena, San Fernando 2,611 196 854 1,561 7,293 2,399 4,499 395060 Rancho Park 4,751 314 1,374 3,063 5,817 2,010 3,521 286 1082 West Valley & Santa Clarita Branch 7,701 714 3,180 3,807014 Civic Center 6,342 1,233 4,962 147010 Wilshire 3,378 1,069 2,160 149 3,139
Division I 51,521 5,928 19,055 26,538 31,405 9,755 20,106 1,544 927 3,139 005 Belvedere 4,202 365 1,776 2,061
006 Cudahy 6,141 507 2,696 2,938012 Exposition Park 7,894 325 2,547 5,022017 Florence 7,085 322 3,656 3,107066 Lincoln Heights 5,272 356 2,397 2,519015 Metro East 7,160 435 3,732 2,993 7,084 3,013 3,722 349013 Metro Family 8,681 339 4,809 3,533070 Metro Special 11,651 3,629 7,649 373
Division II 46,435 2,649 21,613 22,173 18,735 6,642 11,371 722 026 Compton 10,076 630 3,787 5,659
092 Hawthorne Medi-Cal District 2 1 1040 Norwalk 6,319 624 1,763 3,932062 Paramount 4,815 380 1,555 2,880 1 1027 South Central 7,158 331 2,455 4,372 3,423 1,326 1,927 170031 South Family 9,644 593 3,677 5,374 25083 Southwest Family 12,037 667 3,734 7,636 7008 Southwest Special 1 1 11,988 4,486 6,787 715007 South Special 16,951 6,749 9,296 906
Division III 50,052 3,225 16,972 29,855 32,363 12,561 18,010 1,792 32 004 El Monte 5,679 467 2,322 2,890 1 1
036 Pomona 8,328 707 2,677 4,944 3,436 1,406 1,846 184020 San Gabriel Valley 4,865 611 1,735 2,519 5,423 1,964 3,053 406 143
Division IV 18,872 1,785 6,734 10,353 8,860 3,370 4,899 591 143
Total 166,880 13,587 64,374 88,919 91,363 32,328 54,386 4,649 1,102 3,139
* Numbers for Main Districts include both Main and Branch offices.** This category includes families that have two aided, GAIN Sactioned or time-limited, non-disabled parents with at least one child in common.*** All parents/adults in these familes are excluded or ineligible to aid for reasons other than GAIN sanction or time limits.**** This category includes all other familes not included in the first two.
Page 3

Supplemental ProgramsCases Aided by District
February 2010
District*
Medical Assistance
Only**
Food Stamps Total All AidsCash and Supplemental
(Duplicated)***Total PAFS NAFS
014 Civic Center 6,121 7,012 7,012 19,475011 East Valley Main District 25,480 17,911 5,627 12,284 52,958002 Glendale 31,926 18,153 4,377 13,776 61,681034 Lancaster Main District 16,150 21,461 5,290 16,171 53,085038 Metro North 11,376 11,703 5,274 6,429 32,395090 Northridge Regional Medi-Cal District 56,343 2 2 56,345203 Pasadena, San Fernando 10,284 13,634 1,427 12,207 33,822060 Rancho Park 22,744 14,934 2,623 12,311 48,247082 West Valley & Santa Clarita Branch 48,836 15,638 4,567 11,071 72,175010 Wilshire 18,107 9,878 9,878 34,502
Division I 247,367 130,326 29,185 101,141 464,685 005 Belvedere 38,294 14,306 2,331 11,975 56,802006 Cudahy 15,895 10,893 3,414 7,479 32,929012 Exposition Park 1,538 8,373 4,139 4,234 17,805017 Florence 13,089 11,021 3,569 7,452 31,195066 Lincoln Heights 1,618 5,511 2,672 2,839 12,401089 Medi-Cal Mail-In Application Center 1,288 1,288016 Medi Cal Outreach East 3,365 3,365042 Medi Cal Outreach West 2,498 1 1 2,499015 Metro East 638 14,452 3,989 10,463 29,334013 Metro Family 24,614 12,729 4,334 8,395 46,024070 Metro Special 23,273 26,946 5 26,941 61,870
Division II 126,110 104,232 24,453 79,779 295,512 026 Compton 24,538 15,962 5,303 10,659 50,576092 Hawthorne Medi-Cal District 58,383 1 1 58,386040 Norwalk 22,837 10,497 3,419 7,078 39,653062 Paramount 14,345 8,245 2,500 5,745 27,406027 South Central 6,775 13,947 3,284 10,663 31,303031 South Family 19,284 16,563 5,040 11,523 45,516007 South Special 18,336 18,336 35,287083 Southwest Family 1,803 11,791 6,097 5,694 25,638008 Southwest Special 37,675 23,139 6 23,133 72,803
Division III 185,640 118,481 25,650 92,831 386,568 004 El Monte 43,025 10,701 3,143 7,558 59,406080 Medi-Cal Long Term District 33,695 33,695036 Pomona 30,704 17,970 4,703 13,267 60,438020 San Gabriel Valley 16,496 16,200 2,633 13,567 43,127
Division IV 123,920 44,871 10,479 34,392 196,666Eligibility Systems Division 566 566
DPSS Total**** 683,603 397,910 89,767 308,143 1,528,515Department of Health Services 1,657 1,657
Department of Children and Family Services 14,723 14,723Grand Total**** 699,983 397,910 89,767 308,143 1,544,895
* Numbers for Main Districts include both Main and Branch offices.** The Medi-Cal counts provided represent the Approved Caseload. Medi-Cal usage is tracked at the State level. Person counts reflect MAO recipients attached to CalWORKs cases.*** This is the sum of all aid categories. These totals are duplicated to the extent that some families and persons are aided in more than one category.**** DPSS Total and Grand Total counts for Total All Aids (duplicated) include the IHSS caseload found on page 7.
Page 4

Cash Aid Programs
Persons Aided by DistrictFebruary 2010
District*
CalWORKs General Relief Refugee CAPI
TotalTwo Parent** Zero Parent*** All Other****
Adult Children Adult Children Adult Children Total Employable Unemployable Unknown 011 East Valley Main District 23,783 1,544 1,921 27 8,728 3,380 8,183
002 Glendale 17,862 3,388 3,345 22 3,050 2,767 5,290 4,123 1,059 2,946 118 1,042034 Lancaster Main District 29,173 1,746 2,551 58 5,344 5,111 14,363 4,658 2,039 2,165 454038 Metro North 20,979 1,022 1,268 36 10,013 2,636 6,004 90203 Pasadena, San Fernando 6,185 276 409 2 1,634 1,114 2,750 7,381 2,426 4,558 397060 Rancho Park 10,636 487 604 11 2,452 2,143 4,939 5,842 2,016 3,539 287 1082 West Valley & Santa Clarita Branch 19,067 1,212 1,422 27 6,514 2,974 6,918014 Civic Center 6,353 1,234 4,971 148010 Wilshire 3,413 1,082 2,181 150 3,509
Division I 127,685 9,675 11,520 183 37,735 20,125 48,447 31,770 9,856 20,360 1,554 1,133 3,509 005 Belvedere 10,640 594 814 10 3,660 1,557 4,005
006 Cudahy 15,462 843 1,141 10 5,536 2,245 5,687012 Exposition Park 18,524 504 697 35 4,913 3,367 9,008017 Florence 17,779 508 692 7 8,086 2,069 6,417066 Lincoln Heights 12,939 489 814 13 5,001 1,683 4,939015 Metro East 17,798 692 975 30 7,824 2,271 6,006 7,130 3,032 3,749 349013 Metro Family 20,850 537 733 25 10,288 2,516 6,751070 Metro Special 11,678 3,644 7,661 373
Division II 113,992 4,167 5,866 130 45,308 15,708 42,813 18,808 6,676 11,410 722 026 Compton 25,069 1,032 1,420 35 7,937 4,031 10,614
092 Hawthorne Medi-Cal District 3 1 1 1040 Norwalk 16,210 1,027 1,351 17 3,453 3,030 7,332062 Paramount 12,021 632 862 20 3,132 2,014 5,361 1 1027 South Central 18,138 509 763 16 5,330 2,803 8,717 3,436 1,332 1,934 170031 South Family 23,468 906 1,248 28 7,654 3,778 9,854 27083 Southwest Family 28,510 995 1,481 32 7,454 5,192 13,356 9008 Southwest Special 3 1 2 12,034 4,505 6,815 714007 South Special 17,029 6,779 9,338 912
Division III 123,422 5,101 7,125 148 34,961 20,850 55,237 32,500 12,616 18,087 1,797 36 004 El Monte 14,459 731 1,038 9 4,781 2,212 5,688 1 1
036 Pomona 21,301 1,192 1,547 23 5,432 3,870 9,237 3,448 1,411 1,854 183020 San Gabriel Valley 12,110 811 1,263 14 3,520 1,848 4,654 5,472 1,975 3,089 408 154
Division IV 47,870 2,734 3,848 46 13,733 7,930 19,579 8,921 3,386 4,943 592 154
Total 412,969 21,677 28,359 507 131,737 64,613 166,076 91,999 32,534 54,800 4,665 1,323 3,509
* Numbers for Main Districts include both Main and Branch offices.** This category includes families that have two aided, GAIN Sactioned or time-limited, non-disabled parents with at least one child in common.*** All parents/adults in these familes are excluded or ineligible to aid for reasons other than GAIN sanction or time limits.**** This category includes all other familes not included in the first two.
Page 5

Supplemental ProgramsPersons Aided by District
February 2010
District*
Medical Assistance
Only**
Food Stamps Total All AidsCash and Supplemental
(Duplicated)***Total PAFS NAFS
014 Civic Center 6,172 7,044 7,044 19,569011 East Valley Main District 68,666 45,970 13,162 32,808 138,419002 Glendale 64,006 39,558 11,645 27,913 126,591034 Lancaster Main District 49,577 53,195 13,210 39,985 136,603038 Metro North 34,831 29,172 10,938 18,234 85,072090 Northridge Regional Medi-Cal District 101,309 4 4 101,313203 Pasadena, San Fernando 22,078 21,088 3,225 17,863 56,732060 Rancho Park 40,575 24,947 5,772 19,175 82,001082 West Valley & Santa Clarita Branch 108,812 39,066 10,849 28,217 166,945010 Wilshire 34,146 15,636 15,636 56,704
Division I 530,172 275,680 68,801 206,879 969,949 005 Belvedere 99,097 37,803 5,536 32,267 147,540006 Cudahy 45,967 30,001 8,155 21,846 91,430012 Exposition Park 11,576 22,058 8,883 13,175 52,158017 Florence 45,277 30,091 7,825 22,266 93,147066 Lincoln Heights 11,450 15,385 5,961 9,424 39,774089 Medi-Cal Mail-In Application Center 2,154 2,154016 Medi Cal Outreach East 4,810 4,810042 Medi Cal Outreach West 2,892 1 1 2,893015 Metro East 11,744 27,030 9,086 17,944 63,702013 Metro Family 74,467 33,425 9,188 24,237 128,742070 Metro Special 50,680 43,613 7 43,606 105,971
Division II 360,114 239,407 54,641 184,766 732,321 026 Compton 68,587 43,816 12,349 31,467 137,472092 Hawthorne Medi-Cal District 152,274 1 1 152,278040 Norwalk 54,472 29,321 8,637 20,684 100,003062 Paramount 38,044 22,780 5,960 16,820 72,846027 South Central 25,884 32,193 7,318 24,875 79,651031 South Family 55,379 41,496 11,257 30,239 120,370007 South Special 18,491 18,491 35,520083 Southwest Family 15,825 31,656 13,737 17,919 76,000008 Southwest Special 83,739 36,612 17 36,595 132,388
Division III 494,204 256,366 59,276 197,090 906,528 004 El Monte 94,680 29,785 7,642 22,143 138,925080 Medi-Cal Long Term District 34,264 34,264036 Pomona 73,333 43,032 11,596 31,436 141,114020 San Gabriel Valley 44,173 33,438 6,307 27,131 95,347
Division IV 246,450 106,255 25,545 80,710 409,650Eligibility Systems Division 857 857
DPSS Total**** 1,631,797 877,708 208,263 669,445 3,203,823Department of Health Services 2,751 2,751
Department of Children and Family Services 22,077 22,077Grand Total**** 1,656,625 877,708 208,263 669,445 3,228,651
* Numbers for Main Districts include both Main and Branch offices.** The Medi-Cal counts provided represent the Approved Caseload. Medi-Cal usage is tracked at the State level. Person counts reflect MAO recipients attached to CalWORKs cases.*** This is the sum of all aid categories. These totals are duplicated to the extent that some families and persons are aided in more than one category.**** DPSS Total and Grand Total counts for Total All Aids (duplicated) include the IHSS caseload found on page 7.
Page 6

In-Home Supportive Services Caseload by OfficeFebruary 2010
OfficeNumber of Consumers* Number of Terminations
019 IHSS Ops II - Pomona 13,080 214
074 IHSS Ops II El Monte 31,648 441
East Region Total 44,728 655
047 IHSS Ops III Metro IHSS 22,159 293
075 IHSS Ops III - Rancho Park 12,363 175
Metro West Region Total 34,522 468
001 IHSS Ops I Chatsworth 29,389 389
035 IHSS Ops I - Lancaster 6,803 156
073 IHSS Ops I - Burbank 23,453 208
North Region Total 59,645 753
077 IHSS Ops IV Hawthorne 45,623 669
South Region Total 45,623 669
Total 184,518 2,545
* Each IHSS consumer represents a separate case or Assistance Unit.Page 7

Application Processing SummaryFebruary 2010
CalWORKs General Relief Refugee CAPI
Medical Assistance
Only Food Stamps IHSSTotal All
Programs
Received* 9,891 18,001 221 358 32,352 40,620 3,211 104,654
Processed:
Approvals 5,759 10,083 205 93 18,098 24,593 1,984 60,815
Non-Approvals 4,894 8,759 46 232 12,231 17,691 1,701 45,554
Total Processed(from current and prior months) 10,653 18,842 251 325 30,329 42,284 3,685 106,369
Approval Rate**(Approvals / Total Processed) 54.1% 53.5% 81.7% 28.6% 59.7% 58.2% 53.8% 57.2%
Comparison with Prior Month
Application Received
This Month 9,891 18,001 221 358 32,352 40,620 3,211 104,654
Last Month 11,881 19,719 200 292 30,345 45,674 3,655 111,766
Percent Change -16.7% -8.7% 10.5% 22.6% 6.6% -11.1% -12.1% -6.4%
Total Processed
This Month 10,653 18,842 251 325 30,329 42,284 3,685 106,369
Last Month 10,993 18,041 166 228 28,895 42,464 3,288 104,075
Percent Change -3.1% 4.4% 51.2% 42.5% 5.0% -0.4% 12.1% 2.2%
Approval Rate
This Month 54.1% 53.5% 81.7% 28.6% 59.7% 58.2% 53.8% 57.2%
Last Month 53.6% 53.0% 74.7% 25.0% 56.4% 59.5% 50.8% 56.6%
Percent Change 0.8% 0.9% 9.3% 14.5% 5.8% -2.2% 6.1% 1.1%
* Applications received in one month often have their final status determined in the following month. Consequently, there is no direct relationship between the number of applications received in the month and the number processed that same month.** Total approvals are divided by total disposed.
Page 8

CalWORKs Application Processing by DistrictFebruary 2010
Districts*
Applications Received in
Month**
Processed During Month Processing TimeApprovals
Total Approvals
Non-Approvals
Total Processed**
Two Parent Zero Parent All Other1-45 Days (percent)
46+ Days (percent)
014 Civic Center 3 3 3 100.00 0.00
011 East Valley Main District 737 62 168 212 442 427 869 99.42 0.58
002 Glendale 335 63 50 115 228 152 380 99.47 0.53
034 Lancaster Main District 776 62 62 274 398 365 763 99.08 0.92
038 Metro North 397 33 129 142 304 155 459 99.35 0.65
090 Northridge Regional Medi-Cal District 2 2 100.00 0.00
203 Pasadena, San Fernando 202 6 29 72 107 118 225 96.89 3.11
060 Rancho Park and West Los Angeles 252 14 40 106 160 139 299 98.66 1.34
082 West Valley District 565 41 76 167 284 328 612 99.02 0.98
Division I 3,267 281 554 1,088 1,923 1,689 3,612 99.06 0.94
005 Belvedere 414 29 77 96 202 317 519 59.73 40.27
006 Cudahy 384 31 83 116 230 192 422 99.29 0.71
012 Exposition Park 316 16 47 115 178 171 349 99.43 0.57
017 Florence 309 17 76 109 202 149 351 99.43 0.57
066 Lincoln Heights 242 11 39 83 133 99 232 99.57 0.43
015 Metro East 239 16 47 93 156 107 263 98.48 1.52
013 Metro Family 455 21 130 138 289 187 476 98.11 1.89
070 Metro Special 2 2 100.00 0.00
Division II 2,359 141 499 750 1,390 1,224 2,614 91.20 8.80
026 Compton 567 32 104 211 347 282 629 98.25 1.75
092 Hawthorne Medi-Cal District 1 1 100.00 0.00
040 Norwalk 458 35 40 156 231 238 469 98.08 1.92
062 Paramount 341 21 63 117 201 177 378 99.21 0.79
027 South Central 308 9 47 102 158 123 281 98.58 1.42
031 South Family 641 24 79 232 335 244 579 98.62 1.38
083 Southwest Family 636 24 103 255 382 265 647 97.84 2.16
Division III 2,951 145 436 1,073 1,654 1,330 2,984 98.36 1.64
004 El Monte 433 25 83 135 243 258 501 99.60 0.40
036 Pomona 596 31 77 230 338 277 615 98.54 1.46
020 San Gabriel Valley 285 34 43 134 211 116 327 99.08 0.92
Division IV 1,314 90 203 499 792 651 1,443 99.03 0.97
Total 9,891 657 1,692 3,410 5,759 4,894 10,653 96.93 3.07
* Numbers for Main Districts include both Main and Branch offices.** Applications received in one month often have their final status determined in the following month. Consequently, there is no direct relationship between the number of applications received in the month and the number processed in the
same month.Page 9

General Relief Application Processing by DistrictFebruary 2010
District
Applications Received in
Month*
Processed During Month* Processing Time
Approvals Non Approvals Total Processed1 - 30 Days (percent)
31 - 45 Days (percent)
46 - 60 Days (percent)
61+ Days (percent)
014 Civic Center 827 579 343 922 95.01 3.36 0.98 0.65
002 Glendale 773 412 328 740 98.38 1.08 0.41 0.14
034 Lancaster Main District 1,114 592 572 1,164 97.94 1.46 0.52 0.09
203 Pasadena, San Fernando 1,939 863 1,053 1,916 93.63 5.48 0.63 0.26
060 Rancho Park and West Los Angeles 1,157 626 559 1,185 96.96 2.03 0.59 0.42
082 West Valley District 1 1 100.00 0.00 0.00 0.00
010 Wilshire 952 389 574 963 98.75 0.93 0.00 0.31
Division I 6,762 3,461 3,430 6,891 96.34 2.82 0.54 0.30
015 Metro East 1,418 903 673 1,576 97.72 1.97 0.06 0.25
070 Metro Special 1,858 1,242 871 2,113 96.97 2.51 0.28 0.24
Division II 3,276 2,145 1,544 3,689 97.29 2.28 0.19 0.24
027 South Central 765 382 385 767 96.87 3.00 0.13 0.00
007 South Special 3,142 1,759 1,460 3,219 96.61 2.30 0.56 0.53
008 Southwest Special 1,884 1,306 852 2,158 95.18 3.99 0.83 0.00
Division III 5,791 3,447 2,697 6,144 96.14 2.98 0.60 0.28
036 Pomona 884 407 425 832 91.59 7.21 0.72 0.48
020 San Gabriel Valley 1,288 623 663 1,286 92.53 5.91 0.70 0.86
Division IV 2,172 1,030 1,088 2,118 92.16 6.42 0.71 0.71
Total 18,001 10,083 8,759 18,842 95.99 3.17 0.51 0.33
* Applications received in one month often have their final status determined in the following month. Consequently, there is no direct relationship between the number of applications received in the month and the number processed in the same month.
Page 10

Refugee Application Processing by DistrictFebruary 2010
District
Applications Received in
Month*
Processed During Month* Processing Time
Approvals Non Approvals Total Processed 1 - 45 Days (percent) 46+ Days (percent)
002 Glendale 155 156 14 170 100.00 0.00
038 Metro North 15 14 9 23 78.26 21.74
010 Wilshire 1 1 1 100.00 0.00
Division I 171 170 24 194 97.42 2.58
006 Cudahy 1 1 1 100.00 0.00
Division II 1 1 1 100.00 0.00
031 South Family 9 7 3 10 100.00 0.00
083 Southwest Family 4 1 1 2 100.00 0.00
Division III 13 8 4 12 100.00 0.00
020 San Gabriel Valley 36 27 17 44 97.73 2.27
Division IV 36 27 17 44 97.73 2.27
Total 221 205 46 251 97.61 2.39
* Applications received in one month often have their final status determined in the following month. Consequently, there is no direct relationship between the number of applications received in the month and the number processed in the same month.
Page 11

Medical Assistance Only Application ProcessingFebruary 2010
Processing Time ****
Districts*
Applications Received in
Month**
Processed During Month**
Approvals Non ApprovalsTotal
Processed*** 014 Civic Center 130 34 85 119
011 East Valley Main District 1,015 726 360 1,086002 Glendale 644 391 267 658034 Lancaster Main District 501 275 206 481038 Metro North 134 28 134 162090 Northridge Regional Medi-Cal District 5,123 1,725 1,914 3,639203 Pasadena, San Fernando 342 176 186 362060 Rancho Park and West Los Angeles 625 278 353 631082 West Valley District 890 489 453 942010 Wilshire 788 522 346 868
Division I 10,192 4,644 4,304 8,948 005 Belvedere 923 605 308 913
006 Cudahy 563 248 211 459012 Exposition Park 7 28 3 31017 Florence 289 174 125 299066 Lincoln Heights 246 144 93 237089 Medi-Cal Mail-In Application Center 4,446 1,399 2,614 4,013016 Medi Cal Outreach East 4,087 3,954 185 4,139042 Medi Cal Outreach West 1,457 1,336 213 1,549015 Metro East 3 19 3 22013 Metro Family 76 90 10 100070 Metro Special 1,010 463 464 927
Division II 13,107 8,460 4,229 12,689 026 Compton 484 273 214 487
092 Hawthorne Medi-Cal District 232 70 138 208040 Norwalk 837 465 296 761062 Paramount 327 196 102 298027 South Central 183 107 96 203031 South Family 568 381 184 565083 Southwest Family 14 24 14 38008 Southwest Special 728 565 194 759
Division III 3,373 2,081 1,238 3,319 004 El Monte 547 401 171 572
080 Medi-Cal Long Term District 1,859 632 1,203 1,835036 Pomona 860 321 463 784020 San Gabriel Valley 416 285 170 455
Division IV 3,682 1,639 2,007 3,646DPSS Total 30,354 16,824 11,778 28,602
Department of Health Services 1,833 1,127 451 1,578Department of Children and Family Services 165 147 2 149
Grand Total 32,352 18,098 12,231 30,329
Regular
1 - 45 Days (percent)
46+ Days (percent)
95.15 4.8598.20 1.8097.38 2.6296.30 3.7095.00 5.0097.19 2.8198.25 1.7598.48 1.5298.89 1.1198.30 1.70
97.66 2.3495.28 4.7292.34 7.6690.32 9.6895.93 4.07
100.00 098.65 1.3598.96 1.0493.70 6.30
100.00 093.88 6.1296.79 3.21
97.52 2.4898.70 1.3056.99 43.0197.53 2.47
100.00 0100.00 096.72 3.2894.74 5.2697.83 2.17
95.52 4.4897.21 2.7992.84 7.1675.66 24.3486.47 13.53
88.84 11.1696.26 3.7430.01 69.9998.65 1.35
93.57 6.43
DAPD
1 - 90 Days (percent)
90+ Days (percent)
42.86 57.1474.19 25.8161.54 38.4655.56 44.44
100.00 062.31 37.6957.89 42.1145.71 54.2963.41 36.5970.00 30.00
61.97 38.0343.48 56.5240.00 60.00
0 050.00 50.0050.00 50.00
100.00 039.13 60.8737.17 62.83
0 050.00 50.0044.23 55.77
39.75 60.2569.23 30.7766.67 33.3367.74 32.2666.67 33.3350.00 50.0076.92 23.08
0 080.00 20.00
70.69 29.3139.39 60.6183.12 16.8855.56 44.4440.00 60.00
71.51 28.4960.22 39.7824.03 75.97
100.00 052.89 47.11
* Numbers for Main Districts include both Main and Branch offices.** Applications received in one month often have their final status determined in the following month. Consequently, there is no direct relationship between the number of applications received in the month and the number processed in the same month.
*** Of the 30,329 applications processed during the month, 28,253 were regular and 2,076 were DAPD (Disability and Adult Programs Division). Also included are denied CalWORKs applications that are reevaluated for MAO.
**** Applications not meeting Medi-Cal citizenship requirements are excluded from the processing time columns
Page 12

Food Stamp Application Processing by DistrictFebruary 2010
Districts*
Applications Received in
Month**
Approvals Non Approvals Total Processed
Percent Processed in 30 Days
Public Assistance***
Non-Public Assistance****
Total Public Assistance***
Non-Public Assistance****
Total Public Assistance***
Non Public Assistance****
Total
014 Civic Center 906 437 437 3 458 461 898 100.00 96.76 96.77
011 East Valley Main District 1,797 345 855 1,200 190 535 725 1,925 97.94 96.62 96.99
002 Glendale 1,848 204 884 1,088 88 746 834 1,922 98.29 97.67 97.76
034 Lancaster Main District 2,358 193 1,131 1,324 164 841 1,005 2,329 96.08 97.26 97.08
038 Metro North 371 212 107 319 76 12 88 407 97.57 92.44 96.07
203 Pasadena, San Fernando 2,526 56 1,317 1,373 84 1,120 1,204 2,577 97.14 97.13 97.13
060 Rancho Park and West Los Angeles 1,908 126 958 1,084 88 747 835 1,919 94.86 95.84 95.73
082 West Valley District 1,420 216 592 808 250 506 756 1,564 98.28 95.81 96.55
010 Wilshire 1,894 1,010 1,010 960 960 1,970 98.22 98.22
Division I 15,028 1,352 7,291 8,643 943 5,925 6,868 15,511 97.39 96.98 97.04
005 Belvedere 1,246 158 632 790 139 446 585 1,375 37.04 92.95 80.87
006 Cudahy 794 151 433 584 89 268 357 941 92.08 95.01 94.26
012 Exposition Park 273 126 79 205 83 2 85 290 96.65 95.06 96.21
017 Florence 653 129 283 412 104 198 302 714 95.28 96.05 95.80
066 Lincoln Heights 557 95 234 329 83 124 207 536 98.31 91.06 93.47
042 Medi Cal Outreach West 1 1 1 0.00 0.00
015 Metro East 1,672 108 923 1,031 71 649 720 1,751 92.18 98.41 97.77
013 Metro Family 346 163 111 274 68 4 72 346 95.24 90.43 93.64
070 Metro Special 3,096 1,926 1,926 1 1,424 1,425 3,351 100.00 96.33 96.33
Division II 8,637 930 4,621 5,551 638 3,116 3,754 9,305 83.93 95.79 93.79
026 Compton 1,069 205 500 705 147 299 446 1,151 98.01 93.99 95.22
092 Hawthorne Medi-Cal District 1 1 1 100.00 100.00
040 Norwalk 820 122 348 470 56 355 411 881 95.51 94.88 95.01
062 Paramount 603 116 283 399 90 169 259 658 92.72 96.02 94.98
027 South Central 1,352 98 676 774 57 552 609 1,383 96.13 95.11 95.23
031 South Family 1,305 238 547 785 152 319 471 1,256 88.46 93.53 91.96
007 South Special 3,193 1,898 1,898 1,281 1,281 3,179 97.55 97.55
083 Southwest Family 573 253 162 415 161 8 169 584 96.62 88.24 94.18
008 Southwest Special 3,082 1,881 1,881 1,263 1,263 3,144 96.95 96.95
Division III 11,997 1,032 6,295 7,327 664 4,246 4,910 12,237 94.40 96.09 95.86
004 El Monte 863 206 390 596 129 254 383 979 92.54 89.29 90.40
036 Pomona 2,164 209 1,059 1,268 193 783 976 2,244 94.78 82.08 84.36
020 San Gabriel Valley 1,931 133 1,075 1,208 68 732 800 2,008 93.53 88.99 89.44
Division IV 4,958 548 2,524 3,072 390 1,769 2,159 5,231 93.71 86.07 87.44
Total 40,620 3,862 20,731 24,593 2,635 15,056 17,691 42,284 92.83 95.15 94.79
* Numbers for Main Districts include both Main and Branch offices.** Applications received in one month often have their final status determined in the following month. Consequently, there is no direct relationship between the number of applications received in the month and the number processed in the same month.*** All members of the Food Stamp household received CalWORKs assistance during the month.**** None, or only some, of the members of the Food Stamp household received CalWORKs assistance during month.
Page 13
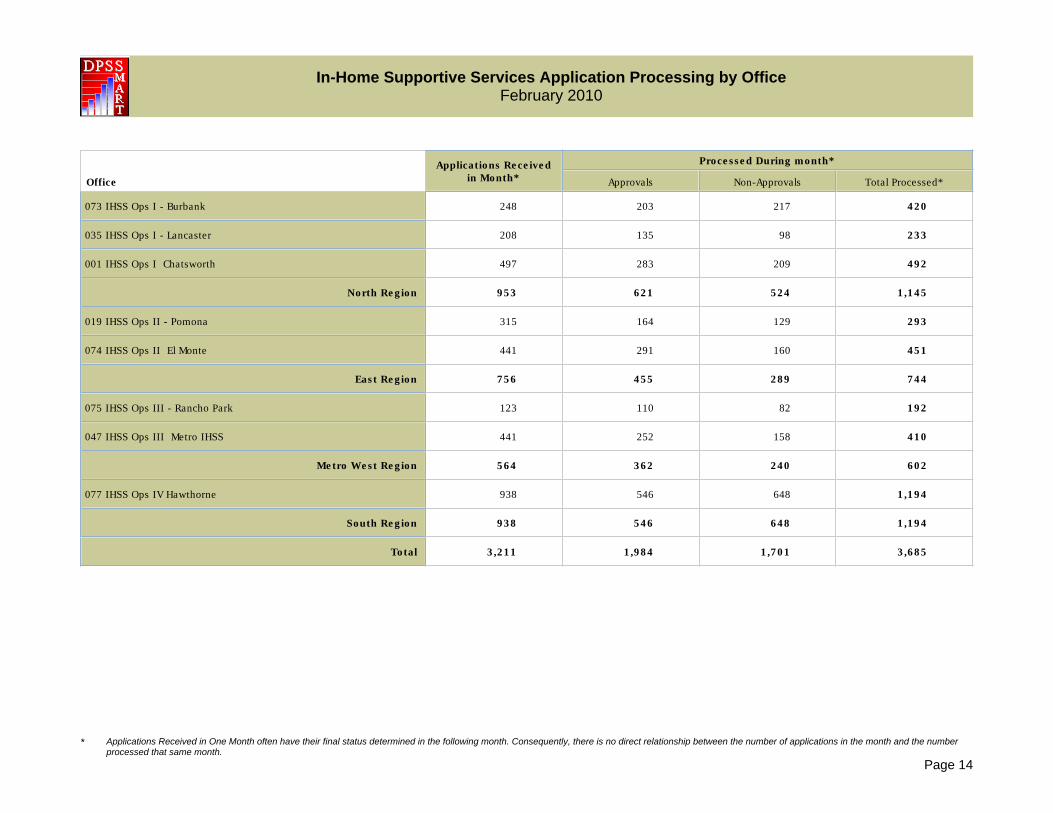
In-Home Supportive Services Application Processing by OfficeFebruary 2010
Office
Applications Received in Month*
Processed During month*
Approvals Non-Approvals Total Processed*
073 IHSS Ops I - Burbank 248 203 217 420
035 IHSS Ops I - Lancaster 208 135 98 233
001 IHSS Ops I Chatsworth 497 283 209 492
North Region 953 621 524 1,145
019 IHSS Ops II - Pomona 315 164 129 293
074 IHSS Ops II El Monte 441 291 160 451
East Region 756 455 289 744
075 IHSS Ops III - Rancho Park 123 110 82 192
047 IHSS Ops III Metro IHSS 441 252 158 410
Metro West Region 564 362 240 602
077 IHSS Ops IV Hawthorne 938 546 648 1,194
South Region 938 546 648 1,194
Total 3,211 1,984 1,701 3,685
* Applications Received in One Month often have their final status determined in the following month. Consequently, there is no direct relationship between the number of applications in the month and the number processed that same month.
Page 14

Cash Aid ProgramsTerminations by District
February 2010
District*
CalWORKs General Relief Refugee CAPI
Total Two Parent** Zero Parent*** All Other**** Total Employable Unemployable 014 Civic Center 778 260 518
011 East Valley Main District 646 88 217 341002 Glendale 422 110 67 245 468 225 243 142034 Lancaster Main District 1,015 157 162 696 749 454 295038 Metro North 513 66 188 259 21203 Pasadena, San Fernando 205 22 35 148 1,092 510 582060 Rancho Park 390 47 78 265 865 426 439082 West Valley District 489 66 139 284010 Wilshire 484 216 268 60
Division I 3,680 556 886 2,238 4,436 2,091 2,345 163 60 005 Belvedere 241 32 73 136
006 Cudahy 623 88 194 341012 Exposition Park 676 50 115 511017 Florence 484 43 195 246066 Lincoln Heights 315 32 84 199015 Metro East 531 64 191 276 1,138 680 458013 Metro Family 578 52 226 300 1070 Metro Special 1,742 806 936
Division II 3,448 361 1,078 2,009 2,880 1,486 1,394 1 026 Compton 865 97 224 544
040 Norwalk 457 63 83 311062 Paramount 499 62 110 327027 South Central 703 61 147 495 596 340 256031 South Family 728 77 191 460 4007 South Special 2,869 1,457 1,412083 Southwest Family 978 87 213 678 1008 Southwest Special 1 1 2,150 1,061 1,089
Division III 4,231 447 968 2,816 5,615 2,858 2,757 5 004 El Monte 360 47 112 201
036 Pomona 818 109 194 515 615 357 258020 San Gabriel Valley 369 52 93 224 738 384 354 19
Division IV 1,547 208 399 940 1,353 741 612 19
Total 12,906 1,572 3,331 8,003 14,284 7,176 7,108 188 60
* Numbers for these offices include both the Main and Branch offices.** This Category includes families that have two aided, GAIN Sanctioned or time-limited, non-disabled parents with at least one child in common.*** All parents/adults in these families are excluded or ineligible to aid for reasons other than GAIN sanction or time limits.**** This category includes all other families not included in the first two.
Page 15

Supplemental ProgramsTerminations by District
February 2010
District*
Medical Assistance
Only
Food Stamps Total All Aids**Cash Aid and Supplemental
ProgramsTotal PAFS NAFS
014 Civic Center 52 558 558 1,388011 East Valley Main District 468 1,358 262 1,096 2,472002 Glendale 508 1,326 174 1,152 2,866034 Lancaster Main District 489 2,128 327 1,801 4,381038 Metro North 168 556 173 383 1,258090 Northridge Regional Medi-Cal District 1,041 1,041203 Pasadena, San Fernando 219 1,173 77 1,096 2,689060 Rancho Park 360 1,277 142 1,135 2,892082 West Valley District 838 1,232 195 1,037 2,559010 Wilshire 341 916 916 1,801
Division I 4,484 10,524 1,350 9,174 23,347005 Belvedere 936 1,182 96 1,086 2,359006 Cudahy 376 1,001 261 740 2,000012 Exposition Park 64 631 225 406 1,371017 Florence 308 734 168 566 1,526066 Lincoln Heights 43 305 130 175 663089 Medi-Cal Mail-In Application Center 10 10016 Medi Cal Outreach East 1,858 1,858042 Medi Cal Outreach West 245 245015 Metro East 30 1,125 193 932 2,824013 Metro Family 469 958 231 727 2,006070 Metro Special 747 2,476 2,476 4,965
Division II 5,086 8,412 1,304 7,108 19,827026 Compton 554 1,430 328 1,102 2,849092 Hawthorne Medi-Cal District 890 1 1 891040 Norwalk 655 796 155 641 1,908062 Paramount 364 920 182 738 1,783027 South Central 184 1,352 220 1,132 2,835031 South Family 459 1,418 255 1,163 2,609007 South Special 1,687 1,687 4,556083 Southwest Family 74 840 363 477 1,893008 Southwest Special 788 2,412 2,412 5,351
Division III 3,968 10,856 1,503 9,353 24,675004 El Monte 677 741 114 627 1,778080 Medi-Cal Long Term District 449 449036 Pomona 705 1,880 329 1,551 4,018020 San Gabriel Valley 418 1,184 140 1,044 2,728
Division IV 2,249 3,805 583 3,222 8,973DPSS Total 15,787 33,597 4,740 28,857 79,367
Department of Health Services 34 34Department of Children and Family Services 62 62
Grand Total 15,883 33,597 4,740 28,857 79,463
* Numbers for Main Districts include both Main and Branch offices.** DPSS Total and Grand Total counts for Total All Aids include IHSS caseload found on page 7.
Page 16

Persons Aided - All Aids CombinedJanuary 2001 to February 2010
1,000
1,300
1,600
1,900
2,200
2,500
Thou
san
ds
2001 2002 2003 2004 2005 2006 2007 2008 2009 2010
January 1,772,223 1,974,284 2,176,029 2,125,174 2,157,416 2,159,561 2,125,532 2,120,743 2,174,614 2,303,749
February 1,774,694 2,004,216 2,185,622 2,121,033 2,155,158 2,151,993 2,121,183 2,121,664 2,180,687 2,306,162
March 1,777,189 2,033,305 2,205,706 2,126,252 2,160,504 2,156,830 2,118,608 2,126,084 2,195,497
April 1,801,891 2,053,985 2,220,340 2,120,822 2,143,971 2,146,245 2,112,631 2,129,358 2,206,577
May 1,820,217 2,077,231 2,227,731 2,107,699 2,164,290 2,143,301 2,113,264 2,131,845 2,216,924
June 1,846,217 1,928,402 2,202,094 2,131,565 2,170,799 2,144,293 2,111,673 2,135,562 2,232,040
July 1,871,520 1,977,951 2,205,980 2,102,765 2,165,355 2,138,980 2,112,568 2,139,790 2,249,143
August 1,890,253 2,005,337 2,203,801 2,127,918 2,184,371 2,140,548 2,116,434 2,138,281 2,256,283
September 1,911,380 2,018,573 2,165,470 2,137,604 2,182,116 2,137,037 2,113,352 2,144,760 2,271,473
October 1,947,269 2,134,995 2,154,853 2,151,665 2,174,983 2,129,048 2,118,831 2,155,204 2,283,036
November 1,975,315 2,153,486 2,142,473 2,156,602 2,164,674 2,132,091 2,119,663 2,154,415 2,287,582
December 2,002,498 2,166,367 2,128,450 2,152,193 2,170,366 2,130,380 2,118,174 2,167,776 2,302,924
Page A

Persons Aided - CalWORKsJanuary 2001 to February 2010
150
300
450
600
750
900
Thou
san
ds
2001 2002 2003 2004 2005 2006 2007 2008 2009 2010
January 493,919 520,000 462,610 430,391 414,741 393,222 361,495 350,311 370,631 413,178
February 546,415 521,144 459,815 430,449 411,996 389,308 357,170 349,868 373,398 412,969
March 538,982 514,243 453,464 431,113 411,982 388,639 355,533 349,622 378,222
April 537,586 509,779 450,140 430,219 409,394 384,683 354,031 350,448 382,959
May 524,665 504,467 448,322 426,729 405,720 382,422 353,662 350,578 385,883
June 530,180 499,743 445,039 426,184 405,630 381,675 353,094 350,570 389,509
July 519,300 488,909 438,361 424,338 403,975 378,299 351,664 352,835 392,490
August 523,951 487,753 443,245 422,880 403,067 375,389 352,669 355,100 395,902
September 521,095 480,849 441,248 421,714 397,342 374,190 351,816 357,008 400,534
October 520,694 474,026 434,549 419,500 396,161 372,159 352,014 361,378 406,371
November 524,578 474,233 433,899 417,371 392,509 368,084 355,989 362,652 406,992
December 525,443 469,554 428,578 418,660 388,447 365,841 349,574 367,163 411,842
Page B

Persons Aided - General ReliefJanuary 2001 to February 2010
20
40
60
80
100
120
Thou
san
ds
2001 2002 2003 2004 2005 2006 2007 2008 2009 2010
January 60,976 68,221 64,625 63,771 66,742 66,552 57,776 63,189 75,764 93,105
February 60,841 67,840 63,928 63,932 65,248 64,682 57,034 62,466 75,029 91,999
March 60,705 68,102 65,236 66,224 65,932 67,390 58,470 64,302 78,145
April 62,038 68,810 65,607 66,545 65,309 63,895 58,365 64,974 80,052
May 64,352 68,705 65,176 65,112 64,467 61,660 59,065 66,227 80,623
June 63,649 66,472 65,057 65,352 64,652 60,895 60,014 67,488 82,524
July 63,929 66,793 65,667 66,386 64,349 60,187 60,786 69,193 85,223
August 64,752 66,648 65,203 67,178 65,091 60,321 61,715 70,260 85,953
September 64,078 64,507 64,984 67,760 65,397 59,683 60,678 71,387 88,079
October 66,192 63,977 63,874 66,270 65,069 57,321 60,403 69,738 89,627
November 66,931 63,211 61,969 66,013 64,484 57,487 61,178 71,942 89,813
December 67,207 63,215 63,717 66,330 62,421 57,145 61,406 74,143 92,103
NOTE: Includes refugees on GR.Page C

Persons Aided - RefugeeJanuary 2001 to February 2010
0
350
700
1,050
1,400
1,750
2001 2002 2003 2004 2005 2006 2007 2008 2009 2010
January 773 1,044 663 524 399 414 992 1,292 1,410 1,380
February 780 963 667 536 409 418 1,005 1,326 1,542 1,323
March 829 891 659 500 437 429 993 1,347 1,630
April 732 771 610 494 453 401 904 1,372 1,677
May 965 676 537 452 433 379 839 1,241 1,622
June 933 679 494 457 440 395 852 1,253 1,669
July 1,007 626 475 440 445 444 817 1,232 1,746
August 1,112 705 515 422 441 491 853 1,269 1,793
September 1,212 615 547 394 432 605 885 1,319 1,786
October 1,232 590 499 399 422 642 1,029 1,407 1,706
November 1,221 594 491 381 420 848 1,132 1,387 1,554
December 1,147 619 492 388 404 966 1,267 1,446 1,502
NOTE: 1. Person counts exclude refugees who time-expired from RRP/CalWORKs and RCA programs.Page D

Persons Aided - CAPI*January 2001 to February 2010
0
1,500
3,000
4,500
6,000
7,500
2001 2002 2003 2004 2005 2006 2007 2008 2009 2010
January 5,859 5,666 3,969 2,909 2,775 2,793 2,976 4,220 4,895 3,485
February 5,878 5,597 3,846 2,874 2,758 2,780 3,089 4,323 4,771 3,509
March 6,001 5,108 3,750 2,924 2,768 2,836 3,175 4,451 4,671
April 5,974 5,678 3,629 2,898 2,705 2,868 3,284 4,553 4,141
May 5,949 5,635 3,542 2,907 2,696 2,839 3,381 4,695 3,779
June 5,750 5,474 3,491 2,848 2,697 2,832 3,520 4,815 3,550
July 5,681 5,317 3,379 2,859 2,681 2,792 3,607 4,957 3,500
August 5,768 5,169 3,493 2,850 2,687 2,825 3,763 5,082 3,479
September 5,657 4,867 3,221 2,839 2,694 2,873 3,886 5,194 3,449
October 5,546 4,582 3,124 2,835 2,712 2,907 3,981 5,318 3,483
November 5,583 4,304 2,926 2,820 2,722 2,926 4,082 5,274 3,468
December 5,583 4,121 2,910 2,802 2,732 2,935 4,133 5,140 3,480
*Cash Assistance Program for ImmigrantsPage E

Persons Aided - Medical Assistance OnlyJanuary 2001 to February 2010
300
600
900
1,200
1,500
1,800
Thou
san
ds
2001 2002 2003 2004 2005 2006 2007 2008 2009 2010
January 906,938 1,166,682 1,406,522 1,353,228 1,358,470 1,610,580 1,610,495 1,601,826 1,608,284 1,652,545
February 921,546 1,195,551 1,413,691 1,344,771 1,362,025 1,609,912 1,611,324 1,604,958 1,609,965 1,656,625
March 945,297 1,224,869 1,433,380 1,336,927 1,361,840 1,612,873 1,606,981 1,605,420 1,612,871
April 968,075 1,244,420 1,445,267 1,329,514 1,346,964 1,608,581 1,603,501 1,607,132 1,615,916
May 990,852 1,271,226 1,452,265 1,319,549 1,376,740 1,610,182 1,604,117 1,607,865 1,621,134
June 1,011,611 1,132,120 1,427,276 1,350,166 1,380,861 1,611,201 1,601,343 1,609,248 1,627,826
July 1,040,397 1,181,503 1,436,246 1,308,380 1,373,812 1,611,515 1,602,534 1,607,295 1,637,703
August 1,054,721 1,209,942 1,423,220 1,328,548 1,392,970 1,615,820 1,603,846 1,602,051 1,639,215
September 1,070,178 1,234,504 1,390,581 1,339,599 1,395,267 1,612,472 1,600,003 1,603,149 1,643,871
October 1,099,190 1,358,891 1,382,429 1,356,053 1,387,259 1,607,194 1,603,238 1,607,896 1,646,630
November 1,119,379 1,374,175 1,367,723 1,361,372 1,380,600 1,612,304 1,604,229 1,603,186 1,648,758
December 1,142,324 1,389,420 1,361,270 1,351,417 1,389,196 1,612,219 1,602,354 1,607,228 1,655,341
NOTE: Effective January 2006, includes MAO-eligible persons associated with CalWORKs cases. Page F
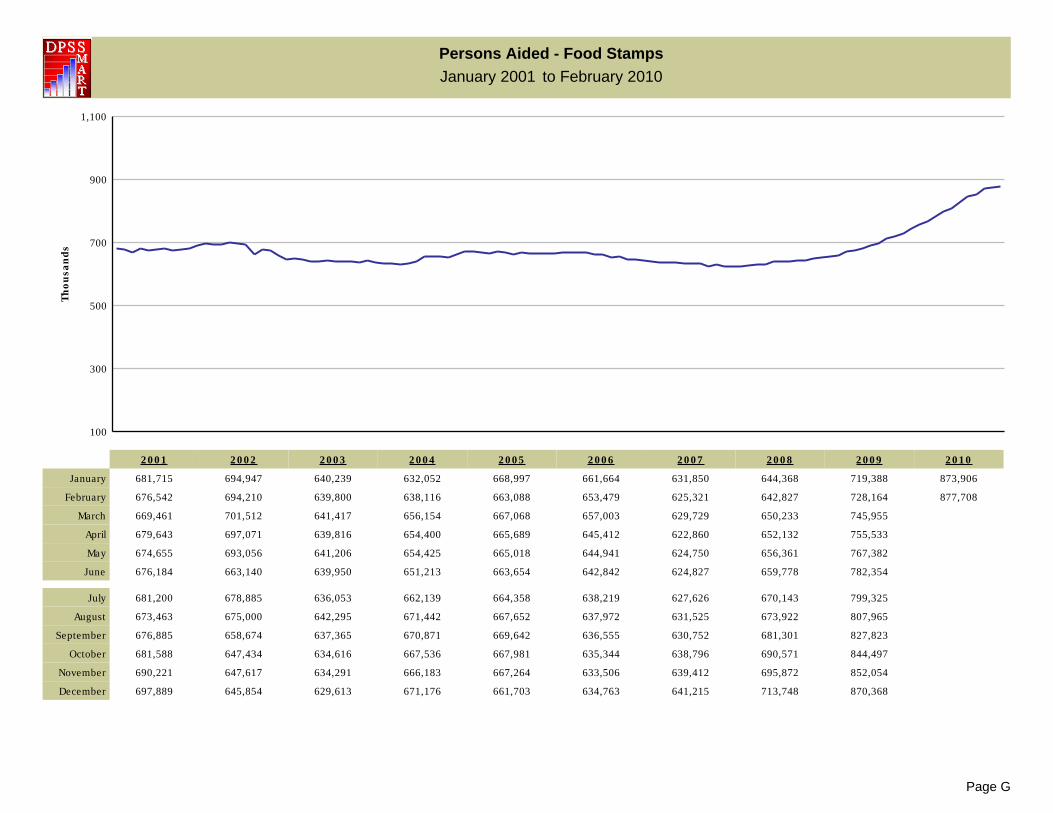
Persons Aided - Food StampsJanuary 2001 to February 2010
100
300
500
700
900
1,100
Thou
san
ds
2001 2002 2003 2004 2005 2006 2007 2008 2009 2010
January 681,715 694,947 640,239 632,052 668,997 661,664 631,850 644,368 719,388 873,906
February 676,542 694,210 639,800 638,116 663,088 653,479 625,321 642,827 728,164 877,708
March 669,461 701,512 641,417 656,154 667,068 657,003 629,729 650,233 745,955
April 679,643 697,071 639,816 654,400 665,689 645,412 622,860 652,132 755,533
May 674,655 693,056 641,206 654,425 665,018 644,941 624,750 656,361 767,382
June 676,184 663,140 639,950 651,213 663,654 642,842 624,827 659,778 782,354
July 681,200 678,885 636,053 662,139 664,358 638,219 627,626 670,143 799,325
August 673,463 675,000 642,295 671,442 667,652 637,972 631,525 673,922 807,965
September 676,885 658,674 637,365 670,871 669,642 636,555 630,752 681,301 827,823
October 681,588 647,434 634,616 667,536 667,981 635,344 638,796 690,571 844,497
November 690,221 647,617 634,291 666,183 667,264 633,506 639,412 695,872 852,054
December 697,889 645,854 629,613 671,176 661,703 634,763 641,215 713,748 870,368
Page G
Persons Aided - IHSS*January 2001 to February 2010
80
95
110
125
140
155
170
185
200
Thou
san
ds
2001 2002 2003 2004 2005 2006 2007 2008 2009 2010
January 105,307 115,535 125,748 136,099 143,843 150,951 159,380 169,007 180,031 184,647
February 105,826 116,467 126,475 136,623 144,121 151,155 159,934 169,661 180,902 184,518
March 106,752 117,375 127,353 137,584 145,001 152,069 160,674 170,549 181,653
April 107,519 118,153 128,377 138,187 145,555 152,839 161,279 171,536 182,586
May 108,548 119,074 129,287 138,693 146,258 153,636 161,924 172,598 183,260
June 109,605 119,690 130,071 139,390 146,935 154,271 162,916 173,477 184,191
July 110,605 120,493 131,098 139,961 147,626 154,562 163,733 174,418 184,839
August 111,521 121,400 132,040 140,557 148,334 155,222 164,779 175,382 185,212
September 112,339 122,514 133,043 141,288 149,061 156,445 165,780 176,485 185,542
October 113,470 123,339 134,269 142,138 149,837 157,368 166,712 177,662 185,452
November 114,656 124,272 135,039 142,883 150,563 158,463 167,677 178,576 185,538
December 115,145 125,180 135,859 143,465 150,963 159,250 168,477 179,608 185,276
*In-Home Supportive ServicesPage H

Unemployment Rate - Los Angeles CountyJanuary 2001 to February 2010
2
4
6
8
10
Thou
san
ds
2001 2002 2003 2004 2005 2006 2007 2008 2009 2010
January 5.40 6.80 6.60 6.50 6.30 5.50 4.90 6.00 10.80 13.20
February 4.70 6.50 6.50 6.10 6.10 5.50 4.70 5.50 11.00 12.30
March 4.70 6.70 6.30 6.10 5.60 4.80 4.90 5.80 11.30
April 4.80 6.70 6.30 6.20 5.40 4.50 4.70 5.70 10.70
May 4.80 6.60 6.30 6.20 5.50 4.90 4.40 6.40 11.30
June 5.50 7.10 6.90 6.70 5.60 4.70 4.90 7.10 11.40
July 6.20 7.50 7.50 6.90 5.70 5.10 5.40 8.10 12.50
August 6.10 6.80 7.00 6.20 4.70 5.10 5.20 8.20 12.60
September 5.80 6.70 6.80 6.20 4.50 4.80 5.20 7.80 12.70
October 5.90 6.10 6.80 5.50 4.40 4.20 5.00 8.20 12.60
November 5.90 5.80 6.50 5.90 4.90 4.00 5.20 8.70 12.20
December 5.70 5.80 6.10 5.70 5.10 4.20 5.20 9.50 12.00
NOTE: Data is not seasonally adjusted.Page I
Glossary
Department of Public Social Services (DPSS) administers programs that provide services to individuals and families in need. These programs are designed to both alleviate hardship and promote family health, personal responsibility, and economic independence. Most DPSS programs are mandated by federal and State laws.
California Work Opportunity and Responsibility to Kids (CalWORKs) provides temporary financial assistance and employment-focused services to families with minor children who may or may not have income, and their property limit is below State maximum limits for their family size. In addition, the family must meet one of the following deprivations:
● Either parent is deceased;● Either parent is physically or mentally incapacitated; ● The principal wage earner is unemployed; and ● Either parent is absent from the home in which the child is living.
Types of Assistance Units include: ● Two Parent Families - include two non-disabled or unemployed, natural or
adoptive parents of the same aided or SSI/SSP minor child (living in the home), unless both parents are minors and neither is the head-of-household.
● Zero Parent Families - are those in which the parent(s) or caretaker(s) are excluded from or ineligible for aid.
● All Other Families - are those that have not been identified as either a two parent or a zero parent family.
● Safety Net Cases - are those families in which all adults have been discontinued and removed from the assistance unit for reaching the CalWORKs 60-month time limit.
● TANF Timed-Out - are those families that include an adult head-of-household or a spouse of a head-of-household, (including minors that are head-of-household) who have received Federal TANF assistance for a total of 60 cumulative months.
Cash Assistance Program to Immigrants (CAPI) provides cash to certain aged, blind, or disabled legal non-citizens ineligible for Supplemental Security Income/State Supplemental Payment (SSI/SSP) due to their immigration status. CAPI participants may be eligible for Medi-Cal, In-Home Supportive Services (IHSS), and/or Food Stamp benefits. Individuals requesting such benefits must file the appropriate application for the other program.
Page i

The Food Stamp Program helps eligible low-income families and individuals meet their basic nutritional needs by increasing their food purchasing power. Individuals residing in room and board arrangements, homeless individuals in shelters, and temporary residents of a shelter for battered women and children, may also be eligible to receive Food Stamps.
General Relief (GR) is a County-funded program that provides cash aid to indigent adults who are ineligible for Federal or State programs.
In-Home Supportive Services (IHSS) enables low-income aged, blind and disabled individuals to remain safely at home by paying caregivers to provide personal care and domestic and related services.
LEADER is the Los Angeles Eligibility, Automated Determination, Evaluation and Reporting System.
Medical Assistance Only (MAO) provides comprehensive medical benefits to low-income families with children, pregnant women, and adults who are over 65, blind, or disabled. Once an individual or family is found to be within the property (resources) limits, income will then help to determine the category of Medi-Cal eligibility, as well as whether there is a share-of-cost or no share-of-cost. CalWORKs families receive no-cost Medi-Cal.
Refugee Resettlement Program (RRP) is made up of many program partners at the federal, state, county, and community levels. Typically, refugees are eligible for the same assistance programs as citizens including CalWORKs, Food Stamps, Medi-Cal, SSI/SSP, and General Relief. In addition, single adults or couples without children who are not eligible for other welfare assistance may receive Refugee Cash Assistance (RCA). Vital to the success of the California Refugee Program are the contributions made by Mutual Assistance Associations, and Community Based Organizations (CBOs) that provide culturally and liguistically appropriate services.
Page ii


