

Credit Suisse First Boston2003 Asian Investment Conference
Stuart Grimshaw
Chief Financial Officer
25-28 March 2003
www.commbank.com.au
2
The material that follows is a presentation of general background information about the Bank’s activities current at the date of the presentation, 25 March 2003. It is information given in summary form and does not purport to be complete. It is not intended to be relied upon as advice to investors or potential investors and does not take into account the investment objectives, financial situation or needs of any particular investor. These should be considered, with or without professional advice when deciding if an investment is appropriate.
Disclaimer

3
Speaker’s Notes
Speaker’s notes for this presentation are attached below each slide.
To access them, you may need to save the slides in PowerPoint and view/print in “notes view.”

4
Agenda
Commonwealth Bank in the Current Context
Platforms for Growth
Productivity

Commonwealth Bank in the Current Context

6
Australia’s Economy has been relatively resilient given global conditions
Source: Commonwealth Research
-10
0
10
20
30
Jul-97 Jul-98 Jul-99 Jul-00 Jul-01 Jul-02
-10
0
10
20
30
% %
Housing
Business
Otherpersonal
CREDIT: 3 Month-ended Annual Rates
-3 0 3 6 9
% change
ECONOMIC GROWTH: 2002
ChinaSouth KoreaThailandNew ZealandAustraliaIndonesiaTaiwanCanadaUnited StatesSingaporeHong KongSpainSwedenUnited KingdomNorwayFranceBelgiumItalyGermany
Netherlands
SwitzerlandJapan
7
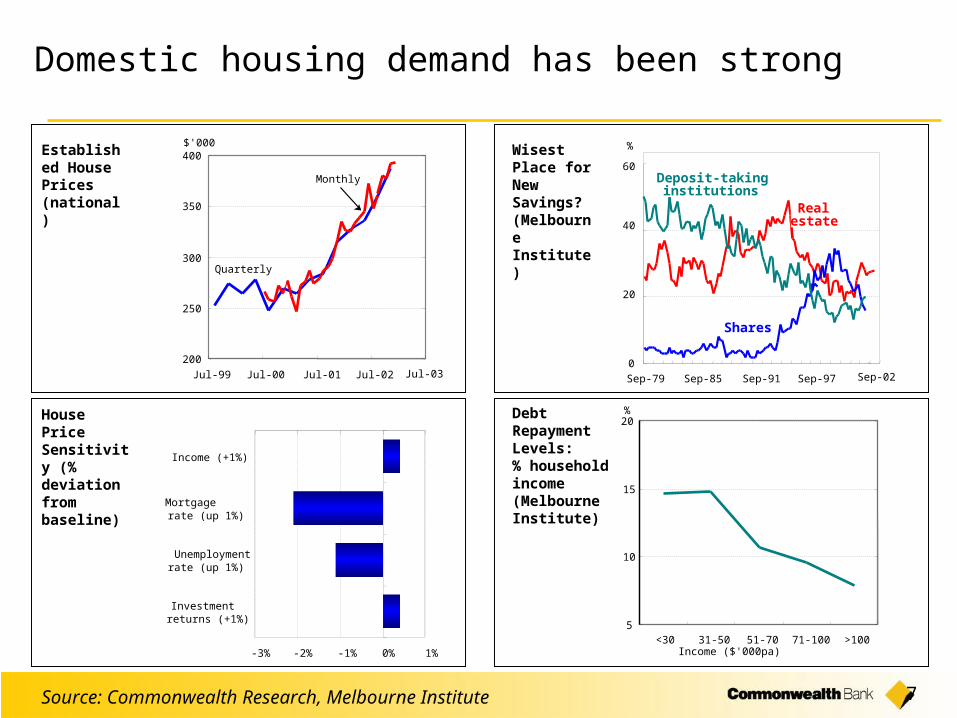
Domestic housing demand has been strong
Source: Commonwealth Research, Melbourne Institute
-3% -2% -1% 0% 1%
Income (+1%)
Mortgage rate (up 1%)
Unemploymentrate (up 1%)
Investmentreturns (+1%)
House Price Sensitivity (% deviation from baseline)
Income ($'000pa)
5
10
15
20
<30 31-50 51-70 71-100 >100
%Debt Repayment Levels: % household income(Melbourne Institute)
0
20
40
60
Sep-79 Sep-85 Sep-91 Sep-97
Deposit-takinginstitutions
Realestate
Shares
%Wisest Place for New Savings? (Melbourne Institute)
Sep-02
200
250
300
350
400
Jul-99 Jul-00 Jul-01 Jul-02
Quarterly
Monthly
$'000Established House Prices (national)
Jul-03
8
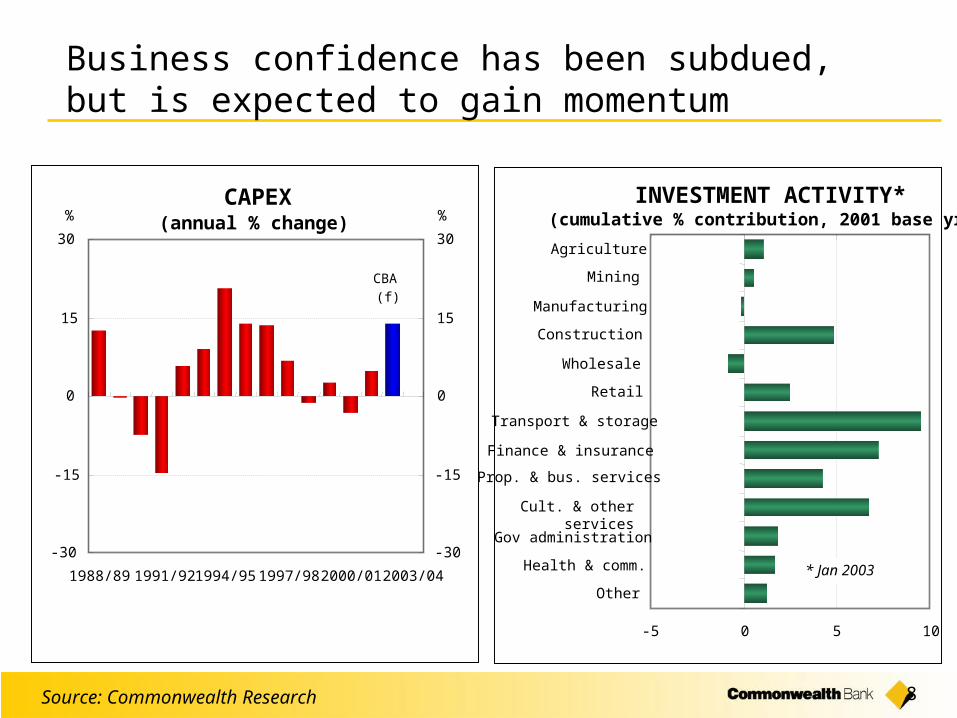
Business confidence has been subdued, but is expected to gain momentum
Source: Commonwealth Research
CAPEX(annual % change)
-30
-15
0
15
30
1988/89 1991/92 1994/95 1997/98 2000/01 2003/04
-30
-15
0
15
30
% %
CBA (f)
INVESTMENT ACTIVITY*(cumulative % contribution, 2001 base yr)
-5 0 5 10
Agriculture
Mining
Manufacturing
Construction
Wholesale
Retail
Transport & storage
Finance & insurance
Prop. & bus. services
Cult. & other services
Gov administration
Health & comm.
Other
* Jan 2003

9
0
1000
2000
3000
4000
5000
6000
7000
Jun-02 Sep-02 Dec-02Industry Commonwealth Bank
While equity markets have showed some resilience, returns and fund flows have declined
$m
Total Net Retail Fund Flows(for quarter ended)
Source: Plan for Life (ex Cash)
-74%
Equity Markets
Source: Bloomberg
75
80
85
90
95
100
105
Jul-02 Sep-02 Nov-02 Jan-03
-12.5%
-16.1%
All Ordinaries MSCI World
Index (Base 100)

10
Commonwealth Bank’s 1st Half result reflects modest growth in an uncertain environment
Net Profit After Tax (cash basis)*
Comprising: Banking Funds Management Life Insurance
Dec 2002
$1,208m
$1,079m$135m($6m)
Dec 2001
$1,192m
% Change
1%
* ie excluding appraisal value uplift/reduction and goodwill amortisation. Unless otherwise stated the numbers in this presentation refer to the net profit after tax (cash basis) and all comparisons are to the prior comparative period.
$1,092m$186m
$31m
11%(26%)
(117%)

11
4%
5%
6%
7%
8%
9%
10%
11%
Dec 2001 Jun 2002 Dec 2002
0.007
0.008
0.009
0.01
0.011
0.012
Mar-00
Sep-00
Mar-01
Sep-01
Mar-02
Sep-02
0
0.002
0.004
0.006
0.008
0.01
Mar-00
Sep-00
Mar-01
Sep-01
Mar-02
Sep-02
CBA ANZ NAB WBC
The Bank’s credit quality and capital adequacy strengthened during the half
Tier 1 Capital Tier 2 Capital Target Range
9.31%9.80% 9.81%
6.75% 6.78% 7.06%
Capital Adequacy RatiosBad Debt Expense to RWA*
General Provision to RWA
% R
WA
% R
WA
*RWA: risk weighted assets

12
The Bank’s dividend payout ratio remains high relative to peers
Dividends per Share
Dividend Payout Ratio
Dec 2002
69cps
72.7%
95cps
12.39%
52.6%
Dec 2001
68cps
72.6%
94cps
12.43%
54.2%
Change
1c
-
1c
(4bps)
(3%)
Earnings per Share
Return on Equity
Banking Cost to Income Ratio (underlying basis)
…and EPS has improved
For more detail, visit: www.commbank.com.au/shareholder
13
Increasing leveraging from key competitive strengths is important for long term growth
Scale
Brand
Risk Profile
Products and Businesses
Distribution
Innovation
People

Platforms for Growth: Banking
15
%
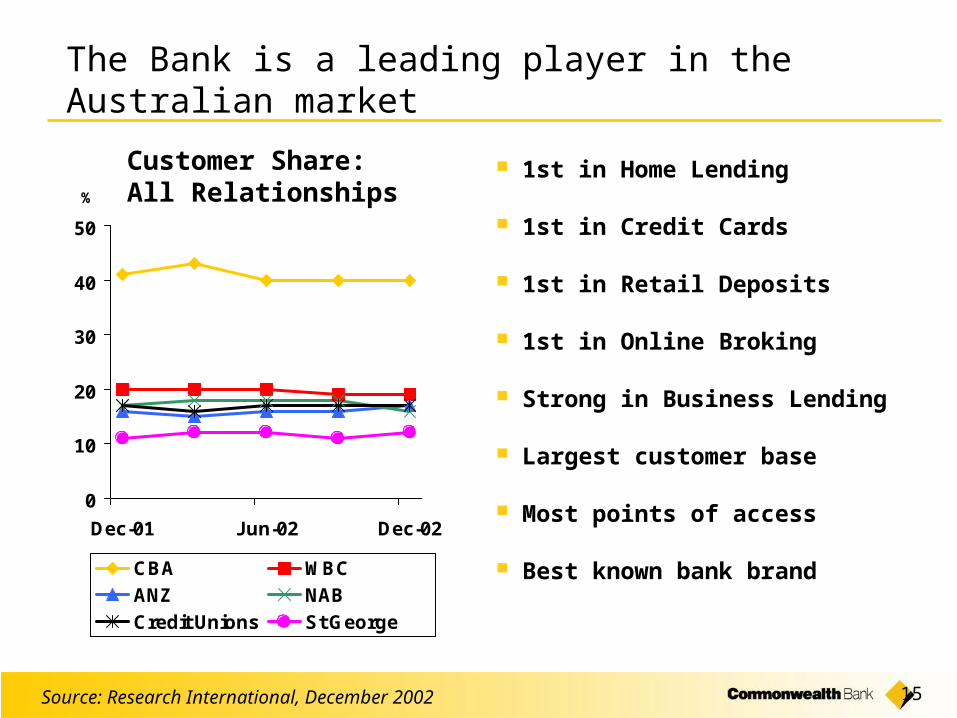
Customer Share: All Relationships
Source: Research International, December 2002
The Bank is a leading player in the Australian market
1st in Home Lending
1st in Credit Cards
1st in Retail Deposits
1st in Online Broking
Strong in Business Lending
Largest customer base
Most points of access
Best known bank brand
0
10
20
30
40
50
Dec-01 Jun-02 Dec-02
CBA WBC
ANZ NAB
Credit Unions St George

16
Several key trends are shaping the future of the home loan market
Economic Environment
• Interest rates at historical lows - but affordability has weakened• Slowing housing credit demand likely• Historically low credit losses• Property sector attractive compared to other asset classes
Customer Need
• Entrenched fast repayment psyche• First home buying activity brought forward by FHOG* - weaker demand likely •Defined service demands• Wealth creation mindset has fuelled investment loan growth but expect to be tempered by economic uncertainty
Distribution
• Mortgage brokers well established - but facing first slowdown in demand • Continued market consolidation likely• Linkages likely to intensify to financial planners - increased competition
Technology
• Broker groups also investing in front end & CRM** solutions • Centralised back end models utilising straight through processing• Intensification in use of CRM type solutions - owned and rented• Increased use of IVR***/web for customer servicing requests and marketing
Competitive Environment
• Mortgage market a high demand sector • Low credit losses - increasing willingness by some market participants to take on risk • Slowing housing credit demand - propensity for increased poaching/ refinancing offers, including increasing commissions to third parties
***IVR: interactive voice recognition
**CRM: customer relationship management*FHOG: First Home Owner’s Grant

17
The Bank’s strategy is to segment, sell, serve & retain
Segments
Acquisition:
First Home Buyers - safety, security& reassurance. Basic product needs (Economiser, Fixed Rates)
Second Home Buyers - trust and security. More flexible product options (Park & Hold, Top ups, Viridian)
Investors - financially astute. Service, advice and greater product flexibility (Viridian AddVantage Line of Credit).
Retention
Builders - flexible repayment structures (100% interest offset). Build their home equity faster
Lifestylers - use loan to fund renovations etc.
Wealth Creators - benefit of diversification and funds to build assets
Customer Value Proposition
Choice of market leading products that build wealth
backed by superior service at all points of the
relationship
Customer Management Model
Service. Products and services at each stage in customer life cycle tailored to need.
Efficient and accurate straight through end to end processing, fast approvals and turnaround.
Retention via sophisticated event based marketing and communication based on life cycle needs.
Acquisition via multi branded strategy across channels using targeted offers to drive volume & profitability
Customer Service Proposition
Consistent expedited end to end dealings with choice of channel. Products to meet
customers risk and lifestyle needs
Point of Service Differentiation
Ability to provide a life cycle of wealth building products underpinned by accurate, efficient and low cost processing

18
Share of wallet improving - cross-sell, retention and service initiatives are in train
Basis: If a customer has a relationship (as a main Financial Institution or otherwise) with an Financial Institution, what proportion of their holdings do they keep with that Financial Institution?
Share of Wallet by Financial Institution
Source: Research International, December 2002
4639 39
4738
3036 35
45 42 42 42 40 37 36 34
0
20
40
60
80
100
St GeorgeGroup
CBA Group NAB Group Suncorp WBC Group ING/MercMutual
ANZ Group Bendigo
%
2001
2002
19
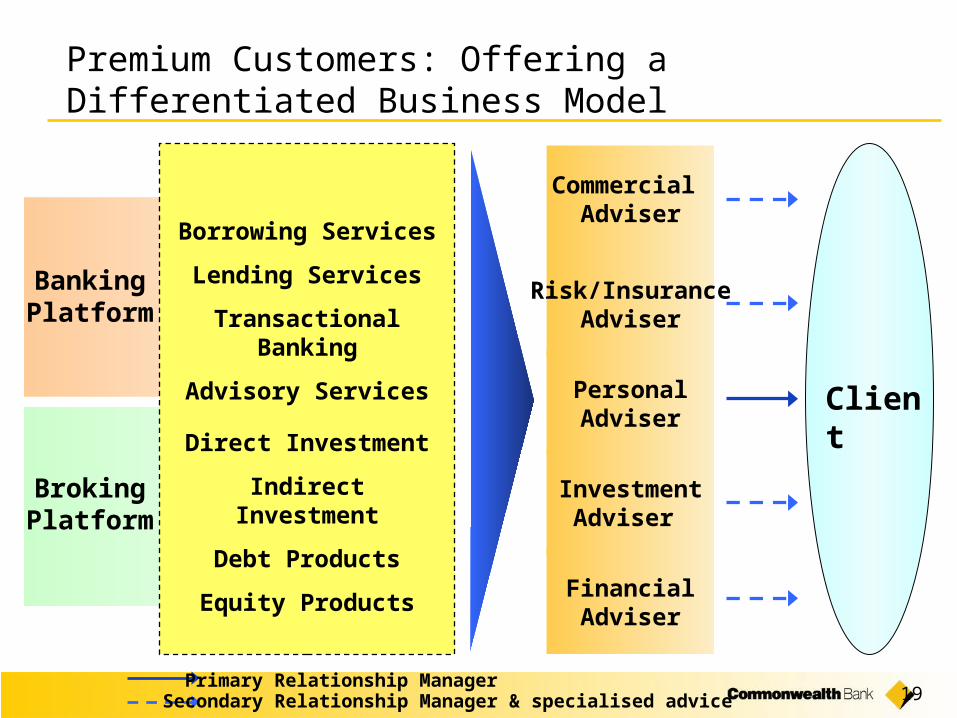
Premium Customers: Offering a Differentiated Business Model
BankingPlatform
BrokingPlatform
Borrowing Services
Lending Services
Transactional Banking
Advisory Services
Direct Investment
Indirect Investment
Debt Products
Equity Products
Commercial Adviser
Personal Adviser
InvestmentAdviser
FinancialAdviser
Risk/InsuranceAdviser
Client
Primary Relationship ManagerSecondary Relationship Manager & specialised advice
20
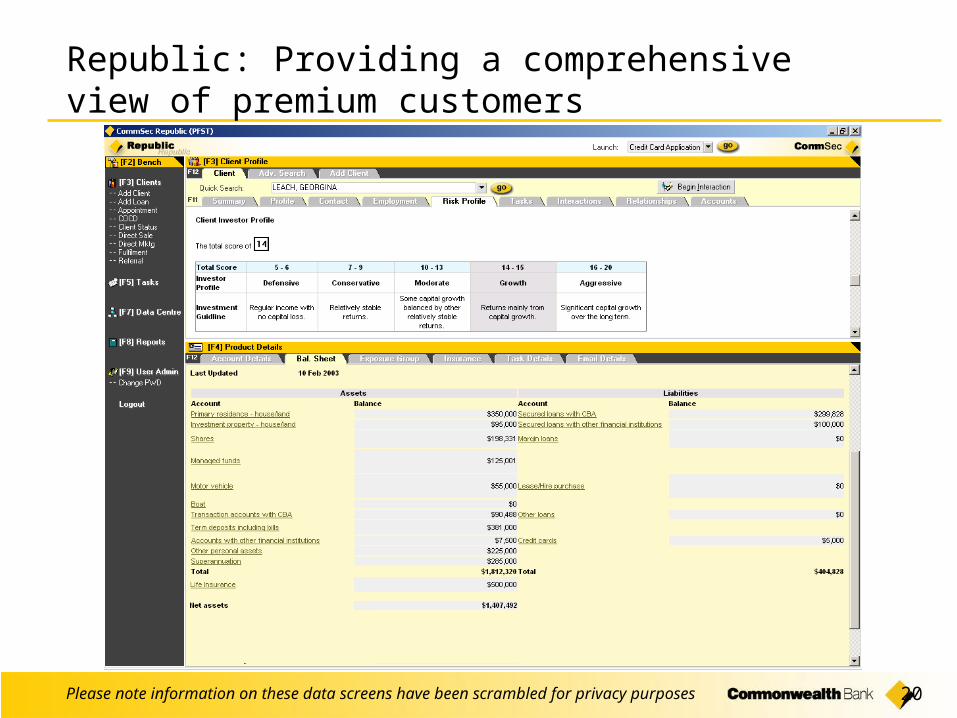
Republic: Providing a comprehensive view of premium customers
Please note information on these data screens have been scrambled for privacy purposes

21
Republic: Providing a comprehensive view of premium customers
Please note information on these data screens have been scrambled for privacy purposes

22
Transforming Business and Corporate Banking
Transformation Agenda Structured In Three Phases
Completed
Status
1. Define and revitalise Business/Corporate Banking
2. Re-organise for success
3. Capture industry leadership
Underway
Parallel implementation with Phase 2
1
2
3
4
5
6
Initiatives
Segment clients and create differentiated business models to improve client service experience
Introduce streamlined credit processes
Lift performance of bottom quartile centres
Better align distribution footprint to client needs
Realise segment specific share targets
Build client service and sales skills

23
No change to credit standards
Owner OccupiedInvestment
$bn
Dec 01 Jun 02 Dec 02
Composition of Housing Portfolio
Consumer Portfolio Commercial Portfolio
Bad debt charge as annualised % of unsecured
lending balances
Bad debt charge as annualised % of secured
lending balances
Dec 01 Jun 02 Dec 02
0
20
40
60
80
100
0.0%
0.4%
0.8%
1.2%
1.6%
2.0%
2.4%
*CBA Equivalent Ratings
29 27 29
15 15 14
36 39 40
171920
0%
20%
40%
60%
80%
100%
AAA/AA* A BBB Other
60%invest.grade

Platforms for Growth: Funds Management
25
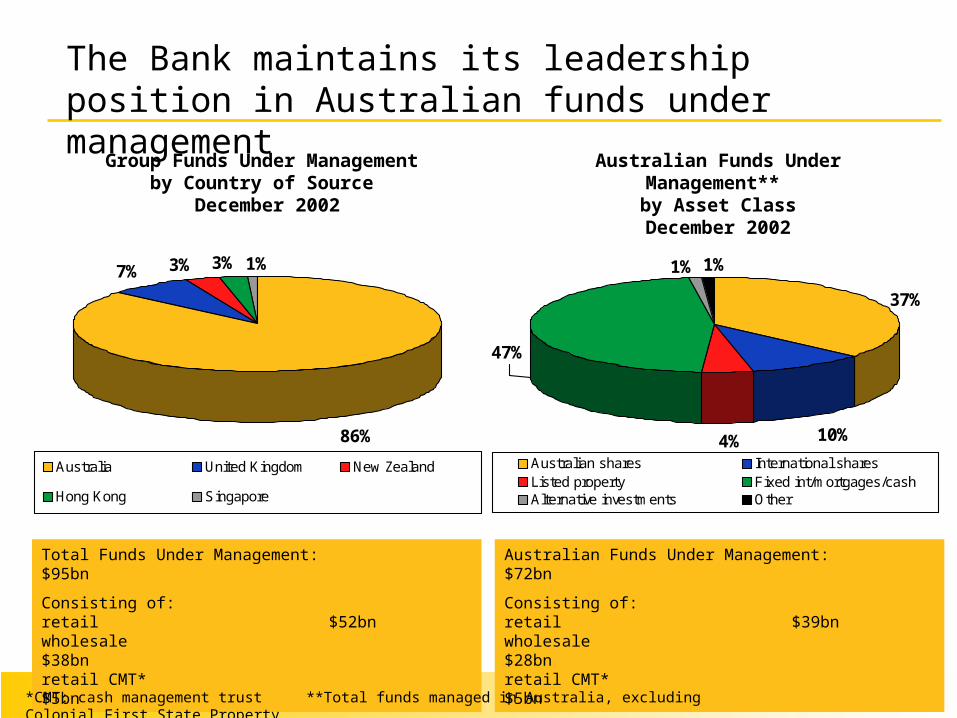
The Bank maintains its leadership position in Australian funds under management
Group Funds Under Management by Country of Source
December 2002
Australian Funds Under Management** by Asset ClassDecember 2002
Total Funds Under Management: $95bn
Consisting of: retail $52bnwholesale $38bnretail CMT* $5bn
Australian Funds Under Management: $72bn
Consisting of: retail $39bnwholesale $28bnretail CMT* $5bn
*CMT: cash management trust **Total funds managed in Australia, excluding Colonial First State Property
86%
7% 3% 3% 1%
Australia United Kingdom New Zealand
Hong Kong Singapore
37%
10%4%
1%
47%
1%
Australian shares International sharesListed property Fixed int/mortgages/cashAlternative investments Other

26
Several key trends are shaping the future of the Australian Funds Management industry
Strong inherent growth in the funds management market expected, particularly retail
Growth of mastertrusts
Industry consolidation
Institutionalisation of distribution
Industry commoditisation
Projected Size of Various Product Segments
Source: Rice Kachor projections March 2002, include 5% post fee returns, except for DIY (7%)
0
50
100
150
200
250
300
350
Self M
anag
ed F
unds
Perso
nal S
uper
Unit T
rust
s
Public
Sec
tor F
unds
Who
lesale
Sav
ings
Mar
ket
Corpo
rate
Sup
er M
aste
r Tru
sts
Indu
stry
Fun
ds
Corpo
rate
Sta
ndalo
ne F
unds
Alloca
ted
Pensio
ns
Annuit
ies
Insu
ranc
e Bon
ds
$ B
illi
on
Value at 30 June 2001
Projected Value at 30 June 2011

27
0
300
600
900
1200
1500
1800
May
-02
Jun-
02
Jul-0
2
Aug-0
2
Sep-0
2
Oct-02
Nov-0
2
Dec-0
2
FirstChoice - Cumulative Flows
FirstChoice has been further enhanced... and other initiatives are underway
$m
• Realise integration benefits, including further rationalisation of legacy systems
• Offer increased style diversification
• Leverage internal distribution opportunities
• Leverage scale to reduce costs
• Grow alternate asset classes
• Increase reputation as manager of international shares
FirstChoice Other Strategic Initiatives

Platforms for Growth: Life Insurance

29
The Bank has a strong presence in life insurance, and a number of opportunities
Source: Tillinghast, December 2002
By Channel
Market Size and Growth Prospects: By Product
$m
2002 2007 projected
2002 2007 projected
Commonwealth Bank Premiums: By Product
By Channel
0
800
1600
2400
3200
4000
4800
Term & Trauma Disability 3rd Party
0
800
1600
2400
3200
4000
4800
Direct Branch 3rd Party
Term & Trauma Disability Group
Direct Branch Other
30
Focus is on distribution, service and risk pricing
Increase internal distribution through PIC’s and BIM’s
Repricing of premiums
Upskilling of call centre staff
Product rationalisation
Systems migration

Productivity

32
Focus is on improving efficiency
...to achieve:
• A better service experience for customers, through greatly improved turnaround times
• Elimination of duplication and inefficiencies
• Annualised benefits of $159m, following an incremental net cost of ~$143m in FY2003
Four productivity initiatives...
Remove back-office functions from branches
Streamline Business Banking processes
Rationalise investment products & systems
Organisational design

Credit Suisse First Boston2003 Asian Investment Conference
Stuart Grimshaw
Chief Financial Officer
25-28 March 2003
www.commbank.com.au

34
9% growth in lending assets
Lending Assets**:
** Excludes securitised housing loan balances $5.9b (Dec 02), $7.0b (Jun 02), $5.7b (Dec 01).
Housing Personal Business & Corporate
$ bi
llion
Bank Acceptances
155 161169
80 86 94
988
55 5554
1213
12
0
50
100
150
200
Dec 2001 Jun 2002 Dec 2002

35
90
92
94
96
98
100
102
104
106
108
Dec-01FUM
Net Flows Investmentreturns
Other Underlying Gandel Winterthur CFS UKPrivate
Business
Dec-02FUM
A number of one offs impacted funds under management
$bn
106
95
98(1)
(5)
(2)
2 (4)
(1)
Underlying reduction of $8bn
One off reduction of net $3bn

36
Risk* GroupUnit Linked
Shareholder Funds in Life Insurance Companies: investment reflect underlying nature of the business
Income
$0.5 billion$2.1 billion
51%49%
Growth
$2.6 billion
74% 26%54% 46%
*Risk includes traditional, investment account, annuities, personal risk and group risk.

37
Dec 2001 Jun 2002 Dec 2002
Charge for Bad & DoubtfulDebts (6 months)
$290m $159m $151m
Charge for Bad & DoubtfulDebts to RWA (annualised)
0.42% 0.23% 0.21%
Gross Impaired Assets (netof interest reserved)
$983m $884m $863m
Specific Provisions $309m $270m $264m
General Provision $1,334m $1,356m $1,327m
General Provision to RWA 0.96% 0.96% 0.92%
Continuing sound asset quality

38
* Includes Colonial
$mill
ion
s
The Bank remains well provisioned
0
300
600
900
1,200
1,500
1,800
2,100
Dec94
Dec95
Dec96
Dec97
Dec98
Dec99
Dec00*
Dec01
Dec02
0
50
100
150
200
250
300
%
General Provision
Specific Provision
Total Provisions/Gross Impaired Assets (axis on right)

39
Arrears in consumer book remain at low levels
Loans Accruing past 90 days or more
30/06/01 31/12/01 30/06/02 31/12/02
$m $m $m $m
Housing Loans 218 168 176 136
Other Loans 90 79 73 75
Total 308 247 249 211
Housing loans arrears rate
30/06/01 31/12/01 30/06/02 31/12/02
Housing Loans accruingbut past 90 days or more $m 218 168 176 136
Housing loan balances $m 73,511 79,745 85,839 93,545
Arrears rate % 0.30% 0.21% 0.21% 0.15%

40
Commercial Portfolio: large exposures are mostly investment grade
Dec 2000
Dec 2001
Dec 2002
Top 20 exposures as a % of Total Committed Exposure
Committed Exposure ($m) 31 December 2002
Top 20 Exposures toCorporates (Committed)
0 200 400 600
BBB
A+
A
AA A
A-
A-
A+
A-
BBB
A+
S&
P R
atin
g o
r E
qu
ival
ent
BBB
A+
A+
BBB
A
BBB
AAA
BBB
A-
AA-
A-
A-
A+
A-
A-
BBB-
BBB
BBB-
A+
A+
0.0%
0.5%
1.0%
1.5%
2.0%
2.5%
3.0%
3.5%
4.0%

41
0
500
1000
1500
2000
2500
3000
3500
4000
AAA to A-
BBB+ to BBB-
BB+ to BB-
<B
Credit Exposure - Energy Sector
80%
7%
3%
10%
Australia (73% investment grade)Asia (94% investment grade)North America (58% investment grade)Other (97% investment grade)$3,411m
278
509
1,981
643
$m

42
0
200
400
600
800
1000
1200
1400
1600
AAA to A-
BBB+ to BBB-
BB+ to BB-
<B
Credit Exposure - Telcos Sector
72%
13%
4%
11%
Australia (72% investment grade)Asia (100% investment grade)North America (100% investment grade)Other (64% investment grade)$1,509m
175
186
738
410
$m

43
0
200
400
600
800
1000
1200
AAA to A-
BBB+ to BBB-
BB+ to BB-
<B
Credit Exposure - Technology Sector
86%
9%
4%
$1,114m
275
35
798
6
$m
Australia (68% investment grade)North America (100% investment grade)Other (99% investment grade)
44
0
1000
2000
3000
4000
5000
6000
7000
8000
9000
AAA to A-
BBB+ to BBB-
BB+ to BB-
<B
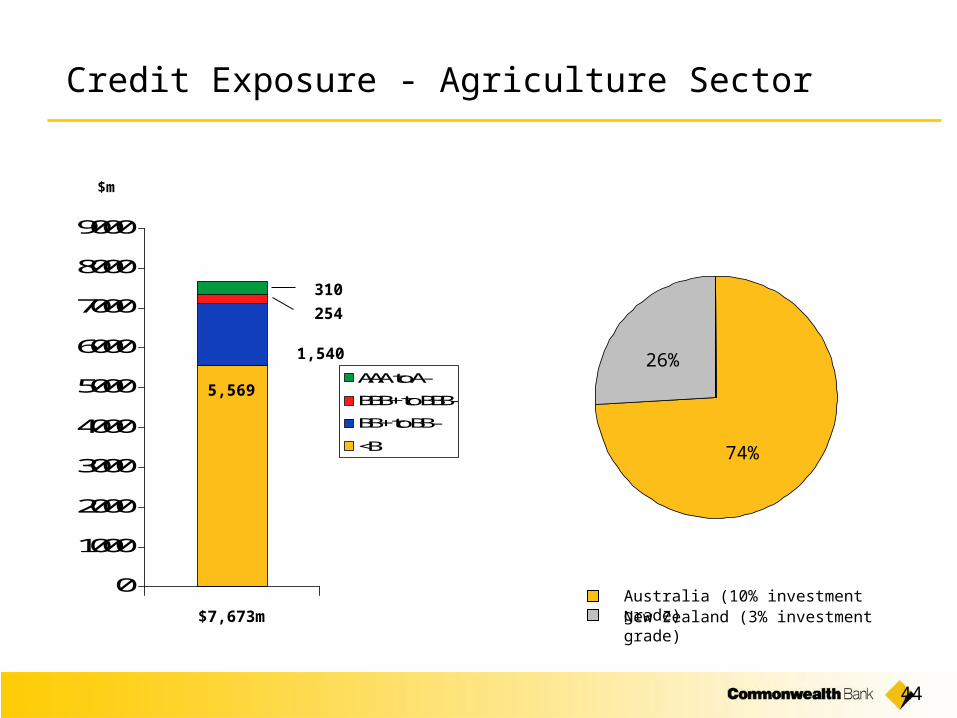
Credit Exposure - Agriculture Sector
74%
26%
$7,673m
1,540
5,569
$m
Australia (10% investment grade)New Zealand (3% investment grade)
254
310

45
Group FUM across asset classes
As at 31 December 2002
Listed & Direct Property
16%
International Equities
13%
Australian Equities
27%
Other1%
Fixed Interest & Cash43%


